Embed Size (px)
Citation preview

Green Infrastructure WorkshopSeptember 27, 2019
Mark Pajot, AdvisorOffice of Climate Change & Energy Management (OCCEM)
Assessing Green Infrastructure Opportunities for Climate Change Resiliency in the Region of Peel
Video: http://www.peelregion.ca/climate-energy/
Yuestas DavidProject Manager, Research and Knowledge ManagementToronto and Region Conservation Authority

Urgent Action Needed
What makes this an emergency*?
• 100 million more people could be driven into poverty by 2030.
• 1.4 billion more people each year will be short of water,
causing unprecedented competition for water, fueling conflict
and migration.
• Rising sea levels and storms will drive hundreds of millions from their homes, with costs of $1tn (£810bn) a year by 2050.
*ADAPT NOW: A GLOBAL CALL FOR LEADERSHIP ON CLIMATE RESILIENCE https://gca.org/global-commission-on-adaptation/report
17% of the population left homeless in Bahama’s following Hurricane Dorian
Unprecedented fires burning in the Russian Arctic
2019 Reasons to be Concerned

Towards A Climate Resilient Region
Sources:1. UN ISDR Sendai Framework for Disaster Risk Reduction (2015) https://www.unisdr.org/we/coordinate/sendai-framework 2. Climate Change Adaptation Indicators Framework for the City of Boston (2015)3. Municipalities and Climate Change: A Framework for Analyzing Local Adaptation Policy. (2014) Paper prepared for the Annual Meeting of the Canadian Political Science
Association Session E1 – Beyond Borders: Local Climate Change Policy and Inter-Local Cooperation Brock University, St. Catharines, Ontario.
Commitment, Capacity and Partnerships Expanded
Climate Risks understood and plan in
place address them
Investments made and
Financial Risks and
Opportunities Disclosed
Public Health Protected Disaster
preparedness and public
support increased
Land use policy adopted to
increase community resiliency
Natural and green
infrastructure protected and
enhanced
Resilient Region

Commitment and Capacity Increasing Commitment, Capacity and Partnerships established
Statement of Climate Change Commitment• Climate Change Master Plan • Support Community Partnership Planning • Form Office of Climate Change and Energy Management
Strategic Priority: Build Environmental Resiliency

Community Climate Change Partnership Supported Commitment, Capacity and Partnerships established
Commitment, Capacity and Partnerships established

Historic Data for Precipitation: EC monthly homogenized & CANGRD Daily. Future projections: Raw data extracted from variables in the CLIMDEX experiment led by Environment Canada: www.cccma.ec.gc.ca/data/climdex/climdex
*
**
*
*
Peel’s Projected Climate in 2050Climate Risks understood

Vulnerabilities and Risks Assessed
Climate Trends and Vulnerability Assessments (2014-2016)
Corporate Risks (2017)
Climate Risks understood

Heat and Flood and Vulnerable Areas Identified
Heat vulnerable areas Flood vulnerable areas
Climate Risks understood

High Risks Impacting Services
This Photo by Unknown Author is licensed under CC BY
Climate Risks understood

Investments Increasing Investments
made to increase resiliency
Enterprise Programs and ServicesClimate change mitigation and energy management – 2.2 million
Water and WastewaterReduce incidents of sewer back-ups during severe weather events caused by surcharge of the sanitary system.
Roads and TransportationAdapting to and to mitigating the effects of climate change by implementing low-impact development measures into our road designs so more water can be absorbed during severe weather events
2019-2028 Capital Plan ForecastGovernment is future-oriented and accountable: $39 million for climate change studies and investments as well as technology initiatives to provide modern service to citizens
20
19
20
19
-20
28

Preparing for greater weather related emergencies
https://vimeo.com/324691127
Disaster preparedness

Plan in place to address risks and
opportunitiesWhat we PLAN to do about it
PROTECT AND INCREASE GREEN
INFRASTRUCTURE THROUGHOUT
PEEL
Chapter 4: Be Prepared
A safe, secure, and connected community is
provided by ensuring Regional services and
assets are more resilient to extreme weather
events and future climate conditions.

Supportive Policies, Plans and Standards
Official Plan Policy (2041) Transportation Planning andStormwater management
“Support comprehensive stormwater management planning, includinglow impact development and green infrastructure.”
• Storm Servicing Master Plan • Stormwater Design Criteria and
Procedural Manual• Urban Forest Best Practice Guide
Land use policy adopted and
plans in place to increase
community resiliency

Green Infrastructure Opportunity Assessment

ObjectivesDesign and size Green Infrastructure appropriately for sites to meet a selected SWM criteria, calculate the cost of implementation, and test the performance of the site design for future climate change scenario.
Objectives and Deliverables
Key Deliverables 1. Inventory land assets2. Model Base/GI stormwater management +
Current/Future climate 3. Estimate costs of GI

Human Services - 92 HaChild CareSocial HousingShelters
Headquarters – 7.5 HaAdministration Offices
Health/Emergency Services – 24 HaParamedicsLong Term Care
Police
Public Works Facilities – 382 HaPublic Works FacilityWater Storage BuildingsWater Treatment PlantsSewage Treatment Plants
Road Right of Way – 1752 HaRegional Roads
Regional Road Sidewalks &Medians
Inventory of RoP’s Land Assets

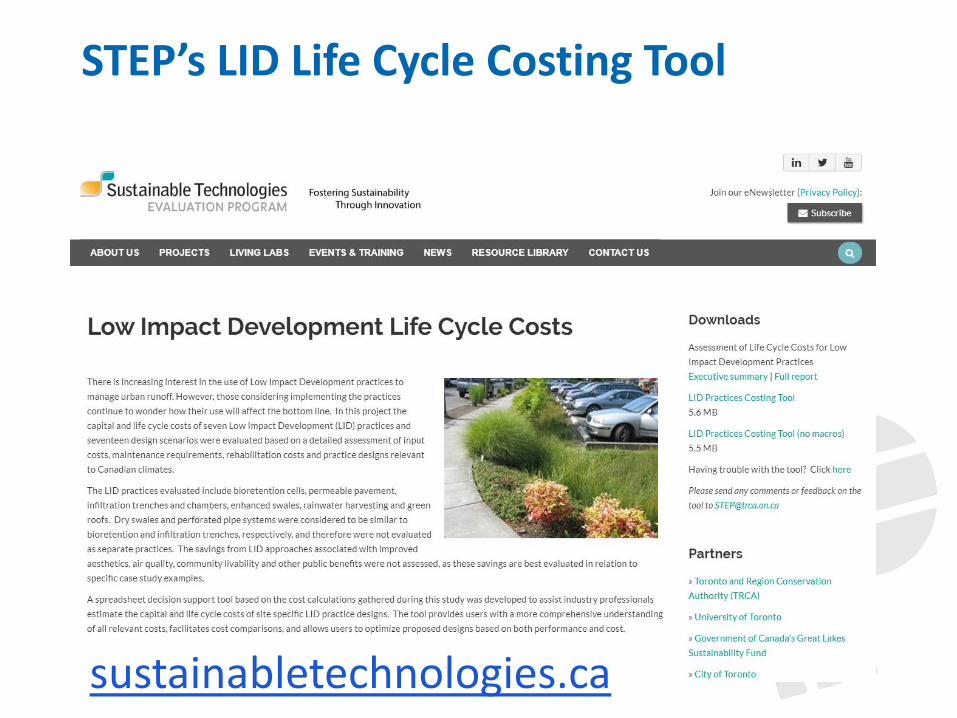
lidttt.sustainabletechnologies.ca
US EPA - SWMM 5 LID Treatment Train Tool ( Free )

0%10%20%30%40%50%60%70%80%90%
100%Peel Properties by Land Cover Types
Landscaped Area Water
Building Parking
Other Impervious Road
1
2
Typical Site Summaries

Site CharacteristicsMedian site size
0.88 hectares
Soil type Clay loam
Type of use
Medium-high density housing, shelters, and child care
Land cover type breakdown
Building 22%
Parking Lot 16%
Roads 4%
Other Impervious 22%
Pervious 36%
Typical Site Summary – Human Services

GI/ Site Design Considerations
• Maintain current functionalities of the site
• Site should mimic natural hydrologic processes
• Satisfy SWM criteria: retain 90th percentile storm (27 mm)
• Cost conscious but explore various GIs

Pre – to Post – Green Infrastructure

Opportunities Assessed
Infi
ltra
tio
n t
ren
che
sTr
ee
pla
nti
ng
wit
h s
oil
cells
Do
wn
spo
ut
dis
con
nec
t
to p
erfo
rate
d c
iste
rn
Stormwater Outcomes27mm -Baseline
27mm-GI
CC (34mm)+ Baseline
CC(34mm)
+ GI
Water Quantity
Rainfall Volume (m3) 238 298
Rainfall Reduction (%) 31% 100% 27% 94%
Water Quality – Load Reduction (%)
Total Suspended Solids 15% 100% 16.9% 90-95%
Total Phosphorus 15% 100% 17% 90-95%
Human Services – SWM Results
Results
sustainabletechnologies.ca
STEP’s LID Life Cycle Costing Tool

RSMeans –> LID Life Cycle Costing Tool
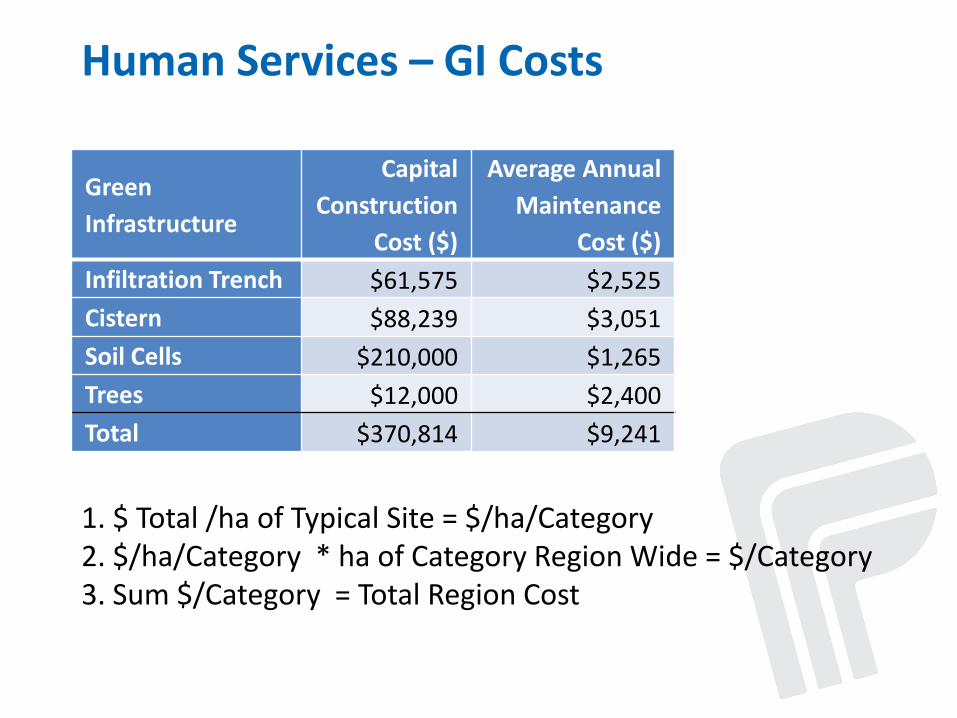
Green
Infrastructure
Capital
Construction
Cost ($)
Average Annual
Maintenance
Cost ($)
Infiltration Trench $61,575 $2,525
Cistern $88,239 $3,051
Soil Cells $210,000 $1,265
Trees $12,000 $2,400
Total $370,814 $9,241
1. $ Total /ha of Typical Site = $/ha/Category2. $/ha/Category * ha of Category Region Wide = $/Category3. Sum $/Category = Total Region Cost
Human Services – GI Costs

Next Steps
1. Apply costs for GI into SOGR Schedule, Capital and AM Plans.
2. Conduct site level feasibility studies as part of CCMP implementation.
3. Integrate costing functionality within LID TTT
4. Evaluate the other benefits of GI
5. Combine into a decision support tool for GI implementation

How is your municipality planning to increase its resiliency to climate change?
Resilient Region
Commitment, Capacity and Partnerships Expanded
Climate Risks understood and plan in
place address them
Investments made and
Financial Risks and
Opportunities Disclosed
Public Health Protected Disaster
preparedness and public
support increased
Land use policy and plans
adopted to increase
community resiliency
Natural and green
infrastructure protected and
enhanced

Care to continue the conversation?
Contact
Mark PajotAdvisor, Office of Climate Change and Energy [email protected]
Yuestas DavidProject Manager, Research and Knowledge ManagementToronto and Region Conservation [email protected] ext. 5742