Embed Size (px)
DESCRIPTION
Uganda has seen marked improvement in childhood survival over the past two decades. While the scale-up of malaria interventions has been suggested as one of the biggest drivers of these improvements, little research has considered the contribution of other health interventions and sociodemographic factors alongside malaria interventions. To address this knowledge gap, the Infectious Diseases Research Collaboration (IDRC) and the Institute for Health Metrics and Evaluation (IHME) collaborated to implement the Malaria Control Policy Assessment (MCPA) project. The objective of the MCPA project was to harness existing data in Uganda and use rigorous statistical methods to quantify trends in child health interventions, with a focus on malaria interventions, as well as non-health factors, to better understand their collective impact on under-5 mortality at the subnational level.
Citation preview

INSTITUTE FOR HEALTH METRICS AND EVALUATIONUNIVERSITY OF WASHINGTON
Assessing Impact, Improving HealthProgress in Child Health Across Regions in Uganda
A REPORT OF THE MCPA PROJECT

This report was prepared by the Institute for Health Metrics and Evaluation (IHME) and the Infectious Diseases Research Collaboration (IDRC). This work is intended to provide information on levels and trends for key child health outcomes, such as under-5 mortality, and coverage of child and maternal health interventions across regions in Uganda. The estimates may change following peer review. The contents of this publication may not be reproduced in whole or in part without permission from IHME.
Citation: Institute for Health Metrics and Evaluation (IHME). Assessing Impact, Improving Health: Progress in Child Health Across Regions in Uganda. Seattle, WA: IHME, 2014.
Institute for Health Metrics and Evaluation2301 Fifth Ave., Suite 600Seattle, WA 98121USA
Telephone: +1-206-897-2800Fax: +1-206-897-2899Email: [email protected]
© 2014 Institute for Health Metrics and Evaluation

Table of conTenTs
3 Acronyms
4 Termsanddefinitions
5 Executivesummary
6 Introduction
8 Mainfindings
14 Conclusionsandpolicyimplications
16 References
18 Annex1.OverviewoftheMCPAanalyticalapproachandmethods
19 Regionalprofiles
20 Central1
24 Central2
28 EastCentral
32 Eastern
36 Kampala
40 Karamoja
44 North
48 Southwest
52 WestNile
56 Western
AssessingImpact,ImprovingHealthProgress in child Health across Regions in Uganda
a RePoRT of THe McPa PRoJecT

2
aboUT IHMe
acknowledgMenTs
aboUT THIs RePoRT
The Institute for HealthMetrics and Evaluation (IHME) is anindependentglobalhealth researchcenterat theUniversityofWashington thatprovides rigorousandcomparablemea-surementoftheworld’smostimportanthealthproblemsandevaluates thestrategiesused toaddress them. IHMEmakesthisinformationfreelyavailablesothatpolicymakershavetheevidencetheyneedtomakeinformeddecisionsabouthowtoallocateresourcestobestimprovepopulationhealth.
Toexpress interest in collaboratingor request further in-formationon theMalariaControlPolicyAssessment (MCPA)projectinUganda,pleasecontactIHME:
InstituteforHealthMetricsandEvaluation2301FifthAve.,Suite600Seattle,WA98121USA
Telephone:+1-206-897-2800Fax:+1-206-897-2899E-mail:[email protected]
Assessing Impact, Improving Health: Progress in Child Health Across Regions in Uganda provides themost up-to-date re-sults from theMCPA project in Uganda, including regionaltrendsforchildhealthoutcomes,arangeofmalariaandotherkeychildandmaternalhealth interventions,andasubsetofsocio-demographicfactors.
The MCPA project was led by Emmanuela Gakidou atIHME. At the Infectious Diseases Research Collaboration(IDRC),Moses Kamya served as the country principal inves-
tigator(PI).DatacollationwasprimarilyconductedbyGloriaIkilezi,TalemwaNalugwa,andMaryLakiyo,allresearchersatIDRC. Trends in under-5mortality were produced by LauraDwyer-Lindgren at IHME. Intervention coverage analyseswere conducted by Allen Roberts, with contributions fromMarieNg,bothof IHME.AnneGasasiraprovidedkeyinputsandfeedbackonanalyses.ThisreportwaswrittenbyNancyFullmanofIHME.
TheMCPAprojectinUgandaisacollaborationbetweenIDRCandIHMEattheUniversityofWashingtonintheUnitedStates.Thisprojecthasbenefitedgreatlyfromkeyinputsandsupportfrom theMinistryofHealth (MOH)and theNationalMalariaControlProgram(NMCP)inUganda.Specifically,wethanktheAIDSControlProgram(ACP)andtheUgandaBureauofStatis-tics(UBOS)forarangeofsurveydata.Wearemostgratefultotheseorganizations,especiallyfortheirwillingnesstofacilitatedataaccessandprovidecrucialcontentknowledge.
We thank the MCPA Advisory Group, which consists ofinternationalandlocalstakeholderswhocontributedtowardrefining the project’s research concept and framework.Wealso thank the World Health Organization (WHO) office in
Uganda for providing access to immunization data.We aregratefultoNationalMedicalStoresandUganda’sJointMed-icalStoreforgrantingaccesstodrugdistributiondata,aswellasAbtAssociates forproviding informationonthecountry’sindoorresidualspraying(IRS)program.
At IHME,wewishtothankAnnieHaakenstadandKelseyPierceformanagingtheproject;PatriciaKiyonoformanagingtheproductionofthisreport;AdrienneChewandKateMullerfor editorial support; Amy VanderZanden for data support;andAnnKumasakaforgraphicdesign.
Funding for this research came from the Bill &MelindaGatesFoundation.

3
Acronyms abce Access,Bottlenecks,Costs,andEquity
acP AIDSControlProgram
acT Artemisinin-basedcombinationtherapy
aIds Acquiredimmunodeficiencysyndrome
anc4 Antenatalcare(4visits)
bcg BacillusCalmette-Guérinvaccine
cI Confidenceinterval(95%)
dfId UnitedKingdomDepartmentforInternationalDevelopment
dHs DemographicandHealthSurvey
dPT Diphtheria-pertussis-tetanus
gHdx GlobalHealthDataExchange
gPR GaussianProcessRegression
HIV Humanimmunodeficiencyvirus
HPV Humanpapillomavirus
HssP II Uganda Health Sector Strategic Plan II, 2005/06–2009/10
IdRc InfectiousDiseasesResearchCollaboration
IHMe InstituteforHealthMetricsandEvaluation
iccM Integratedcommunitycasemanagement
IPV Inactivatedpoliovaccine
IPTp2 Intermittentpreventivetherapyinpregnancy(2doses)
IRs Indoorresidualspraying
ITn Insecticide-treatednet
llIn Long-lastinginsecticide-treatednet
McPa MalariaControlPolicyAssessment
Mdg MillenniumDevelopmentGoal
MoH MinistryofHealth
nMcP NationalMalariaControlProgram
oPV Oralpoliovaccine
PMI President’sMalariaInitiative
PMTcT Preventionofmother-to-childtransmissionofHIV
Red ReachingEveryDistrict
sba Skilledbirthattendance
sP Sulfadoxine-pyrimethamine
Uac UgandaAIDSCommission
Ubos UgandaBureauofStatistics
wHo WorldHealthOrganization

4
Terms and definitionsartemisinin-based combination therapy (acT) coverage: theproportionofchildrenunder5yearsoldwhoreceivedanACTforfeverexperiencedinthelasttwoweeks,asreportedbysurveyrespondents.
all-cause under-5 mortality:theprobability(expressedastherateper1,000livebirths)thatchildrenbornalivewilldiebeforereachingtheageof5years.
antenatal care (anc4) coverage:theproportionofchildrenunder1yearoldwhosemothershadfourormoreantenatalvisitsatahealthfacilityduringtheirpregnancy.
bcg immunization coverage:theproportionofchildrenunder5yearsoldwhohavebeenvaccinatedagainsttuberculosiswiththeBacillusCalmette-Guérin(BCG)vaccine.Vaccinereceiptwasdeterminedbyimmunizationcards,orintheabsenceofacard,bymaternalrecall.
care-seeking for suspected pneumonia:theproportionofchildrenunder5yearsoldwhosoughtcareatahealthfacilityafterexperiencingsymptomsindicativeofsuspectedpneumonia(cough)inthelasttwoweeks,asreportedbysurveyrespondents.
childhood underweight:theproportionofchildrenaged6to59monthswhoaretwoormorestandarddeviationsbelowtheinternationalanthropometricreferencepopulationmedianofweightforage.
exclusive breastfeeding coverage:theproportionofchildrenunder2yearsoldwhoexclusivelyconsumedbreastmilkthepreviousnight,asreportedbysurveyrespondents.
Household access to improved sanitation:theproportionofhouseholdswithanimprovedsanitationsystem(flushtoilet,coveredpitlatrine).Unimprovedsanitationsystemsincludeuncoveredpitlatrinesandhavingnoformalstructure.
Household access to improved water sources:theproportionofhouseholdswithanimprovedwatersource(pipedwater,borehole,protectedwell,protectedspring,rainwater,bottledwater,gravityflowscheme).Unimprovedwatersourcesincludeunprotectedwellsorsprings,riversorponds,vendor-providedwater,andtankertrucks.
Indoor residual spraying (IRs) coverage:theproportionofhouseholdsthatweresprayedwithaninsecticide-basedsolutioninthelast12months.
Insecticide-treated net (ITn):anettreatedwithaninsecticide-basedsolutionthatisusedforprotectionagainstmosquitosthatcancarrymalaria.ITNsincludelong-lastinginsecticide-treatednets(LLINs),whichareimpregnatedwithinsecticidesthataresupposedtoremaineffectiveforthreetofiveyears,andtraditionalITNs,whichrequireretreatmenteachyearafterreceipt.
Intermittent preventive therapy in pregnancy, two doses (IPTp2):theproportionofpregnantwomenwhoreceivedatleasttwotreatmentdosesofFansidar(sulfadoxine/pyrimethamine[SP])atantenatalcarevisitsduringpregnancy.
Intervention coverage:theproportionofindividualsorhouseholdswhoreceivedaninterventionthattheyneeded.
ITn ownership:theproportionofhouseholdsthatownatleastoneITN.
ITn use by children under 5:theproportionofchildrenunder5yearsoldwhosleptunderanITNthepreviousnight,asreportedbyhouseholdheads.
Maternal educational attainment:thetotalnumberyearsofeducationachievedbywomenofreproductiveage(15to44years).
Measles immunization coverage:theproportionofchildrenaged12to59monthswhohavereceivedmeaslesvaccination.Vaccinereceiptwasdeterminedbyimmunizationcards,orintheabsenceofacard,bymaternalrecall.
Pentavalent immunization coverage:theproportionofchildrenaged12to24monthswhohavereceivedthepentavalentvaccine,whichincludesprotectionagainstdiphtheria-pertussis-tetanus(DPT),hepatitisB,andHaemophilus influenzae typeb.Vaccinereceiptwasdeterminedbyimmunizationcards,orintheabsenceofacard,bymaternalrecall.
Polio immunization coverage:theproportionofchildrenaged12to59monthswhohavereceivedthreedosesoftheoralpoliovaccine(OPV).Vaccinereceiptwasdetermined byimmunizationcards,orintheabsenceofacard,bymaternalrecall.
skilled birth attendance (sba) coverage:theproportionofchildrenunder1yearoldwhosemothersdeliveredwithaskilledbirthattendant(adoctor,nurse,midwife,orclinicalofficer),asdeterminedbyself-report.
5
Executive summaryUgandahasseenmarkedimprovementinchildhoodsurvivalover the past two decades. While the scale-up of malariainterventions has been suggested as one of the biggestdriversoftheseimprovements,littleresearchhasconsideredthe contribution of other health interventions and socio- demographic factors alongside malaria interventions. To addressthisknowledgegap,theInfectiousDiseasesResearchCollaboration(IDRC)andtheInstituteforHealthMetricsandEvaluation (IHME) collaborated to implement the MalariaControl Policy Assessment (MCPA) project. The objectiveoftheMCPAprojectwastoharnessexistingdatainUganda and use rigorous statistical methods to quantify trends in child health interventions, with a focus onmalaria interven-tions,aswellasnon-healthfactors,tobetterunderstandtheircollectiveimpactonunder-5mortalityatthesubnationallevel.
In this report, we show trends for a range of key childhealthoutcomes, interventions, and socio-demographic fac-torsfrom1990to2011for10regionsinUganda.Thisisthefirst time thatannualestimatesandcorresponding levelsofuncertainty for sucha rangeof indicatorshavebeengener-atedattheregionallevelandforthisperiodoftime.Regionalprofiles, located at the back of this report, depict trends inchildhealthovertimeandbenchmarkregionalperformanceacrossindicators.Withthisinformation,localandnationalpol-icymakersandhealthofficialscanidentifyareasofsuccessfulhealthservicedeliveryanddetectearlysignsofdecliningcov-erageorstalledprogress.
Weoriginallyattemptedtoconductanalysesatthedistrictlevel. Althoughwe collated all available data from a rangeofsources,nohealthsurveycouldprovidesufficientsamplesizes toextractdistrict-levelestimates,and thecountry’s fre-quentredistrictingfrom1990to2011ledustouseregionsastheunitofanalysis.District-levelresultswouldhavebeenmore directly relevant for policymakers and local healthprogrammanagers in Uganda, as the district is the admin-istrative levelatwhichhealthservicesaredelivered.Further,district-leveltrendswouldhaveallowedustoconductcausalattributionanalysesand todetermine the impactof variousfactorsondeclinesinunder-5mortality.
The results presented in this report are descriptive, andwhile informative, theycannotbeusedtomakecausal infer-ences.Thishighlightsthecriticalneedforgreaterinvestmentinhealthinformationsystemsandroutinedatacollection,asthesearethemechanismsbywhichpolicymakersshouldre-ceivetimelyandlocallyrelevantinformationtoanswerthekeyhealth questions they face.Without this kind of investmentgoingforward,properlyassessingtheimpactofanypriorityhealthprogramsorscale-upofinterventionpackagesislikelyto be fraught with challenges. An increasing emphasis isplacedondocumentingtheimpactofprograms,particularlyamidstcompetingpolicyagendasandtighteningbudgets.Tomaintainandstrengthen theargument forcontinued invest-ment inmalariaprograms, it iscrucial tocollect thekindofdataand invest in the informationsystems thatcansupporttheassessmentofprogramimpact.
This report shows that Uganda is succeeding on sev-eral fronts inchildhealthanddevelopment.First,we foundthat between 1990 and 2011, under-5 mortality signifi-cantly declined across all regions in Uganda, with themajorityofregionsachievingthechildsurvivaltargetssetforth bytheUgandanMinistryofHealth(MOH).Second,coverageof keymalaria interventions, such as household ownership of insecticide-treated nets (ITNs) and the receipt of artemisinin-based combination therapies (ACTs), increaseddramatically in a very short period of time. Some of the regions with the highest malaria transmission documentedthe highest levels of ACT coverage, reflecting Uganda’s ongoingcommitmenttoreducingitsmalariaburden.Third,asanearlyadopterofthepentavalentvaccinein2002,Ugandahas successfully brought coverage to levels comparable tovaccines that have been on the immunization schedule for decades.Fourth,theproportionofchildrenunder5whosoughtcare for suspected pneumonia steadily increased between1990and2011, suggesting thatbothaccess tohealth facili-tiesandhealth-care-seekingbehaviorsmayhaveimprovedinUgandaduringthistime.Finally,steadygainswererecordedin educational attainment among women and household accesstoimprovedsanitationinmostareasofthecountry.
Thesesuccesseswereaccompaniedbyconcerningtrendsforanumberof keychildandmaternalhealth interventions.First,declinesinunder-5mortalityslowedafter2007inseveralregions,asevidencedbycompletestagnationofprogressoreven slight increases in under-5mortality for some regions.Second, the receiptofat least twodosesof intermittentpre-ventivetherapyinpregnancy(IPTp2)waspersistentlylowovertimeandacross regions.Thisfindingwarrants further investi-gation, especially since trends in the proportion of womenwhohadatleastfourantenatalcarevisits(ANC4)consistentlyexceeded levelsof IPTp2.Third,despite substantialgains invaccinecoverageovertime,levelsofmeaslesandpolioimmu-nizationformostregionsremainedlowerthanoptimalin2011.Ugandahasexperiencedoutbreaksofbothdiseasesinrecentyears, furtherhighlighting the importanceof expanding cov-erageandmaintaininghighimmunizationrates.Last,anumberofregionsrecordedminimalprogressinimprovinglowlevelsofANC4andskilledbirthattendance(SBA),withsomeevenrecording declines in ANC4. Targeting these areas for im-provementshouldbeapriorityifUgandaistoensurethatitsachievementsinchildhealthcontinueintothepresentdecade.
With a focus on subnational trends, findings from theMCPAprojectinUgandaprovideside-by-sidecomparisonsofhealthperformanceover time,geography, and interventiontype.Thechildhealthlandscapeismarkedlyheterogeneous,even at the regional level, highlighting the need for con-tinuous and timely assessment of even more local data tounderstand the determinants of effective delivery of healthservices.With regularly collected and analyzedhealth infor-mation,policymakerscanhavetheevidencebasetheyneedtomaketargeted,data-drivendecisionsforachievinggreaterandmoreequitablehealthgainsinUganda.

6
IntroductionOver the past decade, Uganda’s child health and develop-ment landscape has been substantially reshaped by newprograms, interventions, and priorities, including extensivemalariacontrolprograms. Inorder to fullyunderstandwhathas contributed to Uganda’s progress in reducing under-5mortality,itisimportanttocomprehensivelytrackandassessall interventions and factors that may have improved childhealth.
TheMCPAprojectinUgandahadtwomainobjectives:
1) Determine what proportion of the decline in all-causeunder-5 mortality in Uganda was attributable to thescale-upofmalariacontrolinterventions,whileaccountingfor a range of other key child health interventions andnon-healthfactors;and
2) Assess this impact at a subnational level between 1990and 2010.
TheMCPAprojectsoughttouseallavailabledatasourcesto generate annual estimates of child health outcomes, in-terventions, and key socio-demographic factors. Table 1providesanoverviewoftherangeofthesedatasources.Theoriginalaimwas toproducedistrict-level trends,butconsis-tentlycollecteddatawerelackingatthisadministrativelevelovertime.Multipledataextractionandstatisticaltechniqueswereusedinanefforttogeneratedistrict-levelestimates,buttheywereunsuccessfulforanumberofreasons,includingtheomissionofdistrictidentifiersinsurveys,frequentredistrictingof administrative boundaries (i.e., therewere 44 districts in1997,79 in2006,and112 in2010 [Green2008,UBOSandICFInc.2012]),andinsufficientdocumentationofredistrictingactivities. As a result, we used the 10 regional boundariescommonlyapplied for theDemographicandHealthSurvey(DHS)forsubnationalanalysis.Thissmallnumberofregionsmeant that we were not able to conduct causal attribution
MaIn fIndIngs fRoM THe McPa PRoJecT In Uganda
Under-5mortality significantly declined in every regionbetween1990 and2011.However, some regionsexperiencedslowerprogress,ifnotstagnation,inreducingunder-5mortalityafter2007.
Coverageofkeymalariainterventions,namelyITNownershipandthereceiptofACTsamongfebrilechildrenunder5,rapidlyscaledupduringashortperiodoftimethroughoutUganda.Atthesametime,noregionreachedthemalariacoveragegoalssetforthbytheMOH.
Asmalariainterventionswerescaledup,Ugandaalsorecordedsubstantialgainsincoverageofthepentavalentvaccineandcare-seekingforsuspectedpneumoniaamongchildrenunder5.
Large increases in the average years of education attained by women of reproductive age and householdaccesstoimprovedsanitationweredocumentedinmanyregions.Nonetheless,sizeablegapsbetweenthehighestandlowestlevelsofeducationalattainment,aswellasotherdeterminantsofhealth,persistedbetween1990and2011.
Amidstthecountry’shealthsuccesses,otherworrisometrendswarrantfurtherattention.IPTp2cov-erageremainedverylowthroughoutUganda,andfewregionsrecordedimprovementsinANC4overthe21-yearperiodanalyzed.Mostregionsrecordedminimalprogressinimprovingpolioimmuniza-tioncoverage,evenafterpoliooutbreaksoccurred.SubstantialdisparitiesbetweenthehealthtrendsfoundinKampalaandasubsetofregionsalsohaveenduredovertime.Addressingthesegapsinhealthserviceprovisioniscrucialtomaintaining,aswellasaccelerating,Uganda’sgainsinchildhealth.

7
Table 1. data sources used in the McPa project
Data source Years representeD
sURVeys
AIDSIndicatorSurvey(AIS) 2004–2005,2011
AnemiaandParasitemiaSurvey(A&P) 2011
DemographicandHealthSurvey(DHS) 1995,1995–1996,2000–2001,2006,2011
IntegratedHouseholdSurvey(IHS) 1992–1993
MalariaIndicatorSurvey(MIS) 2009–2010
NetmarkSurveyreports 2000,2006
NorthernUgandaBaselineSurvey 2004
QuantitativeServiceDeliverySurvey 2000
ServiceProvisionAssessment(SPA) 2007
UgandaNationalHouseholdSurvey(UNHS) 1995–1996,1999–2000,2002–2003,2005–2006,2009–2010
UgandaNationalPanelSurvey(UNPS) 2009–2010,2010–2011
UgandaNationalServiceDeliverySurvey(UNSDS) 2004,2008
PoPUlaTIon censUses
Nationalcensus 1992,2002
adMInIsTRaTIVe soURces
Drugsupplyanddeliveryrecords 2006–2012
HealthManagementInformationSystem(HMIS) 2002–2012
Malariainterventiontrackingdatabases 2006–2010
analyses,andthus theresultspresentedherearemainlyde-scriptive.
We produced a time series of regional estimates andcorrespondinglevelsofuncertainty(asexpressedby95%con-fidenceintervals [CI]) from1990to2011.Toourknowledge,this is the first time that regional trends were systemati-callygenerated foreach region inUgandaandacrossa fullrangeofkeychildhealthoutcomes,healthinterventions,and
socio-demographicfactors.Annex1providesanoverviewoftheanalyticalapproachused togenerate theestimatesandtrendsshowninthisreport.
Detailed descriptions of the findings for each regionare presented in this report. Regional data can be down-loaded from IHME’s Global Health Data Exchange (GHDx): http://ghdx.healthdata.org.

8
Main findingsSignificant declines in under-5 mortality were observed across all regions, but gains slowed in recent yearsUgandamademarked progress in improving child survivalbetween 1990 and 2011, with all regions recording statis-tically significant reductions in all-cause under-5 mortalityduring this time (Figure 1). Further, themajority of regionsachievedtheunder-5mortalitytargetsetforthbytheUganda Health Sector Strategic Plan II (HSSP II), 2005/06–2009/10,whichwastoreduceunder-5mortalitytonomorethan103deathsper1,000livebirthsby2010(MOH2005a).
At thenational level,under-5mortality fellby48%, from163deathsper1,000livebirthsin1990(95%CI:157,170)to85in2011(95%CI:79,93)(Wangetal.2014).Regionally,de-clinesrangedfrom38%to54%.Suchcountrywideprogresscorrespondedwithsomereductionsininequalitiesaswell.In1990,levelsofunder-5mortalityspannedfrom104deathsper1,000livebirths(95%CI:85,128)to201(95%CI:169,236)acrossregions.By2011,thisgapmoderatelynarrowed,witharangeof50deathsper1,000livebirths(95%CI:38,66)to121(95%CI:94,154).Theabsolutedifferencebetweentheregionwiththehighestlevelofunder-5mortalityandthelowestde-creasedabout30%(droppingfromadifferenceof97to71).Nonetheless, apersistentdisparity remainedbetweenchildsurvival in Kampala and the levels of under-5mortality ob-servedfortherestofUganda.
Amidsttheseimprovements,itisworthnotingthatseveralregionsexperiencedslowedgainsorevenslightincreasesin
under-5mortalitybetween2007and2011.Itiscriticaltode-terminewhethertheseregionshaverecordedimprovementsinmorerecentyears,especiallyasthedeadlineapproachesfor achieving the fourth Millennium Development Goal(MDG4), reducing under-5mortality by two-thirds between1990 and 2015.
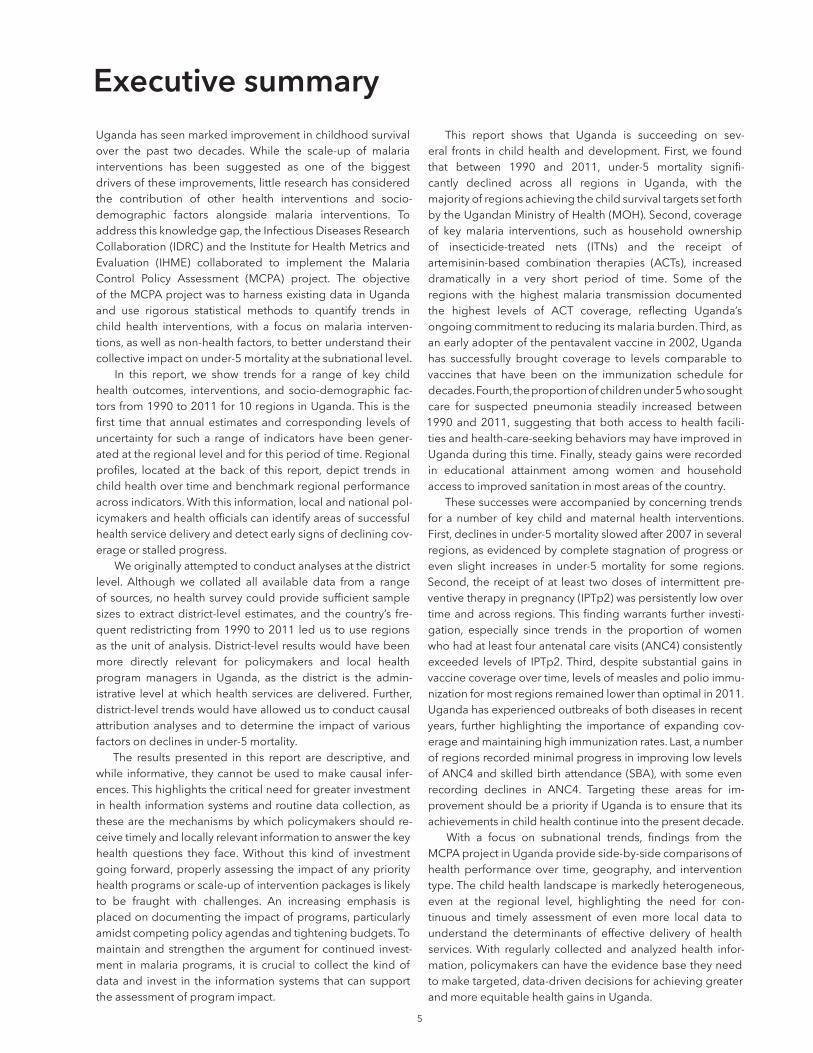
Malaria interventions were rapidly scaled up in Uganda, but regions fell short of national targetsCoverageofnearlyallmalariainterventionsgreatlyincreasedthroughoutUgandainaveryshortperiodoftime,withmostof thegainsoccurringafter2007.Nationally, theproportionof households that either owned at least one ITN or had indoorresidualspraying(IRS)remainedbelow10%until2005andonly reachedabout30% in2007.Soonafter, coverageclimbedmorequickly,exceeding40%in2009andrisingtoaround60%in2011.
Prior to 2005, coverage ofmalaria control interventionswasquitelowinUganda.By2011,allregionshadcoveragelevels exceeding 50% for having either ITNs or IRS. Figure2shows the rise incoverageofmalariacontrol in this shortperiod of time. At the same time, the regional differencebetween the lowest andhighest levelsof coverage in2011remainedsizeable,rangingfrom53%(95%CI:27%,76%)to82% (95%CI: 68%, 92%). Some of these coverage discrep-ancies may be related to variances in malaria transmissionintensityinUganda,asareasintheNorthregionandwestern
figure 1. Regional estimates of all-cause under-5 mortality in Uganda, 1990–2011
40
65
90
115
140
165
190
215
Dea
ths
per 1
,000
live
birt
hs
1990 1995 2000 2005 2010
National average
KaramojaNorthWest NileEasternSouthwestWesternEast CentralCentral 2Central 1Kampala
9
2005 2008 2011
0
10
20
30
40
50
60
70
80
90
2007 2009 2011
0
10
20
30
40
50
60
70
80
figure 2. Percentage of households covered by an ITn, IRs, or both interventions in 2005, 2008, and 2011
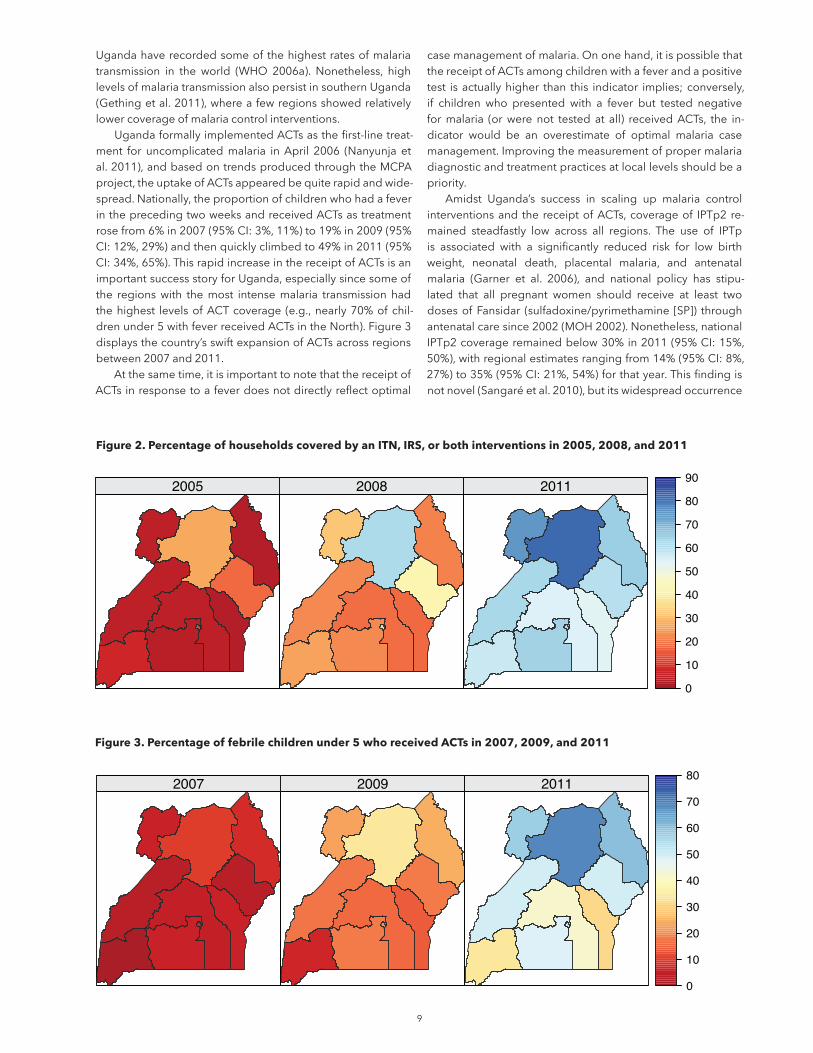
figure 3. Percentage of febrile children under 5 who received acTs in 2007, 2009, and 2011
Ugandahaverecordedsomeofthehighestratesofmalariatransmission in the world (WHO 2006a). Nonetheless, highlevelsofmalariatransmissionalsopersistinsouthernUganda(Gethingetal.2011),whereafewregionsshowedrelativelylowercoverageofmalariacontrolinterventions.
UgandaformallyimplementedACTsasthefirst-linetreat-ment for uncomplicatedmalaria inApril 2006 (Nanyunja etal.2011),andbasedontrendsproducedthroughtheMCPAproject,theuptakeofACTsappearedbequiterapidandwide-spread.Nationally,theproportionofchildrenwhohadafeverintheprecedingtwoweeksandreceivedACTsastreatmentrosefrom6%in2007(95%CI:3%,11%)to19%in2009(95%CI:12%,29%)andthenquicklyclimbedto49%in2011(95%CI:34%,65%).ThisrapidincreaseinthereceiptofACTsisanimportantsuccessstoryforUganda,especiallysincesomeofthe regionswith themost intensemalaria transmission hadthehighest levelsofACTcoverage (e.g.,nearly70%ofchil-drenunder5withfeverreceivedACTsintheNorth).Figure3displaysthecountry’sswiftexpansionofACTsacrossregionsbetween2007and2011.
Atthesametime,itisimportanttonotethatthereceiptofACTsinresponsetoafeverdoesnotdirectlyreflectoptimal
casemanagementofmalaria.Ononehand,itispossiblethatthereceiptofACTsamongchildrenwithafeverandapositivetest isactuallyhigher than this indicator implies; conversely,if children who presented with a fever but tested negativeformalaria (orwere not tested at all) receivedACTs, the in-dicator would be an overestimate of optimal malaria casemanagement.Improvingthemeasurementofpropermalariadiagnosticandtreatmentpracticesatlocallevelsshouldbeapriority.
Amidst Uganda’s success in scaling up malaria controlinterventionsand the receiptofACTs,coverageof IPTp2re-mained steadfastly low across all regions. The use of IPTpis associated with a significantly reduced risk for low birthweight, neonatal death, placental malaria, and antenatalmalaria (Garner et al. 2006), and national policy has stipu-lated that all pregnant women should receive at least twodosesofFansidar (sulfadoxine/pyrimethamine [SP]) through antenatalcaresince2002(MOH2002).Nonetheless,nationalIPTp2coverageremainedbelow30%in2011(95%CI:15%,50%),withregionalestimatesrangingfrom14%(95%CI:8%,27%)to35%(95%CI:21%,54%)forthatyear.Thisfindingisnotnovel(Sangaréetal.2010),butitswidespreadoccurrence

1 0
islessclear.PersistentlylowlevelsofIPTp2donotappeartobeanantenatalcareaccessissue,astheproportionofwomenwhohadat least fourantenatal carevisits (ANC4coverage)consistentlyexceededIPTp2coverage.Thisresultalsodoesnotseemtobeasupply-sidestockingissue,asover90%ofallhealthfacilitiesstockedSPin2012,asmeasuredbyanation-allyrepresentativesampleoffacilitiesacrosslevelsofcareandownership inUganda (IHME2014b).More localized studiessuggestthatlowlevelsofIPTp2coveragemayberelatedtoprovider-levelgapsandprescriptionpractices(Sangaréetal.2010), but further investigation iswarranted to address thisongoinghealthchallengeinUganda.
The Uganda Malaria Control Strategic Plan 2005/06–2009/10 setseveralmalariainterventiontargetstoachievebymid-2010,including(1)85%ofhouseholdswithatleastoneITN; (2)85%ofchildrenunder5sleepingunderan ITN theprevious night; and (3) 85% of pregnant women receivingatleasttwodosesofSP(IPTp2)(MOH2005b).Thesetargetswereveryambitious,anddespitemarkedprogresssince2005,noregionachievedanyofthesetargetsin2010(orby2011).Across these indicators, each region showed the highestlevelsofcoverageforITNownership,butasshowninFigure4,allregionsfellbelowthetargetbyat least10percentagepoints.AsUgandasolidifiesitsnewmalariareductionplan,forwhichthecountryhasproposedtoprovideuniversalaccesstomalariapreventionandtreatmenttoallpopulationsatriskformalaria, it iscriticaltoconsiderpastdriversofgainsand
barrierstosuccessfulachievementofboldmalariagoals.ItislikelythatrecenteffortstoincreaseaccesstoandtheuseofmalariacontrolinterventionsinUganda,sucha2014massnetdistributioncampaignandaccompanyingcommunitymobili-zationactivities(PMI2014),willcontributetohigherlevelsofinterventioncoverageinthenearfuture.
Pentavalent vaccine scale-up occurred quickly throughout Uganda, while gains for other vaccines were less pronouncedNationally,trendsinimmunizationcoveragegenerallypointedtoprogressandincreasedreceiptoffourkeychildhoodvac-cines: BCG, measles, polio, and the pentavalent vaccine.Regionally,awiderrangeoftrendsemerged,whichiscrucialtoconsiderfurthergivenUganda’sinvestmentsinitsReachingEveryDistrict(RED)efforts(MOH2010a,MOH2013).
Steadyprogresshasbeenmadeinelevatingratesofmea-sles immunization inUganda; this isparticularly noteworthygiventhatsomeregionshadlevelsofmeaslescoveragecloseto 50% in the 1990s. Nationally,measles immunization cov-eragereached85%in2011(95%CI:75%,91%),rangingfrom83%inanumberofregionsto93%inWestern(95%CI:86%,96%).Despitethesegains,onlytworegionsmetorexceededthe90%coveragegoalformeaslesimmunizationsetforthbytheUganda National Expanded Programme on Immunization Multi Year Plan, 2010–2014(MOH2010a).
figure 4. comparison of malaria program targets with regional levels of malaria intervention coverage, 2011
NMCP goalfor mid-2010
0 20 40 60 80 100Percent (%)
East Central
Central 2
Southwest
Eastern
Kampala
Western
Central 1
Karamoja
North
West Nile
ITN ownership Under-5 ITN use IPTp2
note:RegionsareorderedbytheirlevelofITNownershipin2011.

1 1
Coverage of polio immunization stagnated over time,consistently hovering around or slightly below 80%. Afterremaining polio-free for 13 years (from 1996 to 2009) andreceiving certification in 2006, Uganda experienced are-emergenceofwildpoliovirus in2009(MOH2010a).Thecountryrolledoutmassimmunizationcampaignstodistrictsthatwereconsideredathigh-risk forpoliooutbreaks,butatthe regional level, gains in polio immunization coveragewere not observed. As Uganda considers introducing theinactivated polio vaccine (IPV) (MOH 2013) to immediatelysupplement and eventually replace the oral polio vaccine(OPV),itwillbeessentialforthecountrytodeterminewhichfactorsmayhavepreventedfurthergains inpolio immuniza-tionwithOPV.
Since its 2002 introduction of the pentavalent vaccine(MOH2010a), Uganda successfully brought up pentavalentvaccine coverage throughout the country. Nationally, cov-erageclimbedfrom35%in2004(95%CI:12%,70%)to77%in2011(95%CI:51%,92%).Nonetheless,gainsincoverageslowedorstagnated inmore recentyears,with thenationalaverage hovering just below 80%between 2009 and 2011.Findingways to further accelerate gains in pentavalent vac-cinecoveragewilllikelybenefitUganda.
TheUgandanMOHsetthegoalofachieving80%coverageofallchildhoodimmunizationsin80%ofdistrictsby2014,di-rectlysupportingthecountry’sREDobjectivesandaimsforthe“fully immunized child,” or ensuring that every child finishestheUgandaimmunizationschedulepriortotheageof1year(MOH2010a).Although regional estimates of immunizationcoveragedonotrevealdistrict-leveldifferences,theyprovideagoodfoundationfromwhichin-depthinvestigationsintodis-trictvariationscouldbebased.Figure5illustratestherangeofimmunizationcoveragelevels,acrossvaccinesandregions,in2011.Tworegionsachievedcoverageexceeding80%forallvaccinesin2011,andallregionshadlevelsofBCGandmea-sles immunizationcoverageabove80%.On theotherhand,
fewerregionsrecordedcoverageequalingorsurpassing80%forpolioandpentavalentvaccineimmunization.
Itisimportantnotethattheseestimatesofcoveragelikelyindicate a “ceiling” level of immunization rates, as they donotreflecttheproportionofchildrenwhoreceivedeffective protectionagainst theseantigens.Arecentstudyfoundthatnearly 10% of health facilities in Uganda did not store vac-cines within the recommended temperature range in 2012(IHME2014b,WHO2006b),whichcouldcompromisevaccineviabilityandeffective immunity.Ongoingwork inUganda istrying to quantify what proportion of children demonstrateproperimmunityagainstasubsetofantigens(IHME2014c).
Progress recorded for some key maternal and child health interventions, whereas antenatal care coverage stagnatedBetween1990and2011,Ugandadocumentedvariedprog-ress in improvinga subsetofkeymaternalandchildhealthinterventions. SBA coverage and exclusive breastfeedinggraduallyincreasedatthenationallevel,whereasANC4cov-erage consistently remained between 41% and 49%. Thelatter is cause for concern, asUgandahas recommendedaminimumoffourantenatalcarevisitsduringpregnancysince2002(MOH2002).
For some regions, substantial gains in SBA coverageoccurred between 2000 and 2005, but by 2011, the rangein coverage was quite large, spanning from 27% (95% CI:16%,43%) to95% (95%CI:90%,97%).Few, ifany, interven-tionshadsuchalargediscrepancybetweenthehighestandlowest levelsof coverage for 2011. Pastwork suggests thatSBA coverage in Uganda has often varied in parallel withlevels ofmaternal education and relative householdwealth(UBOSand ICF Inc.2012),whichcorrespondswithourfind-ings(e.g.,Kampalaconsistentlyhadamongthehighestlevelsof SBA coverage and educational attainment forwomenof reproductiveagebetween1990and2011).
figure 5. Regional estimates of immunization coverage, by vaccine, 2011
East Central
Central 1
Central 2
North
Eastern
West Nile
Kampala
Karamoja
Southwest
Western
94 83 67 71
89 83 75 69
92 83 72 72
95 84 78 72
97 86 81 73
97 83 83 75
96 86 79 79
97 90 85 74
91 88 86 83
95 93 82 80
REGION
BCGIMMUNIZATION
MEASLESIMMUNIZATION
POLIOIMMUNIZATION
PENTAVALENTIMMUNIZATION
note:Cellshighlightedinlightbluereflectachievementofatleast80%coverageforagivenvaccinein2011;darkbluedesignatesatleast90%coverage.Cellsinyellowindicatethat80%coveragewasnotreachedasof2011;orangereflectscoveragelessthan70%.

1 2
Although negligible progress in ANC4 coverage wasfoundatthenationallevelbetween1990and2011,regionaltrends revealedamuchmoreheterogeneous landscape forantenatalcare.Someregions,especiallythoselocatedalongthewesternborderofUganda,showedsubstantialprogressin improvingANC4coverage,especiallybetween2000and2011.Atthesametime,otherregions,particularlythosefoundalongthesoutheasternareasofUganda,recordeddeclinesincoverage.Figure6illustratesthesedivergenttrendsinANC4coveragethroughoutUganda.
Trendsinexclusivebreastfeedingwerequitevaried,whichmayberelatedtoregionaldifferencesinUganda’sHIV/AIDSepidemicand theperceivedsafetyofbreastfeedingamongHIV-positivemothers(Guayetal.1996,Fadnesetal.2009).Forinstance,inKampala,aregionwhichhasexperiencedsomeofthehighestratesofHIV/AIDSinUganda(MOH2010b),exclu-sivebreastfeedingcoveragewasquitelowduringthe1990s.There is likely an association between Uganda’s gradualexpansionofservicesforpreventionofmother-to-childtrans-mission(PMTCT)ofHIVandgainsinexclusivebreastfeedingafter 2000, especially in regions with high HIV/AIDS preva-lence(UAC2012).
Servingasaproxyforhealth-care-seekingbehaviors,theproportionofchildrenunder5yearsoldwhosoughtcareatahealth facility forsuspectedpneumoniasteadily increasedovertime.Nationally,ratesofthishealth-care-seekingbehaviorincreasedfromlowerthan30%intheearly1990sto77%in2011(95%CI:76%,78%).By2011,nearlyallregionshadcare-seeking ratesatorexceeding70%, ranging from67% (95%CI:56%,76%)to84%(95%CI:77%,89%).Figure7displaysthis rapid and widespread scale-up of health-care-seekingbehavior.This finding likely reflects a varietyof factors influ-encingaccesstoandthedemandforhealthservices,whichmay include heightened overall access to health facilities,especially formoreremoteareas,and improvedcommunityoutreach through programs such as integrated communitycase management (iCCM). It is important to note that this indicatordoesnotreflectwhetherchildrenactuallyreceivedthecaretheyneeded,forpneumoniaoranyotherillnesswithsimilarsymptoms.
large gains in maternal educational attainment were observed, while less widespread progress was found for improved household characteristicsManynon-healthfactors,rangingfromlevelsofeducationtoaccesstoimprovedwatersources,canaffectchildhealthout-comesasmuchasspecifichealthinterventions.Forinstance,multiple studies have found that gains in average years ofeducationamongwomenofreproductiveage(15to44yearsold)aredirectlyassociatedwithimprovedchildhoodsurvival(Gakidouetal.2010,Wangetal.2014).
Nationally, Uganda documented an impressive 77% in-crease in maternal educational attainment, rising from anaverageof3.5yearsofeducation in1990(95%CI:3.3,3.9)to6.2yearsin2011(95%CI:5.9,6.4).Whileallregionssawheightened levelsofeducationalattainmentamongwomenofreproductiveageduringthistime,mostregionsrecordedanaveragelessthansevenyearsofeducationin2011(ortheequivalent of finishing primary school). Figure 8 illustratesboththeprogressmadeinincreasingeducationalattainmentacross regions in Uganda and the continued disparities insubnationallevelsofmaternaleducation.
Twomainfindingsemergedforimprovedhouseholdchar-acteristics inUganda: (1)asubsetof regions, rather thanallregions,recordedlargegainsfrom1990to2011;and(2)thediscrepancybetweenthehighestandlowestregionallevelsofimprovedhouseholdcharacteristicsremainedlargeovertime.Theseresultswereexemplifiedbytrendsinhouseholdaccessto improvedsanitation (Figure9), apriorityof theUgandanMOH(MOH2005a,MOH2010c).Between1990and2011,anumberof regionsdocumenteda large increase in thepro-portion of households with improved sanitation, especiallythoseinthewesternareasofUganda.Atthesametime,therangebetweentheregionswiththehighestandlowestlevelsof improved sanitation was quite sizeable during this time.In2011, thedifferencewas74percentagepoints, from24%(95%CI:17%,33%)to98%(95%CI:98%,99%).Thesefindingsdemonstrate Uganda’s considerable success in expanding accesstoimprovedsanitation,butalsohighlightthecountry’songoingchallengesinaddressingregionaldisparities.
1990 2000 2011
20
30
40
50
60
70
figure 6. Regional estimates of anc4 coverage in 1990, 2000, and 2011

1 3
1990 2000 2011
10
20
30
40
50
60
70
80
90
1990 2000 2011
0
1
2
3
4
5
6
7
8
9
10
1990 2000 2011
0
10
20
30
40
50
60
70
80
90
100
figure 7. Percentage of children who sought care for suspected pneumonia in 1990, 2000, and 2011
figure 8. average years of educational attainment among women of reproductive age in 1990, 2000, and 2011
figure 9. Percentage of households with access to improved sanitation in 1990, 2000, and 2011
note:Improvedsanitationincludedhavingaflushtoiletorcoveredpitlatrine.Unimprovedsanitationsystemsincludedpitlatrinesandhavingnoformalstructure.

1 4
Between 1990 and 2011, the health landscape in Ugandachanged sizably, and for the most part, these changes re-flectprogressinchildhealthandthesuccessfulexpansionofhealthservicedeliverythroughoutthecountry.Under-5mor-talitysubstantiallydecreasedatthenationallevel,andseveralregionsachieved the2010MOH target for improvingchild-hoodsurvival(MOH2005a).ThesedeclinesmayberelatedtoUganda’seffortstoincreasecoverageforseveralchildhealthinterventionsandindicators,includingITNownership,receiptof ACTs in response to fever, the pentavalent vaccine, andcare-seeking for suspected pneumonia. It is also likely thatthecountry’sgainsineducationalattainmentamongwomenofreproductiveageandhouseholdaccesstoimprovedsan-itationmayhavecontributedtodeclinesinunder-5mortality,eitherdirectlyorviaheighteneduseofinterventions(Gakidouetal.2010,Wangetal.2014).
It ispossiblethatat leastsomeof thesegains inmalariaintervention coverage, receipt of other health interventions,maternal educational attainment, and improved sanitationhelpeddriveUganda’s progress in childhood survival.How-ever, quantifying their individual or collective impact ondeclining ratesof under-5mortalitywas not analytically fea-sible. Until greater investments are made in strengtheninghealthinformationsystemsandroutinelycollectinglocaldata,demonstrating the impact ofmalaria interventions — or anyhealthprogram—mayremainquitechallenging.
Eveninmoredata-richenvironments,itisnoteasytoparseout how much interventions individually have contributedtoward reductions in under-5mortality (IHME 2014a). Yet itiscriticaltoassesstheirrelative—orjoint—contributions,asoften interventions are scaled up and socio-demographicchanges occur within the same broader health context. Ex-panding theuseofprospective impactevaluations, suchasIDRCandIHME’songoingassessmentofUganda’simmuniza-tionprograms(IHME2014c),willimproveourcollectiveabilitytodeterminewhatcontributestoimprovedhealthoutcomes.
Amidst Uganda’s areas of progress, IDRC and IHMEidentified some troubling trends that warrant further atten-tion. IPTp2coverage remainedquite lowover time,withnoregion exceeding 35% in 2011. Since 2002, Uganda’s clin-ical guidelines have stipulated that women should receiveat least twodosesofSPduringpregnancy (MOH2002),yetthis analysis shows that little, if any, improvement occurredforraisinglevelsofIPTp2.RegionaltrendsinANC4coverageconsistentlyexceededlevelsofIPTp2,indicatingthatwomenpotentiallyhadenoughcontactwiththehealthsystem,forthepurposesofantenatal care, to receiveat least twodosesofIPTp.FindingsfromtheAccess,Bottlenecks,Costs,andEquity(ABCE)projectinUgandashowedthatover90%offacilitiesstockedSPin2012(IHME2014b),suggestingthatlowIPTp2coveragemaynotbeadrugstockingissue.Localizedstudies
pointtoproviderprescriptionpracticesasapossibleexplana-tionforpersistentlylowlevelsofIPTp2(Sangaréetal.2010);further investigation is needed to determine whether thisresult is broadly applicable throughout Uganda and acrosslevelsofcare.
Immunization coverage steadily improved throughoutUganda,anotablesuccessgiventhatsomeregionsrecordedcoveragebelow60%forthemeaslesvaccineduringtheearly1990s. Nonetheless, absolute levels of coverage for mostroutine immunizations, particularly polio and measles, re-mainedlowerthanoptimalby2011.Outbreaksofwildpoliovirusoccurredin2009andthefollowingyears,whileUgandacontinues to experiencemeasles outbreaks in a number ofdistricts(MOH2010a).Itispossiblethatevenfewerchildrenare receiving effectiveprotection against thesediseases, asanotableportionofUgandanhealthfacilitieswerefoundtostore vaccines at temperatures outside the recommendedrange in 2012 (IHME 2014b,WHO 2006). Uganda plans to introducenewvaccinesover thenext fewyears,suchas IPVand the human papillomavirus (HPV) vaccine (MOH 2013),as well as achieve its RED goals. New vaccine introduction requiressubstantialresources,rangingfromtrainedmedicalstaffandfunctionalfacilityequipmenttoproperfundingandtimingofsocialmobilizationactivities,andcaneasilyburdenroutine immunization systems. As Uganda rolls out new vaccines,itwillalsobeimportantforthecountrytoprioritizemaintaining its gains in immunization coverage, as well as increasinglevelsofcurrentlyusedvaccinesinmanyregions.
Overall,theproportionofpregnantwomenwhosoughtaminimumoffourantenatalcarevisitsremainedmoderatelylowbetween1990and2011,withanumberofregionsrecordingsteady declines in ANC4 coverage. In several regions, lessthan50%ofpregnantwomenhadfourantenatalvisitsin2011,suggestingthatthemajorityofwomenintheseregionsarenotreceiving thenumberofantenatalcarevisits recommendedby Ugandan clinical guidelines (MOH 2002). Recognizingthatantenatalcareservicesarelinkedtobettermaternalandchildhealthoutcomes(WHO2003),Ugandashouldconsider addressingitsminimalimprovementsinANC4coverage.
Uganda is in the process of formalizing its 2014–2020malaria reduction strategic plan, throughwhich the countrystrivestomakeprogresstowarda“malaria-freeUganda.” Itsambitious strategic objectives include achieving universalcoverageof long-lastinginsecticide-treatednets(LLINs)andIPTp2 by 2017. Given that regional levels of coverage re-mainedlowerthantheinterventiontargetssetformid-2010,thecountrymayneedtoconsiderstrategiestofurtherexpandand sustain higher levels of malaria intervention coverageinordertomeetits2017goals.Forinstance,thePresident’sMalaria Initiative (PMI), World Vision, the United KingdomDepartment for International Development (DFID), and the
Conclusions and policy implications

1 5
GlobalFundtoFightAIDS,TuberculosisandMalariarecentlyfunded one of the largest net distribution campaigns inUgandatodate(PMI2014),anditislikelythatestimatesofITNcoveragefor2014willbeconsiderablyhigherpost-campaign.
AsdemonstratedthroughtheMCPAprojectinUganda,aswellas theproject’sfindings fromZambia (IHME2014a),na-tionaltrendscanmasksignificantsubnationaldifferences.Theregionalprofilesincludedinthisreportprovideadata-drivenfoundation for benchmarking subnational performance andtargeting areas for improvement. Future analyses should in-clude developing methods to address Uganda’s frequentredistrictinginthepast,whichwouldallowforanevenmoregranular understanding of the country’s local health trends.Further,itisimportantforgovernmentstoprioritizecontinuedmonitoring anddata gathering at the district level tomakefutureanalysesmorerobustandtoprovidecriticalinputsfordecision-makingandpriority-settingbydistricthealthoffices.
TomaintainandfurtheradvancethehealthgainsUgandahas made in child survival, continued efforts dedicated todelivering a range of health interventions, including ma-laria control and treatment, are essential. Improving theregularandtimelycollectionoflocalhealthdatawillbecrucial for guiding policy decisions and resource allocation. Bystrengthening the use of subnational data and focusing onhealthgapsexperiencedbyareaswithinthecountry,Ugandawill be in the position to accelerate progress in childhood survivalandtopromotegreaterequalityinhealthattainmenttoallpopulations.

1 6
ReferencesFadnesLT,EngebretsenIMS,WamaniH,SemiyagaNB,Tylleskär,TumwineJK.InfantfeedingamongHIV-positivemothersandthegeneralpopulationmothers:comparisonoftwocross-sectionalsurveysinEasternUganda.BMC Public Health. 2009;9(124).
GakidouE,CowlingK,LozanoR,MurrayCJL.Increasededucationalattainmentanditseffectonchildmortalityin175countriesbetween1970and2009:asystematicanalysis.The Lancet.2010;376(9745):959-974.
GarnerP,GülmezogluAM.Drugsforpreventingmalariainpregnantwomen.Cochrane Database of Systematic Reviews.2006;4:No.:CD000169.
GethingPW,PatilAP,SmithDL,GuerraCA,ElyazarIRF,JohnstonGL,etal.Anewworldmalariamap:Plasmodium falciparum endemicityin2010.Malaria Journal.2011;10(378).
GreenE.Working Paper No. 24: Development as State-Making. District Creation and Decentralization in Uganda.DevelopmentStudiesInstitute,LondonSchoolofEconomics.2008.Accessed7July2014:http://www.lse.ac.uk/internationalDevelopment/research/crisisStates/download/wp/wpSeries2/WP242.pdf.
GuayLA,HomDL,MmiroF,PiwowarEM,KabengeraS,ParsonsJ,etal.Detectionofhumanimmunodeficiencyvirustype1(HIV-1)DNAandp24antigeninbreastmilkofHIV-1-infectedUgandanwomenandverticaltransmission.Pediatrics.1996;98(3):438-444.
InstituteforHealthMetricsandEvaluation(IHME).Assessing Impact, Improving Health: Progress in Child Health Across Districts in Zambia.Seattle,WA:IHME,2014a.
InstituteforHealthMetricsandEvaluation(IHME).Health Service Provision in Uganda: Assessing Facility Capacity, Costs of Care, and Patient Perspectives.Seattle,WA:IHME,2014b.
InstituteforHealthMetricsandEvaluation(IHME).GAVI Full Country Evaluations.Accessedon7July2014(c): http://www.healthdata.org/gavi.
NanyungaM,OremJN,KatoF,KaggwaM,KatureebeC,SawekaJ.Malariatreatmentpolicychangeandimplementation: thecaseofUganda.Malaria Research and Treatment.2011.doi:10.4061/2011/683167
President’sMalariaInitiative(PMI).President’s Malaria Initiative, Uganda: Malaria Operational Plan FY 2014.Washington,DC:PMI,2014.Accessedonline10July2014:http://www.pmi.gov/docs/default-source/default-document-library/malaria- operational-plans/fy14/uganda_mop_fy14.pdf?sfvrsn=10.
SangaréLR,StergachisA,BrentlingerPE,RichardsonBA,StaedkeSG,KiwuwaMS,etal.Determinantsofuseofintermittent preventivetreatmentofmalariainpregnancy:Jinja,Uganda.PLOS ONE.2010;5(11):e15066.
UgandaAIDSCommission(UAC).Global AIDS Response Progress Report: Country Progress Report, Uganda.Kampala,Uganda:UAC,2012.
UgandaBureauofStatistics(UBOS)andICFInternationalInc.Uganda Demographic and Health Survey 2011.Kampala,UgandaandCalverton,MD:UBOSandICFInternational,Inc.,2012.
UgandaMinistryofHealth(MOH).Uganda National Expanded Programme on Immunization Multi Year Plan, 2012–2016. Kampala,Uganda:MOH,2013.
UgandaMinistryofHealth(MOH).Uganda National Expanded Programme on Immunization Multi Year Plan, 2010–2014. Kampala,Uganda:MOH,2010a.

17
UgandaMinistryofHealth(MOH).The Status of the HIV/AIDS Epidemic in Uganda: The HIV/AIDS Epidemiological Surveillance Report 2010.Kampala,Uganda:MOH,2010b.
UgandaMinistryofHealth(MOH).Health Sector Strategic Plan III, 2010/11–2014/15.Kampala,Uganda:MOH,2010c.
UgandaMinistryofHealth(MOH).Uganda Health Sector Strategic Plan II, 2005/06–2009/10.Kampala,Uganda:MOH,2005a.
UgandaMinistryofHealth(MOH).Uganda Malaria Control Strategic Plan 2005/06–2009/10.Kampala,Uganda:MOH,2005b.
UgandaMinistryofHealth(MOH).The National Policy Guidelines and Service Standards for Reproductive Health Services. Kampala,Uganda:MOH,2002.
WangH,LiddellCA,CoatesMM,MooneyMD,LevitzCE,SchumacherAE,onbehalfoftheGlobalBurdenofDiseases, Injuries,andRiskFactorsStudy2013(GBD2013).Global,regional,andnationallevelsofneonatal,infant,andunder-5mortalityduring1990–2013:asystematicanalysisfortheGlobalBurdenofDiseaseStudy2013.The Lancet.2014.doi:10.1016/S0140-6736(14)60497-9.
WorldHealthOrganization(WHO).World Malaria Report, 2005.Geneva,Switzerland:WHO,2006a.
WorldHealthOrganization(WHO).Guidelines on Stability Evaluation of Vaccines.Geneva,Switzerland:WHO,2006b.
WorldHealthOrganization(WHO).Antenatal Care in Developing Countries: Promises, Achievements, and Missed Opportunities: an Analysis of Trends, Levels, and Differentials, 1990–2001.Geneva,Switzerland:WHO,2003.

1 8
Inordertocomprehensivelyassesstrendsinchildhealthout-comes,interventioncoverage,andsocio-demographicfactorsin a data-driven, systematicway, theMCPA research team’smethodologicalapproachtookplaceintwomainsteps:
(1) Collating data and generating source-specific estimates. The MCPA research team brought together a broad rangeofdatasources includingsurveys,populationcensuses,andadministrative databases, to generate source-specific esti-mates for all indicators of interest. Birth histories, whereinwomen are interviewed about the survival of their children,were extracted from surveys and censuses to generate esti-matesofunder-5mortalityforparticularyears.Forchildhoodunderweight, health interventions, and socio-demographic indicators, regional estimates were also produced using surveysandcensuses.
In total, 17household surveys and twopopulation cen-suseswereincludedinthefinalanalysis.
(2) estimating trends for 10 regions from 1990 to 2011. Given the range of data types assembled for the MCPAproject, statistical modeling approaches had to be used inorder to synthesize the estimates from those different datasourcesintoaunifiedtrend.
Forunder-5mortality,generalizedlinearmixedeffectsre-gressionwasusedtobringtogetherthedisparateestimates.Thismodelincorporatedexplicitspatialandtemporaltermsinordertoborrowstrengthbetweendifferentregionsandovertime.Thesetermsalsoallowedfordata-drivenadjustmentsforanydiscrepanciesobservedbetweenthedifferentsourcesofdata.Asimulatedvalidationenvironmentwasusedtoassessexpectedmodelperformanceintermsofbias,efficiency,andconfidenceintervalcoverage.
For all other indicators, a two-step modeling approachwas used to generate regional trends between 1990 and2011.First,alinearmodelwasfittoallofthesource-specificestimates, applying a one-knot natural spline and includingrandominterceptsandslopesforeachregion.ThepredictedtrendfromthisregressionwasusedasafunctionforGaussianProcess Regression (GPR), a statistical modeling techniquespecificallydesignedforinterpolatingnon-lineartrends.GPRallowedforthetemporalsmoothingoftrends,aswellastheestimationof95%confidenceintervals.
Annex 1. Overview of the MCPA analytical approach and methods

1 9
Regional profiles Trackingtrendsinchildhealthoutcomes,interventioncoverage,andsocio-demographicfactorsatsubnationallevelsprovidestimely,useful,andactionableinformationtolocalandnationalpolicymakersinUganda.
Inthesectionthatfollows,regionalprofilesareorderedalphabetically,witheachprofileproviding“barometers”for2011.Thesebarometerscompareagivenregion’sperformanceonkeychildhealthoutcomes,interventions,andsocio-demographicindicators to the national average and the range observed across regions in Uganda. Further, each profile details trends estimatedforeachgroupofindicators:childhealthoutcomes,malariainterventions,immunizations,othermaternalandchildhealthinterventions,andsocio-demographicfactorsrelatedtohealth.
Theseregionalprofilesaimtoprovideafoundationfromwhichhealthanddevelopmentofficialscanassesschildhealthstatusatmorelocallevelsandthentargethigh-priorityareasforimprovement. IndividualprofilescanbedownloadedfromIHME’sGHDx:http://ghdx.healthdata.org.

2 0
sUMMaRyBetween 1990 and 2011, all-cause under-5 mortality sub-stantially decreased in Central 1, whereas less pronouncedprogress occurred for the prevalence of childhood under-weight.Prioritizingeffortstofurtheraccelerategainsinchildhealth outcomes, especially for childhood underweight,shouldbeconsidered.
ITNs and the receipt ofACTswere quickly scaled up inCentral 1, whereas IPTp2 coverage remained quite low. Al-though the region recorded improvement in immunizationcoverage, Central 1 nonetheless fell below the national av-erageformostkeychildhoodvaccinesin2011.From1990to2011, coverage of exclusive breastfeeding and ANC4 stag-natedordeclined,whereas theproportionof childrenwhosoughtcareforsuspectedpneumoniasteadilyincreased.
Theregiondocumentedgainsintheproportionofhouse-holds with improved sanitation, exceeding the nationalaveragein2011.Incomparisontothenationaltrend,Central1 consistently averaged higher levels of educational attain-ment among women of reproductive age. Conversely, theregionpersistentlyfellbelowthenationalaverageforhouse-holdaccesstoimprovedwatersources.
In2011,Central1generallymetorexceededthenationalaverage for malaria interventions and maternal and childhealthinterventionsbutfellbelowforimmunizations.Exceptforaccess to improvedwater sources, the regionexceededthenationalaverage for socio-demographic factors. Incom-parisonwith thenational average,Central1 showedsimilarlevelsofunder-5mortalityandchildhoodunderweight.
Malaria Immunizations Maternal and child health
INTERVENTIONS
ACT for fever, under-5
IPTp(2 doses)
Exclusivebreastfeeding
Antenatal care(4 visits)
ITNownership
ITN use, under-5
BCG PentavalentMeasles Polio Skilled birthattendance
Care for suspected
pneumonia
0
20
40
60
80
100
Perc
ent (
%)
Dea
ths
per
1,0
00 li
ve b
irth
s
40
60
80
100
120
140
CHILD HEALTH OUTCOMES
Childhoodunderweight
Under-5mortality
Household characteristics Educational attainment
SOCIO-DEMOGRAPHIC FACTORS
Improved sanitation
Improved water
0
20
40
60
80
100
Perc
ent (
%)
0
20
40
60
80
100
Perc
ent (
%)
Women of reproductive age
0
2
4
6
8
10
Ave
rag
e ye
ars
Range observed across regions
National average
Central 1
Range observed across regions
National average
Central 1
note:Estimatesofinterventioncoveragearefor2011,withbetterperformancereflectedbyhigherlevelsofcoverage.
Central 1
note:Estimatesofchildhealthoutcomesandsocio-demographicfactorsarefor2011.Betterperformanceisshownbylowerlevelsofchildhealthoutcomesandhigherlevelsforsocio-demographicfactors.

2 1
ITNownership remainedbelow10%until2007,afterwhichcoverage rapidly rose to 64% in 2011 (95%CI: 38%, 83%),toppingthenationalaverageof59%(95%CI:36%,79%).
Theuseof ITNsbychildrenunder5yearsold increasedquickly from9% in2007 (95%CI:5%,15%) to45% in2011(95%CI:27%,62%).ThislevelofITNusewashigherthanthenationalaverageof39% (95%CI:27%,53%). In this region,thedifferencebetween ITNownership and ITNuseby chil-drenunder5(19percentagepoints)wascomparabletowhatwasobservedatthenationallevel(20percentagepoints).
NodistrictsintheregionofCentral1hadformallyimple-mentedIRSasof2011.
ACTsformallybecameUganda’sfirst-linetreatmentforun-complicatedmalariain2006,andtheproportionofchildreninCentral1whoreceivedACTsinresponsetoexperiencinga feverquicklyescalatedthereafter.ReceiptofACTsamongfebrilechildrenunder5increasedfrom10%in2008(95%CI:7%,16%)to48%in2011(95%CI:35%,60%),whichwascom-parabletothenationalaverageof49%(95%CI:34%,65%).
Theproportionofpregnantwomenwho received IPTp2remained below 10% until 2005, after which coverage in-creasedto27%in2009(95%CI:16%,42%).IPTp2coveragedippedto26%in2011(95%CI:15%,44%),whichwasslightlylowerthanthenationalaverageof29%(95%CI:15%,50%).
MALARIA INTERVENTIONS
ITN ownership
0
20
40
60
80
100
1990 1995 2000 2005 2010
ITN use by children under 5
0
20
40
60
80
100
1990 1995 2000 2005 2010
IPTp (2 doses)
0
20
40
60
80
100
1990 1995 2000 2005 2010
ACT received by febrile children under 5
0
20
40
60
80
100
1990 1995 2000 2005 2010
All-cause under-5 mortality
40
120
200
280
1990 1995 2000 2005 2010
Childhood underweight
0
20
40
60
80
100
1990 1995 2000 2005 2010
From1990 to2011, the regionofCentral1 recordeda sig-nificant reduction in all-cause under-5 mortality, dropping44%from149deathsper1,000 livebirths in1990 (95%CI:126,175)to83in2011(95%CI:66,103).In2011,theregion’sunder-5mortality was similar to the national average of 85deathsper1,000livebirths(95%CI:79,93).
TheproportionofchildrenwhowereunderweightinCen-tral 1 remained around 18% during the 1990s, after whichprevalence declined to 14% in 2008 (95% CI: 12%, 18%)andremainedat14%through2011.This levelofchildhood underweightequaledthenationalaveragein2011.
CHILD HEALTH OUTCOMES
Deathsper1,000livebirths
Percent(%)
Percent(%)
Nationaltrend Central1 Uncertaintyinterval

2 2
TheproportionofchildrenwhoreceivedtheBCGvaccinere-mainedbelow80%until2004,afterwhichcoverageincreasedto89%in2011(95%CI:80%,94%).ThislevelofBCGimmu-nizationwaslowerthanthenationalaverageof94%(95%CI:89%,97%)andamongthelowestinUgandafor2011.
Measles immunization steadily rose from 61% in 1990(95%CI:33%,83%)to83%in2011(95%CI:69%,91%),whichwasslightlylowerthanthenationalaverageof85%(95%CI:75%,91%).
Coverageofpolioimmunizationremainedrelativelycon-sistentfrom1990to2011,generallyhoveringbetween70%and
75%duringthistime.In2011,polioimmunizationcoveragewas69%inCentral1 (95%CI:44%,87%),whichwas lowerthanthenationalaverageof76%(95%CI:52%,90%)andamongthelowestinUganda.
The pentavalent vaccine was formally introduced inUgandain2002,afterwhichcoverageinCentral1rapidlyin-creasedfrom32%in2004(95%CI:11%,62%)to75%in2010(95%CI:51%,89%).This levelofpentavalentcoveragewassustainedthrough2011,andwascomparabletothenationalaverageof77%(95%CI:51%,92%).
IMMUNIZATIONS
BCG immunization
0
20
40
60
80
100
1990 1995 2000 2005 2010
Measles immunization
0
20
40
60
80
100
1990 1995 2000 2005 2010
Polio immunization
0
20
40
60
80
100
1990 1995 2000 2005 2010
Pentavalent immunization
0
20
40
60
80
100
1990 1995 2000 2005 2010
ANC4 coverage remained fairly consistent between 1990and2011,slightlydecliningfrom60%in1990(95%CI:35%,79%)to50%in2008(95%CI:39%,60%).ANC4coveragere-mainedat50%through2011,slightlyhigherthanthenationalaverageof47%(95%CI:41%,54%).
Skilledbirthattendancegraduallyincreasedfrom48%in1990(95%CI:24%,76%)to63%in2011(95%CI:45%,78%),whichwas slightly higher than thenational averageof 60%(95%CI:47%,73%).
Theproportionofchildrenwhowereexclusivelybreastfedrose from46% in1990 (95%CI:22%,73%) to67% in2003(95%CI:54%,77%).Exclusivebreastfeedingcoverageremained
atthislevelthrough2005,afterwhichlevelsdeclinedto59%in 2011 (95% CI: 44%, 73%). While this level of exclusivebreastfeeding was comparable to the national average of61%(95%CI:54%,67%),theregion’sdownwardtrendincov-erageiscauseforconcern.
Servingasproxyforhealthsystemaccess,theproportionof children under 5 who sought care for suspected pneu-moniarapidlyincreasedfrom24%in1990(95%CI:12%,44%)to82%in2007(95%CI:75%,87%),andremainedatthislevelthrough2011.Bycontrast,thenationalaveragewaslowerin2011,at77%(95%CI:76%,78%).
MATERNAL AND CHILD HEALTH INTERVENTIONS
Antenatal care (4 visits)
0
20
40
60
80
100
1990 1995 2000 2005 2010
Skilled birth attendance
0
20
40
60
80
100
1990 1995 2000 2005 2010
Exclusive breastfeeding
0
20
40
60
80
100
1990 1995 2000 2005 2010
Care-seeking for suspected pneumonia
0
20
40
60
80
100
1990 1995 2000 2005 2010
CENTRAL 1,continuedPercent(%)
Percent(%)
Nationaltrend Central1 Uncertaintyinterval

2 3
Amongwomenof reproductive age (15 to 44 years old) inCentral1,theaverageyearsofeducationattainedincreased57%between1990and2011, rising from4.7years in1990(95%CI:3.8,5.6)to7.4yearsin2011(95%CI:6.7,8.2).Thislevelofeducationalattainmentfarexceededthenationalav-eragein2011,whichwas6.2years(95%CI:5.9,6.4),andwasamongthehighestinUgandaforthatyear.
Household access to improved sanitation (a flush toiletorcoveredpit latrine) increasedfrom57%in1990(95%CI:32%,79%)to85%in2011(95%CI:78%,89%).This levelofimprovedsanitationwashigherthanthenationalaverageof79%in2011(95%CI:76%,81%).
Central1recordedsubstantialprogressinhouseholdac-cesstoimprovedwatersources(e.g.,pipedwater,protectedwells, protected springs), rising from36% in 1990 (95%CI:20%,56%)to64%in2011(95%CI:56%,72%).Despitethisprogress,theproportionofhouseholdswithimprovedwaterwaslowerinCentral1thanthenationalaverage,whichwas76%in2011(95%CI:73%,79%).
SOCIO-dEMOgRAPhIC fACTORS
Maternal educational attainment
0
2
4
6
8
10
1990 1995 2000 2005 2010
Access to improved sanitation
0
20
40
60
80
100
1990 1995 2000 2005 2010
Access to improved water sources
0
20
40
60
80
100
1990 1995 2000 2005 2010
Averageyears
Percent(%)
2 4
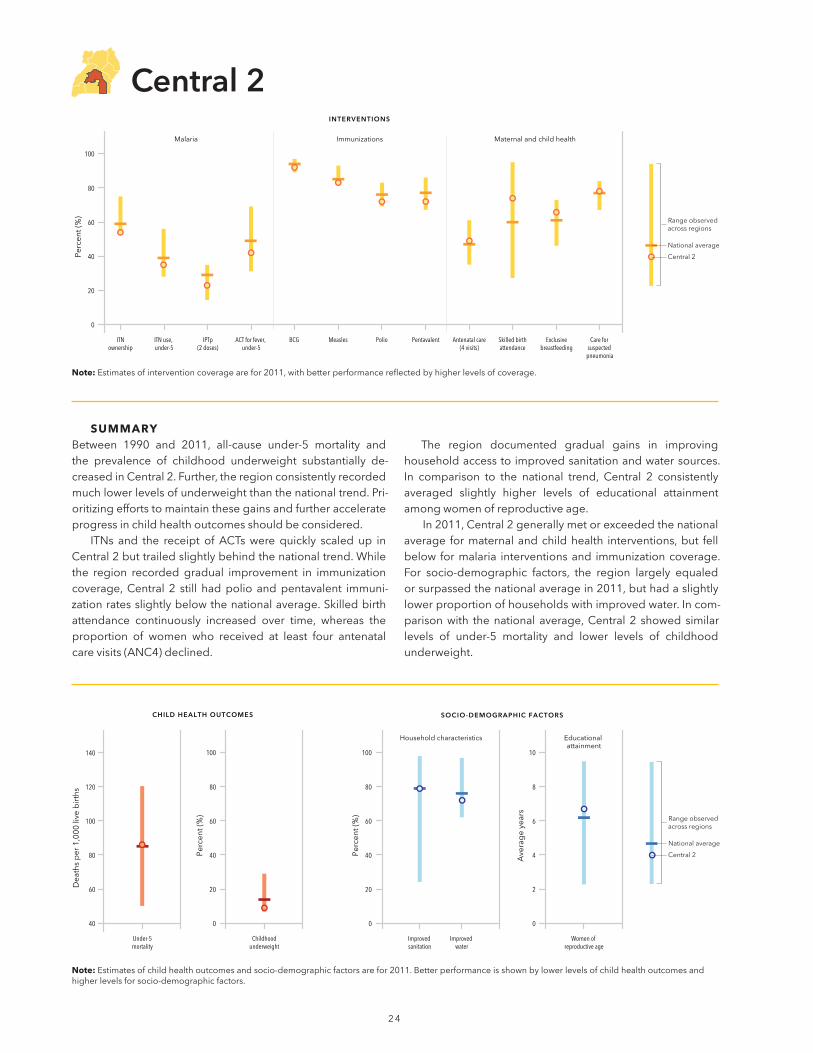
sUMMaRyBetween 1990 and 2011, all-cause under-5 mortality andthe prevalence of childhood underweight substantially de-creasedinCentral2.Further,theregionconsistentlyrecordedmuchlowerlevelsofunderweightthanthenationaltrend.Pri-oritizingeffortstomaintainthesegainsandfurtheraccelerateprogressinchildhealthoutcomesshouldbeconsidered.
ITNs and the receipt ofACTswere quickly scaled up inCentral2buttrailedslightlybehindthenationaltrend.Whilethe region recorded gradual improvement in immunizationcoverage,Central 2 still hadpolio andpentavalent immuni-zationratesslightlybelowthenationalaverage.Skilledbirthattendance continuously increased over time, whereas theproportion of women who received at least four antenatalcarevisits(ANC4)declined.
The region documented gradual gains in improvinghouseholdaccesstoimprovedsanitationandwatersources.In comparison to the national trend, Central 2 consistentlyaveraged slightly higher levels of educational attainmentamongwomenofreproductiveage.
In2011,Central2generallymetorexceededthenationalaverage formaternalandchildhealth interventions,but fellbelow formalaria interventionsand immunizationcoverage.For socio-demographic factors, the region largely equaledorsurpassedthenationalaveragein2011,buthadaslightlylowerproportionofhouseholdswithimprovedwater.Incom-parisonwith thenational average,Central2 showedsimilarlevels of under-5 mortality and lower levels of childhood underweight.
Malaria Immunizations Maternal and child health
INTERVENTIONS
ACT for fever, under-5
IPTp(2 doses)
Exclusivebreastfeeding
Antenatal care(4 visits)
ITNownership
ITN use, under-5
BCG PentavalentMeasles Polio Skilled birthattendance
Care for suspected
pneumonia
0
20
40
60
80
100
Perc
ent (
%)
Dea
ths
per
1,0
00 li
ve b
irth
s
40
60
80
100
120
140
CHILD HEALTH OUTCOMES
Childhoodunderweight
Under-5mortality
Household characteristics Educational attainment
SOCIO-DEMOGRAPHIC FACTORS
Improved sanitation
Improved water
0
20
40
60
80
100
Perc
ent (
%)
0
20
40
60
80
100
Perc
ent (
%)
Women of reproductive age
0
2
4
6
8
10
Ave
rag
e ye
ars
Range observed across regions
National average
Central 2
Range observed across regions
National average
Central 2
note:Estimatesofinterventioncoveragearefor2011,withbetterperformancereflectedbyhigherlevelsofcoverage.
Central 2
note:Estimatesofchildhealthoutcomesandsocio-demographicfactorsarefor2011.Betterperformanceisshownbylowerlevelsofchildhealthoutcomesandhigherlevelsforsocio-demographicfactors.

2 5
ITNownership remainedbelow10%until2007,afterwhichcoverageroseto54%in2011(95%CI:29%,79%).ThislevelofITNownershipwaslowerthanthenationalaverageof59%in2011(95%CI:36%,79%).
Theuseof ITNsbychildrenunder5yearsold increasedfrom9%in2007(95%CI:5%,17%)to35%in2011(95%CI:21%,51%).ThislevelofITNusewaslowerthanthenationalaverageof39%(95%CI:27%,53%).Inthisregion,thediffer-encebetweenITNownershipandITNusebychildrenunder5 (19 percentage points) was comparable to what was ob-servedatthenationallevel(20percentagepoints).
NodistrictsintheregionofCentral2hadformallyimple-mentedIRSasof2011.
ACTsformallybecameUganda’sfirst-linetreatmentforun-complicatedmalariain2006,andtheproportionofchildreninCentral2whoreceivedACTsinresponsetoexperiencingafeverrosethereafter.ReceiptofACTsamongfebrilechildrenunder5increasedfrom9%in2008(95%CI:6%,14%)to42%in2011(95%CI:30,55%),whichwaslowerthanthenationalaverageof49%(95%CI:34%,65%).
Theproportionofpregnantwomenwho received IPTp2remainedbelow10%until2005,afterwhichcoverageslightlyincreasedto23%in2010(95%CI:13%,36%).IPTp2coveragestayed at 23% through 2011, whichwas lower than the na-tionalaverageof29%(95%CI:15%,50%).
MALARIA INTERVENTIONS
ITN ownership
0
20
40
60
80
100
1990 1995 2000 2005 2010
ITN use by children under 5
0
20
40
60
80
100
1990 1995 2000 2005 2010
IPTp (2 doses)
0
20
40
60
80
100
1990 1995 2000 2005 2010
ACT received by febrile children under 5
0
20
40
60
80
100
1990 1995 2000 2005 2010
All-cause under-5 mortality
40
120
200
280
1990 1995 2000 2005 2010
Childhood underweight
0
20
40
60
80
100
1990 1995 2000 2005 2010
From1990 to2011, the regionofCentral2 recordeda sig-nificant reduction in all-cause under-5 mortality, dropping44%from154deathsper1,000 livebirths in1990 (95%CI:131,179)to86in2011(95%CI:70,106).In2011,theregion’sunder-5mortality was similar to the national average of 85deathsper1,000livebirths(95%CI:79,93).
TheproportionofchildrenwhowereunderweightinCen-tral2decreasedfrom15%in1990(95%CI:10%,23%)to9%in 2008 (95%CI: 7%, 12%). Prevalenceof childhoodunder-weightremainedat9%through2011,whichwaswellbelowthenationalaverageof14%(95%CI:12%,15%)andamongthelowestinUganda.
CHILD HEALTH OUTCOMES
Nationaltrend Central2 Uncertaintyinterval
Deathsper1,000livebirths
Percent(%)
Percent(%)

2 6
The proportion of children who received the BCG vaccinesteadilyincreasedfrom78%intheearly1990sto92%in2010(95%CI:86%,95%).ThislevelofBCGimmunizationwassus-tainedthrough2011,whichwascomparabletothenationalaverageof94%(95%CI:89%,97%).
Measles immunization rose from 62% in 1990 (95% CI:37%,82%)to83%in2011(95%CI:70%,90%),whichwassim-ilartothenationalaverageof85%(95%CI:75%,91%).
Coverageofpolioimmunizationremainedrelativelycon-sistentfrom1990to2011,generallyhoveringbetween70%and
80%duringthistime.In2011,polioimmunizationcoveragewas72%inCentral2(95%CI:46%,88%),whichwasslightlylowerthanthenationalaverageof76%(95%CI:52%,90%).
The pentavalent vaccine was formally introduced inUgandain2002,afterwhichcoverageinCentral2increasedfrom32%in2004(95%CI:12%,61%)to72%in2010(95%CI:50%,88%).Thislevelofpentavalentcoveragewassustainedthrough 2011, and was slightly lower than the national av-erageof77%(95%CI:51%,92%).
IMMUNIZATIONS
BCG immunization
0
20
40
60
80
100
1990 1995 2000 2005 2010
Measles immunization
0
20
40
60
80
100
1990 1995 2000 2005 2010
Polio immunization
0
20
40
60
80
100
1990 1995 2000 2005 2010
Pentavalent immunization
0
20
40
60
80
100
1990 1995 2000 2005 2010
ANC4coveragegraduallydeclinedfrom69%in1990(95%CI:45%,84%)to49%in2010(95%CI:39%,61%),andremainedat49%through2011.ThislevelofANC4wascomparabletothenationalaverageof47%(95%CI:41%,54%),butthere-gion’sdownwardtrendincoverageiscauseforconcern.
Skilledbirth attendance steadily rose from50% in 1990(95%CI:25%,76%)to74%in2011(95%CI:58%,85%), farexceedingthenationalaverageof60%(95%CI:47%,73%).
Theproportionofchildrenwhowereexclusivelybreastfedhoveredaround60%until2006,afterwhichcoveragegradu-
allyincreasedto66%in2011(95%CI:51%,79%).Thislevelofexclusivebreastfeedingwasslightlyhigherthanthenationalaverageof61%(95%CI:54%,67%).
Servingasproxyforhealthsystemaccess,theproportionof children under 5 who sought care for suspected pneu-moniarapidlyincreasedfrom25%in1990(95%CI:12%,44%)to82%in2004(95%CI:75%,87%).Coverageofthishealth-care-seeking behavior was sustained through 2006 beforedippingto78%in2011(95%CI:68%,85%),alevelsimilartothenationalaverageof77%(95%CI:76%,78%).
MATERNAL AND CHILD HEALTH INTERVENTIONS
Antenatal care (4 visits)
0
20
40
60
80
100
1990 1995 2000 2005 2010
Skilled birth attendance
0
20
40
60
80
100
1990 1995 2000 2005 2010
Exclusive breastfeeding
0
20
40
60
80
100
1990 1995 2000 2005 2010
Care-seeking for suspected pneumonia
0
20
40
60
80
100
1990 1995 2000 2005 2010
CEnTRAl 2,continuedPercent(%)
Nationaltrend Central2 Uncertaintyinterval
Percent(%)

27
Amongwomenof reproductive age (15 to 44 years old) inCentral2,theaverageyearsofeducationattainedincreased67%between1990and2011,risingfromfouryearsin1990(95%CI:3.3,4.8) to6.7years in2011 (95%CI:6,7.4).Thislevelof educational attainmentwas slightlyhigher than thenationalaveragein2011,whichwas6.2years(95%CI:5.9,6.4).
Householdaccesstoimprovedsanitation(aflushtoiletorcoveredpit latrine) increased from54%ofhouseholdswithimproved sanitation in 1990 (95%CI: 29%, 76%) to 79% in
2010 (95%CI: 71%,84%).This levelof improved sanitationwas sustained through2011,equaling thenational averageforthatyear.
Central2recordedgradualprogressinhouseholdaccesstoimprovedwatersources(e.g.,pipedwater,protectedwells,protectedspring),risingfrom60%in1990(95%CI:40%,77%)to72%in2011(95%CI:64%,79%).Thislevelofaccesstoim-provedwaterwasslightlylowerthanthenationalaverageof76%in2011(95%CI:73%,79%).
SOCIO-dEMOgRAPhIC fACTORS
Maternal educational attainment
0
2
4
6
8
10
1990 1995 2000 2005 2010
Access to improved sanitation
0
20
40
60
80
100
1990 1995 2000 2005 2010
Access to improved water sources
0
20
40
60
80
100
1990 1995 2000 2005 2010
Averageyears
Percent(%)
2 8
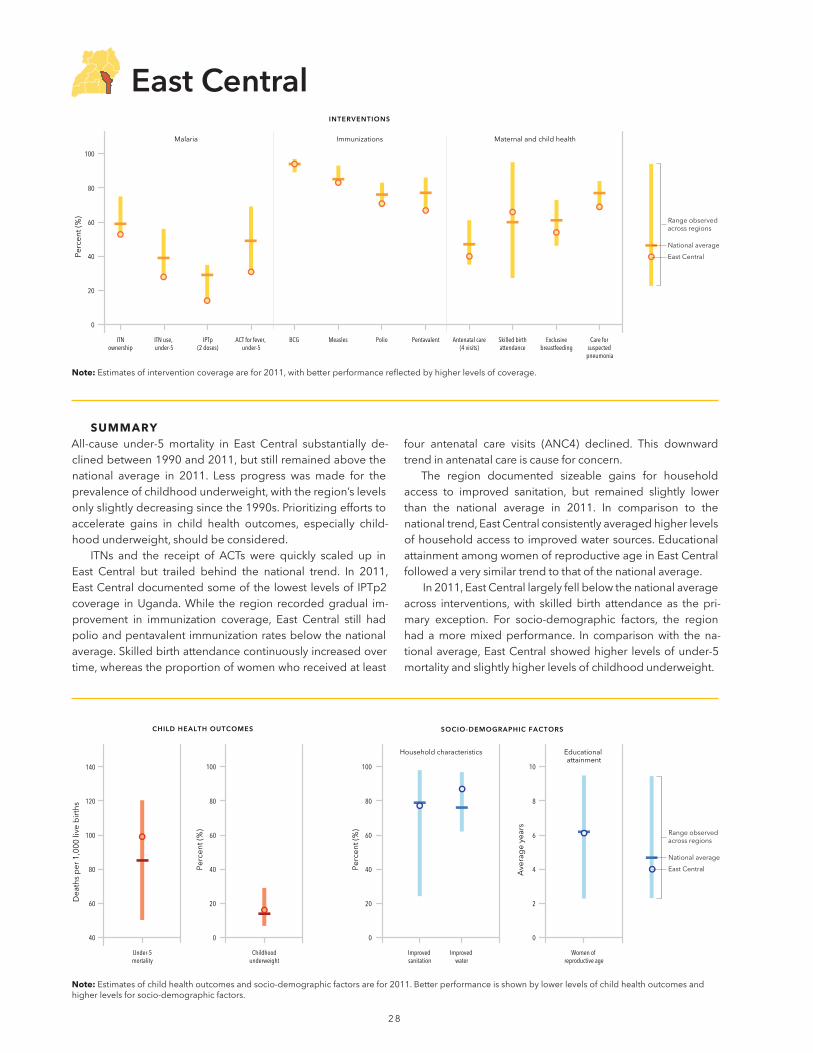
sUMMaRyAll-cause under-5 mortality in East Central substantially de-clinedbetween1990and2011,butstillremainedabovethenational average in 2011. Less progress was made for theprevalenceofchildhoodunderweight,withtheregion’slevelsonlyslightlydecreasingsincethe1990s.Prioritizingeffortstoaccelerate gains in child health outcomes, especially child-hoodunderweight,shouldbeconsidered.
ITNs and the receipt of ACTs were quickly scaled up inEast Central but trailed behind the national trend. In 2011,EastCentraldocumentedsomeofthelowest levelsof IPTp2coverage inUganda.While the region recordedgradual im-provement in immunization coverage, East Central still hadpolioandpentavalentimmunizationratesbelowthenationalaverage.Skilledbirthattendancecontinuouslyincreasedovertime,whereastheproportionofwomenwhoreceivedatleast
four antenatal care visits (ANC4) declined. This downwardtrendinantenatalcareiscauseforconcern.
The region documented sizeable gains for household access to improved sanitation, but remained slightly lowerthan the national average in 2011. In comparison to the nationaltrend,EastCentralconsistentlyaveragedhigherlevelsofhouseholdaccesstoimprovedwatersources.EducationalattainmentamongwomenofreproductiveageinEastCentralfollowedaverysimilartrendtothatofthenationalaverage.
In2011,EastCentrallargelyfellbelowthenationalaverageacross interventions,with skilledbirth attendance as the pri-mary exception. For socio-demographic factors, the regionhad amoremixedperformance. In comparisonwith the na-tionalaverage,EastCentralshowedhigher levelsofunder-5mortalityandslightlyhigherlevelsofchildhoodunderweight.
Malaria Immunizations Maternal and child health
INTERVENTIONS
ACT for fever, under-5
IPTp(2 doses)
Exclusivebreastfeeding
Antenatal care(4 visits)
ITNownership
ITN use, under-5
BCG PentavalentMeasles Polio Skilled birthattendance
Care for suspected
pneumonia
0
20
40
60
80
100
Perc
ent (
%)
Dea
ths
per
1,0
00 li
ve b
irth
s
40
60
80
100
120
140
CHILD HEALTH OUTCOMES
Childhoodunderweight
Under-5mortality
Household characteristics Educational attainment
SOCIO-DEMOGRAPHIC FACTORS
Improved sanitation
Improved water
0
20
40
60
80
100
Perc
ent (
%)
0
20
40
60
80
100
Perc
ent (
%)
Women of reproductive age
0
2
4
6
8
10
Ave
rag
e ye
ars
Range observed across regions
National average
East Central
Range observed across regions
National average
East Central
note:Estimatesofinterventioncoveragearefor2011,withbetterperformancereflectedbyhigherlevelsofcoverage.
East Central
note:Estimatesofchildhealthoutcomesandsocio-demographicfactorsarefor2011.Betterperformanceisshownbylowerlevelsofchildhealthoutcomesandhigherlevelsforsocio-demographicfactors.
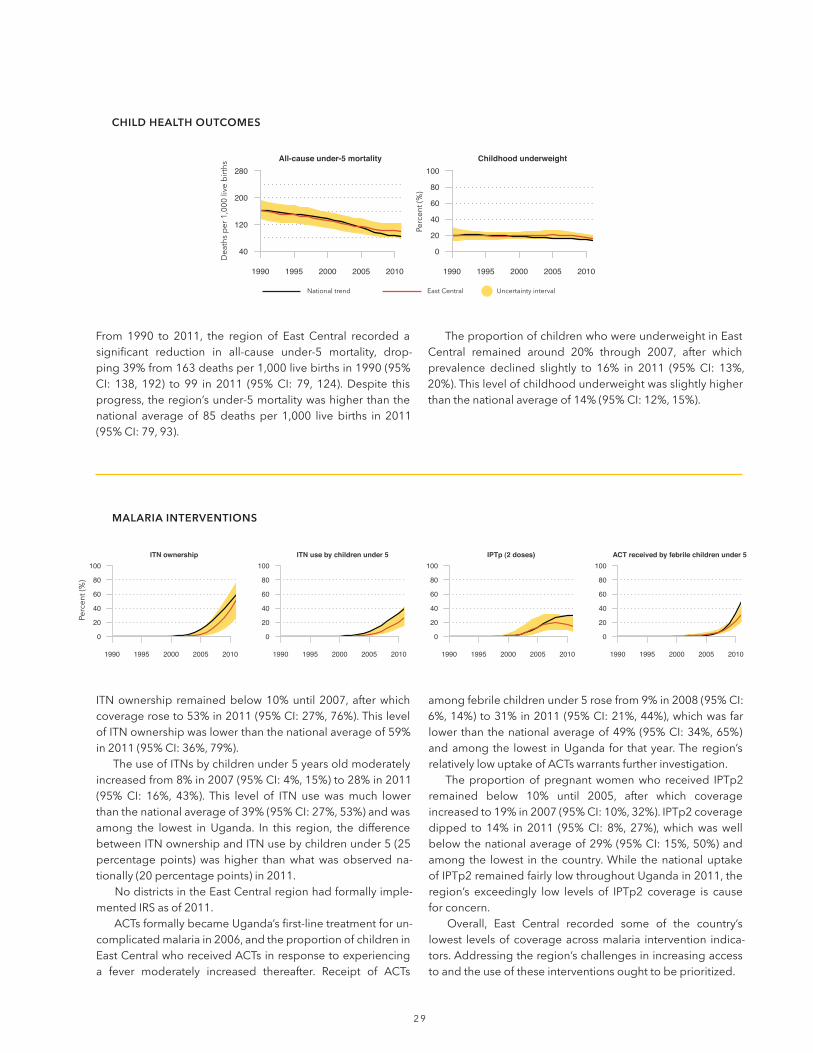
2 9
ITNownership remainedbelow10%until2007,afterwhichcoverageroseto53%in2011(95%CI:27%,76%).ThislevelofITNownershipwaslowerthanthenationalaverageof59%in2011(95%CI:36%,79%).
TheuseofITNsbychildrenunder5yearsoldmoderatelyincreasedfrom8%in2007(95%CI:4%,15%)to28%in2011(95%CI: 16%, 43%). This level of ITN use wasmuch lowerthanthenationalaverageof39%(95%CI:27%,53%)andwasamong the lowest in Uganda. In this region, the differencebetweenITNownershipandITNusebychildrenunder5(25percentagepoints)was higher thanwhatwas observed na-tionally(20percentagepoints)in2011.
NodistrictsintheEastCentralregionhadformallyimple-mentedIRSasof2011.
ACTsformallybecameUganda’sfirst-linetreatmentforun-complicatedmalariain2006,andtheproportionofchildreninEastCentralwhoreceivedACTsinresponsetoexperiencinga fever moderately increased thereafter. Receipt of ACTs
amongfebrilechildrenunder5rosefrom9%in2008(95%CI:6%,14%)to31%in2011(95%CI:21%,44%),whichwasfarlowerthanthenationalaverageof49%(95%CI:34%,65%)andamongthe lowest inUganda for thatyear.Theregion’srelativelylowuptakeofACTswarrantsfurtherinvestigation.
Theproportionofpregnantwomenwho received IPTp2remained below 10% until 2005, after which coverage increasedto19%in2007(95%CI:10%,32%).IPTp2coveragedipped to 14% in 2011 (95%CI: 8%, 27%),whichwaswellbelowthenationalaverageof29%(95%CI:15%,50%)andamong the lowest in thecountry.While thenationaluptakeofIPTp2remainedfairlylowthroughoutUgandain2011,theregion’s exceedingly low levels of IPTp2 coverage is cause for concern.
Overall, East Central recorded some of the country’slowest levelsofcoverageacrossmalaria intervention indica-tors.Addressingtheregion’schallengesinincreasingaccesstoandtheuseoftheseinterventionsoughttobeprioritized.
MALARIA INTERVENTIONS
ITN ownership
0
20
40
60
80
100
1990 1995 2000 2005 2010
ITN use by children under 5
0
20
40
60
80
100
1990 1995 2000 2005 2010
IPTp (2 doses)
0
20
40
60
80
100
1990 1995 2000 2005 2010
ACT received by febrile children under 5
0
20
40
60
80
100
1990 1995 2000 2005 2010
All-cause under-5 mortality
40
120
200
280
1990 1995 2000 2005 2010
Childhood underweight
0
20
40
60
80
100
1990 1995 2000 2005 2010
From 1990 to 2011, the region of East Central recorded asignificant reduction in all-cause under-5 mortality, drop-ping39%from163deathsper1,000livebirthsin1990(95%CI: 138, 192) to 99 in 2011 (95%CI: 79, 124).Despite thisprogress,theregion’sunder-5mortalitywashigherthanthenational averageof 85deathsper 1,000 livebirths in 2011(95%CI:79,93).
TheproportionofchildrenwhowereunderweightinEastCentral remained around 20% through 2007, after whichprevalence declined slightly to 16% in 2011 (95%CI: 13%,20%).Thislevelofchildhoodunderweightwasslightlyhigherthanthenationalaverageof14%(95%CI:12%,15%).
CHILD HEALTH OUTCOMES
Nationaltrend EastCentral Uncertaintyinterval
Deathsper1,000livebirths
Percent(%)
Percent(%)

3 0
Nationaltrend EastCentral Uncertaintyinterval
The proportion of children who received the BCG vaccinesteadilyrosefrom76%in1990(95%CI:58%,89%)to94%in2011(95%CI:88%,97%),equalingthenationalaverageforthatyear.
Measlesimmunizationsubstantiallyincreasedfrom53%in1990(95%CI:29%,76%)to83%in2011(95%CI:70%,91%),whichwassimilartothenationalaverageof85%(95%CI:75%,91%). East Central’s progress in elevating measles immuni-zation coverage isparticularly noteworthygiven its very lowlevelsofcoverageduringthe1990s.
Coverageofpolioimmunizationremainedrelativelyconsis-
tentfrom1990to2011,generallyhoveringbetween65%and 75%duringthistime.In2011,polioimmunizationcoveragewas71% in East Central (95%CI: 46%, 87%), which was slightlylowerthanthenationalaverageof76%(95%CI:52%,90%).
The pentavalent vaccine was formally introduced inUganda in 2002, after which coverage in East Central increasedfrom30%in2004(95%CI:11%,60%)to68%in2009(95%CI:47%,84%).Pentavalentvaccinecoveragedippedto67% in2011 (95%CI:42%,86%),whichwas lower than thenationalaverageof77%(95%CI:51%,92%)andamongthelowestinUgandaforthatyear.
IMMUNIZATIONS
BCG immunization
0
20
40
60
80
100
1990 1995 2000 2005 2010
Measles immunization
0
20
40
60
80
100
1990 1995 2000 2005 2010
Polio immunization
0
20
40
60
80
100
1990 1995 2000 2005 2010
Pentavalent immunization
0
20
40
60
80
100
1990 1995 2000 2005 2010
ANC4coverageremainedfairlylowbetween1990and2011,hoveringaround40%to45%forthatperiodoftime.In2011,ANC4coveragewasat40%(95%CI:28%,53%),whichwaslowerthanthenationalaverageof47%(95%CI:41%,54%).
Skilledbirthattendancegraduallyincreasedfrom52%in1990(95%CI:26%,77%)to66%in2011(95%CI:49%,80%),whichwas slightly higher than thenational averageof 60%(95%CI:47%,73%).
Theproportionofchildrenwhowereexclusivelybreastfedhoveredaround40%until2005,afterwhichcoverageincreased
to 54% in 2011 (95%CI: 38%, 68%).This level of exclusivebreastfeeding was lower than the national average of 61%(95%CI:54%,67%).
Servingasproxyforhealthsystemaccess,theproportionof children under 5 who sought care for suspected pneu-moniarosefrom26%in1990(95%CI:12%,47%)to69%in2011 (95%CI: 58%, 78%). This level of health-care-seekingbehaviorwaslowerthanthenationalaverageof77%(95%CI:76%,78%).
MATERNAL AND CHILD HEALTH INTERVENTIONS
Antenatal care (4 visits)
0
20
40
60
80
100
1990 1995 2000 2005 2010
Skilled birth attendance
0
20
40
60
80
100
1990 1995 2000 2005 2010
Exclusive breastfeeding
0
20
40
60
80
100
1990 1995 2000 2005 2010
Care-seeking for suspected pneumonia
0
20
40
60
80
100
1990 1995 2000 2005 2010
EAST CENTRAL,continuedPercent(%)
Percent(%)
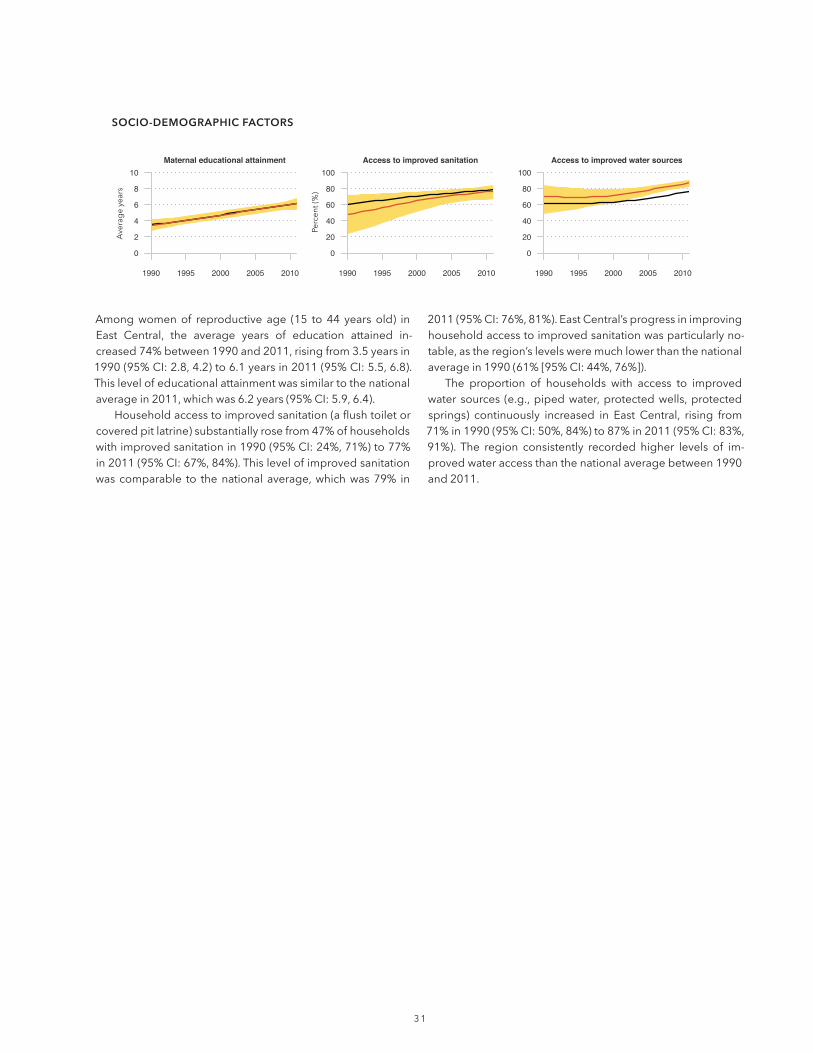
3 1
Amongwomenof reproductive age (15 to 44 years old) inEast Central, the average years of education attained in-creased74%between1990and2011,risingfrom3.5yearsin1990(95%CI:2.8,4.2)to6.1yearsin2011(95%CI:5.5,6.8).Thislevelofeducationalattainmentwassimilartothenationalaveragein2011,whichwas6.2years(95%CI:5.9,6.4).
Householdaccesstoimprovedsanitation(aflushtoiletorcoveredpitlatrine)substantiallyrosefrom47%ofhouseholdswithimprovedsanitationin1990(95%CI:24%,71%)to77%in2011(95%CI:67%,84%).Thislevelofimprovedsanitationwascomparable to thenationalaverage,whichwas79% in
2011(95%CI:76%,81%).EastCentral’sprogressinimprovinghouseholdaccesstoimprovedsanitationwasparticularlyno-table,astheregion’slevelsweremuchlowerthanthenationalaveragein1990(61%[95%CI:44%,76%]).
The proportion of households with access to improvedwater sources (e.g.,pipedwater,protectedwells,protectedsprings) continuously increased in East Central, rising from71%in1990(95%CI:50%,84%)to87%in2011(95%CI:83%,91%). The region consistently recorded higher levels of im-provedwateraccessthanthenationalaveragebetween1990and 2011.
SOCIO-dEMOgRAPhIC fACTORS
Maternal educational attainment
0
2
4
6
8
10
1990 1995 2000 2005 2010
Access to improved sanitation
0
20
40
60
80
100
1990 1995 2000 2005 2010
Access to improved water sources
0
20
40
60
80
100
1990 1995 2000 2005 2010
Averageyears
Percent(%)

3 2
sUMMaRyBetween 1990 and 2011, Eastern recorded substantial de-clines in all-cause under-5 mortality and the prevalence ofchildhoodunderweight.Prioritizingeffortstomaintainthesegains and further accelerate the region’s progress in childhealthoutcomesshouldbeconsidered.
ITNs and the receipt ofACTswere quickly scaled up inEastern, closely following the national trend. The region re-corded improvements in immunization coverage as well,bringingBCGcoveragetoamongthehighestinthecountryin2011.Skilledbirthattendancegraduallyroseovertime,butremainedlowerthanthenationalaverage.Minimalprogresswasmadefortheproportionofwomenwhohadatleastfourantenatalcarevisits (ANC4),with theregion’scoveragecon-sistentlyfallingbelowthenationaltrend.
The region documented gains in the proportion ofhouseholdswithimprovedwater,farexceedingthenationalaverageby2011.Whilehouseholdaccess to improvedsan-itationslowly increased,Eastern laggedbehindthenationaltrend. After the mid-1990s, the region’s average levels ofeducational attainment amongwomenof reproductive agebeganfallingbelowthenationalaverage.
In 2011, Easterngenerally equaledor exceeded thena-tional average for malaria interventions and immunizationcoverage,butlargelyfellbelowformaternalandchildhealthinterventions. For socio-demographic factors, the regionmostlyperformedbelowthenationalaverage;householdac-cesstoimprovedwaterwastheexception.Incomparisonwiththenationalaverage,Easternshowedsimilarlevelsofunder-5mortalityandchildhoodunderweight.
Malaria Immunizations Maternal and child health
INTERVENTIONS
ACT for fever, under-5
IPTp(2 doses)
Exclusivebreastfeeding
Antenatal care(4 visits)
ITNownership
ITN use, under-5
BCG PentavalentMeasles Polio Skilled birthattendance
Care for suspected
pneumonia
0
20
40
60
80
100
Perc
ent (
%)
Dea
ths
per
1,0
00 li
ve b
irth
s
40
60
80
100
120
140
CHILD HEALTH OUTCOMES
Childhoodunderweight
Under-5mortality
Household characteristics Educational attainment
SOCIO-DEMOGRAPHIC FACTORS
Improved sanitation
Improved water
0
20
40
60
80
100
Perc
ent (
%)
0
20
40
60
80
100
Perc
ent (
%)
Women of reproductive age
0
2
4
6
8
10
Ave
rag
e ye
ars
Range observed across regions
National average
Eastern
Range observed across regions
National average
Eastern
note:Estimatesofinterventioncoveragearefor2011,withbetterperformancereflectedbyhigherlevelsofcoverage.
Eastern
note:Estimatesofchildhealthoutcomesandsocio-demographicfactorsarefor2011.Betterperformanceisshownbylowerlevelsofchildhealthoutcomesandhigherlevelsforsocio-demographicfactors.

3 3
ITNownership remainedbelow10%until2004,afterwhichcoverageroseto60%in2011(95%CI:35%,82%).ThislevelofITNownershipwassimilartothenationalaverageof59%(95%CI:36%,79%).
TheuseofITNsbychildrenunder5yearsoldsteadilyin-creasedfrom13%in2005(95%CI:7%,24%)to41%in2011(95%CI:25%,58%).ThislevelofITNusewascomparabletothenational averageof 39% (95%CI: 27%,53%). In this re-gion, the difference between ITN ownership and ITN useby childrenunder the ageof 5 (19percentagepoints)wascomparable towhatwasobserved at the national level (20percentagepoints).
Nodistricts in the regionof Easternhad formally imple-mentedIRSasof2011.
ACTsformallybecameUganda’sfirst-linetreatmentforun-complicatedmalariain2006,andtheproportionofchildrenin Eastern who receivedACTs in response to experiencinga fever rapidly increasedthereafter.ReceiptofACTsamong febrilechildrenunder5 rose from9% in2008 (95%CI:6%,13%)to50%in2011(95%CI:37%,66%),whichwassimilartothenationalaverageof49%(95%CI:34%,65%).
Theproportionofpregnantwomenwho received IPTp2remained below 10% until 2005, after which coverage increased to35% in2011 (95%CI:21%,54%).This levelofIPTp2washigherthanthenationalaverageof29%(95%CI:15%,50%).
MALARIA INTERVENTIONS
ITN ownership
0
20
40
60
80
100
1990 1995 2000 2005 2010
ITN use by children under 5
0
20
40
60
80
100
1990 1995 2000 2005 2010
IPTp (2 doses)
0
20
40
60
80
100
1990 1995 2000 2005 2010
ACT received by febrile children under 5
0
20
40
60
80
100
1990 1995 2000 2005 2010
All-cause under-5 mortality
40
120
200
280
1990 1995 2000 2005 2010
Childhood underweight
0
20
40
60
80
100
1990 1995 2000 2005 2010
From1990to2011,theregionofEasternrecordedasignifi-cant reduction inall-causeunder-5mortality,dropping52%from178deathsper1,000 livebirths in1990 (95%CI:151,209) to85 in2011(95%CI:67,108).At thesametime, it isimportanttonotethatEastern’sprogressinreducingunder-5mortality slowed after 2005. In 2011, the region’s under-5mortalityequaledthenationalaverage.
The proportion of children who were underweight inEastern substantially decreased from26% in 1990 (95%CI:
17%,38%)to12%in2009(95%CI:10%,15%).Theprevalenceof childhood underweight remained at 12% through 2011,which was slightly lower than the national average of 14%(95%CI:12%,15%).Eastern’simprovementsinchildhoodun-derweightareparticularlynotablegiventhattheregionhadone of Uganda’s highest levels of underweight during theearly 1990s.
CHILD HEALTH OUTCOMES
Nationaltrend Eastern Uncertaintyinterval
Deathsper1,000livebirths
Percent(%)
Percent(%)
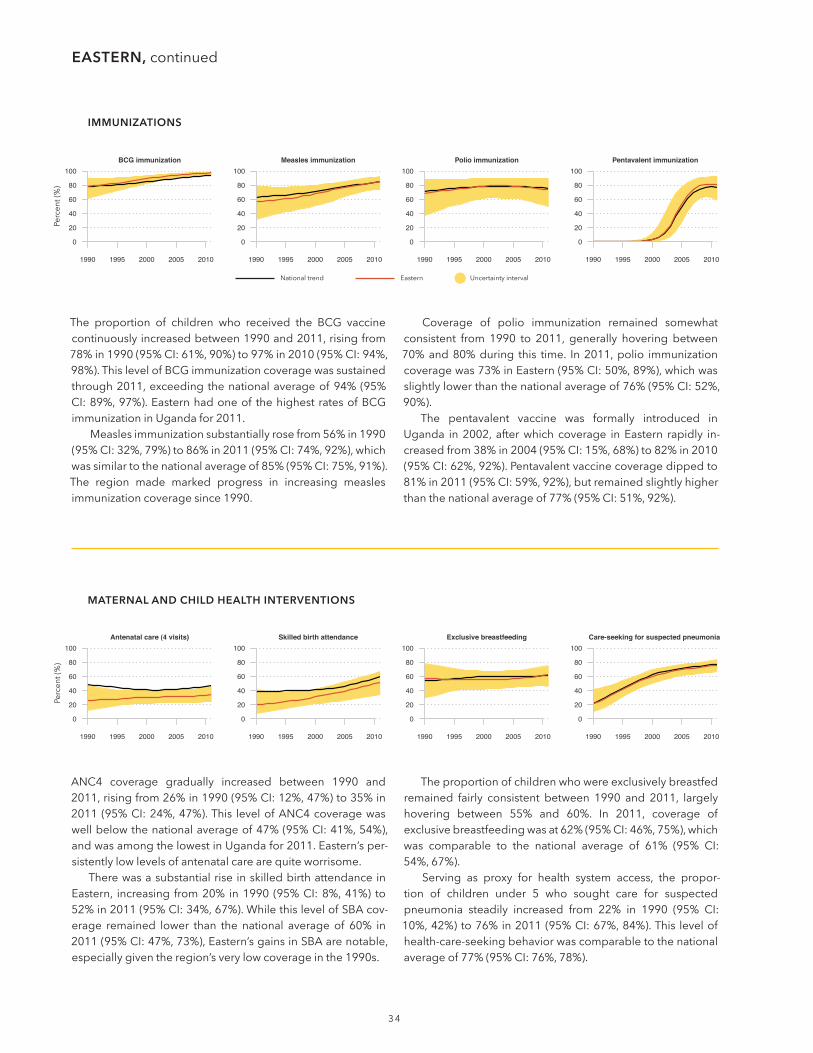
3 4
Nationaltrend Eastern Uncertaintyinterval
The proportion of children who received the BCG vaccinecontinuouslyincreasedbetween1990and2011,risingfrom78%in1990(95%CI:61%,90%)to97%in2010(95%CI:94%,98%).ThislevelofBCGimmunizationcoveragewassustainedthrough2011,exceedingthenationalaverageof94%(95%CI:89%,97%).Easternhadoneof thehighestratesofBCGimmunizationinUgandafor2011.
Measlesimmunizationsubstantiallyrosefrom56%in1990(95%CI:32%,79%)to86%in2011(95%CI:74%,92%),whichwassimilartothenationalaverageof85%(95%CI:75%,91%).The region made marked progress in increasing measles immunizationcoveragesince1990.
Coverage of polio immunization remained somewhatconsistent from 1990 to 2011, generally hovering between70%and80%during this time. In2011,polio immunizationcoveragewas73%inEastern(95%CI:50%,89%),whichwasslightlylowerthanthenationalaverageof76%(95%CI:52%,90%).
The pentavalent vaccine was formally introduced inUganda in2002, afterwhich coverage inEastern rapidly in-creasedfrom38%in2004(95%CI:15%,68%)to82%in2010(95%CI:62%,92%).Pentavalentvaccinecoveragedippedto81%in2011(95%CI:59%,92%),butremainedslightlyhigherthanthenationalaverageof77%(95%CI:51%,92%).
IMMUNIZATIONS
BCG immunization
0
20
40
60
80
100
1990 1995 2000 2005 2010
Measles immunization
0
20
40
60
80
100
1990 1995 2000 2005 2010
Polio immunization
0
20
40
60
80
100
1990 1995 2000 2005 2010
Pentavalent immunization
0
20
40
60
80
100
1990 1995 2000 2005 2010
ANC4 coverage gradually increased between 1990 and2011,risingfrom26%in1990(95%CI:12%,47%)to35%in2011 (95%CI:24%,47%).This levelofANC4coveragewaswellbelowthenationalaverageof47%(95%CI:41%,54%),andwasamongthelowestinUgandafor2011.Eastern’sper-sistentlylowlevelsofantenatalcarearequiteworrisome.
TherewasasubstantialriseinskilledbirthattendanceinEastern, increasing from20% in1990 (95%CI:8%,41%) to52%in2011(95%CI:34%,67%).WhilethislevelofSBAcov-erage remained lower than the national average of 60% in2011(95%CI:47%,73%),Eastern’sgainsinSBAarenotable,especiallygiventheregion’sverylowcoverageinthe1990s.
Theproportionofchildrenwhowereexclusivelybreastfedremained fairly consistent between 1990 and 2011, largelyhovering between 55% and 60%. In 2011, coverage of exclusivebreastfeedingwasat62%(95%CI:46%,75%),whichwas comparable to the national average of 61% (95% CI: 54%,67%).
Serving as proxy for health system access, the propor-tion of children under 5 who sought care for suspectedpneumonia steadily increased from 22% in 1990 (95% CI:10%,42%)to76%in2011(95%CI:67%,84%).This levelofhealth-care-seekingbehaviorwascomparabletothenationalaverageof77%(95%CI:76%,78%).
MATERNAL AND CHILD HEALTH INTERVENTIONS
Antenatal care (4 visits)
0
20
40
60
80
100
1990 1995 2000 2005 2010
Skilled birth attendance
0
20
40
60
80
100
1990 1995 2000 2005 2010
Exclusive breastfeeding
0
20
40
60
80
100
1990 1995 2000 2005 2010
Care-seeking for suspected pneumonia
0
20
40
60
80
100
1990 1995 2000 2005 2010
EASTERN,continuedPercent(%)
Percent(%)

3 5
Amongwomenof reproductive age (15 to 44 years old) inEastern, the average years of education attained increased68%between1990and2011, rising from3.4years in1990(95%CI:2.8,4.1)to5.7yearsin2011(95%CI:5.1,6.3).Thislevelof educational attainmentwas lower than thenationalaveragein2011,whichwas6.2years(95%CI:5.9,6.4).
Household access to improved sanitation (a flush toiletorcoveredpitlatrine)steadilyrosefrom42%ofhouseholdswithimprovedsanitationin1990(95%CI:19%,66%)to67%in2011(95%CI:57%,76%).Despitethisprogress,household
accesstoimprovedsanitationinEasternwaswellbelowthenationalaveragein2011,whichwas79%(95%CI:76%,81%).
The proportion of households with access to improvedwater sources (e.g.,pipedwater,protectedwells,protectedsprings)continuouslyincreasedinEastern,risingfrom73%in1990(95%CI:55%,86%)to86%in2011(95%CI:81%,90%).The region consistently recorded higher levels of improvedwateraccessthanthenationalaveragebetween1990and2011.
SOCIO-dEMOgRAPhIC fACTORS
Maternal educational attainment
0
2
4
6
8
10
1990 1995 2000 2005 2010
Access to improved sanitation
0
20
40
60
80
100
1990 1995 2000 2005 2010
Access to improved water sources
0
20
40
60
80
100
1990 1995 2000 2005 2010
Averageyears
Percent(%)
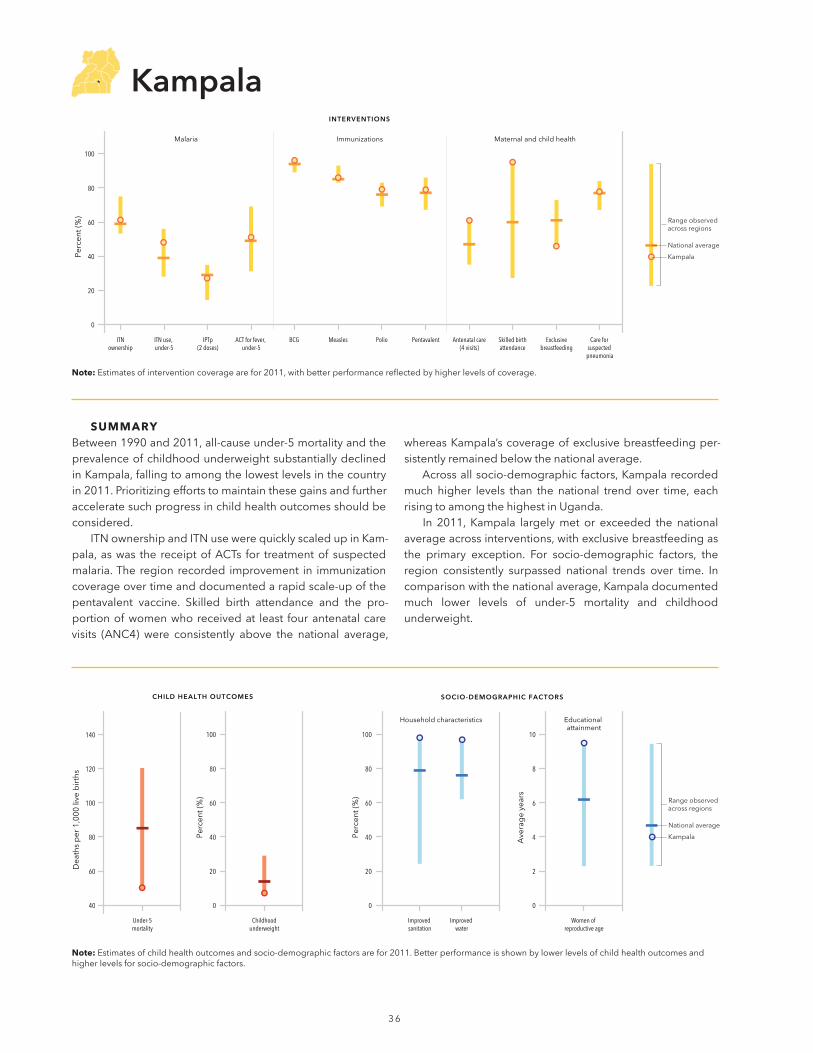
3 6
sUMMaRyBetween1990and2011,all-causeunder-5mortalityandtheprevalenceofchildhoodunderweightsubstantiallydeclinedinKampala,fallingtoamongthelowestlevelsinthecountryin2011.Prioritizingeffortstomaintainthesegainsandfurtheracceleratesuchprogressinchildhealthoutcomesshouldbeconsidered.
ITNownershipandITNusewerequicklyscaledupinKam-pala,aswas the receiptofACTs for treatmentof suspectedmalaria.The region recorded improvement in immunizationcoverageovertimeanddocumentedarapidscale-upofthepentavalent vaccine. Skilled birth attendance and the pro-portionofwomenwhoreceivedat least fourantenatalcarevisits (ANC4) were consistently above the national average,
whereasKampala’scoverageofexclusivebreastfeedingper-sistentlyremainedbelowthenationalaverage.
Acrossallsocio-demographicfactors,Kampalarecordedmuch higher levels than the national trendover time, eachrisingtoamongthehighestinUganda.
In 2011, Kampala largelymet or exceeded the national averageacrossinterventions,withexclusivebreastfeedingasthe primary exception. For socio-demographic factors, the region consistently surpassed national trends over time. Incomparisonwiththenationalaverage,Kampaladocumentedmuch lower levels of under-5 mortality and childhood underweight.
Malaria Immunizations Maternal and child health
INTERVENTIONS
ACT for fever, under-5
IPTp(2 doses)
Exclusivebreastfeeding
Antenatal care(4 visits)
ITNownership
ITN use, under-5
BCG PentavalentMeasles Polio Skilled birthattendance
Care for suspected
pneumonia
0
20
40
60
80
100
Perc
ent (
%)
Dea
ths
per
1,0
00 li
ve b
irth
s
40
60
80
100
120
140
CHILD HEALTH OUTCOMES
Childhoodunderweight
Under-5mortality
Household characteristics Educational attainment
SOCIO-DEMOGRAPHIC FACTORS
Improved sanitation
Improved water
0
20
40
60
80
100
Perc
ent (
%)
0
20
40
60
80
100
Perc
ent (
%)
Women of reproductive age
0
2
4
6
8
10
Ave
rag
e ye
ars
Range observed across regions
National average
Kampala
Range observed across regions
National average
Kampala
note:Estimatesofinterventioncoveragearefor2011,withbetterperformancereflectedbyhigherlevelsofcoverage.
Kampala
note:Estimatesofchildhealthoutcomesandsocio-demographicfactorsarefor2011.Betterperformanceisshownbylowerlevelsofchildhealthoutcomesandhigherlevelsforsocio-demographicfactors.
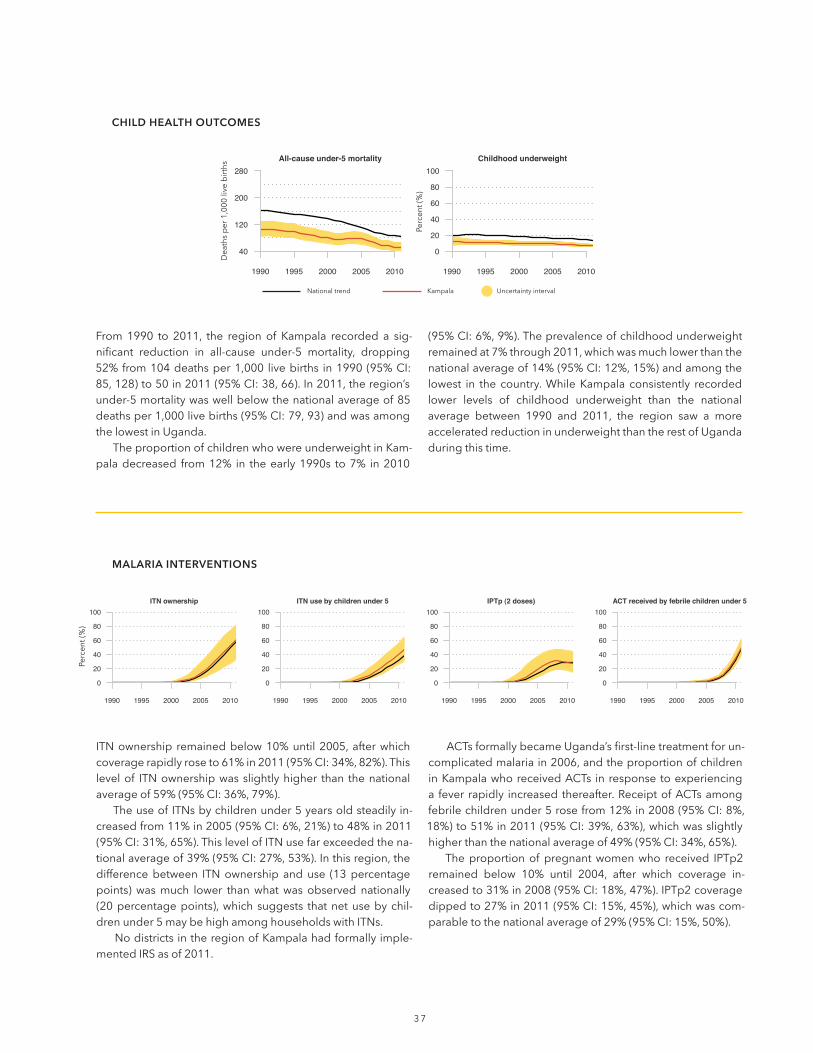
37
ITNownership remainedbelow10%until2005,afterwhichcoveragerapidlyroseto61%in2011(95%CI:34%,82%).Thislevelof ITNownershipwasslightlyhigher than thenationalaverageof59%(95%CI:36%,79%).
TheuseofITNsbychildrenunder5yearsoldsteadilyin-creasedfrom11%in2005(95%CI:6%,21%)to48%in2011(95%CI:31%,65%).ThislevelofITNusefarexceededthena-tionalaverageof39%(95%CI:27%,53%).Inthisregion,thedifferencebetween ITNownership anduse (13percentagepoints)wasmuch lower thanwhatwas observed nationally(20percentagepoints),whichsuggests thatnetusebychil-drenunder5maybehighamonghouseholdswithITNs.
NodistrictsintheregionofKampalahadformallyimple-mentedIRSasof2011.
ACTsformallybecameUganda’sfirst-linetreatmentforun-complicatedmalariain2006,andtheproportionofchildreninKampalawhoreceivedACTs inresponsetoexperiencinga fever rapidly increasedthereafter.ReceiptofACTsamongfebrilechildrenunder5rosefrom12%in2008(95%CI:8%,18%)to51%in2011(95%CI:39%,63%),whichwasslightlyhigherthanthenationalaverageof49%(95%CI:34%,65%).
Theproportionofpregnantwomenwho received IPTp2remained below 10% until 2004, after which coverage in-creasedto31%in2008(95%CI:18%,47%).IPTp2coveragedippedto27%in2011(95%CI:15%,45%),whichwascom-parabletothenationalaverageof29%(95%CI:15%,50%).
MALARIA INTERVENTIONS
ITN ownership
0
20
40
60
80
100
1990 1995 2000 2005 2010
ITN use by children under 5
0
20
40
60
80
100
1990 1995 2000 2005 2010
IPTp (2 doses)
0
20
40
60
80
100
1990 1995 2000 2005 2010
ACT received by febrile children under 5
0
20
40
60
80
100
1990 1995 2000 2005 2010
All-cause under-5 mortality
40
120
200
280
1990 1995 2000 2005 2010
Childhood underweight
0
20
40
60
80
100
1990 1995 2000 2005 2010
From1990 to 2011, the region of Kampala recorded a sig-nificant reduction in all-cause under-5 mortality, dropping52%from104deathsper1,000 livebirths in1990 (95%CI:85,128)to50in2011(95%CI:38,66).In2011,theregion’sunder-5mortalitywaswellbelowthenationalaverageof85deathsper1,000livebirths(95%CI:79,93)andwasamongthelowestinUganda.
TheproportionofchildrenwhowereunderweightinKam-paladecreased from12% in theearly1990s to7% in2010
(95%CI:6%,9%).Theprevalenceofchildhoodunderweightremainedat7%through2011,whichwasmuchlowerthanthenationalaverageof14%(95%CI:12%,15%)andamongthelowest in the country.WhileKampala consistently recordedlower levels of childhood underweight than the nationalaverage between 1990 and 2011, the region saw a more acceleratedreductioninunderweightthantherestofUgandaduringthistime.
CHILD HEALTH OUTCOMES
Nationaltrend Kampala Uncertaintyinterval
Deathsper1,000livebirths
Percent(%)
Percent(%)

3 8
Nationaltrend Kampala Uncertaintyinterval
The proportion of children who received BCG vaccine re-mainedabove90%between1990and2011, slightly risingfrom91%in1990(95%CI:83%,96%)to96%in2011(95%CI:92%,98%).ThislevelofBCGimmunizationcoveragewasslightly higher than the national average of 94% (95% CI: 89%,97%).
Measles immunization increased from71% in1990 (95%CI:46%,88%)to86%in2009(95%CI:77%,92%).Coverageremainedat86%through2011,whichwascomparabletothenationalaverageof85%forthatyear(95%CI:75%,91%).
Coverageofpolioimmunizationremainedsomewhatcon-sistent from1990 to2011,generallyhoveringbetween80%
and85%duringthistime.Coveragehititspeakat87%in2000(95%CI:75%,94%)andremainedatthislevelthrough2004,graduallydecreasingto79%in2011(95%CI:58%,92%).Thislevel of polio immunization was slightly higher than the na-tionalaverageof76%(95%CI:52%,90%).
The pentavalent vaccine was formally introduced inUganda in2002,afterwhichcoverage inKampala rapidly in-creasedfrom32%in2004(95%CI:11%,62%)to79%in2010(95%CI:58%,91%).Pentavalentvaccinecoverageremainedat79%through2011(95%CI:55%,92%),whichwascomparabletothenationalaverageof77%(95%CI:51%,92%).
IMMUNIZATIONS
BCG immunization
0
20
40
60
80
100
1990 1995 2000 2005 2010
Measles immunization
0
20
40
60
80
100
1990 1995 2000 2005 2010
Polio immunization
0
20
40
60
80
100
1990 1995 2000 2005 2010
Pentavalent immunization
0
20
40
60
80
100
1990 1995 2000 2005 2010
ANC4coveragegraduallydecreasedbetween1990and2011,slidingfrom70%in1990(95%CI:47%,85%)to61%in2011(95%CI:48%,72%).Despitedeclinesincoverage,this levelofANC4coverageremainedabove thenationalaverageof47%in2011(95%CI:41%,54%)andwasamongthehighestinUgandaforthatyear.
Skilled birth attendance steadily increased from 83% in1990(95%CI:62%,94%)to95%in2011(95%CI:90%,97%),farexceedingthenationalaverageof60%in2011(95%CI:47%, 73%). After consistently exceeding the national trendsince 1990, Kampala’s levels of SBA also were among thehighestinUgandain2011.
Theproportionofchildrenwhowereexclusivelybreastfedslowly rose from23% in1990 (95%CI:9%,44%) to50% in
2005 (95% CI: 38%, 63%). Coverage of exclusive breast-feeding remained at 50% through 2007, slipping to 46%in 2011 (95%CI: 31%, 62%) and falling below the national averageof61%(95%CI:54%,67%)forthatyear.KampalahadoneofthelowestlevelsofexclusivebreastfeedinginUgandain2011.
Servingasproxyforhealthsystemaccess,theproportionof children under 5 who sought care for suspected pneu-moniaincreasedfrom32%in1990(95%CI:16%,54%)to82%in2003(95%CI:76%,87%).Thislevelofhealth-care-seekingbehaviorwassustainedthrough2005,afterwhichcoverageslippedto78%in2011(95%CI:69%,85%)andwascompa-rabletothenationalaverageof77%(95%CI:76%,78%)forthatyear.
MATERNAL AND CHILD HEALTH INTERVENTIONS
Antenatal care (4 visits)
0
20
40
60
80
100
1990 1995 2000 2005 2010
Skilled birth attendance
0
20
40
60
80
100
1990 1995 2000 2005 2010
Exclusive breastfeeding
0
20
40
60
80
100
1990 1995 2000 2005 2010
Care-seeking for suspected pneumonia
0
20
40
60
80
100
1990 1995 2000 2005 2010
KAMPAlA,continuedPercent(%)
Percent(%)
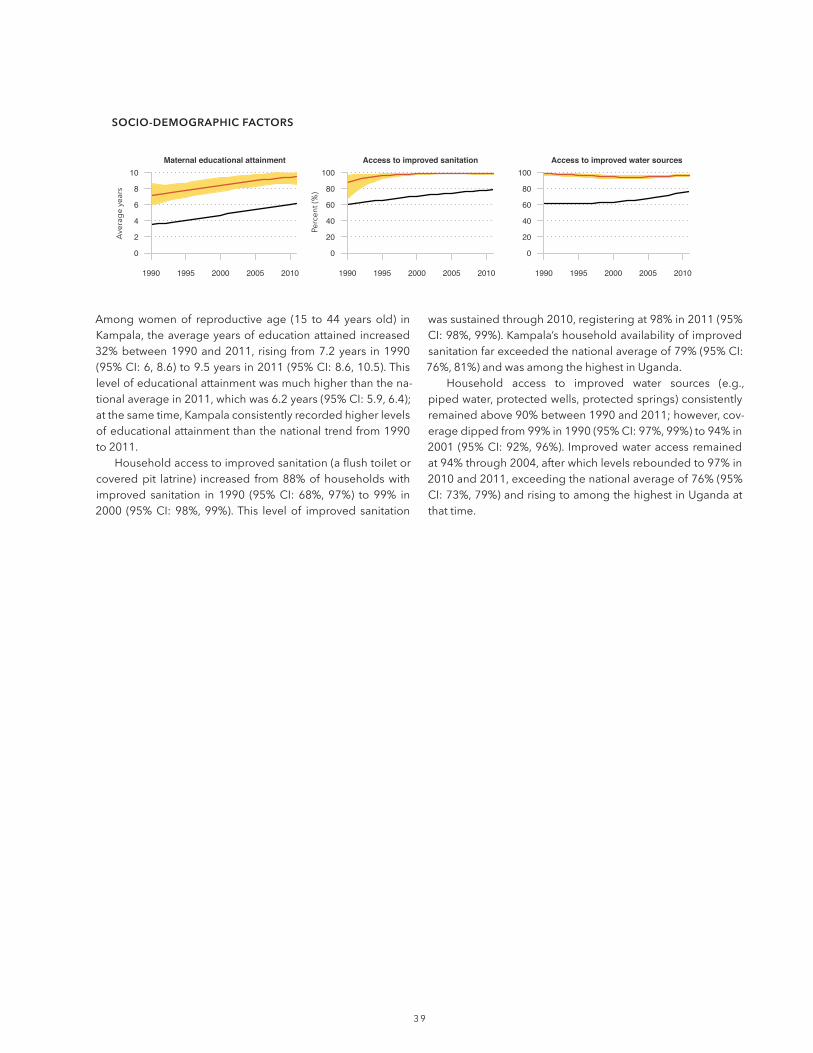
3 9
Amongwomenof reproductive age (15 to 44 years old) inKampala,theaverageyearsofeducationattainedincreased32%between1990and2011, rising from7.2years in1990(95%CI:6,8.6)to9.5yearsin2011(95%CI:8.6,10.5).Thislevelofeducationalattainmentwasmuchhigherthanthena-tionalaveragein2011,whichwas6.2years(95%CI:5.9,6.4);atthesametime,Kampalaconsistentlyrecordedhigherlevelsofeducationalattainmentthanthenationaltrendfrom1990to2011.
Householdaccesstoimprovedsanitation(aflushtoiletorcoveredpit latrine) increased from88%ofhouseholdswithimproved sanitation in 1990 (95%CI: 68%, 97%) to 99% in2000 (95%CI: 98%,99%).This levelof improved sanitation
wassustainedthrough2010,registeringat98%in2011(95%CI:98%,99%).Kampala’shouseholdavailabilityofimprovedsanitationfarexceededthenationalaverageof79%(95%CI:76%,81%)andwasamongthehighestinUganda.
Household access to improved water sources (e.g.,pipedwater,protectedwells,protectedsprings)consistentlyremainedabove90%between1990and2011;however,cov-eragedippedfrom99%in1990(95%CI:97%,99%)to94%in2001 (95%CI:92%,96%). Improvedwateraccess remainedat94%through2004,afterwhichlevelsreboundedto97%in2010and2011,exceedingthenationalaverageof76%(95%CI:73%,79%)andrisingtoamongthehighestinUgandaatthattime.
SOCIO-dEMOgRAPhIC fACTORS
Maternal educational attainment
0
2
4
6
8
10
1990 1995 2000 2005 2010
Access to improved sanitation
0
20
40
60
80
100
1990 1995 2000 2005 2010
Access to improved water sources
0
20
40
60
80
100
1990 1995 2000 2005 2010
Averageyears
Percent(%)

4 0
sUMMaRyAll-causeunder-5mortalityinKaramojasubstantiallydeclinedbetween1990and2005,butprogressstagnatedfrom2005to2011.Theproportionof childrenwhowereunderweightwasconsistentlywellabove thenational trendover time. In2011, Karamoja’s under-5 mortality and prevalence of un-derweightwereamongthehighestinUganda,emphasizingtheregion’sneedtofurtherprioritizeimprovingchildhealth outcomes.
Thescale-upofITNsandreceiptofACTsoccurredquicklyin Karamoja, slightly exceeding the national averages forthese malaria interventions in 2011. Except for polio im-munization coverage, the region recorded higher levels ofimmunization coverage than the national average acrosschildhoodvaccines;infact,Karamojahadoneofthehighestlevelsofpentavalentvaccinecoverageinthecountryfor2011.Exclusive breastfeeding steadily increased over time, risingtoamongthehighestlevelsinthecountryby2011,whereas
theregionpersistentlyshowedlowcoverageofskilledbirth attendance.
Theregiondocumentedgainsintheproportionofhouse-holds with improved water sources, which were largelydrivenbyheightenedavailabilityofpublicboreholes.None-theless,Karamojacontinuallyhadsomeof the lowest levelsofhouseholdswithaccesstoimprovedsanitation,aswellaseducationalattainmentamongwomenofreproductiveageinUganda.
In 2011, Karamoja generally equaled or exceeded thenational average across interventions, with skilled birth at-tendance as theprimary exception. For socio-demographicfactors, the region largely fell well below the national av-erage;theregion’sproportionofhouseholdswithaccesstoimprovedwatersourceswasthemainexception. Incompar-isonwiththenationalaverage,Karamojashowedmuchhigherlevelsofunder-5mortalityandchildhoodunderweight.
Malaria Immunizations Maternal and child health
INTERVENTIONS
ACT for fever, under-5
IPTp(2 doses)
Exclusivebreastfeeding
Antenatal care(4 visits)
ITNownership
ITN use, under-5
BCG PentavalentMeasles Polio Skilled birthattendance
Care for suspected
pneumonia
0
20
40
60
80
100
Perc
ent (
%)
Dea
ths
per
1,0
00 li
ve b
irth
s
40
60
80
100
120
140
CHILD HEALTH OUTCOMES
Childhoodunderweight
Under-5mortality
Household characteristics Educational attainment
SOCIO-DEMOGRAPHIC FACTORS
Improved sanitation
Improved water
0
20
40
60
80
100
Perc
ent (
%)
0
20
40
60
80
100
Perc
ent (
%)
Women of reproductive age
0
2
4
6
8
10
Ave
rag
e ye
ars
Range observed across regions
National average
Karamoja
Range observed across regions
National average
Karamoja
note:Estimatesofinterventioncoveragearefor2011,withbetterperformancereflectedbyhigherlevelsofcoverage.
Karamoja
note:Estimatesofchildhealthoutcomesandsocio-demographicfactorsarefor2011.Betterperformanceisshownbylowerlevelsofchildhealthoutcomesandhigherlevelsforsocio-demographicfactors.

4 1
ITNownership remainedbelow10%until2007,afterwhichcoveragerapidlyroseto65%in2011(95%CI:39%,85%).ThislevelofITNownershipwashigherthanthenationalaverageof59%in2011(95%CI:36%,79%).
Theuseof ITNsbychildrenunder5yearsold increasedfrom11% in2007 (95%CI: 6%, 21%) to46% in 2011 (95%CI: 31%, 64%).This level of ITN use exceeded the national averageof39%in2011(95%CI:27%,53%).Inthisregion,thedifferencebetween ITNownershipand ITNusebychildrenunder5(19percentagepoints)wascomparabletowhatwasobservedatthenationallevel(20percentagepoints).
NodistrictsintheregionofKaramojahadformallyimple-mentedIRSasof2011.
ACTs formally became Uganda’s first-line treatment for uncomplicatedmalariain2006,andtheproportionofchildreninKaramojawhoreceivedACTsinresponsetoexperiencinga fever rapidly increasedthereafter.ReceiptofACTsamongfebrilechildrenunder5rosefrom14%in2008(95%CI:9%,21%)to60%in2011(95%CI:46%,72%),whichwashigherthan the national average of 49% (95%CI: 34%, 65%).The region’squickuptakeofACTs,especiallygivenitshighlevelsofmalariatransmission,isquitenotable.
Theproportionofpregnantwomenwho received IPTp2remainedbelow10%until2006,afterwhichcoveragesteadilyroseto27%in2011(95%CI:14%,44%).ThislevelofIPTp2coverage was comparable to the national average of 29%(95%CI:15%,50%).
MALARIA INTERVENTIONS
ITN ownership
0
20
40
60
80
100
1990 1995 2000 2005 2010
ITN use by children under 5
0
20
40
60
80
100
1990 1995 2000 2005 2010
IPTp (2 doses)
0
20
40
60
80
100
1990 1995 2000 2005 2010
ACT received by febrile children under 5
0
20
40
60
80
100
1990 1995 2000 2005 2010
All-cause under-5 mortality
40
120
200
280
1990 1995 2000 2005 2010
Childhood underweight
0
20
40
60
80
100
1990 1995 2000 2005 2010
From1990to2011,theregionofKaramojarecordedasignif-icant reduction in all-cause under-5mortality, dropping40%from201deathsper1,000livebirthsin1990(95%CI:169,236)to121in2011(95%CI:94,154).Despitethisprogress,itisim-portanttonotethattheregion’sannualreductionsinunder-5mortality stalledbetween2005and2011,plateauing in con-trast with the national trend’s downward trajectory. In 2011,Karamoja’sunder-5mortalityremainedwellabovethenationalaverageof85deathsper1,000livebirths(95%CI:79,93),andwasamongthehighestlevelsofunder-5mortalityinUganda.
The proportion of children who were underweight inKaramojasteadily increased from29% in theearly1990s to35% in 2003 (95% CI: 28%, 41%). Childhood underweightremainedat35%through2004,afterwhichprevalencegrad-uallydecreasedto29%in2011(95%CI:24%,34%).Thislevelofchildhoodunderweightfarexceededthenationalaverageof14% (95%CI:12%,15%),andwasamong thehighest inUgandafor2011.
CHILD HEALTH OUTCOMES
Nationaltrend Karamoja Uncertaintyinterval
Deathsper1,000livebirths
Percent(%)
Percent(%)

4 2
Nationaltrend Karamoja Uncertaintyinterval
The proportion of children who received the BCG vaccineincreased from86% in1990 (95%CI: 72%,94%) to97% in2010(95%CI:94%,98%).ThislevelofBCGimmunizationwassustained through2011, exceeding thenational averageof94%(95%CI:89%,97%)andrisingtoamongthehighestinUgandain2011.
MeaslesimmunizationsubstantiallyescalatedinKaramoja,risingfrom60%in1990(95%CI:34%,82%)to90%in2010(95%CI:82%,95%).Coverageremainedat90%through2011,whichwashigherthanthenationalaverageof85%(95%CI:75%,91%).Karamoja’sprogressinelevatingmeaslesimmuni-zationcoveragesince1990isparticularlylaudable.
Coverageofpolioimmunizationremainedrelativelycon-sistentfrom1990to2011,generallyhoveringbetween70%and80%duringthistime.In2011,polioimmunizationcoveragewas74%inKaramoja(95%CI:49%,89%),whichwascompa-rabletothenationalaverageof76%(95%CI:52%,90%).
The pentavalent vaccine was formally introduced inUgandain2002,afterwhichcoverageinKaramojarapidlyin-creasedfrom32%in2004(95%CI:10%,64%)to85%in2011(95%CI:66%,95%).Thislevelofcoveragefarexceededthenationalaverageof77%(95%CI:51%,92%),andwasamongthehighestinUgandafor2011.
IMMUNIZATIONS
BCG immunization
0
20
40
60
80
100
1990 1995 2000 2005 2010
Measles immunization
0
20
40
60
80
100
1990 1995 2000 2005 2010
Polio immunization
0
20
40
60
80
100
1990 1995 2000 2005 2010
Pentavalent immunization
0
20
40
60
80
100
1990 1995 2000 2005 2010
ANC4coveragegraduallyincreasedfrom37%in1990(95%CI:18%,58%)to55%in2001(95%CI:45%,66%).Coverageremained at 55% through 2004 before slipping to 47% in2011(95%CI:35%,59%),equalingthenationalaverageforthatyear.
Skilledbirthattendancerosefrom10%in1990(95%CI:3%,28%) to27% in2011 (95%CI:16%,43%),butwaswellbelowthenationalaverageof60%(95%CI:47%,73%)andwasamongthelowestinUgandain2011.Theregion’sconsis-tentlylowlevelsofSBAcoveragefrom1990to2011warrantfurtherattention.
Theproportionofchildrenwhowereexclusivelybreastfedsteadily increased from 31% in 1990 (95% CI: 13%, 57%)
to75% in2007 (95%CI:64%,84%).Coverage remainedat 75% through 2009, after which exclusive breastfeedingdipped to 73% in 2011 (95% CI: 58%, 84%). This level of exclusive breastfeeding exceeded the national average of61%in2011(95%CI:54%,67%),andwasamongthehighestinUgandaforthatyear.
Servingasproxyforhealthsystemaccess,theproportionof children under 5 who sought care for suspected pneu-moniaescalatedfrom23%in1990(95%CI:10%,42%)to83%in2011(95%CI:76%,89%).Thislevelofhealth-care-seekingbehaviorwassustainedthrough2011,exceedingthenationalaverageof77%(95%CI:76%,78%).
MATERNAL AND CHILD HEALTH INTERVENTIONS
Antenatal care (4 visits)
0
20
40
60
80
100
1990 1995 2000 2005 2010
Skilled birth attendance
0
20
40
60
80
100
1990 1995 2000 2005 2010
Exclusive breastfeeding
0
20
40
60
80
100
1990 1995 2000 2005 2010
Care-seeking for suspected pneumonia
0
20
40
60
80
100
1990 1995 2000 2005 2010
KARAMOjA,continuedPercent(%)
Percent(%)

4 3
Amongwomenof reproductive age (15 to 44 years old) inKaramoja,theaverageyearsofeducationattainedmorethandoubled between 1990 and 2011, rising from 0.7 years in1990(95%CI:0.6,0.8)to2.3yearsin2011(95%CI:2.0,2.5).This level of educational attainment was dramatically lowerthanthenationalaveragein2011,whichwas6.2years(95%CI:5.9,6.4),andwasamongthelowestinUganda.Giventheassociationbetweengainsinwomen’seducationalattainmentand reductions in under-5 mortality, Karamoja would likelybenefit fromaddressing itspersistently low levelsof educa-tionamongwomenofreproductiveage.
Household access to improved sanitation (a flush toiletorcoveredpitlatrine)remainedaround10%until2004,afterwhichimprovedsanitationincreasedto24%in2011(95%CI:
17%,33%).Nonetheless,thislevelofimprovedsanitationwasfar below thenational averageof 79% (95%CI: 76%, 81%)andwasamongthelowestinUgandafor2011.Theregion’spersistently low availability of improved sanitation warrantsfurtherattention.
Karamojarecordedgainsinhouseholdaccesstoimprovedwater sources (e.g.,pipedwater,protectedwells,protectedsprings),risingfrom69%in1990(95%CI:49%,83%)to89%in 2011 (95% CI: 85%, 92%). This level of improved wateraccesswasmuchhigher than thenational average in 2011,whichwas76%(95%CI:73%,79%).Itisimportanttonotethatmostofthesegainsweredrivenbyincreasedaccesstopublicboreholeslocatedwithincommunities,andnotnecessarilyathouseholds.
SOCIO-dEMOgRAPhIC fACTORS
Maternal educational attainment
0
2
4
6
8
10
1990 1995 2000 2005 2010
Access to improved sanitation
0
20
40
60
80
100
1990 1995 2000 2005 2010
Access to improved water sources
0
20
40
60
80
100
1990 1995 2000 2005 2010
Averageyears
Percent(%)

4 4
sUMMaRyBetween1990and2011,Northrecordedsubstantialdeclinesin all-cause under-5 mortality and the prevalence of child-hoodunderweight.Prioritizingeffortstomaintainthesegainsand further accelerate the region’s progress in child healthoutcomesshouldbeconsidered.
ITNsandthereceiptofACTswerequicklyscaledupintheregion,withITNusebychildrenunder5andACTcoveragerisingtoamongthehighestinUgandafor2011.IRScoveragerapidlyescalatedafter2006,reflectingtheregion’sexpansionof spraying to more districts. Coverage of the pentavalentvaccine rapidly rose in North, whereas polio immunizationcoveragestagnatedovertime.Northrecordedgradualgainsinskilledbirthattendance,andtheproportionofchildrenwhosought care for suspected pneumonia increased to amongthe highest in Uganda in 2011. At the same time, ANC4 coverage remained moderately low and exclusive breast-
feedingwashigherinthe1990sthanlevelsofcoverageinthefollowingdecade.
Theregiondocumentedgainsintheproportionofhouse-holds with improved sanitation and educational attainmentamongwomenofreproductiveage,butremainedbelowthenationalaverageby2011.
In2011,Northgenerallyequaledorexceededthenationalaverage across malaria interventions and immunizations,whereas the region’s performance for maternal and childhealthinterventionswasmoremixed.Forsocio-demographicfactors,theregionlargelyfellbelowthenationalaverage,ex-cept for theproportionofhouseholdswith improvedwatersources. In comparison with the national average, Northshowed comparable levels of under-5 mortality and lowerlevelsofchildhoodunderweight.
Malaria Immunizations Maternal and child health
INTERVENTIONS
ACT for fever, under-5
IPTp(2 doses)
Exclusivebreastfeeding
Antenatal care(4 visits)
ITNownership
ITN use, under-5
BCG PentavalentMeasles Polio Skilled birthattendance
Care for suspected
pneumonia
0
20
40
60
80
100
Perc
ent (
%)
Dea
ths
per
1,0
00 li
ve b
irth
s
40
60
80
100
120
140
CHILD HEALTH OUTCOMES
Childhoodunderweight
Under-5mortality
Household characteristics Educational attainment
SOCIO-DEMOGRAPHIC FACTORS
Improved sanitation
Improved water
0
20
40
60
80
100
Perc
ent (
%)
0
20
40
60
80
100
Perc
ent (
%)
Women of reproductive age
0
2
4
6
8
10
Ave
rag
e ye
ars
Range observed across regions
National average
North
Range observed across regions
National average
North
note:Estimatesofinterventioncoveragearefor2011,withbetterperformancereflectedbyhigherlevelsofcoverage.
north
note:Estimatesofchildhealthoutcomesandsocio-demographicfactorsarefor2011.Betterperformanceisshownbylowerlevelsofchildhealthoutcomesandhigherlevelsforsocio-demographicfactors.

4 5
ITNownership remainedbelow10%until2005,afterwhichcoveragerapidlyroseto67%in2011(95%CI:40%,86%).ThislevelofITNownershipwasmuchhigherthanthenationalav-erageof59%in2011(95%CI:36%,79%).
Theuseof ITNsbychildrenunder5yearsoldquickly in-creasedfrom22%in2007(95%CI:11%,37%)to56%in2011(95%CI:37%,70%).ThislevelofITNusefarexceededthena-tionalaverageof39%in2011(95%CI:27%,53%),andwas
amongthehighestinUgandaforthatyear.Inthisregion,thedifferencebetween ITNownership anduse (11percentagepoints)wasmuch lower thanwhatwas observed at the na-tional level(20percentagepoints)for2011,whichsuggeststhatnetusebychildrenunder5maybehighamonghouse-holdswithITNs.
Formal implementation of IRS began in a few districtsin2007,reaching15%ofhouseholdsthatyear(95%CI:6%,
MALARIA INTERVENTIONS
ITN ownership
0
20
40
60
80
100
1990 1995 2000 2005 2010
ITN use by children under 5
0
20
40
60
80
100
1990 1995 2000 2005 2010
Indoor residual spraying
0
20
40
60
80
100
1990 1995 2000 2005 2010
IPTp (2 doses)
0
20
40
60
80
100
1990 1995 2000 2005 2010
ACT received by febrile children under 5
0
20
40
60
80
100
1990 1995 2000 2005 2010
All-cause under-5 mortality
40
120
200
280
1990 1995 2000 2005 2010
Childhood underweight
0
20
40
60
80
100
1990 1995 2000 2005 2010
From1990to2011,theregionofNorthrecordedasignificantreductioninall-causeunder-5mortality,dropping54%from191deathsper1,000 livebirths in1990 (95%CI:164,221)to87in2011(95%CI:71,107).In2011,thedistrict’sunder-5mortalitywassimilartothenationalaverageof85deathsper1,000livebirths(95%CI:79,93).
The proportion of children who were underweight inNorthsubstantiallydeclinedfrom26%in1990(95%CI:17%,37%) to 10% in 2011 (95% CI: 8%, 13%), which was lowerthan thenational averageof 14% (95%CI: 12%, 15%).Thisregionshowedmuchprogressinreducingitsprevalenceofchildhoodunderweight,especiallysincelevelsexceededthenationalaveragein1990.
CHILD HEALTH OUTCOMES
Nationaltrend North Uncertaintyinterval
Deathsper1,000livebirths
Percent(%)
Percent(%)

4 6
Nationaltrend North Uncertaintyinterval
The proportion of children who received the BCG vaccinesteadily increasedfrom71%in1990(95%CI:51%,86%) to95%in2010(95%CI:91%,97%).ThislevelofBCGimmuniza-tionwassustainedthrough2011,andwascomparabletothenationalaverageof94%forthatyear(95%CI:89%,97%).
Measles immunization rose from 61% in 1990 (95% CI:35%,82%) to84% in2011 (95%CI: 72%,91%,),whichwassimilartothenationalaverageof85%forthatyear(95%CI:75%,91%).
Coverageofpolioimmunizationremainedrelativelycon-sistentfrom1990to2011,generallyhoveringbetween65%
and75%duringthistime.In2011,polioimmunizationcoveragewas72%inNorth(95%CI:47%,87%),slightlylowerthanthenationalaverageof76%(95%CI:52%,90%).
The pentavalent vaccine was formally introduced inUganda in 2002, after which coverage in North rapidly in-creasedfrom31%in2004(95%CI:11%,63%)to78%in2010(95% CI: 56%, 91%). This level of coverage was sustainedthrough2011,whichwascomparabletothenationalaverageof77%(95%CI:51%,92%).
IMMUNIZATIONS
BCG immunization
0
20
40
60
80
100
1990 1995 2000 2005 2010
Measles immunization
0
20
40
60
80
100
1990 1995 2000 2005 2010
Polio immunization
0
20
40
60
80
100
1990 1995 2000 2005 2010
Pentavalent immunization
0
20
40
60
80
100
1990 1995 2000 2005 2010
NORTH,continued
31%).IRSwasquicklyscaledupthroughouttheregion,risingtocoveragelevelsof56%in2011(95%CI:34%,79%).Forthatyear,82%ofhouseholds(95%CI:68%,92%)intheNorthhadeitherreceivedIRSorownedatleastoneITN.
ACTs formally became Uganda’s first-line treatment foruncomplicatedmalaria in 2006, and the proportion of chil-drenwhoreceivedACTsinresponsetoexperiencingafeverquickly increased thereafter. Receipt ofACTs among febrilechildrenunder5intheNorthregionrosefrom19%in2008(95%CI:12%,27%)to69%in2011(95%CI:58%,79%),which
wasmuchhigherthanthenationalaverageof49%(95%CI:34%,65%).North’srapiduptakeofACTsmayreflectboththeregion’s need for malaria treatment, given its high malariatransmission rates, and the region’s responsiveness in pro-vidingthefirst-linetreatmenttopatients.
Theproportionof pregnantwomenwho received IPTp2remainedbelow10%until2005,afterwhichcoverageroseto28%in2010(95%CI:15%,43%). IPTp2coverageremainedat28%through2011,whichwascomparabletothenationalaverageof29%(95%CI:15%,50%).
Percent(%)
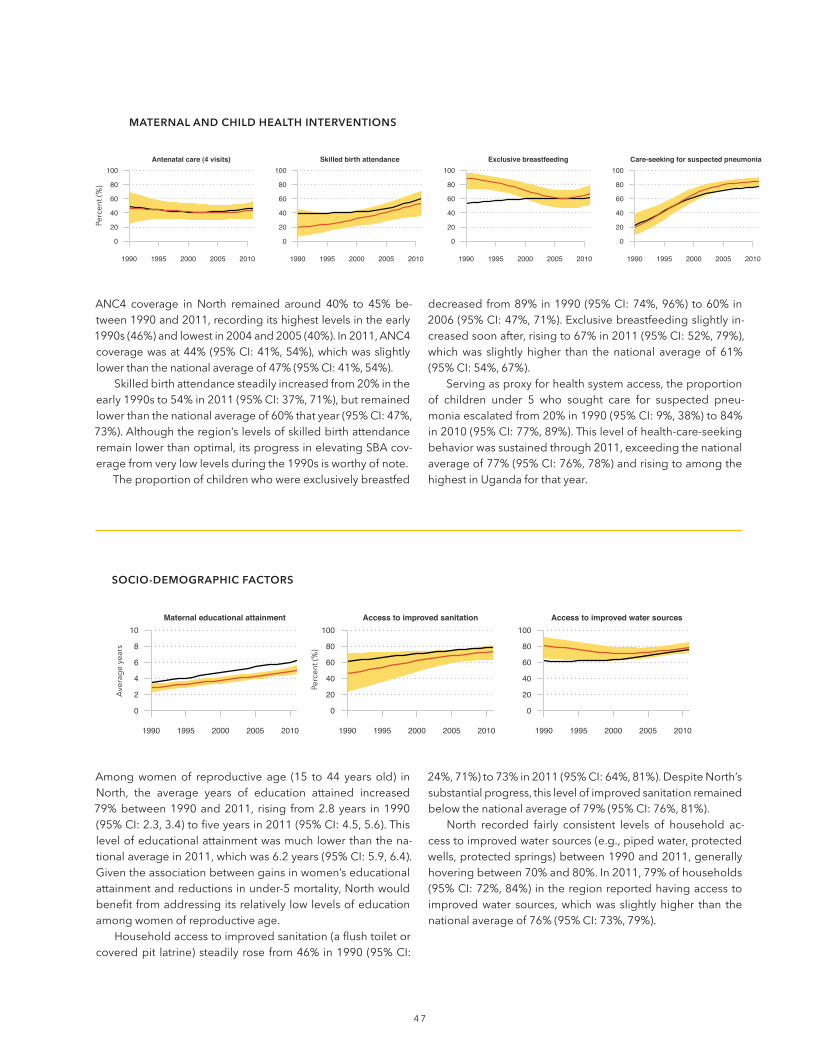
47
ANC4 coverage in North remained around 40% to 45% be-tween1990and2011,recordingitshighestlevelsintheearly1990s(46%)andlowestin2004and2005(40%).In2011,ANC4coveragewasat44%(95%CI:41%,54%),whichwasslightlylowerthanthenationalaverageof47%(95%CI:41%,54%).
Skilledbirthattendancesteadilyincreasedfrom20%intheearly1990sto54%in2011(95%CI:37%,71%),butremainedlowerthanthenationalaverageof60%thatyear(95%CI:47%,73%).Althoughtheregion’slevelsofskilledbirthattendanceremainlowerthanoptimal,itsprogressinelevatingSBAcov-eragefromverylowlevelsduringthe1990sisworthyofnote.
Theproportionofchildrenwhowereexclusivelybreastfed
decreasedfrom89%in1990(95%CI:74%,96%)to60%in2006(95%CI:47%,71%).Exclusivebreastfeedingslightlyin-creasedsoonafter,risingto67%in2011(95%CI:52%,79%),whichwas slightly higher than thenational averageof 61%(95%CI:54%,67%).
Servingasproxyforhealthsystemaccess,theproportionof children under 5 who sought care for suspected pneu-moniaescalatedfrom20%in1990(95%CI:9%,38%)to84%in2010(95%CI:77%,89%).Thislevelofhealth-care-seekingbehaviorwassustainedthrough2011,exceedingthenationalaverageof77%(95%CI:76%,78%)andrisingtoamongthehighestinUgandaforthatyear.
MATERNAL AND CHILD HEALTH INTERVENTIONS
Antenatal care (4 visits)
0
20
40
60
80
100
1990 1995 2000 2005 2010
Skilled birth attendance
0
20
40
60
80
100
1990 1995 2000 2005 2010
Exclusive breastfeeding
0
20
40
60
80
100
1990 1995 2000 2005 2010
Care-seeking for suspected pneumonia
0
20
40
60
80
100
1990 1995 2000 2005 2010
Amongwomenof reproductive age (15 to 44 years old) inNorth, the average years of education attained increased79%between1990and2011, rising from2.8years in1990(95%CI:2.3,3.4)tofiveyearsin2011(95%CI:4.5,5.6).Thislevelofeducationalattainmentwasmuchlowerthanthena-tionalaveragein2011,whichwas6.2years(95%CI:5.9,6.4).Giventheassociationbetweengainsinwomen’seducationalattainmentandreductionsinunder-5mortality,Northwouldbenefitfromaddressingitsrelativelylowlevelsofeducationamongwomenofreproductiveage.
Householdaccesstoimprovedsanitation(aflushtoiletorcoveredpit latrine)steadilyrosefrom46%in1990(95%CI:
24%,71%)to73%in2011(95%CI:64%,81%).DespiteNorth’ssubstantialprogress,thislevelofimprovedsanitationremainedbelowthenationalaverageof79%(95%CI:76%,81%).
North recorded fairly consistent levels of household ac-cesstoimprovedwatersources(e.g.,pipedwater,protectedwells,protectedsprings)between1990and2011,generallyhoveringbetween70%and80%.In2011,79%ofhouseholds(95%CI:72%,84%)intheregionreportedhavingaccesstoimprovedwater sources,whichwas slightlyhigher than thenationalaverageof76%(95%CI:73%,79%).
SOCIO-dEMOgRAPhIC fACTORS
Maternal educational attainment
0
2
4
6
8
10
1990 1995 2000 2005 2010
Access to improved sanitation
0
20
40
60
80
100
1990 1995 2000 2005 2010
Access to improved water sources
0
20
40
60
80
100
1990 1995 2000 2005 2010
Percent(%)
Averageyears
Percent(%)

4 8
sUMMaRyAll-causeunder-5mortalitysubstantiallydecreasedinSouth-west between 1990 and 2011, but nonetheless remainedhigher than thenationalaverage in2011.Reductions in theprevalenceofchildhoodunderweightwerelesspronouncedin the region.Prioritizingefforts toaccelerategains in childhealthoutcomes,especiallychildhoodunderweight, shouldbeconsidered.
ITN use by children under 5 and receipt of ACTs weremoderately scaled up in Southwest, but lagged behind na-tional trends. Immunization coverage improved for all keychildhoodvaccines,withtheregionbringingitscoverageofthepentavalentvaccinetoamongthehighestinUgandafor2011.Atthesametime,coverageofexclusivebreastfeedingbegan slipping after 2000, and skilled birth attendance re-mainedlowerthanthenationalaveragein2011.
Theregiondocumentedgainsintheproportionofhouse-holds with access to improved sanitation, rising to amongthehighestlevelsinthecountryby2011.Lessprogresswasrecordedfortheproportionofhouseholdswithaccesstoim-provedwatersources.
In 2011, Southwest generally exceeded the national av-erage for immunizations, except forBCG immunization.Ontheotherhand,theregionlargelyequaledorfellbelowthenationalaverageformalaria interventionsandmaternalandchild health interventions. For socio-demographic factors,Southwest had a much more mixed performance. In com-parisonwiththenationalaverage,Southwestshowedhigherlevels of under-5 mortality and similar levels of childhood underweight.
Malaria Immunizations Maternal and child health
INTERVENTIONS
ACT for fever, under-5
IPTp(2 doses)
Exclusivebreastfeeding
Antenatal care(4 visits)
ITNownership
ITN use, under-5
BCG PentavalentMeasles Polio Skilled birthattendance
Care for suspected
pneumonia
0
20
40
60
80
100
Perc
ent (
%)
Dea
ths
per
1,0
00 li
ve b
irth
s
40
60
80
100
120
140
CHILD HEALTH OUTCOMES
Childhoodunderweight
Under-5mortality
Household characteristics Educational attainment
SOCIO-DEMOGRAPHIC FACTORS
Improved sanitation
Improved water
0
20
40
60
80
100
Perc
ent (
%)
0
20
40
60
80
100
Perc
ent (
%)
Women of reproductive age
0
2
4
6
8
10
Ave
rag
e ye
ars
Range observed across regions
National average
Southwest
Range observed across regions
National average
Southwest
note: Estimatesofinterventioncoveragearefor2011,withbetterperformancereflectedbyhigherlevelsofcoverage.
Southwest
note:Estimatesofchildhealthoutcomesandsocio-demographicfactorsarefor2011.Betterperformanceisshownbylowerlevelsofchildhealthoutcomesandhigherlevelsforsocio-demographicfactors.

4 9
ITNownership remainedbelow10%until2006,afterwhichcoverageroseto58%in2011(95%CI:34%,81%).ThislevelofITNownershipwassimilartothenationalaverageof59%(95%CI:36%,79%).
The use of ITNs by children under 5 years old moder-atelyincreasedfrom12%in2007(95%CI:7%,22%)to35%in2011(95%CI:20%,52%).This levelof ITNusewaslowerthanthenationalaverageof39%(95%CI:27%,53%).Inthisregion,thedifferencebetweenITNownershipandITNusebychildrenunder5 (23percentagepoints)was slightlyhigherthanwhatwasobservedatthenationallevelfor2011(20per-centagepoints).
NodistrictsintheregionofSouthwesthadformallyimple-mentedIRSasof2011.
ACTsformallybecameUganda’sfirst-linetreatmentforun-complicatedmalariain2006,andtheproportionofchildrenin
SouthwestwhoreceivedACTsinresponsetoexperiencingafeversomewhatincreasedthereafter.ReceiptofACTsamongfebrilechildrenunder5 rose from3% in2008 (95%CI:2%,5%)to34%in2011(95%CI:24%,47%),whichwaswellbelowthenationalaverageof49%(95%CI:34%,65%)andamongthelowestinUgandaforthatyear.Theregion’srelativelymin-imaluptakeofACTsasof2011iscauseforconcern.
Theproportionofpregnantwomenwho received IPTp2remained below 10% until 2004, after which coverage in-creasedto34%in2009(95%CI:22%,50%).IPTp2coverageremainedat34%through2010,butslippedto32%in2011(95% CI: 17%, 49%); nonetheless, this level of IPTp2 wasslightly higher than the national average of 29% (95% CI: 15%,50%).
MALARIA INTERVENTIONS
ITN ownership
0
20
40
60
80
100
1990 1995 2000 2005 2010
ITN use by children under 5
0
20
40
60
80
100
1990 1995 2000 2005 2010
IPTp (2 doses)
0
20
40
60
80
100
1990 1995 2000 2005 2010
ACT received by febrile children under 5
0
20
40
60
80
100
1990 1995 2000 2005 2010
All-cause under-5 mortality
40
120
200
280
1990 1995 2000 2005 2010
Childhood underweight
0
20
40
60
80
100
1990 1995 2000 2005 2010
From1990to2011,theregionofSouthwestrecordedasignif-icantreductioninall-causeunder-5mortality,dropping38%from165deathsper1,000 livebirths in1990 (95%CI:138,196)to102in2011(95%CI:79,130).Despitethisprogress,theregion’sunder-5mortalityin2011washigherthanthena-tionalaverageof85deathsper1,000livebirths(95%CI:79,93).
The proportion of children who were underweight inSouthwesthoveredaround20%until2001,afterwhichpreva-lencedeclinedto16%in2010(95%CI:13%,20%).Childhoodunderweightremainedat16%through2011,whichwascom-parabletothenationalaverageof14%(95%CI:12%,15%).
CHILD HEALTH OUTCOMES
Nationaltrend Southwest Uncertaintyinterval
Deathsper1,000livebirths
Percent(%)
Percent(%)

5 0
Nationaltrend Southwest Uncertaintyinterval
TheproportionofchildrenwhoreceivedtheBCGvaccinein-creasedfrom82%intheearly1990sto91%in2010(95%CI:84%,95%).ThislevelofBCGimmunizationcoveragewassus-tainedthrough2011,slightlylowerthanthenationalaverageof94%(95%CI:89%,97%).
Measles immunization steadily rose from 69% in 1990(95%CI:42%,87%)to88%in2011(95%CI:78%,94%),whichwasslightlyhigherthanthenationalaverageof85%(95%CI:75%,91%).
Coverage of polio immunization remained somewhatconsistent from 1990 to 2011, generally hovering between
80%and90%during this time. In2011,polio immunizationcoveragewas83% inSouthwest (95%CI:63%,93%),muchhigherthanthenationalaverageof76%(95%CI:52%,90%).
The pentavalent vaccine was formally introduced inUgandain2002,afterwhichcoverageinSouthwestrapidlyin-creasedfrom42%in2004(95%CI:17%,73%)to88%in2009(95%CI:74%,95%).Pentavalentvaccinecoveragedippedto86%in2011(95%CI:69%,95%),butremainedwellabovethenationalaverageof77%(95%CI:51%,92%).
IMMUNIZATIONS
BCG immunization
0
20
40
60
80
100
1990 1995 2000 2005 2010
Measles immunization
0
20
40
60
80
100
1990 1995 2000 2005 2010
Polio immunization
0
20
40
60
80
100
1990 1995 2000 2005 2010
Pentavalent immunization
0
20
40
60
80
100
1990 1995 2000 2005 2010
ANC4 coverage largely remained between 30% and 35%duringthe1990sandearly2000s,butcoveragegraduallyin-creased,reaching50%in2011(95%CI:36%,62%).ThislevelofANC4wasslightlyhigherthanthenationalaverageof47%(95%CI:41%,54%).
TherewasasubstantialriseinskilledbirthattendanceinSouthwest, increasing from19% in1990 (95%CI:8%,43%)to51% in2011 (95%CI:34%,69%).While this levelofSBAcoverageremained lower than thenationalaverageof60%in 2011 (95% CI: 47%, 73%), Southwest’s gains in SBA are notable, especially given the region’s very low coverage in the1990s.
Theproportionofchildrenwhowereexclusivelybreastfedslowlyincreasedfrom55%in1990(95%CI:31%,78%)to64%in1999and2000.Exclusivebreastfeedingcoveragethende-clined,fallingto53%in2011(95%CI:36%,67%),whichwaswellbelowthenationalaverageof61%(95%CI:54%,67%).
Servingasproxyforhealthsystemaccess,theproportionof children under 5 who sought care for suspected pneu-moniaincreasedfrom28%in1990(95%CI:13%,48%)to69%in2007(95%CI:61%,77%).Thislevelofhealth-care-seekingbehaviorwassustainedthrough2008beforeslightlyslippingto67% in2011 (95%CI:56%,76%)and fallingmuch lowerthanthenationalaverageof77%(95%CI:76%,78%).
MATERNAL AND CHILD HEALTH INTERVENTIONS
Antenatal care (4 visits)
0
20
40
60
80
100
1990 1995 2000 2005 2010
Skilled birth attendance
0
20
40
60
80
100
1990 1995 2000 2005 2010
Exclusive breastfeeding
0
20
40
60
80
100
1990 1995 2000 2005 2010
Care-seeking for suspected pneumonia
0
20
40
60
80
100
1990 1995 2000 2005 2010
SOUTHwEST,continuedPercent(%)
Percent(%)

5 1
Amongwomenof reproductive age (15 to 44 years old) inSouthwest,theaverageyearsofeducationattainedmorethandoubledbetween1990and2011,risingfromthreeyearsin1990(95%CI:2.5,3.6)to6.1yearsin2011(95%CI:5.5,6.8).Thislevelofeducationalattainmentwascomparabletothena-tionalaveragein2011,whichwas6.2years(95%CI:5.9,6.4).
Household access to improved sanitation (a flush toiletorcoveredpitlatrine)steadilyrosefrom69%ofhouseholdswithimprovedsanitationin1990(95%CI:42%,87%)to95%in 2009 (95%CI: 92%, 96%). This level of improved sanita-tionwassustainedthrough2011,farexceedingthenational
averageof79% (95%CI:76%,81%)andbecomingamongthehighestinUgandaforthatyear.
The proportion of households with access to improvedwater sources (e.g.,pipedwater,protectedwells,protectedsprings)graduallyincreasedinSouthwest,risingfrom42%in1990(95%CI:26%,62%)to62%in2011(95%CI:53%,70%).The region consistently had lower levels of improvedwateraccess than the national trendbetween1990 and2011, re-cording among the lowest proportion of households withimprovedwaterinUgandafor2011.
SOCIO-dEMOgRAPhIC fACTORS
Maternal educational attainment
0
2
4
6
8
10
1990 1995 2000 2005 2010
Access to improved sanitation
0
20
40
60
80
100
1990 1995 2000 2005 2010
Access to improved water sources
0
20
40
60
80
100
1990 1995 2000 2005 2010
Averageyears
Percent(%)
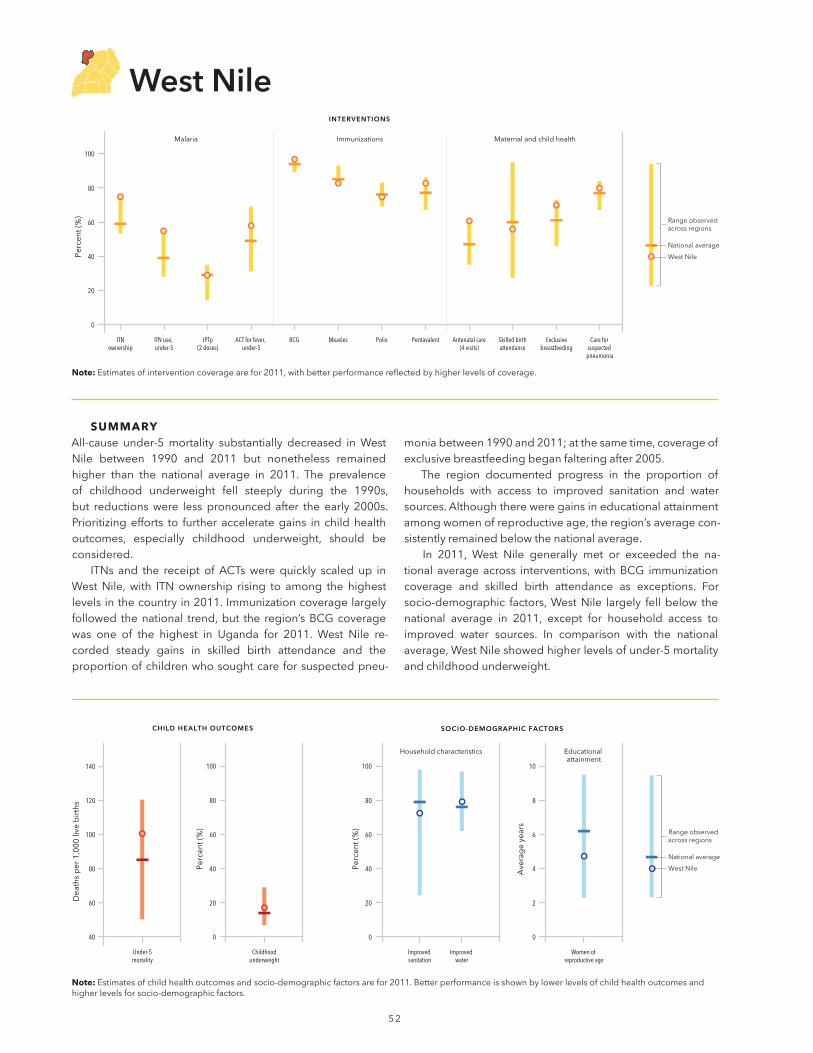
5 2
sUMMaRyAll-cause under-5mortality substantially decreased inWestNile between 1990 and 2011 but nonetheless remainedhigher than the national average in 2011. The prevalenceof childhood underweight fell steeply during the 1990s,but reductionswere less pronounced after the early 2000s. Prioritizingefforts to further accelerategains in childhealthoutcomes, especially childhood underweight, should be considered.
ITNs and the receipt ofACTswere quickly scaled up inWestNile, with ITN ownership rising to among the highestlevelsinthecountryin2011.Immunizationcoveragelargelyfollowed thenational trend,but the region’sBCGcoveragewas one of the highest in Uganda for 2011. West Nile re-corded steady gains in skilled birth attendance and theproportionofchildrenwhosoughtcareforsuspectedpneu-
moniabetween1990and2011;atthesametime,coverageofexclusivebreastfeedingbeganfalteringafter2005.
The region documented progress in the proportion ofhouseholds with access to improved sanitation and watersources.Althoughthereweregainsineducationalattainmentamongwomenofreproductiveage,theregion’saveragecon-sistentlyremainedbelowthenationalaverage.
In 2011, West Nile generally met or exceeded the na-tional average across interventions,withBCG immunizationcoverage and skilled birth attendance as exceptions. For socio-demographic factors,WestNile largely fell below thenational average in 2011, except for household access toimproved water sources. In comparison with the national average,WestNileshowedhigherlevelsofunder-5mortalityandchildhoodunderweight.
Malaria Immunizations Maternal and child health
INTERVENTIONS
ACT for fever, under-5
IPTp(2 doses)
Exclusivebreastfeeding
Antenatal care(4 visits)
ITNownership
ITN use, under-5
BCG PentavalentMeasles Polio Skilled birthattendance
Care for suspected
pneumonia
0
20
40
60
80
100
Perc
ent (
%)
Dea
ths
per
1,0
00 li
ve b
irth
s
40
60
80
100
120
140
CHILD HEALTH OUTCOMES
Childhoodunderweight
Under-5mortality
Household characteristics Educational attainment
SOCIO-DEMOGRAPHIC FACTORS
Improved sanitation
Improved water
0
20
40
60
80
100
Perc
ent (
%)
0
20
40
60
80
100
Perc
ent (
%)
Women of reproductive age
0
2
4
6
8
10
Ave
rag
e ye
ars
Range observed across regions
National average
West Nile
Range observed across regions
National average
West Nile
note:Estimatesofinterventioncoveragearefor2011,withbetterperformancereflectedbyhigherlevelsofcoverage.
West nile
note:Estimatesofchildhealthoutcomesandsocio-demographicfactorsarefor2011.Betterperformanceisshownbylowerlevelsofchildhealthoutcomesandhigherlevelsforsocio-demographicfactors.
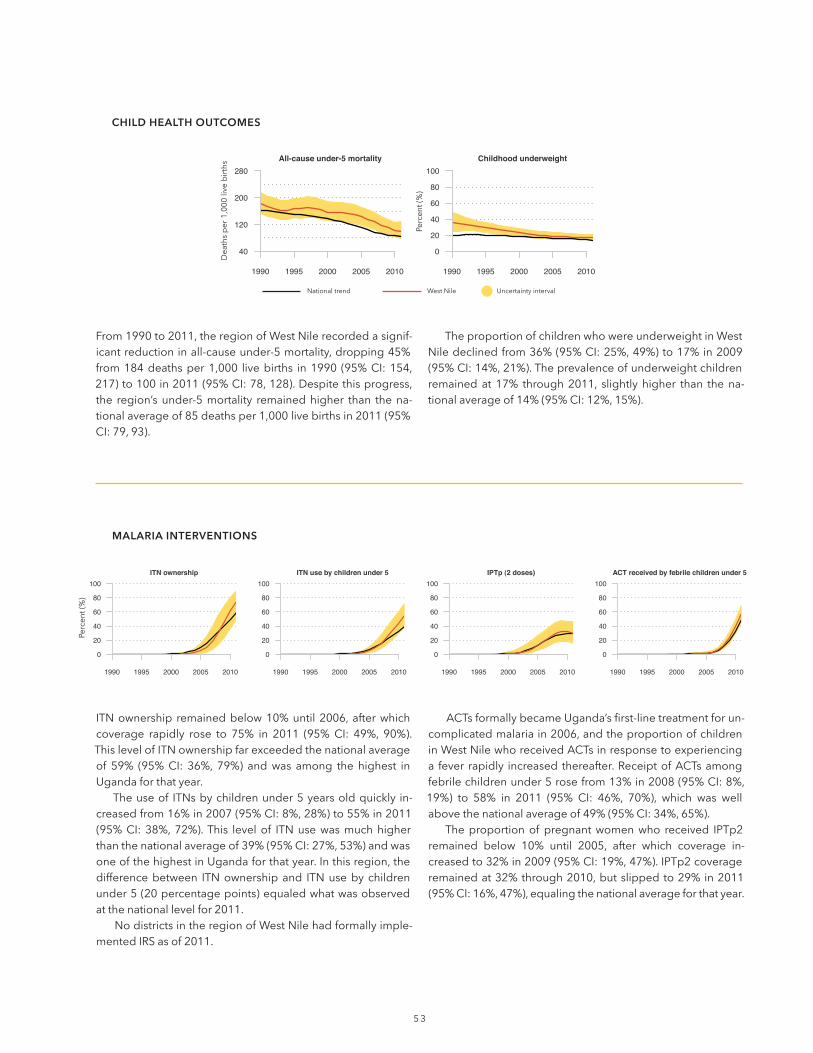
5 3
ITNownership remainedbelow10%until2006,afterwhichcoverage rapidly rose to 75% in 2011 (95%CI: 49%, 90%).ThislevelofITNownershipfarexceededthenationalaverageof 59% (95%CI: 36%, 79%) andwas among the highest inUgandaforthatyear.
Theuseof ITNsbychildrenunder5yearsoldquickly in-creasedfrom16%in2007(95%CI:8%,28%)to55%in2011(95%CI:38%,72%).This levelof ITNusewasmuchhigherthanthenationalaverageof39%(95%CI:27%,53%)andwasoneofthehighestinUgandaforthatyear.Inthisregion,thedifferencebetween ITNownershipand ITNusebychildrenunder5(20percentagepoints)equaledwhatwasobservedatthenationallevelfor2011.
NodistrictsintheregionofWestNilehadformallyimple-mentedIRSasof2011.
ACTsformallybecameUganda’sfirst-linetreatmentforun-complicatedmalariain2006,andtheproportionofchildreninWestNilewhoreceivedACTsinresponsetoexperiencinga fever rapidly increasedthereafter.ReceiptofACTsamongfebrilechildrenunder5rosefrom13%in2008(95%CI:8%,19%) to 58% in 2011 (95% CI: 46%, 70%), which was wellabovethenationalaverageof49%(95%CI:34%,65%).
Theproportionofpregnantwomenwho received IPTp2remained below 10% until 2005, after which coverage in-creasedto32%in2009(95%CI:19%,47%).IPTp2coverageremainedat32%through2010,butslippedto29%in2011(95%CI:16%,47%),equalingthenationalaverageforthatyear.
MALARIA INTERVENTIONS
ITN ownership
0
20
40
60
80
100
1990 1995 2000 2005 2010
ITN use by children under 5
0
20
40
60
80
100
1990 1995 2000 2005 2010
IPTp (2 doses)
0
20
40
60
80
100
1990 1995 2000 2005 2010
ACT received by febrile children under 5
0
20
40
60
80
100
1990 1995 2000 2005 2010
All-cause under-5 mortality
40
120
200
280
1990 1995 2000 2005 2010
Childhood underweight
0
20
40
60
80
100
1990 1995 2000 2005 2010
From1990to2011,theregionofWestNilerecordedasignif-icantreductioninall-causeunder-5mortality,dropping45%from184deathsper1,000 livebirths in1990 (95%CI:154,217)to100in2011(95%CI:78,128).Despitethisprogress,the region’sunder-5mortality remainedhigher than thena-tionalaverageof85deathsper1,000livebirthsin2011(95%CI:79,93).
TheproportionofchildrenwhowereunderweightinWestNiledeclinedfrom36%(95%CI:25%,49%)to17%in2009(95%CI:14%,21%).Theprevalenceofunderweightchildrenremainedat 17% through2011, slightlyhigher than thena-tionalaverageof14%(95%CI:12%,15%).
CHILD HEALTH OUTCOMES
Nationaltrend WestNile Uncertaintyinterval
Deathsper1,000livebirths
Percent(%)
Percent(%)

5 4
Nationaltrend WestNile Uncertaintyinterval
The proportion of children who received the BCG vaccinesteadily rose from81% in1990 (95%CI:63%,92%) to97%in2011(95%CI:93%,98%),exceedingthenationalaverageof94%(95%CI:89%,97%)andrisingtoamongthehighestlevelsofcoverageinUgandaforthatyear.
Measlesimmunizationincreasedfrom62%in1990(95%CI: 36%, 82%) to 83% in 2011 (95% CI: 71%, 91%), which was comparable to the national average of 85% (95% CI: 75%,91%).
Coverage of polio immunization remained somewhatconsistentfrom1990to2011,rangingfrom68%in1990(95%
CI:38%,88%)to79%between2001and2006.In2011,polioimmunizationcoveragewas75%(95%CI:48%,89%),whichwas comparable to the national average of 76% (95% CI: 52%,90%).
The pentavalent vaccine was formally introduced inUganda in 2002, after which coverage inWest Nile rapidlyincreased from34% in2004 (95%CI: 12%,67%) to83% in2011 (95%CI: 60%,93%).This levelofpentavalent vaccinecoveragewasslightlyhigherthanthenationalaverageof77%(95%CI:51%,92%).
IMMUNIZATIONS
BCG immunization
0
20
40
60
80
100
1990 1995 2000 2005 2010
Measles immunization
0
20
40
60
80
100
1990 1995 2000 2005 2010
Polio immunization
0
20
40
60
80
100
1990 1995 2000 2005 2010
Pentavalent immunization
0
20
40
60
80
100
1990 1995 2000 2005 2010
ANC4 coverage remained below 50% through 2003, afterwhichcoveragegraduallyincreasedto61%in2011(95%CI:49%,73%).ThislevelofANC4wasmuchhigherthanthena-tionalaverageof47%(95%CI:41%,54%).
TherewasasubstantialriseinskilledbirthattendanceinWestNile, increasing from15% in 1990 (95%CI: 6%, 34%)to56% in2011 (95%CI:37%,73%).While this levelofSBAcoverage remainedslightly lower than thenationalaverageof60%in2011(95%CI:47%,73%),WestNile’sgainsinSBAarenotable,especiallygiventheregion’svery lowcoverageinthe1990s.
Theproportionofchildrenwhowereexclusivelybreastfedslowlyincreasedfrom72%in1990(95%CI:50%,89%)to82%
in 2001 (95% CI: 72%, 88%). This level of exclusive breast-feeding coverage was sustained through 2005, after whichcoveragefellto70%in2011(95%CI:55%,81%).Nonetheless,West Nile’s coverage of exclusive breastfeeding remainedabove thenational averageof 61% (95%CI: 54%, 67%) forthatyear.
Servingasproxyforhealthsystemaccess,theproportionof children under 5 who sought care for suspected pneu-moniaclimbedfrom14%in1990(95%CI:6%,27%)to80%in2011(95%CI:71%,87%).Thislevelofhealth-care-seekingbehaviorwasslightlyhigherthanthenationalaverageof77%(95%CI:76%,78%).
MATERNAL AND CHILD HEALTH INTERVENTIONS
Antenatal care (4 visits)
0
20
40
60
80
100
1990 1995 2000 2005 2010
Skilled birth attendance
0
20
40
60
80
100
1990 1995 2000 2005 2010
Exclusive breastfeeding
0
20
40
60
80
100
1990 1995 2000 2005 2010
Care-seeking for suspected pneumonia
0
20
40
60
80
100
1990 1995 2000 2005 2010
wEST NILE,continuedPercent(%)
Percent(%)

5 5
Amongwomenof reproductive age (15 to 44 years old) inWest Nile, the average years of education attained morethandoubledbetween1990and2011,risingfrom2.1yearsin1990 (95%CI:1.8,2.6) to4.7years in2011 (95%CI:4.2,5.3).Despitethisprogress,WestNile’slevelofeducationalat-tainmentwasmuchlowerthanthenationalaveragein2011,whichwas6.2years(95%CI:5.9,6.4).
Household access to improved sanitation (a flush toiletorcoveredpitlatrine)steadilyrosefrom48%ofhouseholdswithimprovedsanitationin1990(95%CI:24%,74%)to72%
in2011(95%CI:62%,80%).Thiswaslowerthanthenationalaverageof79%(95%CI:76%,81%).
The proportion of households with access to improvedwater sources (e.g.,pipedwater,protectedwells,protectedsprings) steadily increased inWestNile, rising from56% in1990(95%CI:37%,74%)to79%in2011(95%CI:72%,84%).This level of access to improvedwater sources was slightlyhigher than the national average for 2011, which was 76%(95%CI:73%,79%).
SOCIO-dEMOgRAPhIC fACTORS
Maternal educational attainment
0
2
4
6
8
10
1990 1995 2000 2005 2010
Access to improved sanitation
0
20
40
60
80
100
1990 1995 2000 2005 2010
Access to improved water sources
0
20
40
60
80
100
1990 1995 2000 2005 2010
Averageyears
Percent(%)

5 6
sUMMaRyAll-cause under-5 mortality substantially decreased inWesternbetween1990and2011butnonethelessremainedhigherthanthenationalaveragein2011.Lessprogresswasrecorded for reducing the prevalence of childhood under-weight over time. Prioritizing efforts to accelerate gains inchild health outcomes, especially childhood underweight,shouldbeconsidered.
ITN ownership and the receipt of ACTs were quicklyscaledupinWestern,buttheuseof ITNsbychildrenunder5 lagged slightly behind the national trend. Immunizationcoveragelargelyfollowedthenationaltrend,buttheregion’smeaslescoveragewasoneofthehighestinUgandafor2011.Westernrecordedsteadygainsintheproportionofchildrenwho sought care for suspected pneumonia between 1990and 2011, whereas progress for other maternal and child
healthinterventionswasmuchmoregradual.Theregiondocumentedariseintheproportionofhouse-
holdswithaccesstoimprovedsanitationandimprovedwatersources.Althoughthereweregainsineducationalattainmentamongwomenofreproductiveage,theregion’saveragecon-sistentlyremainedbelowthenationalaverage.
In2011,Westerngenerallymetorexceededthenationalaverageacrossinterventions,withITNusebychildrenunder5and skilled birth attendance as exceptions. For socio- demographicfactors,Westernlargelyfellbelowthenationalaverage in 2011, except for household access to improvedsanitation.Incomparisonwiththenationalaverage,Westernshowedhigherlevelsofunder-5mortalityandsimilarlevelsofchildhoodunderweight.
Malaria Immunizations Maternal and child health
INTERVENTIONS
ACT for fever, under-5
IPTp(2 doses)
Exclusivebreastfeeding
Antenatal care(4 visits)
ITNownership
ITN use, under-5
BCG PentavalentMeasles Polio Skilled birthattendance
Care for suspected
pneumonia
0
20
40
60
80
100
Perc
ent (
%)
Dea
ths
per
1,0
00 li
ve b
irth
s
40
60
80
100
120
140
CHILD HEALTH OUTCOMES
Childhoodunderweight
Under-5mortality
Household characteristics Educational attainment
SOCIO-DEMOGRAPHIC FACTORS
Improved sanitation
Improved water
0
20
40
60
80
100
Perc
ent (
%)
0
20
40
60
80
100
Perc
ent (
%)
Women of reproductive age
0
2
4
6
8
10
Ave
rag
e ye
ars
Range observed across regions
National average
Western
Range observed across regions
National average
Western
note: Estimatesofinterventioncoveragearefor2011,withbetterperformancereflectedbyhigherlevelsofcoverage.
Western
note:Estimatesofchildhealthoutcomesandsocio-demographicfactorsarefor2011.Betterperformanceisshownbylowerlevelsofchildhealthoutcomesandhigherlevelsforsocio-demographicfactors.

57
ITNownership remainedbelow10%until2007,afterwhichcoveragerapidlyroseto63%in2011(95%CI:36%,84%).ThislevelofITNownershipwashigherthanthenationalaverageof59%(95%CI:36%,79%).
Theuseof ITNsbychildrenunder5yearsoldquickly in-creasedfrom12%in2008(95%CI:7%,21%)to35%in2011(95%CI:21%,54%).ThislevelofITNusewaslowerthanthenationalaverageof39% (95%CI:27%,53%). In this region,thedifferencebetween ITNownership and ITNuseby chil-dren under 5 (28percentagepoints)was higher thanwhatwas observed at the national level (20 percentage points) for 2011.
Nodistricts intheregionofWesternhadformally imple-mentedIRSasof2011.
ACTs formally became Uganda’s first-line treatment for uncomplicated malaria in 2006, and the proportion ofchildreninWesternwhoreceivedACTsinresponsetoexpe-riencingafeverrapidlyincreasedthereafter.ReceiptofACTsamong febrilechildrenunder5 rose from9% in2008 (95%CI:6%,13%)to50%in2011(95%CI:37%,63%),whichwas similartothenationalaverageof49%(95%CI:34%,65%).
Theproportionofpregnantwomenwho received IPTp2remained below 10% until 2004, after which coverage increased to 33% in 2010 (95% CI: 20%, 49%). IPTp2 coverageremainedat33%through2011,slightlyexceedingthe nationalaverageof29%(95%CI:15%,50%).
MALARIA INTERVENTIONS
ITN ownership
0
20
40
60
80
100
1990 1995 2000 2005 2010
ITN use by children under 5
0
20
40
60
80
100
1990 1995 2000 2005 2010
IPTp (2 doses)
0
20
40
60
80
100
1990 1995 2000 2005 2010
ACT received by febrile children under 5
0
20
40
60
80
100
1990 1995 2000 2005 2010
All-cause under-5 mortality
40
120
200
280
1990 1995 2000 2005 2010
Childhood underweight
0
20
40
60
80
100
1990 1995 2000 2005 2010
From1990to2011,theregionofWesternrecordedasignif-icantreductioninall-causeunder-5mortality,dropping40%from165deathsper1,000 livebirths in1990 (95%CI:141,192) to99 in2011 (95%CI: 80,122).Despite thisprogress, the region’s under-5 mortality remained higher than the national averageof 85deathsper 1,000 livebirths in 2011(95%CI:79,93).
The proportion of children who were underweight inWesternremainedbetween16%and18%from1990to2011.In 2011, Western’s prevalence of childhood underweightwas16%(95%CI:13%,20%),whichwascomparabletothenationalaverageof14%(95%CI:12%,15%).Theregion’srel-ativelyminimalprogressinreducingchildhoodunderweightiscauseforconcern.
CHILD HEALTH OUTCOMES
Nationaltrend Western Uncertaintyinterval
Deathsper1,000livebirths
Percent(%)
Percent(%)

5 8
Nationaltrend Western Uncertaintyinterval
The proportion of children who received the BCG vaccinesteadily rose from79% in1990 (95%CI:61%,90%) to95%in2011(95%CI:90%,97%),whichwassimilartothenationalaverageof94%(95%CI:89%,97%).
Measlesimmunizationincreasedfrom63%in1990(95%CI:37%,83%)to93%in2011(95%CI:86%,96%),whichfarexceeded thenational averageof85% (95%CI:75%,91%)andwasamongthehighestlevelsofcoverageinthecountry.
Coverage of polio immunization gradually increasedfrom73%in1990(95%CI:47%,90%)to86%in2001(95%CI:71%,93%).Thislevelofcoveragewassustainedthrough2005,butfellto80%in2011(95%CI:59%,92%).Nonetheless,
Western’s polio immunization coverage remained slightlyhigher than the national average for 2011, which was 76%(95%CI:52%,90%).
The pentavalent vaccine was formally introduced inUganda in 2002, after which coverage in Western rapidlyincreased from38% in2004 (95%CI: 14%,69%) to83% in2009 (95%CI: 65%,93%).This levelofpentavalent vaccinecoveragewassustainedthrough2010,afterwhichcoverageslippedto82%(95%CI:61%,94%);nonetheless,Western’scoverageofthepentavalentvaccinewashigherthanthena-tionalaverageof77%(95%CI:51%,92%).
IMMUNIZATIONS
BCG immunization
0
20
40
60
80
100
1990 1995 2000 2005 2010
Measles immunization
0
20
40
60
80
100
1990 1995 2000 2005 2010
Polio immunization
0
20
40
60
80
100
1990 1995 2000 2005 2010
Pentavalent immunization
0
20
40
60
80
100
1990 1995 2000 2005 2010
ANC4 coverage remained below 40% through 2007, afterwhichcoveragegraduallyroseto49%in2011(95%CI:36%,61%).ThislevelofANC4wassimilartothenationalaverageof47%(95%CI:41%,54%).
Skilled birth attendance steadily climbed from 28% in1990(95%CI:11%,56%)to53%in2011(95%CI:33%,69%),butremainedlowerthanthenationalaverageof60%(95%CI:47%,73%).
Theproportionofchildrenwhowereexclusivelybreastfedgraduallyrosefrom49%in1990(95%CI:26%,73%)to69%in
2011(95%CI:54%,80%),whichwashigherthanthenationalaverageof61%(95%CI:54%,67%).
Servingasproxyforhealthsystemaccess,theproportionof children under 5 who sought care for suspected pneu-monia substantially increased from 26% in 1990 (95% CI:13%,47%)to79%in2011(95%CI:71%,86%).This levelofhealth-care-seekingbehaviorwascomparabletothenationalaverageof77%(95%CI:76%,78%).
MATERNAL AND CHILD HEALTH INTERVENTIONS
Antenatal care (4 visits)
0
20
40
60
80
100
1990 1995 2000 2005 2010
Skilled birth attendance
0
20
40
60
80
100
1990 1995 2000 2005 2010
Exclusive breastfeeding
0
20
40
60
80
100
1990 1995 2000 2005 2010
Care-seeking for suspected pneumonia
0
20
40
60
80
100
1990 1995 2000 2005 2010
wESTERN,continuedPercent(%)
Percent(%)
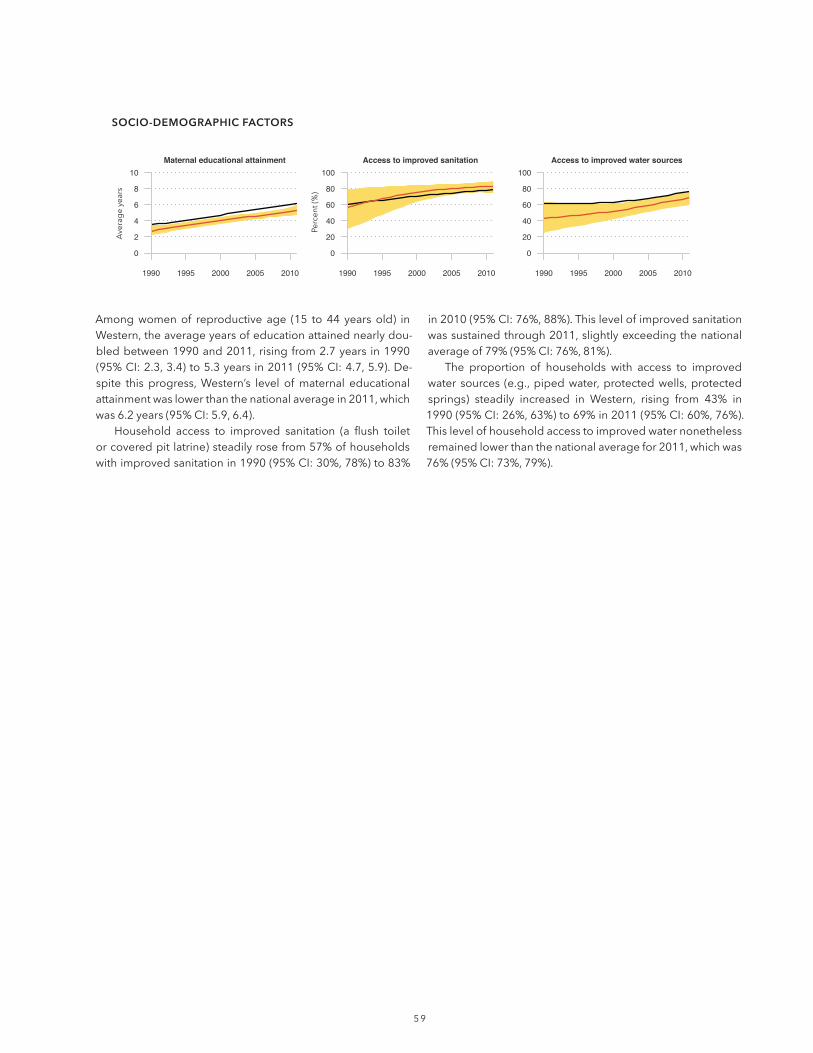
5 9
Amongwomenof reproductive age (15 to 44 years old) inWestern,theaverageyearsofeducationattainednearlydou-bledbetween1990and2011,risingfrom2.7years in1990(95%CI:2.3,3.4)to5.3yearsin2011(95%CI:4.7,5.9).De-spite this progress,Western’s level ofmaternal educationalattainmentwaslowerthanthenationalaveragein2011,whichwas6.2years(95%CI:5.9,6.4).
Household access to improved sanitation (a flush toiletorcoveredpitlatrine)steadilyrosefrom57%ofhouseholdswithimprovedsanitationin1990(95%CI:30%,78%)to83%
in2010(95%CI:76%,88%).Thislevelofimprovedsanitationwassustainedthrough2011,slightlyexceedingthenationalaverageof79%(95%CI:76%,81%).
The proportion of households with access to improvedwater sources (e.g.,pipedwater,protectedwells,protectedsprings) steadily increased in Western, rising from 43% in1990(95%CI:26%,63%)to69%in2011(95%CI:60%,76%).Thislevelofhouseholdaccesstoimprovedwaternonethelessremainedlowerthanthenationalaveragefor2011,whichwas76%(95%CI:73%,79%).
SOCIO-dEMOgRAPhIC fACTORS
Maternal educational attainment
0
2
4
6
8
10
1990 1995 2000 2005 2010
Access to improved sanitation
0
20
40
60
80
100
1990 1995 2000 2005 2010
Access to improved water sources
0
20
40
60
80
100
1990 1995 2000 2005 2010
Averageyears
Percent(%)

INSTITUTE FOR HEALTH METRICS AND EVALUATION
2301 Fifth Ave., Suite 600
Seattle, WA 98121
USA
TELEPHONE: +1-206-897-2800
FAX: +1-206-897-2899
EMAIL: [email protected]
www.healthdata.org