Embed Size (px)
Citation preview
432 South Park Avenue, 13th Floor, New York, NY10016, United States
Phone: +1-646-884-7422; Fax: +1-212-548-5720 Websites: www.earth.columbia.edu/mci; www.vcc.columbia.edu
MCI AND VCC WORKING PAPER SERIES ON INVESTMENT IN THE MILLENNIUM CITIES
No 05/2008
ASSESSING INFRASTRUCTURE CONSTRAINTS ON BUSINESS ACTIVITY IN KISUMU, KENYA
Jacob Winiecki
OCTOBER 2008
2
MCI and VCC Working Paper Series No 05/2008 Editor-in-Chief: Dr. Karl P. Sauvant, Co-Director, Millennium Cities Initiative, and Executive Director, Vale Columbia Center on Sustainable International Investment: [email protected] Editor: Joerg Simon, Senior Investment Advisor, Millennium Cities Initiative: [email protected] Managing Editor: Paulo Cunha, Coordinator, Millennium Cities Initiative: [email protected]
Copyright © 2008 by the Millennium Cities Initiative (MCI). All rights reserved. Unless otherwise indicated, this working paper may be reproduced, quoted or cited without permission of the author(s) provided there is proper acknowledgement. The responsibility for the contents of this Working Paper remains with the author(s). Accordingly, this publication is for informational purposes only and is meant to be purely educational. While our objective is to provide useful, general information, the Millennium Cities Initiative and the Vale Columbia Center make no representations or assurances as to the accuracy, completeness, or timeliness of the information. The information is provided without warranty of any kind, express or implied. This publication does not constitute an offer, solicitation, or recommendation for the sale or purchase of any security, product, or service. Information, opinions and views contained in this publication should not be treated as investment, tax or legal advice. Before making any decision or taking any action, you should consult a professional advisor who has been informed of all facts relevant to your particular circumstances.
The Millennium Cities Initiative (MCI) is a project of The Earth Institute at Columbia University, directed by Professor Jeffrey D. Sachs. It was established in early 2006 to help sub-Saharan African cities achieve the Millennium Development Goals (MDGs). As part of this effort, MCI helps the Cities to create employment, stimulate enterprise development and foster economic growth, especially by stimulating domestic and foreign investment, to eradicate extreme poverty – the first and most fundamental MDG. This effort rests on three pillars: (i) the preparation of various materials to inform foreign investors about the regulatory framework for investment and commercially viable investment opportunities; (ii) the dissemination of the various materials to potential investors, such as through investors’ missions and roundtables, and Millennium Cities Investors’ Guides; and (iii) capacity building in the Cities to attract and work with investors. The Vale Columbia Center on Sustainable International Investment promotes learning, teaching, policy-oriented research, and practical work within the area of foreign direct investment, paying special attention to the sustainable development dimension of this investment. It is a joint center of Columbia Law School and The Earth Institute at Columbia University. Correspondence should be directed at any of the editors. A separate MCI working papers series on the social sector will be available. For more information, please refer to the MCI website at: http://www.earth.columbia.edu/mci/ and the Vale Columbia Center website at: http://www.vcc.columbia.edu/.
3
TABLE OF CONTENTS Executive Summary .............................................................................................................................4 1. Purpose..............................................................................................................................................6 2. Methodology.....................................................................................................................................6
2.1 Limits to Research.....................................................................................................................7 3. Summary Results..............................................................................................................................7
3.1 Electricity....................................................................................................................................8 3.2 Liquid Fuels................................................................................................................................9 3.3 Water.........................................................................................................................................10 3.4 Wastewater ...............................................................................................................................11 3.5 Solid Waste...............................................................................................................................11 3.6 Telecommunications...............................................................................................................11 3.7 Ground Transport...................................................................................................................12 3.8 Air Transport ...........................................................................................................................15 3.9 Land ..........................................................................................................................................15 3.10 Security ...................................................................................................................................16 3.11 Other Considerations ...........................................................................................................16
4. Sectoral Comparison .....................................................................................................................16 5. Opportunities for Investment in Infrastructure........................................................................18 6. Conclusion ......................................................................................................................................20 7. Annex ..............................................................................................................................................21 8. References.......................................................................................................................................25
4
Assessing Infrastructure Constraints on Business Activity in Kisumu, Kenya
Jacob Winiecki
Executive Summary The success of commercial activities in any city depends in great part upon the quality of infrastructure services available to businesses including (but not limited to) reliable electricity and liquid fuel supplies to power engines, sufficient supplies of clean water for irrigation and industrial processes, and reliable roads for obtaining raw materials and transporting finished goods in a timely and cost efficient manner. Poor quality infrastructure can drive up the cost of doing business and constrain economic growth in any city. The current state of infrastructure and related services in Kisumu presents a range of obstacles to commercial activities in and around the city. This study found that the major infrastructure constraints to business growth in Kisumu are related to poor roads outside the city limits, power shortages, liquid fuel supply shortages, and poor quality and unreliable water supply. The poor condition of roads outside of Kisumu – particularly the main artery connecting the city with Nairobi – is by far the largest infrastructure constraint impacting business activity in the region. Fourteen out of 21 businesses interviewed in this study indicated that poor quality roads are the number one infrastructure limitation preventing their business from reaching its full potential. Poor quality roads cause damage to vehicles, increase transport time, limit tourism potential, and drive up the cost of obtaining raw materials and transporting finished goods. The current condition of roads connecting Kisumu with other major cities can be partially attributed to increased traffic resulting from a breakdown in lake and rail transport over the last two decades connecting Kenya with Uganda, Tanzania and other nearby countries. Following road infrastructure, businesses identified the poor quality and unreliable supply of electricity as the largest constraint to business activity in Kisumu. Although electricity supply has increased over the last five years, maintenance of distribution infrastructure has been largely ignored over the last twenty years leading to frequent power outages that can cripple commercial activity. Of the 21 businesses interviewed, 19 experienced power outages of more than 15 minutes more than once per week. Most businesses have at least one source of back-up power on site (usually a diesel-powered generator), though several businesses must close down operations when the power cuts off. The quality of electricity is also an issue in Kisumu with power surges frequently destroying equipment. Many businesses in Kisumu rely upon diesel fuel to power machines and backup generators. Shortages in diesel fuel have become a major constraint to business in Kisumu, largely due to an insufficient capacity at the main refinery in Mombasa. Fifteen out of 21 businesses interviewed indicated that the supply of diesel in Kisumu does not keep up with demand, causing shortages that can last up to three to four weeks. In response, many businesses must invest in underground backup tanks in order to ensure continuous operation, locking up large amounts of capital that could be used for other purposes.
5
The quality and unreliable supply of water is also a major constraint to business activity in Kisumu. Eleven out of 21 businesses experience water supply interruptions – three experiencing interruptions once per month and eight experience shortages once per week or more. To cope with supply interruptions, businesses are forced to invest in large back-up tanks or add boreholes to facilities. The poor quality of water – particularly water obtained from the Municipality – forces many businesses to expend resources on the purchase and installation of internal water treatment systems. Collectively, these obstacles drive up the cost of doing business in Kisumu considerably. However, it is encouraging to note that most of the businesses interviewed for this study can still operate profitably even when faced with major infrastructure constraints. Additionally, several categories of infrastructure investigated in this study have had minimal negative impacts on businesses, including: telecommunications, security, wastewater, and access to land. Additionally, respondents identified several opportunities for investment in infrastructure and related services that could prove to be both profitable enterprise activities and improve the local operating environment for commercial entities, including: improved lake and rail transportation, privately managed roads, solid waste and recycling collection, public transportation and building infrastructure.
6
1. Purpose The primary objective of this study is to better understand the current infrastructure constraints faced by commercial enterprises active in the Kisumu region and to identify key opportunities for investment in infrastructure that could enable existing and future businesses to operate at full capacity. Prior to this study, anecdotal evidence suggested that most businesses in Kisumu were operating below full capacity due to shortages of water, electricity, and fuels as well as the high costs of transporting raw materials and finished goods resulting from poor road infrastructure. Research conducted by MCI in Kisumu over the last year – through a literature review and interviews with government officials – has also identified infrastructure as a main constraint to business growth in the region. This study aims to understand how the current state of infrastructure impacts commercial activity in Kisumu from the perspective of the businesses themselves. Most importantly, this study was undertaken to understand the various coping mechanisms used by businesses to deal with infrastructure challenges and to solicit recommendations for infrastructure investment opportunities. For the purposes of this study, infrastructure includes energy (electricity and fuels), water, wastewater, solid waste, ground and air transportation, telecommunications, buildings, land and security.
2. Methodology This study presents an overview of how the current state of traditional infrastructure constrains industrial activity in Kisumu. The report also identifies areas of potential investment in infrastructure expansion and improvement. Data has been obtained through interviews with management staff of 21 commercial enterprises, using a standard infrastructure survey (see Appendix). All responses have been reported anonymously. The researcher aimed to gather perspectives from a random sample of commercial entities and thus targeted a diverse group of small (fewer than 20 employees), medium (20-100 employees), and large (more than 100 employees). Participating interviewees operate commercial ventures in a wide range of sectors as outlined in the table below. Over 40 businesses were invited to participate in this study. The field research was conducted in June 2007. Businesses Interviewed Date of Interview Sector Products/Services Number of Employees
6/15/07 Fisheries Lake fish processing and distribution
About 100
6/15/07 Agriculture Rice farming and processing About 100
6/18/07 Agriculture Industrial ethanol and yeast Production
About 175
6/18/07 Food production Grain milling and bread baking Over 500
7
6/20/07 Transportation Vehicle sales and maintenance
About 50
6/20/07 Agriculture Sugarcane farming and transport
Over 500
6/21/07 Real estate Sales and marketing of housing and commercial space
Less than 10
6/21/07 Transportation Rail transportation of people and goods
Over 100
6/21/07 Waste disposal and recycling
Plastic recycling and processing
Over 25
6/21/07 Hotels and restaurants Restaurants and catering Services
About 80
6/22/07 Mining Limestone mining and processing
Over 50
6/25/07 Security Guard security and home/ business security systems
About 1000
6/26/07 Transportation Lake transportation of fuel Less than 20
6/27/07 Food production Bread bakery Over 100
6/27/07 Agriculture Sugarcane farming and processing
Over 100
6/27/07 Transportation Lake transport of people and vehicles
About 30
6/27/07 Food production Sugar and flour confectionaries
Over 100
6/28/07 Transportation Cargo clearing and forwarding Over 50
6/28/07 Construction Road construction/ maintenance and civil engineering services
Over 300
6/28/07 Hotels and restaurants Upper market hotel Over 100
6/28/07 Agriculture Various farming and agriculture processing activities
Over 500
2.1 Limits to Research
A total of 28 interviews were conducted for the purposes of this study. Data from seven of the 28 interviews conducted during the field visit is not included in this analysis for various reasons, including an unwillingness on the part of the interviewee to release sensitive information; and the relatively small size (fewer than three employees) of a particular business. Several non-governmental organizations were interviewed, but their responses were not included as they do not represent commercial interests. The limited amount of time on the ground also placed some constraints on the research.
3. Summary Results
The following is a summary of responses obtained through interviews conducted in June 2007.
8
3.1 Electricity
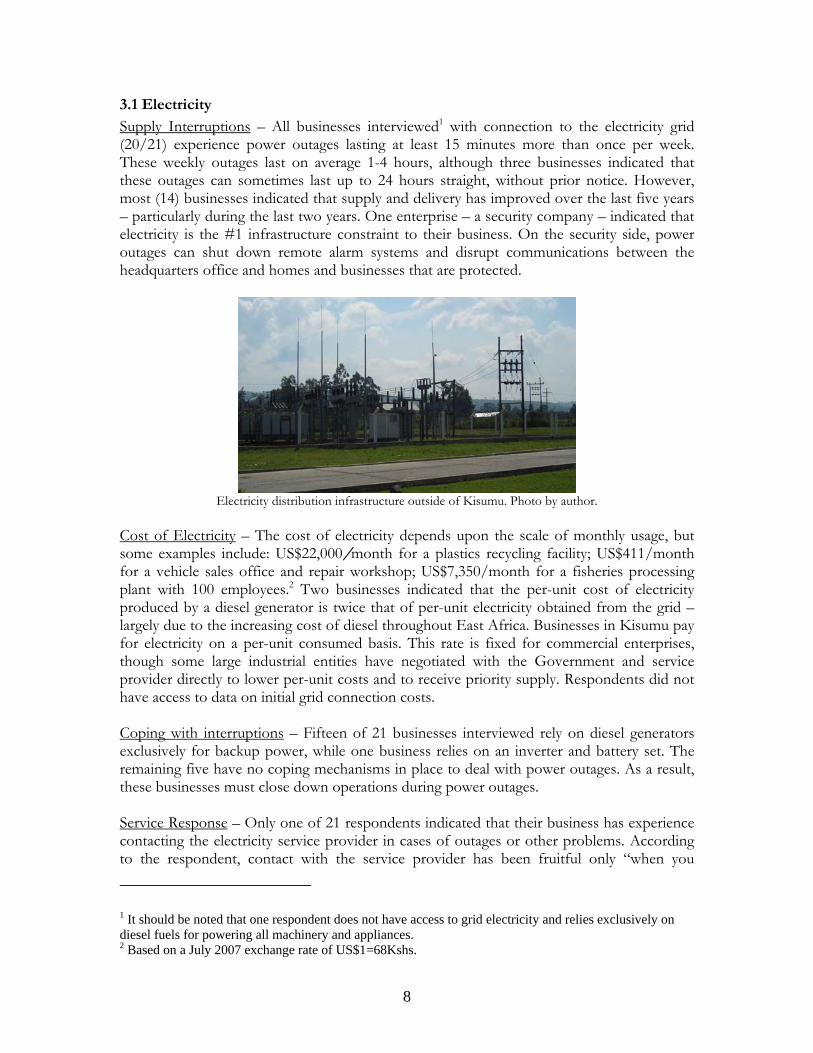
Supply Interruptions – All businesses interviewed1 with connection to the electricity grid (20/21) experience power outages lasting at least 15 minutes more than once per week. These weekly outages last on average 1-4 hours, although three businesses indicated that these outages can sometimes last up to 24 hours straight, without prior notice. However, most (14) businesses indicated that supply and delivery has improved over the last five years – particularly during the last two years. One enterprise – a security company – indicated that electricity is the #1 infrastructure constraint to their business. On the security side, power outages can shut down remote alarm systems and disrupt communications between the headquarters office and homes and businesses that are protected.
Electricity distribution infrastructure outside of Kisumu. Photo by author.
Cost of Electricity – The cost of electricity depends upon the scale of monthly usage, but some examples include: US$22,000/month for a plastics recycling facility; US$411/month for a vehicle sales office and repair workshop; US$7,350/month for a fisheries processing plant with 100 employees.2 Two businesses indicated that the per-unit cost of electricity produced by a diesel generator is twice that of per-unit electricity obtained from the grid – largely due to the increasing cost of diesel throughout East Africa. Businesses in Kisumu pay for electricity on a per-unit consumed basis. This rate is fixed for commercial enterprises, though some large industrial entities have negotiated with the Government and service provider directly to lower per-unit costs and to receive priority supply. Respondents did not have access to data on initial grid connection costs. Coping with interruptions – Fifteen of 21 businesses interviewed rely on diesel generators exclusively for backup power, while one business relies on an inverter and battery set. The remaining five have no coping mechanisms in place to deal with power outages. As a result, these businesses must close down operations during power outages. Service Response – Only one of 21 respondents indicated that their business has experience contacting the electricity service provider in cases of outages or other problems. According to the respondent, contact with the service provider has been fruitful only “when you
1 It should be noted that one respondent does not have access to grid electricity and relies exclusively on diesel fuels for powering all machinery and appliances. 2 Based on a July 2007 exchange rate of US$1=68Kshs.
9
physically visit the service provider’s offices and transport them – at your own expense – back to your facility.”
3.2 Liquid Fuels
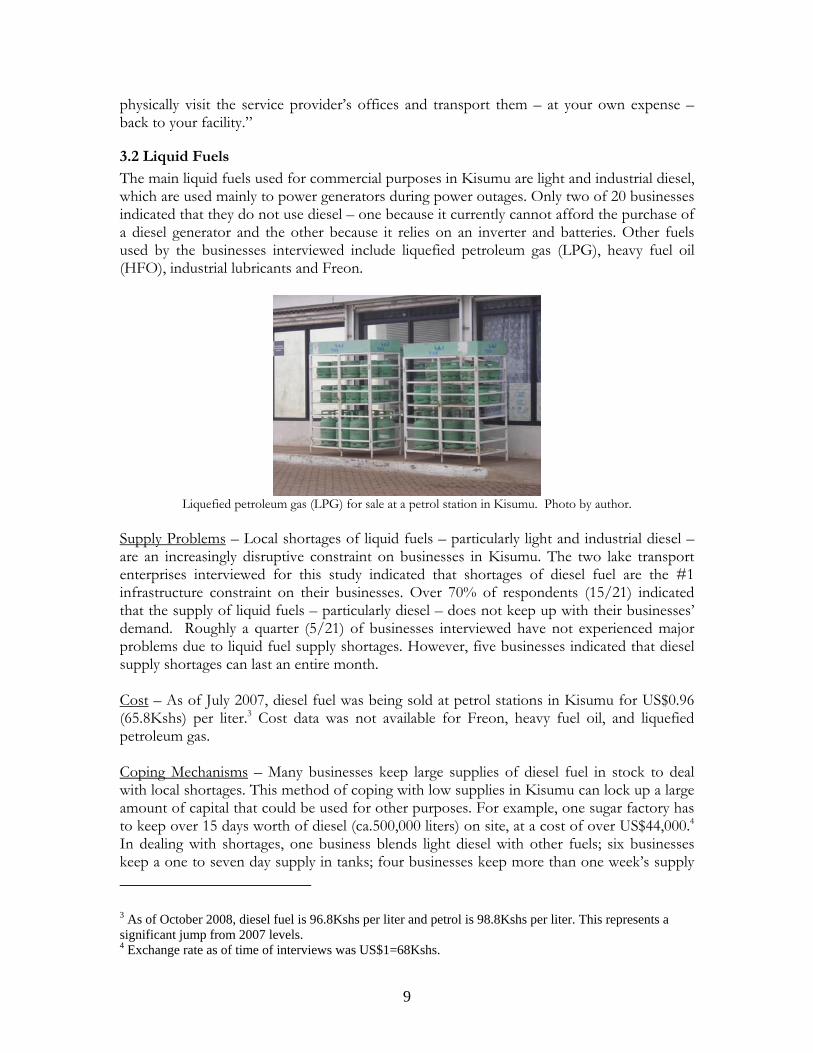
The main liquid fuels used for commercial purposes in Kisumu are light and industrial diesel, which are used mainly to power generators during power outages. Only two of 20 businesses indicated that they do not use diesel – one because it currently cannot afford the purchase of a diesel generator and the other because it relies on an inverter and batteries. Other fuels used by the businesses interviewed include liquefied petroleum gas (LPG), heavy fuel oil (HFO), industrial lubricants and Freon.
Liquefied petroleum gas (LPG) for sale at a petrol station in Kisumu. Photo by author.
Supply Problems – Local shortages of liquid fuels – particularly light and industrial diesel – are an increasingly disruptive constraint on businesses in Kisumu. The two lake transport enterprises interviewed for this study indicated that shortages of diesel fuel are the #1 infrastructure constraint on their businesses. Over 70% of respondents (15/21) indicated that the supply of liquid fuels – particularly diesel – does not keep up with their businesses’ demand. Roughly a quarter (5/21) of businesses interviewed have not experienced major problems due to liquid fuel supply shortages. However, five businesses indicated that diesel supply shortages can last an entire month. Cost – As of July 2007, diesel fuel was being sold at petrol stations in Kisumu for US$0.96 (65.8Kshs) per liter.3 Cost data was not available for Freon, heavy fuel oil, and liquefied petroleum gas. Coping Mechanisms – Many businesses keep large supplies of diesel fuel in stock to deal with local shortages. This method of coping with low supplies in Kisumu can lock up a large amount of capital that could be used for other purposes. For example, one sugar factory has to keep over 15 days worth of diesel (ca.500,000 liters) on site, at a cost of over US$44,000.4 In dealing with shortages, one business blends light diesel with other fuels; six businesses keep a one to seven day supply in tanks; four businesses keep more than one week’s supply
3 As of October 2008, diesel fuel is 96.8Kshs per liter and petrol is 98.8Kshs per liter. This represents a significant jump from 2007 levels. 4 Exchange rate as of time of interviews was US$1=68Kshs.
10
in tanks; and two businesses must close down when supplies run out. Besides keeping a large amount of diesel in stock, there are very few options for businesses that rely on the fuel for major processes because shortages usually affect the entire region and Western Kenya. Most businesses attribute such shortages to low refining capacity in Mombasa.
3.3 Water
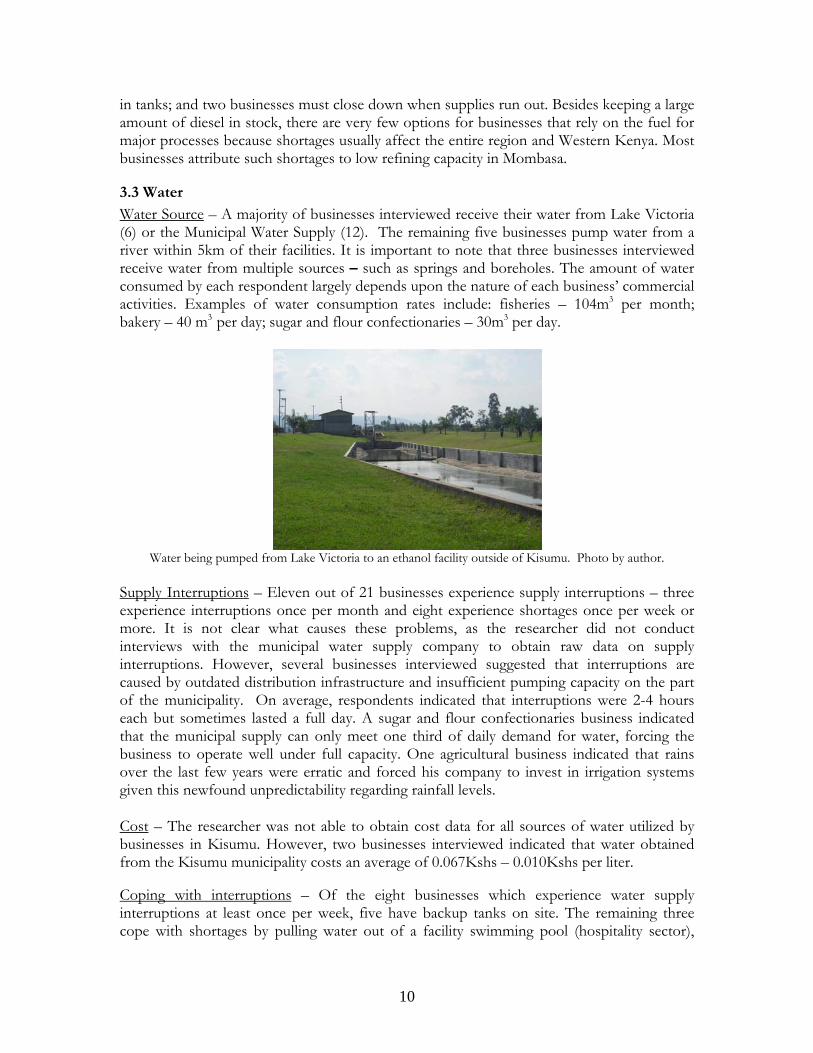
Water Source – A majority of businesses interviewed receive their water from Lake Victoria (6) or the Municipal Water Supply (12). The remaining five businesses pump water from a river within 5km of their facilities. It is important to note that three businesses interviewed receive water from multiple sources – such as springs and boreholes. The amount of water consumed by each respondent largely depends upon the nature of each business’ commercial activities. Examples of water consumption rates include: fisheries – 104m3 per month; bakery – 40 m3 per day; sugar and flour confectionaries – 30m3 per day.
Water being pumped from Lake Victoria to an ethanol facility outside of Kisumu. Photo by author.
Supply Interruptions – Eleven out of 21 businesses experience supply interruptions – three experience interruptions once per month and eight experience shortages once per week or more. It is not clear what causes these problems, as the researcher did not conduct interviews with the municipal water supply company to obtain raw data on supply interruptions. However, several businesses interviewed suggested that interruptions are caused by outdated distribution infrastructure and insufficient pumping capacity on the part of the municipality. On average, respondents indicated that interruptions were 2-4 hours each but sometimes lasted a full day. A sugar and flour confectionaries business indicated that the municipal supply can only meet one third of daily demand for water, forcing the business to operate well under full capacity. One agricultural business indicated that rains over the last few years were erratic and forced his company to invest in irrigation systems given this newfound unpredictability regarding rainfall levels. Cost – The researcher was not able to obtain cost data for all sources of water utilized by businesses in Kisumu. However, two businesses interviewed indicated that water obtained from the Kisumu municipality costs an average of 0.067Kshs – 0.010Kshs per liter. Coping with interruptions – Of the eight businesses which experience water supply interruptions at least once per week, five have backup tanks on site. The remaining three cope with shortages by pulling water out of a facility swimming pool (hospitality sector),
11
tapping into a backup borehole on site (agricultural), and obtaining water from Lake Victoria transported via jerrycans in company trucks (plastics recycling). None of the businesses interviewed initiate contact with the service provider in times of supply interruption. Water Quality – The quality of water used for business purposes in Kisumu varies depending on the source. For this study, respondents were asked to offer their own perceptions of the quality of water received. Water from Lake Victoria was characterized as “bad” by two respondents and “very bad” by four. The municipal water supply is perceived to be better, with five people indicating that the water is “average” and six indicating it was “bad” or “very bad.” Water from rivers was perceived to be “average” by two respondents and “very bad” by one. Nine out of 21 respondents (42%) indicated that their business treats water internally.
3.4 Wastewater
As compared to water supply, treatment and disposal of wastewater is a very minor issue for most businesses. Six respondents indicated that their business disposes of wastewater in septic tanks on site; 11 businesses dispose of wastewater directly into the municipal sewerage system; and three treat water internally and return it either to Lake Victoria or to their river sources. None of the businesses interviewed outsource wastewater treatment to a third party. The researcher was not able to obtain cost data on wastewater disposal.
3.5 Solid Waste
Five out of 21 respondents indicated their businesses do not produce measurable solid waste products. Of the remaining 16 respondents, methods of waste disposal include incineration (six responses), recycling or selling waste products to other vendors (three responses), informal private collection (two responses), or transport to the municipal waste site by the businesses themselves (five responses). Cost – Respondents indicated that the municipal waste site charges 700-2,000Kshs (US$10.75-$30.76) per visit regardless of the weight of the waste being disposed of. Therefore many businesses are forced to hold onto waste until there is sufficient accumulation to fill an entire truckload. One restaurant business interviewed pays roughly 30,000Kshs (US$460) per month to an informal enterprise to collect and dispose of the enterprise’s waste on a weekly basis.
3.6 Telecommunications
At present, the state of telecommunications infrastructure does not seem to pose a real constraint on business activity in Kisumu. Telephone – Of the 21 businesses interviewed, 16 rely on landline telephones as their primary source of communication; the remaining five rely primarily on mobile phones. None of the 21 businesses interviewed experience major interruptions in landline or mobile phone services. Internet – Nineteen of 21 businesses have internal access to the Internet. Of these businesses, 10 have basic dial-up connections and five use General Packet Radio Service (GPRS). GPRS is a mobile data service that enables users to transfer data via the cellular
12
network, usually using a Universal Serial Bus (USB) card. Three businesses interviewed have broadband connections and one connects via satellite due to its remote location. Connection speeds for each source were below 32kbs for dial-up, 64kbs for satellite and 32-116kbs for broadband and GPRS. Only three respondents indicated service interruptions of more than 15 minutes more than twice per week. Cost – The cost of landline telephone usage largely depends upon service provider, but falls within the range of 6,000-12,000Kshs (US$92-$184) per line each month. Internet service fees vary depending upon type and speed of connection, service provider, and form of billing – unlimited data transfer vs. pay per unit of data transferred. A rice farming business paid 30,000Kshs (US$460) for installation of dial-up internet connection. This same business pays roughly 23Kshs (US$0.35) per minute of usage. A broadband line with unlimited access costs about US$100-$200 per month for enterprises located in the central business district. Internet access via GPRS USB cards is billed per unit of connection time or per megabyte of data downloaded, depending upon service provider. Respondents using GPRS USB cards indicated average monthly expenditure per card is 4,000-6,500Kshs (US$60-$100).
3.7 Ground Transport
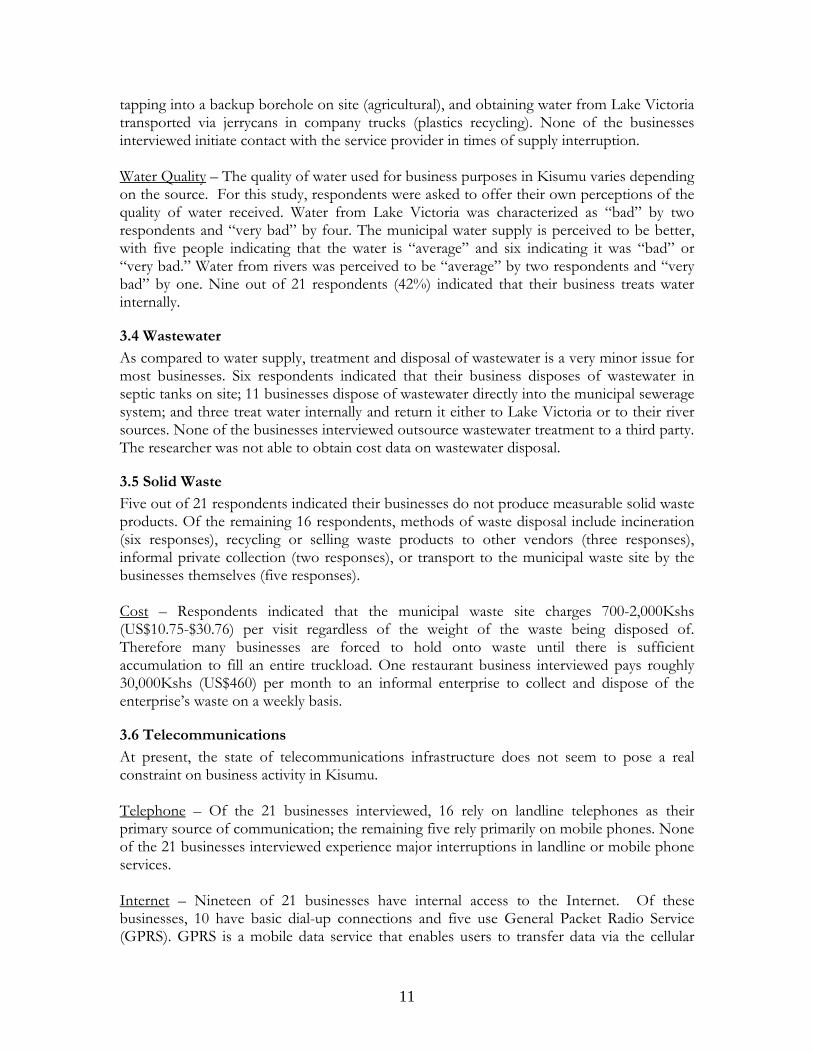
The current state of ground transportation infrastructure – roads, rail and lake transportation – presents many challenges to businesses operating in Kisumu. In particular, low usage of rail and lake transport adds to already stressed road conditions across western Kenya. Roads The current state of roads outside of Kisumu – particularly the main artery connecting the city with Nairobi and Mombasa – is the biggest infrastructure constraint to business activity in Kisumu. Two thirds of respondents (14/ 21) recognized poor quality roads as the most detrimental infrastructure limitation preventing their businesses from reaching full potential. The poor state of major roads in Kenya is a result of many factors, including: low levels of government investment in road construction and, more importantly, road maintenance; high levels of heavy-truck traffic on the Mombasa-Nairobi-Kisumu route carrying goods that could otherwise reach destinations in Western Kenya and other East African countries via rail and lake transport, if appropriate investments were to be made; and politically motivated spending of scarce transportation resources in central Kenya.
Main artery road connecting Kisumu with Nairobi. Photo by author.
13
Raw Materials and International Freight (Import) – Most businesses interviewed obtain raw materials from outside their main facilities, requiring significant expenditures on ground transportation. 17/19 businesses interviewed that require raw materials receive them via truck and/or tractor. Four businesses that import raw materials and/or supplies indicated that it takes 2-4 days for a single truck to reach Kisumu from Mombasa. A shipbuilding company indicated that it takes 7-10 days for a truck full of parts to reach Kisumu after clearing customs at Mombasa. International Freight (Export) – Of the 10 businesses interviewed that serve markets outside of Kenya, the main method of transportation used is ship (3), truck (7) and air (1). One company utilizes both air and ground (truck). For a fishing company, it typically takes about 10 hours for a truck to reach Nairobi for export via air. Cost of International Freight (Export) – For a typical company, local transport (via truck from Kisumu to Mombasa) and clearing of one 20-foot container costs 35,580 Kshs (US$523). Costs associated with transporting the same container via ship as of July 2007 from Mombasa to Dubai and Japan are US$2,200 and US$3,220, respectively. Cost of Road Transportation – The poor quality of roads connecting Kisumu to other major urban centers impacts the price of doing business and, ultimately, the price of goods and services in the city. Poor roads reduce equipment life, increase costs for vehicle repair and maintenance, and increase the time taken to transport goods. One farming business estimates that its vehicle fleet is not operating at full potential, at significant cost to the business. Due to poor roads, each truck can make two rather than three trips per week. With a total of 30 trucks earning about 200,000Kshs (US$3,075) per trip, this business estimates its losses at over 24,000,000Kshs (US$369,000) per month, due to bad roads. Several businesses interviewed indicated that they have to overload trucks illegally just to break even when transporting long distances from Kisumu. This research indicates that the already high costs of road transportation have increased over the last few years and continue to go up as roads deteriorate and fuel prices soar. One business dependent on heavy transport indicated that its transport costs have gone up 25% in the last two years alone because of poor road conditions. A food-processing business interviewed has seen its transportation costs within Kenya rise even further. Two years ago, this business could transport a 20ft container by ship from Durban, South Africa, to Mombasa for US$700, and then pay US$1,200 to transport that same container from Mombasa to Kisumu via truck; today, that same container costs over $2,000 to transport just from Mombasa to Kisumu – almost triple what it costs to transport a container from South Africa to the Mombasa port.
14
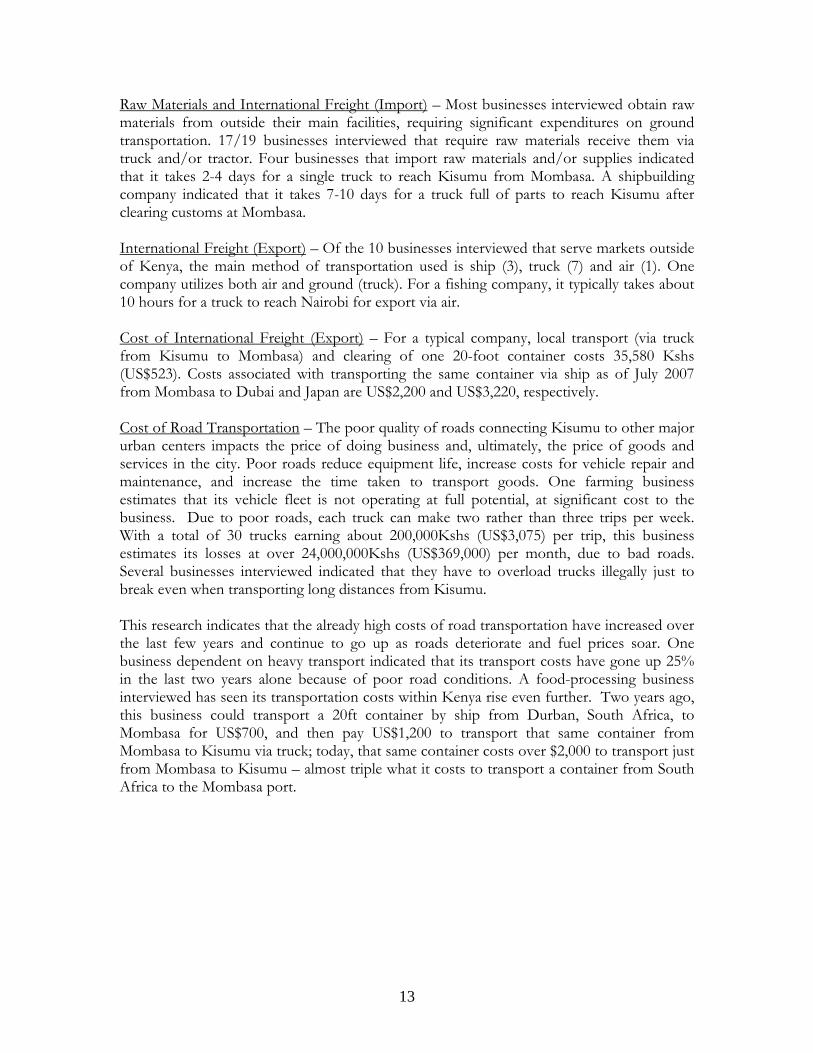
Transporting sugarcane to sugar processing facility outside of Kisumu. Photo by author.
Constrained Markets – Central Kenya is now a large market that businesses in Kisumu simply cannot serve, solely on account of poor road infrastructure. First, people do not want to make the trip by motor vehicle due to poor state of the roads and associated safety and comfort issues – impacting the tourism and service businesses that depend on visitors. For example, bakeries in Kisumu can hardly scratch the surface of the huge Central Kenya market, because finished loafs of bread are time-sensitive and are “days older than other bread”5 by the time they reach Nairobi.6 Rail The poor quality of rail service connecting Kisumu with other metropolitan areas is responsible in part for the overuse of roads connecting the city with Nairobi and Uganda. Of the 21 businesses interviewed, only two (both directly related to rail and cargo services), utilized rail for transporting goods or people. One respondent indicated that the poor state of rail infrastructure was the number one constraint to his clearing and forwarding business, because it limits the number of containers transiting through the Kisumu Inland Container Depot (ICD) on a weekly basis. Rail delays also force this business to rely on trucks to transport time-sensitive cargo from Mombasa to Uganda and Tanzania, rather than alternate rail-water options.7 To be financially sustainable, this firm needs to serve two full trains per day, rather than the current 3-4 trains per week. At present, the Kisumu ICD is operating well below its full potential – possibly 1/6 to 1/8 of full capacity – due to poor rail service. The current state of rail service is largely a result of poor infrastructure maintenance since the break-up of the East African Community (EAC) in the late 1970’s. Lake Transport Kisumu was once the shipbuilding and lake transportation hub for all of East Africa. For various reasons, lake transport infrastructure has degraded to the point where it is hardly utilized for moving people and goods any more. This degradation of rail and lake infrastructure has a negative multiplier effect on roads. At present, almost all people and cargo destined for Uganda, Tanzania, Rwanda, Burundi and Congo must be transported via
5 Quote provided by speaker that wishes to remain anonymous. 6 In fact, one bakery indicated that even an hour’s delay can impact the freshness of his bread, ruling out the possibility of serving markets beyond Nakuru. 7 For example, this business indicated that it takes two days to transport a single container from Mombasa to Kisumu via truck, as compared to the 5-14 days it now takes to transport the same container by rail.
15
the same one or two Kenyan roads, adding more pressure to already poor road infrastructure. There are a few commercial enterprises taking advantage of lake transport from the Kisumu port. At present, there are 3-4 privately owned and operated ships transporting mostly diesel oil for cars and finished plastic goods to Mwanza, Tanzania. The ships generally return empty but occasionally bring cotton seed cake and cement. There are also four government-owned ships held over from the original East African Community days – two in Uganda, one in Kenya and one in Tanzanian waters.8 None of the businesses interviewed are currently transporting people or goods to Uganda via Lake Victoria. Cost – Data on per unit cost of transporting people and goods via lake was not available at the time of this study. One lake transport company mentioned that the business has to pay a $100 per month fee for the ability to dock in Kisumu.
3.8 Air Transport
Most businesses interviewed do not take advantage of air for transporting people and goods, mainly due to the high cost of flights and insufficient capacity to handle time-sensitive cargo at the Kisumu airport. At present, the Kisumu airport only handles flights to and from the Nairobi airport. There are no passenger or cargo flights from the Kisumu airport to other regional or international destinations. For the three businesses that do use air transport, it is used mainly to transport new personnel to Kisumu from abroad or to bring spare parts in emergency situations. Only one business regularly uses air transport, though not through the Kisumu airport. This fisheries business trucks refrigerated fish to the Nairobi airport two to three times per week for flights to Europe and the United States. Cost – For a typical company, local transport (via truck from Kisumu to Nairobi airport) and clearing of one 20-foot container costs 15,000Kshs (US$230). Costs associated with transporting the same container via air to international destinations include: Dubai – one container (minimum of 1,380kg) costs roughly US$1,500. Miami – one container (minimum of 1,380kg) costs US$3,900.
3.9 Land
Difficulties obtaining land for industrial, agricultural and office purposes can be a major constraint to existing businesses and can limit potential investment in Kisumu. Most businesses interviewed (11/21) indicated that they own the land on which the business operates. The remaining ten businesses lease land directly from the owners. Land Availability - Twelve respondents out of 19 indicated that there is sufficient amount of land available for industrial purposes, although three indicated that there is not enough available in Kisumu’s more favorable locations. Seven businesses out of 19 respondents indicated that there is not enough land available for expansion – particularly land suitable for industrial purposes, with ample water and electricity services. Four businesses found it very
8 However, three out of the four state-owned ships are currently grounded, largely due to the high costs of insurance.
16
hard to deal with the long and arduous bureaucratic processes involved with locating land, finding the appropriate owner and registering the land with the municipality. Finally, eight businesses interviewed indicated that even the so-called “available” land has been allocated politically. Therefore, interested businesses may have to pay above-market prices to get the land out of the hands of politically favored owners who tend to retain their land tenure as a sign of their influence.
3.10 Security
As in most urban areas in East Africa, one cannot do business in Kisumu without a basic alarm system and fencing around facilities, as well as guard services during night hours (at minimum). Twelve out of 21 respondents indicated that their businesses are affected by security considerations, though all indicated that these were in every case a result of petty theft from individuals inside the company. The average cost of one security guard per month (12 hours per day) is 14,300Kshs, or US$220. One security guard per month at 24 hours per day costs 28,600Kshs, or US$440. Only three of the businesses interviewed experienced significant losses due to security issues, largely due to hijackings of trucks transporting people or goods from Kisumu to other urban areas. These businesses indicated that these losses were mainly due to the poor road infrastructure, as thieves are attracted to trucks forced to move very slowly because of potholes. Two businesses interviewed have experienced losses due to theft while working in the port of Mombasa. As a response to these transportation security concerns, some businesses have hired security companies to accompany their cargo while in transit. Typical cost for cargo in transit security is 65,000Kshs (US$1,000) per trip, which includes two vehicles, four armed guards, and two crewmembers.
3.11 Other Considerations
There are several other infrastructure constraints not captured in the original survey that came out of interviews with businesses in Kisumu. These include: Customs: For one agriculture-focused business, clearing cargo out of Mombasa port is the
company’s biggest infrastructure constraint. This business indicated that it takes an average of four weeks to clear a single container through the port of Mombasa. In response, this business is purchasing its own bonded warehouse at the Kisumu ICD, to begin clearing locally. An agro-processing business and an imported commodities sales firm also indicated a month’s delay in clearing cargo at the Mombasa port.
Buildings: Four businesses interviewed recognized that a lack of building infrastructure negatively impacts their commercial activities. In particular, there is a lack of housing for all income levels, as well as a shortage of office and retail space in the central business district.
4. Sectoral Comparison A comparison of infrastructure issues within and across sectors reveals several important insights. For the purposes of this analysis, the researcher compared three broad sectoral categories with more than three businesses each: agriculture (6); food production (3); and transportation (5).
17
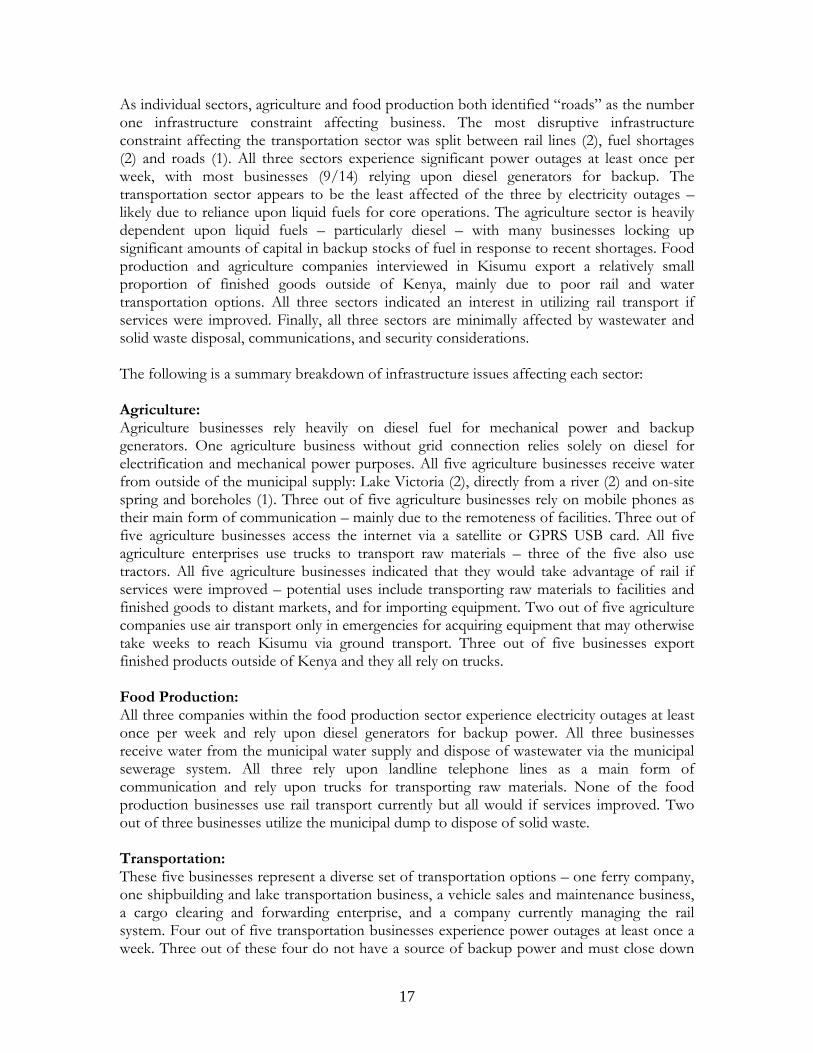
As individual sectors, agriculture and food production both identified “roads” as the number one infrastructure constraint affecting business. The most disruptive infrastructure constraint affecting the transportation sector was split between rail lines (2), fuel shortages (2) and roads (1). All three sectors experience significant power outages at least once per week, with most businesses (9/14) relying upon diesel generators for backup. The transportation sector appears to be the least affected of the three by electricity outages – likely due to reliance upon liquid fuels for core operations. The agriculture sector is heavily dependent upon liquid fuels – particularly diesel – with many businesses locking up significant amounts of capital in backup stocks of fuel in response to recent shortages. Food production and agriculture companies interviewed in Kisumu export a relatively small proportion of finished goods outside of Kenya, mainly due to poor rail and water transportation options. All three sectors indicated an interest in utilizing rail transport if services were improved. Finally, all three sectors are minimally affected by wastewater and solid waste disposal, communications, and security considerations. The following is a summary breakdown of infrastructure issues affecting each sector: Agriculture: Agriculture businesses rely heavily on diesel fuel for mechanical power and backup generators. One agriculture business without grid connection relies solely on diesel for electrification and mechanical power purposes. All five agriculture businesses receive water from outside of the municipal supply: Lake Victoria (2), directly from a river (2) and on-site spring and boreholes (1). Three out of five agriculture businesses rely on mobile phones as their main form of communication – mainly due to the remoteness of facilities. Three out of five agriculture businesses access the internet via a satellite or GPRS USB card. All five agriculture enterprises use trucks to transport raw materials – three of the five also use tractors. All five agriculture businesses indicated that they would take advantage of rail if services were improved – potential uses include transporting raw materials to facilities and finished goods to distant markets, and for importing equipment. Two out of five agriculture companies use air transport only in emergencies for acquiring equipment that may otherwise take weeks to reach Kisumu via ground transport. Three out of five businesses export finished products outside of Kenya and they all rely on trucks. Food Production: All three companies within the food production sector experience electricity outages at least once per week and rely upon diesel generators for backup power. All three businesses receive water from the municipal water supply and dispose of wastewater via the municipal sewerage system. All three rely upon landline telephone lines as a main form of communication and rely upon trucks for transporting raw materials. None of the food production businesses use rail transport currently but all would if services improved. Two out of three businesses utilize the municipal dump to dispose of solid waste. Transportation: These five businesses represent a diverse set of transportation options – one ferry company, one shipbuilding and lake transportation business, a vehicle sales and maintenance business, a cargo clearing and forwarding enterprise, and a company currently managing the rail system. Four out of five transportation businesses experience power outages at least once a week. Three out of these four do not have a source of backup power and must close down
18
office operations when outages occur. Three out of five businesses receive water from Lake Victoria while the remaining two use the municipal water supply. Two out of five do not have access to the internet. All three of the businesses with internet capabilities use dial-up connection. Two out of five businesses utilize rail to transport goods and/or people – the other three would utilize rail if services improved.
5. Opportunities for Investment in Infrastructure In addition to structured interview questions, respondents were asked to identify opportunities for investment in Kisumu’s infrastructure. The following summarizes the various opportunities identified by the business community themselves. Air Transport: Several businesses not currently utilizing air for transporting people or
goods indicated a desire to do so, if prices were more competitive and/or if the Kisumu airport was upgraded to include better cargo facilities. In particular, two businesses indicated a desire to ship fresh fish to European markets directly from Kisumu in the near future.
Lake Transport: Transport via ship on Lake Victoria is drastically underutilized at
present. Kisumu is well-positioned to lead the East Africa region in both shipbuilding and transport of goods and people from what was once the region’s best dry dock. All businesses interviewed for this study with export activities to Uganda indicated that they would take advantage of lake transport if it were an option. Kisumu already has a full shipbuilding workshop under the management of Rift Valley Railways, with grid connection and unused equipment. There are a few small-scale shipbuilding operations in Kisumu and Mwanza, mostly rehabilitating boats that are, in most cases, decades old and have been lying on the bottom of Lake Victoria. Improving conditions for lake transport will also require investment in upgrading the lake’s port facilities, including the construction and management of warehouses and new docks.
Railway Transport: As mentioned in section 3.7, only 2/21 businesses interviewed for
this study use the rail system for transporting people or goods. However, all 19 of the respondents not currently using the service indicated that their businesses would use the rail if services improved. In particular, businesses would like to see increased traffic of trains into and out of Kisumu; reduced trip times; demonstrated improvements in safety, and investments in the rail line infrastructure. Improvements in rail service would likely involve large investments in rail line infrastructure that may be beyond the mandate of the organization managing rail operations. Business heads suggested that the KPA open up concessionary rates at the Kisumu ICD.9
Privately managed roads: Although politically difficult, there is an opportunity to
transfer construction and management of roads to the private sector in western Kenya.
9 At present, the cost is the same to clear in Mombasa and Kisumu; one idea would be to offer half-rate in Kisumu and full rates in Mombasa.
19
Additionally, there is a possibility to make the main artery between Nairobi and Kisumu a privately operated toll road that would charge a small user fee. Six out of 21 businesses interviewed indicated a willingness to pay up to 5,000Kshs (US$75) to use a paved and well-maintained road. There are several construction firms in Kisumu with extensive experience building and repairing tarmac roads which could undertake this work.
Public Transportation: Three businesses recognized a need to develop a comprehensive
public transportation system connecting the central business district with residential neighborhoods and the airport. In the near term, this could take the form of organized bus routes similar to those in Nairobi and could mature into a light-rail system.
Solid Waste and Recycling: At present, the Kisumu municipality has low capacity to
serve the garbage collection and disposal needs of both the business and residential communities. Several businesses interviewed outsource the solid waste collection and transport to largely unorganized and informal companies run by private individuals. However, many businesses still rely on internal resources for the transport and disposal of solid waste, demonstrating a largely unmet demand for private garbage collection. Additionally, the municipality does not have the resources to separate recyclable materials from perishable goods. One recycling company interviewed for this study indicated that the business is operating at only half-capacity due to low supply of pre-sorted waste. There is a clear opportunity to develop a profitable, privately managed garbage and recycling collection business to fill these gaps.
Building Infrastructure: As reported above, a number of businesses alluded to the
tremendous shortage of building infrastructure in Kisumu, creating significant investment opportunities, particularly in the construction of low- and middle-income housing, medium-priced and upscale hotels, office and retail space and secure warehousing at the internal container depot and port.
20
6. Conclusion Given the range of infrastructure obstacles presented in this paper, it is encouraging to note that most of the businesses interviewed are operating profitably in the face of such tremendous challenges. As recognized by respondents, Kisumu offers many benefits to potential investors, including: a large labor force, secure and reliable telecommunications services and a wide range of commercially viable opportunities. Additionally, several of the infrastructure constraints presented in this study can be thought of as opportunities. For example, a lack of organized solid waste collection disposal points to an opportunity to operate a formal waste disposal business with a largely untapped residential market. A local shortage of office, retail, and residential buildings is an opportunity to invest in a largely unmet demand for building infrastructure. This research also indicates that there is sufficient demand for lake and rail transport which could be both profitable to a commercial enterprise and reduce pressure on already constrained road infrastructure.
21
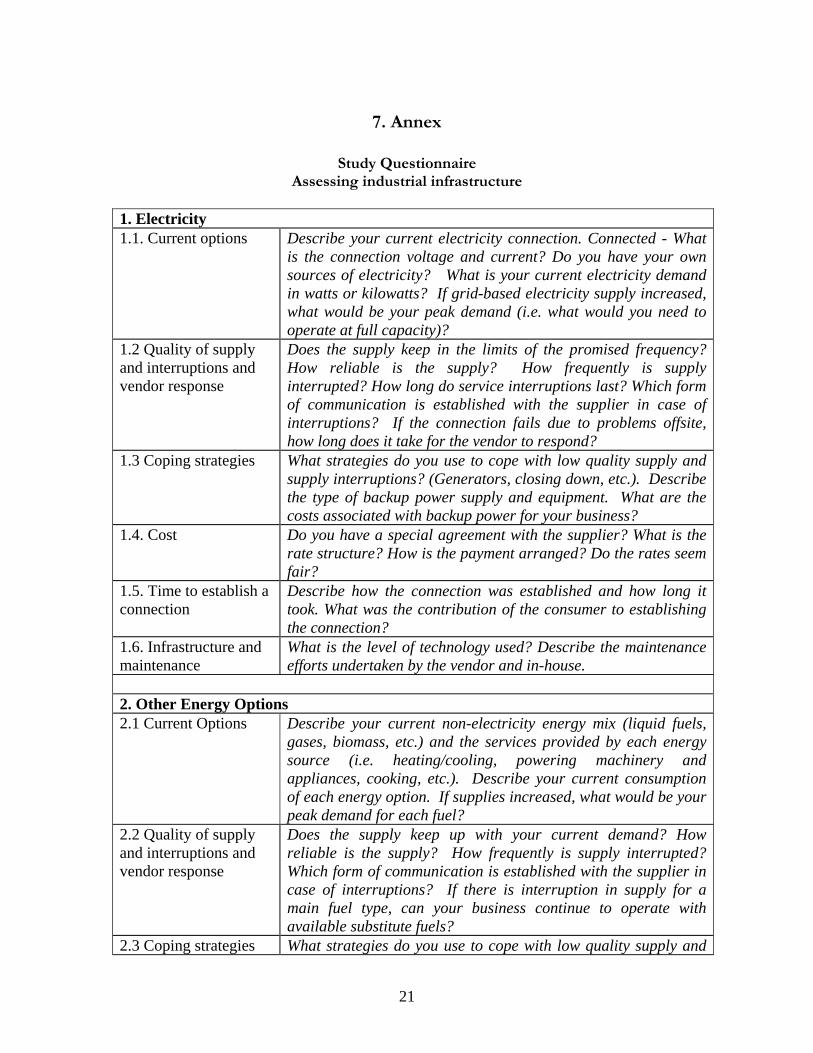
7. Annex
Study Questionnaire Assessing industrial infrastructure
1. Electricity 1.1. Current options Describe your current electricity connection. Connected - What
is the connection voltage and current? Do you have your own sources of electricity? What is your current electricity demand in watts or kilowatts? If grid-based electricity supply increased, what would be your peak demand (i.e. what would you need to operate at full capacity)?
1.2 Quality of supply and interruptions and vendor response
Does the supply keep in the limits of the promised frequency? How reliable is the supply? How frequently is supply interrupted? How long do service interruptions last? Which form of communication is established with the supplier in case of interruptions? If the connection fails due to problems offsite, how long does it take for the vendor to respond?
1.3 Coping strategies What strategies do you use to cope with low quality supply and supply interruptions? (Generators, closing down, etc.). Describe the type of backup power supply and equipment. What are the costs associated with backup power for your business?
1.4. Cost Do you have a special agreement with the supplier? What is the rate structure? How is the payment arranged? Do the rates seem fair?
1.5. Time to establish a connection
Describe how the connection was established and how long it took. What was the contribution of the consumer to establishing the connection?
1.6. Infrastructure and maintenance
What is the level of technology used? Describe the maintenance efforts undertaken by the vendor and in-house.
2. Other Energy Options 2.1 Current Options Describe your current non-electricity energy mix (liquid fuels,
gases, biomass, etc.) and the services provided by each energy source (i.e. heating/cooling, powering machinery and appliances, cooking, etc.). Describe your current consumption of each energy option. If supplies increased, what would be your peak demand for each fuel?
2.2 Quality of supply and interruptions and vendor response
Does the supply keep up with your current demand? How reliable is the supply? How frequently is supply interrupted? Which form of communication is established with the supplier in case of interruptions? If there is interruption in supply for a main fuel type, can your business continue to operate with available substitute fuels?
2.3 Coping strategies What strategies do you use to cope with low quality supply and
22
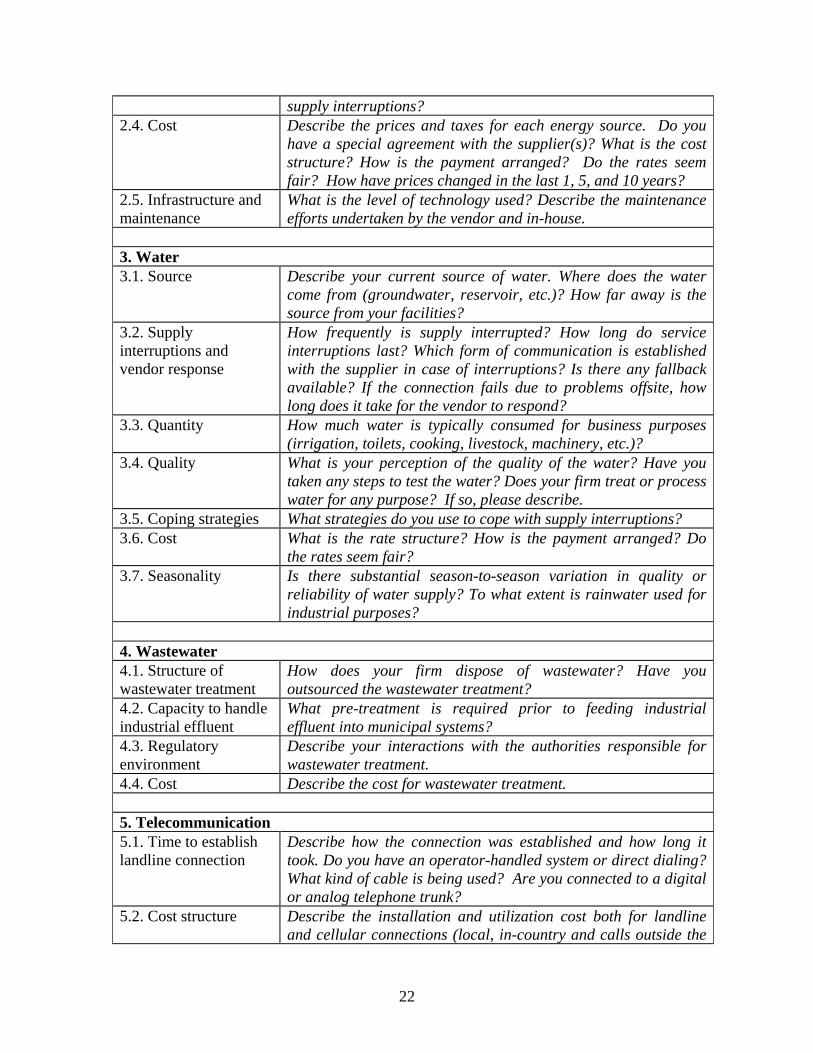
supply interruptions? 2.4. Cost Describe the prices and taxes for each energy source. Do you
have a special agreement with the supplier(s)? What is the cost structure? How is the payment arranged? Do the rates seem fair? How have prices changed in the last 1, 5, and 10 years?
2.5. Infrastructure and maintenance
What is the level of technology used? Describe the maintenance efforts undertaken by the vendor and in-house.
3. Water 3.1. Source Describe your current source of water. Where does the water
come from (groundwater, reservoir, etc.)? How far away is the source from your facilities?
3.2. Supply interruptions and vendor response
How frequently is supply interrupted? How long do service interruptions last? Which form of communication is established with the supplier in case of interruptions? Is there any fallback available? If the connection fails due to problems offsite, how long does it take for the vendor to respond?
3.3. Quantity How much water is typically consumed for business purposes (irrigation, toilets, cooking, livestock, machinery, etc.)?
3.4. Quality What is your perception of the quality of the water? Have you taken any steps to test the water? Does your firm treat or process water for any purpose? If so, please describe.
3.5. Coping strategies What strategies do you use to cope with supply interruptions? 3.6. Cost What is the rate structure? How is the payment arranged? Do
the rates seem fair? 3.7. Seasonality Is there substantial season-to-season variation in quality or
reliability of water supply? To what extent is rainwater used for industrial purposes?
4. Wastewater 4.1. Structure of wastewater treatment
How does your firm dispose of wastewater? Have you outsourced the wastewater treatment?
4.2. Capacity to handle industrial effluent
What pre-treatment is required prior to feeding industrial effluent into municipal systems?
4.3. Regulatory environment
Describe your interactions with the authorities responsible for wastewater treatment.
4.4. Cost Describe the cost for wastewater treatment. 5. Telecommunication 5.1. Time to establish landline connection
Describe how the connection was established and how long it took. Do you have an operator-handled system or direct dialing? What kind of cable is being used? Are you connected to a digital or analog telephone trunk?
5.2. Cost structure Describe the installation and utilization cost both for landline and cellular connections (local, in-country and calls outside the
23
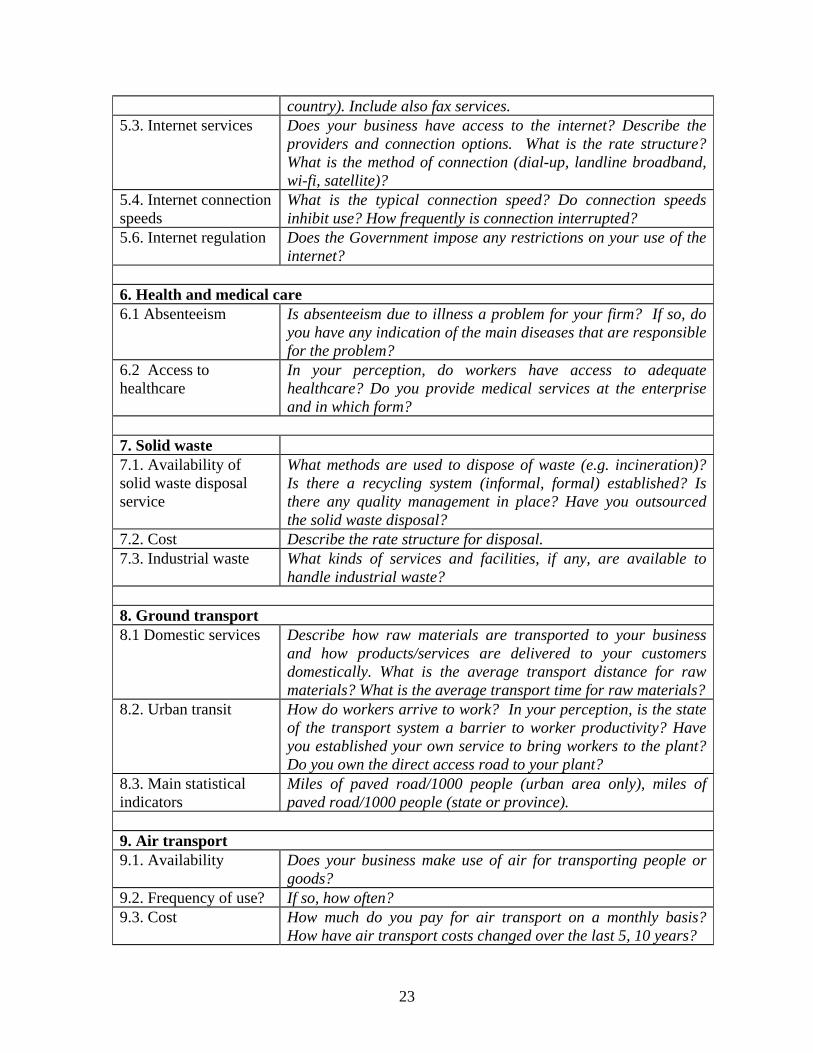
country). Include also fax services. 5.3. Internet services Does your business have access to the internet? Describe the
providers and connection options. What is the rate structure? What is the method of connection (dial-up, landline broadband, wi-fi, satellite)?
5.4. Internet connection speeds
What is the typical connection speed? Do connection speeds inhibit use? How frequently is connection interrupted?
5.6. Internet regulation Does the Government impose any restrictions on your use of the internet?
6. Health and medical care 6.1 Absenteeism Is absenteeism due to illness a problem for your firm? If so, do
you have any indication of the main diseases that are responsible for the problem?
6.2 Access to healthcare
In your perception, do workers have access to adequate healthcare? Do you provide medical services at the enterprise and in which form?
7. Solid waste 7.1. Availability of solid waste disposal service
What methods are used to dispose of waste (e.g. incineration)? Is there a recycling system (informal, formal) established? Is there any quality management in place? Have you outsourced the solid waste disposal?
7.2. Cost Describe the rate structure for disposal. 7.3. Industrial waste What kinds of services and facilities, if any, are available to
handle industrial waste? 8. Ground transport 8.1 Domestic services Describe how raw materials are transported to your business
and how products/services are delivered to your customers domestically. What is the average transport distance for raw materials? What is the average transport time for raw materials?
8.2. Urban transit How do workers arrive to work? In your perception, is the state of the transport system a barrier to worker productivity? Have you established your own service to bring workers to the plant? Do you own the direct access road to your plant?
8.3. Main statistical indicators
Miles of paved road/1000 people (urban area only), miles of paved road/1000 people (state or province).
9. Air transport 9.1. Availability Does your business make use of air for transporting people or
goods? 9.2. Frequency of use? If so, how often? 9.3. Cost How much do you pay for air transport on a monthly basis?
How have air transport costs changed over the last 5, 10 years?
24
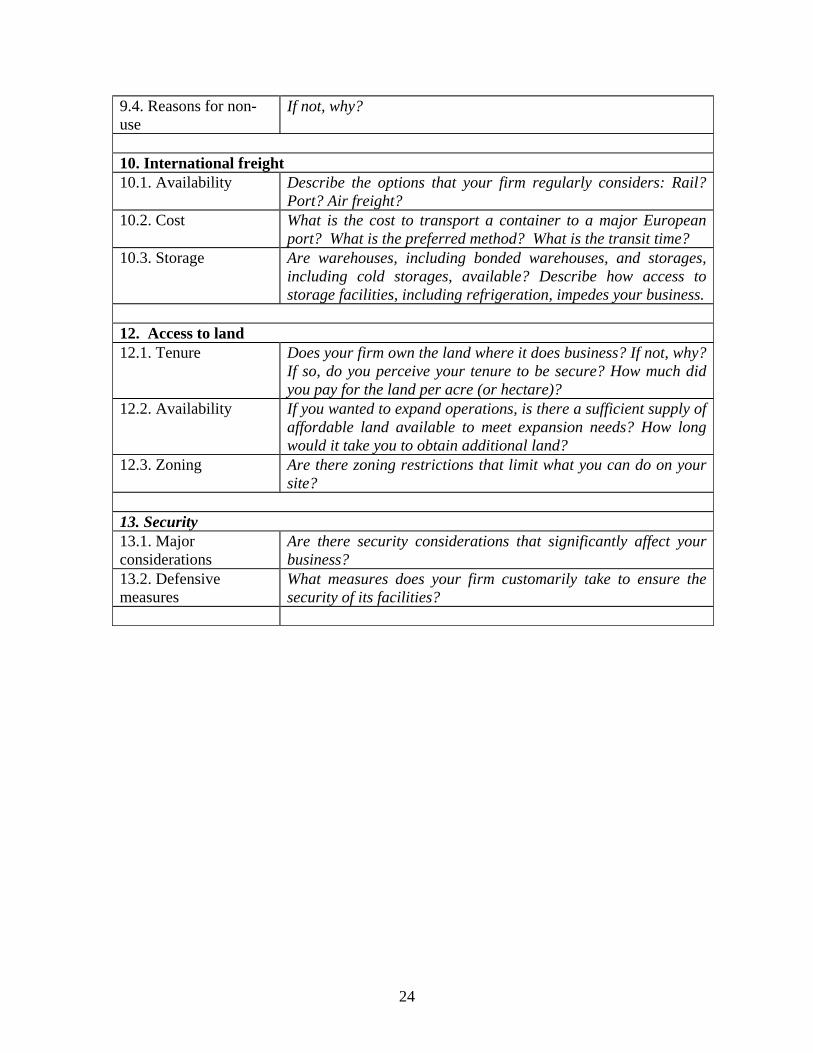
9.4. Reasons for non-use
If not, why?
10. International freight 10.1. Availability Describe the options that your firm regularly considers: Rail?
Port? Air freight? 10.2. Cost What is the cost to transport a container to a major European
port? What is the preferred method? What is the transit time? 10.3. Storage Are warehouses, including bonded warehouses, and storages,
including cold storages, available? Describe how access to storage facilities, including refrigeration, impedes your business.
12. Access to land 12.1. Tenure Does your firm own the land where it does business? If not, why?
If so, do you perceive your tenure to be secure? How much did you pay for the land per acre (or hectare)?
12.2. Availability If you wanted to expand operations, is there a sufficient supply of affordable land available to meet expansion needs? How long would it take you to obtain additional land?
12.3. Zoning Are there zoning restrictions that limit what you can do on your site?
13. Security 13.1. Major considerations
Are there security considerations that significantly affect your business?
13.2. Defensive measures
What measures does your firm customarily take to ensure the security of its facilities?
25
8. References
Aguilo et al. (2007). “Attracting Investment to Kisumu: Opportunities and Challenges.” School of International and Public Affairs, Columbia University. International Bank for Reconstruction and Development, World Bank (2005). “Doing Business in 2006: Sub Saharan Africa Regional Profile.” http://www.doingbusiness.org. Namwaya, Otsieno (2004). “Who Owns Kenya.” East African Standard. http://www.eastandard.net/archives/cl/hm_news/news.php?articleid=1916. Onyango, George (2007). “An Investment Profiling of Kisumu City.” Prepared for Millennium City Initiative, Urban Management Programme, UN-HABITAT, and Lake Victoria Region Urban Development Network for Improved Urban Environment and Poverty Reduction. Southall, Roger (2005). “The Ndugu Report: Land & Graft in Kenya.” Review of African Political Economy. Sweeney, Erin (2007). “Developing Kisumu’s Infrastructure.” John F. Kennedy School of Government, Harvard University. United Nations Human Settlements Program (2004). “Kisumu City Development Strategies: 2004-2009.” Prepared by Kisumu City Council and Centre for Development and Planning Management.