Embed Size (px)
Citation preview

Assessing Intervention Fidelity in RCTs: Models, Methods and
Modes of Analysis
David S. Cordray & Chris HullemanVanderbilt University
Presentation for the IES Research ConferenceWashington, DC
June 9, 2009

Overview
• Fidelity and Achieved Relative Strength: – Definitions, distinctions and illustrations – Conceptual foundation for assessing fidelity in RCTs– Achieved relative strength, a special case in RCTs
• Modes of analysis:– Approaches and challenges
• Chris Hulleman -- Assessing implementation fidelity and achieved relative strength indices: The single core component case
• Questions and discussion

Distinguishing Implementation Assessment from the Assessment of Implementation
Fidelity • Two ends on a continuum of intervention
implementation/fidelity:• A purely descriptive model:
– Answering the question “What transpired as the intervention was put in place (implemented).
• Based on a priori intervention model, with explicit expectations about implementation of program components:– Fidelity is the extent to which the realized intervention (tTx) is
faithful to the pre-stated intervention model (TTx )– Infidelity = TTx – tTx
• Most implementation fidelity assessments involve descriptive and model-based approaches.

Dimensions Intervention Fidelity
• Aside from agreement at the extremes, little consensus on what is meant by the term “intervention fidelity”.
• Most frequent definitions:– True Fidelity = Adherence or compliance:
• Program components are delivered/used/received, as prescribed• With a stated criteria for success or full adherence• The specification of these criteria is relatively rare
– Intervention Exposure:• Amount of program content, processes, activities delivered/received
by all participants (aka, receipt, responsiveness)• This notion is most prevalent
– Intervention Differentiation:• The unique features of the intervention are distinguishable from
other programs, including the control condition • A unique application within RCTs

Linking Intervention Fidelity Assessment to Contemporary Models of Causality
• Rubin’s Causal Model:– True causal effect of X is (Yi
Tx – YiC)
– RCT methodology is the best approximation to this true effect
– In RCTs, the difference between conditions, on average, is the causal effect
• Fidelity assessment within RCTs entails examining the difference between causal components in the intervention and control conditions.
• Differencing causal conditions can be characterized as achieved relative strength of the contrast. – Achieved Relative Strength (ARS) = tTx – tC
– ARS is a default index of fidelity

Achieved Relative Strength =.15
Infidelity
“Infidelity”
0.50d
85 700.50
30d
t c
pooled
Y Yd
sd
(85)-(70) = 15
tC
t tx
cY
tY
TTx
TC
.45
.40
.35
.30
.25
.20
.15
.10
.05
.00
Treatment Strength
with fidelity
with fidelity
90 650.83
30
T C
pooled
Y Yd
sd
d
Expected Relative Strength = (0.40-0.15) = 0.25
100
90
85
80
75
70
65
60
55
50
Outcome
TY
CY

Why is this Important?
• Statistical Conclusion validity– Unreliability of Treatment Implementation:
Variations across participants in the delivery receipt of the causal variable (e.g., treatment). Increases error and reduces the size of the effect; decreases chances of detecting covariation.
• Resulting in a reduction in statistical power or the need for a larger study….

The Effects Structural Infidelity on Power
.60 .80 1.0Fidelity
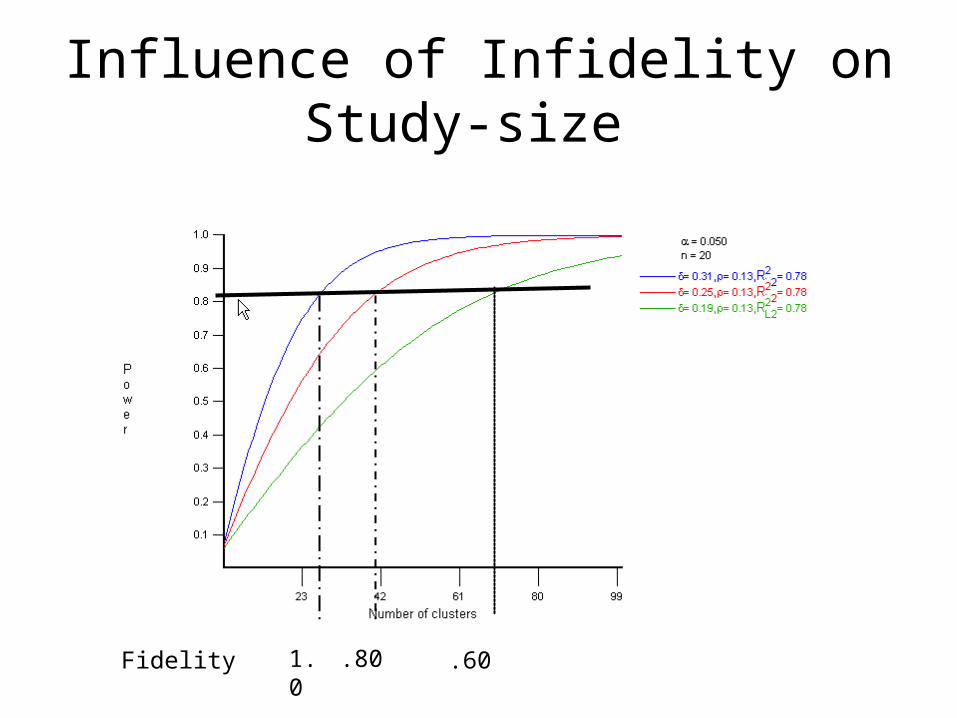
Influence of Infidelity on Study-size
1.0 .80 .60Fidelity
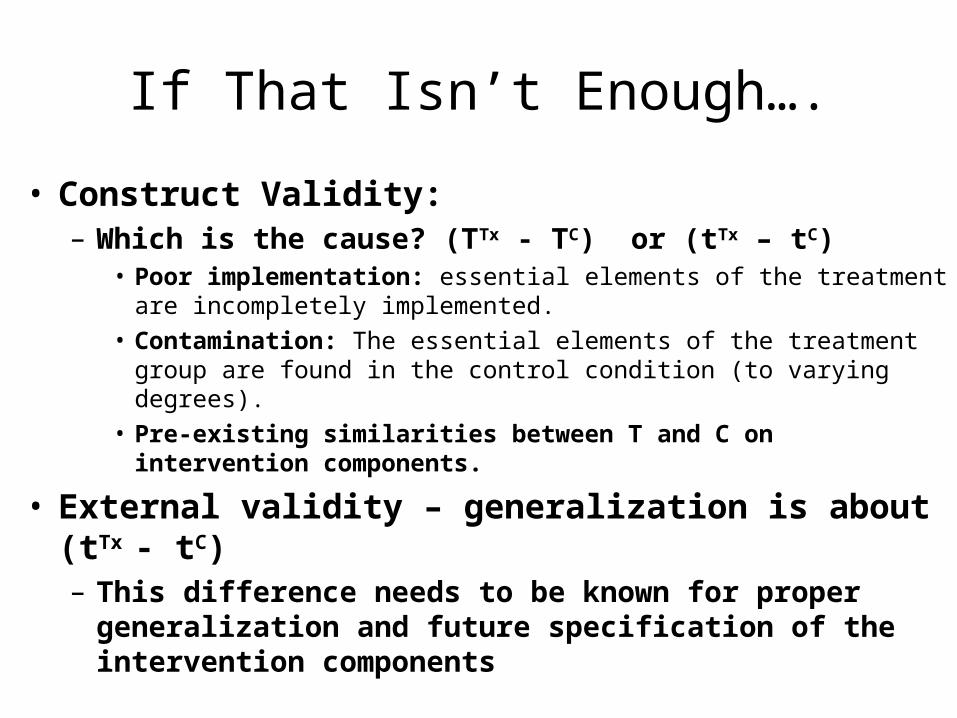
If That Isn’t Enough….
• Construct Validity: – Which is the cause? (TTx - TC) or (tTx – tC)
• Poor implementation: essential elements of the treatment are incompletely implemented.
• Contamination: The essential elements of the treatment group are found in the control condition (to varying degrees).
• Pre-existing similarities between T and C on intervention components.
• External validity – generalization is about (tTx - tC)– This difference needs to be known for proper
generalization and future specification of the intervention components

So what is the cause? …The achieved relative difference in conditions across
components
0123456789
10
PD DifInst
Dif in Theory
Dif as Obs
0123456789
10
PD Asmt Dif Inst
C Planned
C Observ
Augmentation of Control
0123456789
10
PD Asmt Dif Inst
T Planned
T Obser
Infidelity
PD= Professional Development
Asmt=Formative Assessment
Diff Inst= Differentiated Instruction

Achieved Relative Strength =.15
Infidelity
“Infidelity” tC
t tx
cY
tY
TTX’ TTx
TC
.45
.40
.35
.30
.25
.20
.15
.10
.05
.00
Treatment Strength
100
90
85
80
75
70
65
60
55
50
Outcome
TY
CY
Intervention Exposure
True Fidelity
Tx ContaminationAugmentation of C
Intervention Exposure
Positive Infidelity
'TY
Intervention Differentiation
Review: Concepts and Definitions
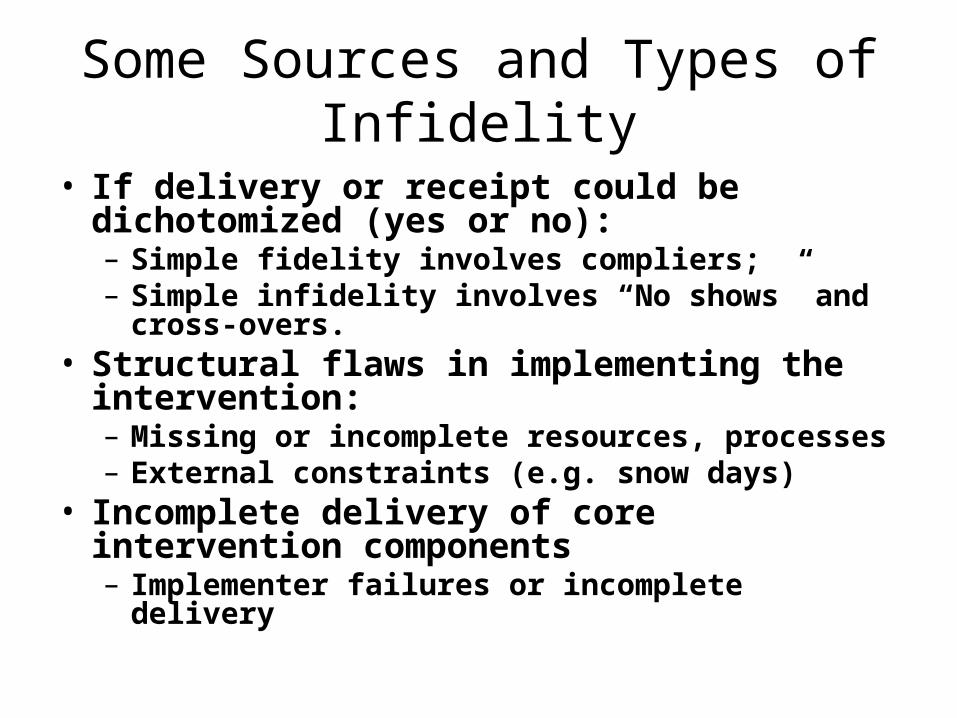
Some Sources and Types of Infidelity
• If delivery or receipt could be dichotomized (yes or no):– Simple fidelity involves compliers;– Simple infidelity involves “No shows” and cross-
overs.• Structural flaws in implementing the
intervention:– Missing or incomplete resources, processes– External constraints (e.g. snow days)
• Incomplete delivery of core intervention components– Implementer failures or incomplete delivery

A Tutoring Program: Variation in Exposure
4-5 tutoring sessions per week, 25 minutes each, 11weeks
Expectations: 44-55 sessions
Cycle 1
47.7
16-56
Cycle 2
33.1
12-42
Cycle 3
31.6
16-44
Average Sessions Delivered
Range
Random Assignment of Students
Time

Variation in Exposure: Tutor Effects
05
101520253035404550
1 3 5 7 9 11 13 15 17
Individual Tutors
Average Number of Tutoring Sessions per Tutor
The other fidelity question: How faithful to the tutoring model is each tutor?

In Practice….• Identify core components in the intervention
group– e.g., via a Model of Change
• Establish bench marks (if possible) for TTX and TC
• Measure core components to derive tTx and tC
– e.g., via a “Logic model” based on Model of Change
• Measurement (deriving indicators)• Converted to Achieved Relative Strength and
implementation fidelity scales• Incorporated into the analysis of effects

What do we measure?
What are the options?(1) Essential or core components (activities, processes);(2) Necessary, but not unique, activities, processes and structures (supporting the essential components of T); and(3) Ordinary features of the setting (shared with the control group)
• Focus on 1 and 2.

Fidelity Assessment Starts With a Model or Framework for the Intervention
From: Gamse et al. 2008
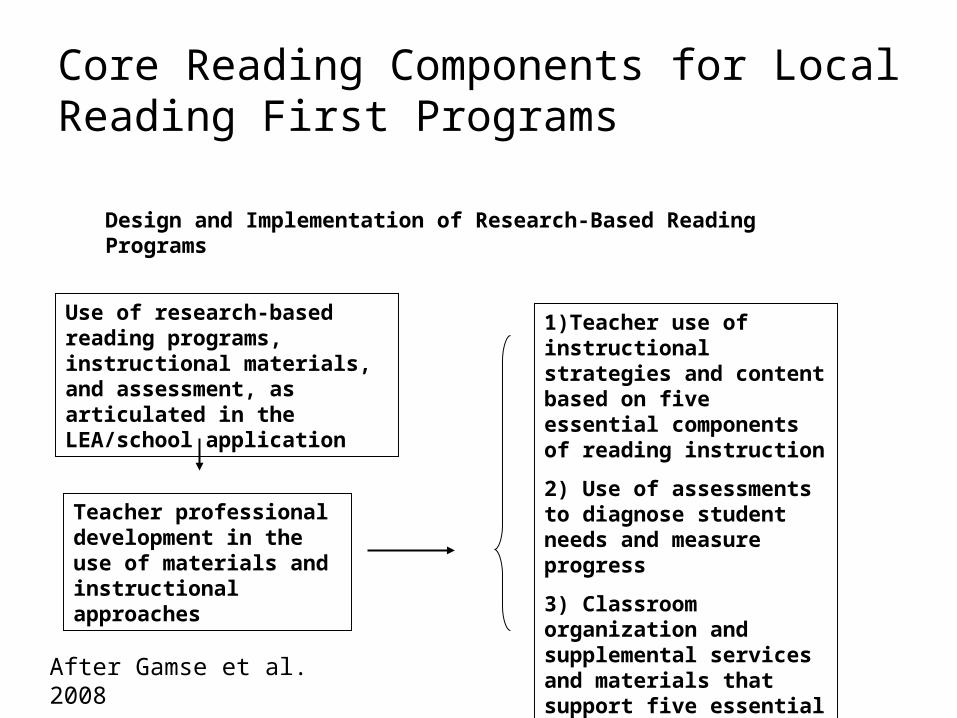
Core Reading Components for Local Reading First Programs
Use of research-based reading programs, instructional materials, and assessment, as articulated in the LEA/school application
Teacher professional development in the use of materials and instructional approaches
1)Teacher use of instructional strategies and content based on five essential components of reading instruction
2) Use of assessments to diagnose student needs and measure progress
3) Classroom organization and supplemental services and materials that support five essential components
Design and Implementation of Research-Based Reading Programs
After Gamse et al. 2008

From Major Components to Indicators…
Professional Development
Reading Instruction
Support for Struggling Readers
Assessment
Instructional Time
Instructional Material
Instructional Activities/Strategies
Block
Actual Time
Scheduled block?
Reported time
Major Components
Sub-components
Facets Indicators

Reading First Implementation: Specifying Components and Operationalization
Components Sub-components Facets Indicators(I/F)
Reading Instruction
Instructional Time 2 2 (1)
Instructional Materials 4 12 (3)
Instructional Activities /Strategies 8 28 (3.5)
Support for Struggling Readers (SR)
Intervention Services 3 12 (4)
Supports for Struggling Readers 2 16 (8)
Supports for ELL/SPED 2 5 (2.5)
Assessment Selection/Interpretation 5 12 (2.4)
Types of Assessment 3 9 (3)
Use by Teachers 1 7 (7)
Professional development
Improved Reading Instruction 11 67 (6.1)
4 10 41 170 (4)
Adapted from Moss et al. 2008

Reading First Implementation: Some ResultsComponents Sub-
componentsPerformance Levels ARSI (U3)
RF Non-RF
Reading Instruction
Instructional Time (minutes)
101 78 0.33 (63%)
Support 79% 58% 0.50 (69%)
Struggling Readers
More Tx, Time, Supplemental Service
83% 74% 0.20 (58%)
Professional Development
Hours of PD 41.5 17.6 0.42 (66%)
Five reading dimensions
86% 62% 0.55 (71%)
Assessment Grouping, progress, needs
84% 71% 0.32 (63%)
0.39 (65%)Adapted from Moss et al. 2008
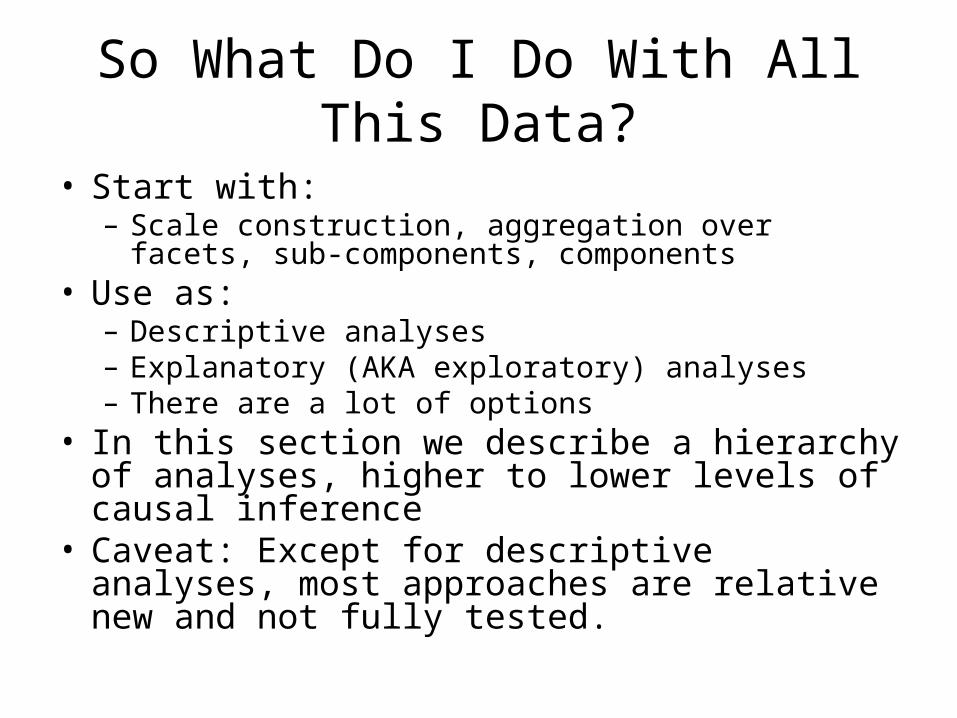
So What Do I Do With All This Data?
• Start with:– Scale construction, aggregation over facets, sub-
components, components• Use as:
– Descriptive analyses– Explanatory (AKA exploratory) analyses– There are a lot of options
• In this section we describe a hierarchy of analyses, higher to lower levels of causal inference
• Caveat: Except for descriptive analyses, most approaches are relative new and not fully tested.

Hierarchy of Approaches to Analysis:
– ITT (Intent-to-treat) estimates (e.g., ES) plus:• an index of true fidelity:
– ES=.50 Fidelity = 96%
• an index of Achieved Relative Strength (ARS).– Hulleman’s initial analysis: ES=0.45, ARS=0.92.
– LATE (Local Average Treatment Effect):• If treatment receipt/delivery can be meaningfully dichotomized and
there is experimentally induced receipt or non-receipt of treatment:– adjust ITT estimate by T and C treatment receipt rates.
• Simple model can be extended to an Instrumental Variable Analysis (see Bloom’s 2005 book).
– ITT retains causal status; LATE can approximate causal statements.

More on Fidelity to Outcome Linkages
– TOT (Treatment-on-Treated)• Simple: ITT estimate adjusted for compliance rate
in Tx, no randomization.• Two-level linear production function, modeling the
effects of implementation factors in Tx and modeling factors affecting C in separate Level 2 equations.
• Regression-based model, exchanging implementation fidelity scales for treatment exposure variable.

Descriptive Analyses
• Fidelity is often examined in the intervention group, only.– Dose-response relationship– Partition intervention sites into “high” and
“low” implementation fidelity:• My review of some ATOD prevention studies, the
ESHIGH =0.13 to 0.18
ESLOW =0.00 to 0.03
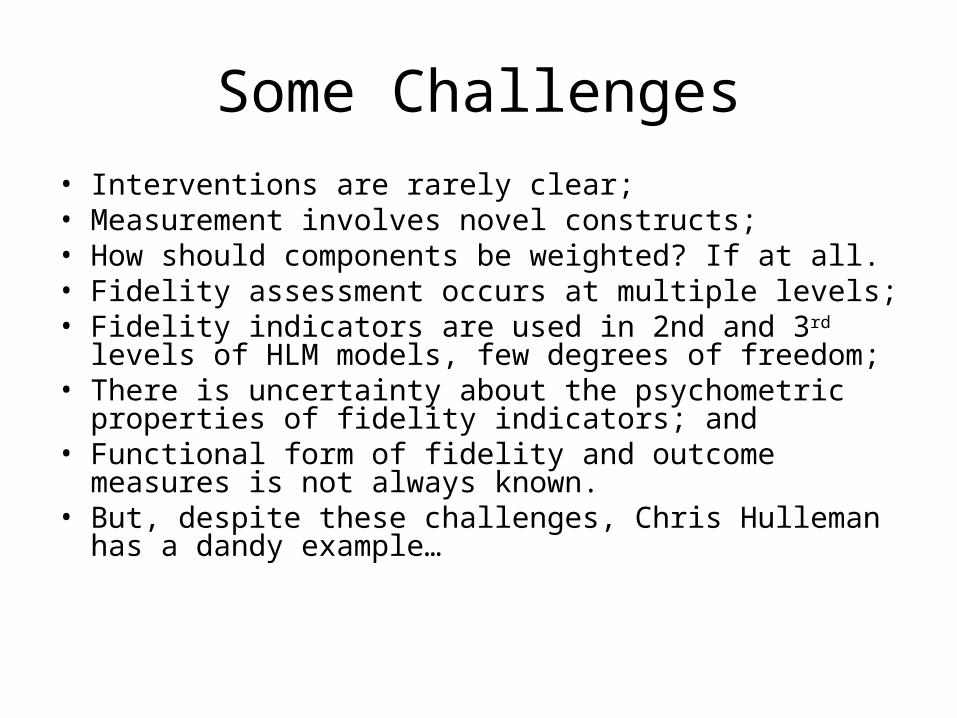
Some Challenges
• Interventions are rarely clear;• Measurement involves novel constructs;• How should components be weighted? If at all.• Fidelity assessment occurs at multiple levels;• Fidelity indicators are used in 2nd and 3rd levels of HLM
models, few degrees of freedom;• There is uncertainty about the psychometric properties of
fidelity indicators; and• Functional form of fidelity and outcome measures is not
always known.• But, despite these challenges, Chris Hulleman has a
dandy example…
Assessing Implementation Fidelity in the Lab and in Classrooms: The Case of a
Motivation Intervention

PERCEIVED UTILITY VALUE
INTEREST
PERFORMANCE
MANIPULATED RELEVANCE
Model Adapted from:Eccles et al. (1983); Hulleman et al. (2009)
The Theory of Change

Methods(Hulleman & Cordray, 2009)
Laboratory Classroom
Sample N = 107 undergraduates N = 182 ninth-graders13 classes8 teachers 3 high schools
Task Mental Multiplication Technique
Biology, Physical Science, Physics
Treatment manipulation Write about how the mental math technique is relevant to your life.
Pick a topic from science class and write about how it relates to your life.
Control manipulation Write a description of a picture from the learning notebook.
Pick a topic from science class and write a summary of what you have learned.
Number of manipulations 1 2 – 8
Length of Study 1 hour 1 semester
Dependent Variable Perceived Utility Value

Motivational Outcome
4.78
3.56
5.28
3.62
3
4
5
6
L ab C lassroom
Per
ceiv
ed U
tility
V
alue
C ontrol T reatment
g = 0.45 (p = .03)
g = 0.05 (p = .67)
?

Fidelity Measurement and Achieved Relative Strength
• Simple intervention – one core component
• Intervention fidelity: – Exposure: “quality of participant
responsiveness”– Rated on scale from 0 (none) to 3 (high)– 2 independent raters, 88% agreement

Exposure Laboratory Classroom
C Tx C Tx
Quality of Responsiveness N % N % N % N %
0 47 100 7 11 86 96 38 41
1 0 0 15 24 4 4 40 43
2 0 0 29 46 0 0 14 15
3 0 0 12 19 0 0 0 0
Total 47 100 63 100 90 100 92 100
Mean 0.00 1.73 0.04 0.74
SD 0.00 0.90 0.21 0.71

Indexing Fidelity
Absolute– Compare observed fidelity (tTx) to absolute or
maximum level of fidelity (TTx)
Average– Mean levels of observed fidelity (tTx)
Binary– Yes/No treatment receipt based on fidelity scores
– Requires selection of cut-off value
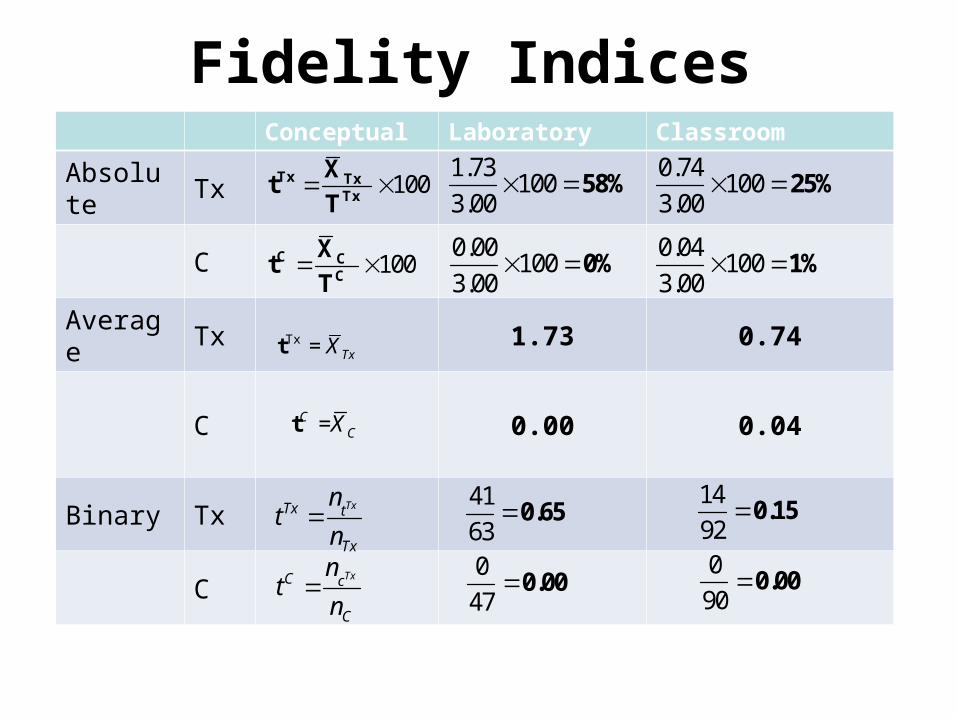
Fidelity IndicesConceptual Laboratory Classroom
Absolute Tx
C
Average Tx 1.73 0.74
C 0.00 0.04
Binary Tx
C
1.73100
3.00 58%
0.00100
3.00 0%
0.74100
3.00 25%
0.04100
3.00 1%
100 Tx TxTx
X t
T
Tx = TxXt
=CCXt
TxTx t
Tx
nt
n
TxC c
C
nt
n
41
630.65
14
920.15
0
470.00
0
900.00
100 C CC
X t
T

Indexing Fidelity as Achieved Relative Strength
Intervention Strength = Treatment – Control
Achieved Relative Strength (ARS) Index
• Standardized difference in fidelity index across Tx and C• Based on Hedges’ g (Hedges, 2007)• Corrected for clustering in the classroom (ICC’s from .01
to .08)• See Hulleman & Cordray (2009)
Tx C
T
ARS IndexS
t t

Average ARS Index
Where,
= mean for group 1 (tTx )
= mean for group 2 (tC)
ST = pooled within groups standard deviation
nTx = treatment sample size
nC = control sample size
n = average cluster size
p = Intra-class correlation (ICC)
N = total sample size
1 2 3 2( 1)( ) (1 ) 1
4( ) 9 2T Tx C
X X n pg
S n n N
1X
2X
Group Difference Sample Size Adjustment
Clustering Adjustment

Absolute and Binary ARS Indices
Where, pTx = proportion for the treatment group (tTx )pC = proportion for the control group (tC)
nTx = treatment sample size
nC = control sample sizen = average cluster sizep = Intra-class correlation (ICC)N = total sample size
3 2( 1)2*arcsin ( ) 2*arcsin ( ) (1 ) 1
4( ) 9 2Tx C
Tx C
n pg p p
n n N
Group Difference Sample Size Adjustment
Clustering Adjustment

Achieved Relative Strength = 1.32
Fidelity
Infidelity
Infidelity
TTx
TC
0.74 0.04ARS 1.32
0.53g
t c
pooled
X XARS g
sd
100
66
33
0
Treatment Strength
tC
t tx
cX
tX
3
2
1
0
Average ARS Index
(0.74)-(0.04) = 0.70
Achieved Relative Strength Indices
Observed Fidelity
Lab vs. Class Contrasts
Lab Class Lab - Class
Absolute Tx 0.58 0.25
C 0.00 0.01
g 1.72 0.80 0.92
Average Tx 1.73 0.74
C 0.00 0.04
g 2.52 1.32 1.20
Binary Tx 0.65 0.15
C 0.00 0.00
g 1.88 0.80 1.08

Linking Achieved Relative Strength to Outcomes

Sources of Infidelity in the Classroom
Student behaviors were nested within teacher behaviors
• Teacher dosage• Frequency of student exposure
Student and teacher behaviors were used to predict treatment fidelity (i.e., quality of responsiveness/exposure).

Sources of Infidelity: Multi-level Analyses
Part I: Baseline Analyses• Identified the amount of residual variability in
fidelity due to students and teachers.– Du to missing data, we estimated a 2-level model
(153 students, 6 teachers)
Student: Yij = b0j + b1j(TREATMENT)ij + rij,
Teacher: b0j = γ00 + u0j,
b1j = γ10 + u10j

Sources of Infidelity: Multi-level Analyses
Part II: Explanatory Analyses• Predicted residual variability in fidelity (quality of
responsiveness) with frequency of responsiveness and teacher dosage
Student: Yij = b0j + b1(TREATMENT)ij +
b2(RESPONSE FREQUENCY)ij + rij
Teacher: b0j = γ00 + u0j
b1j = γ10 + b10(TEACHER DOSAGE)j + u10j
b2j = γ20 + b20(TEACHER DOSAGE)j + u20j
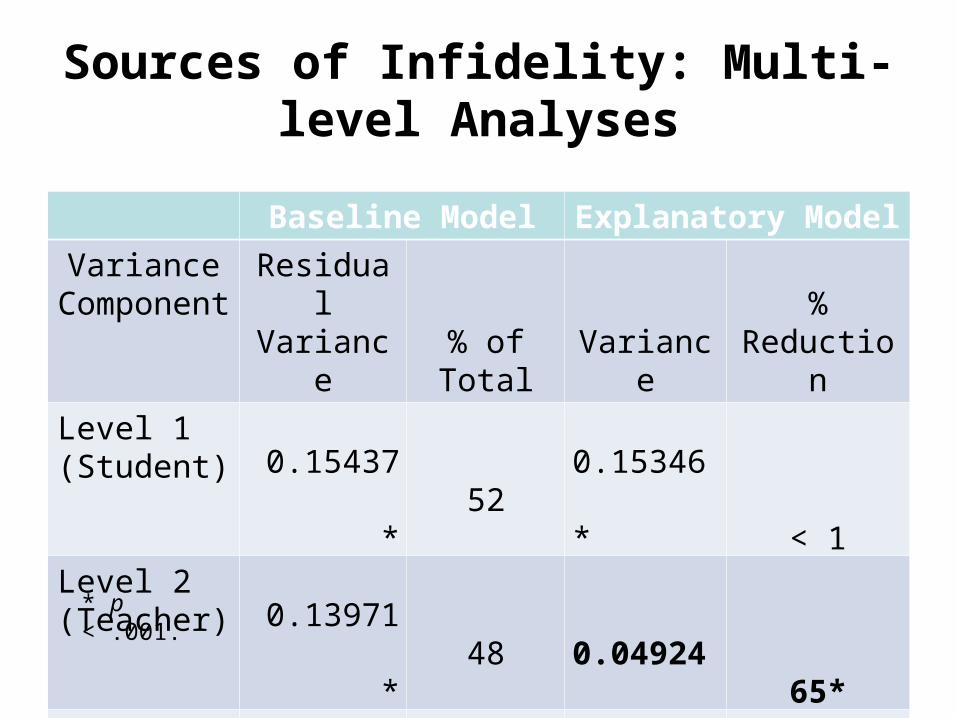
Sources of Infidelity: Multi-level Analyses
Baseline Model Explanatory Model
Variance Component
Residual Variance
% of Total Variance
% Reduction
Level 1 (Student) 0.15437* 52 0.15346* < 1Level 2 (Teacher) 0.13971* 48 0.04924 65*Total
0.29408 0.20270* p < .001.

Case Summary• The motivational intervention was more effective
in the lab (g = 0.45) than field (g = 0.05).• Using 3 indices of fidelity and, in turn, achieved
relative treatment strength, revealed that:– Classroom fidelity < Lab fidelity– Achieved relative strength was about 1 SD
less in the classroom than the laboratory• Differences in achieved relative strength =
differences motivational outcome, especially in the lab.
• Sources of fidelity: teacher (not student) factors
Key Points and Issues
• Identifying and measuring, at a minimum, should include model-based core and necessary components
• Collaborations among researchers and practitioners (e.g., developers and implementers) is essential for specifying:– Intervention models– Core and essential components– Benchmarks for TTx (e.g., an educationally
meaningful dose; what level of X is needed to instigate change)
– Tolerable adaptation

Key Points and Issues
• Fidelity assessment serves two roles:– Average causal difference between
conditions; and– Using fidelity measures to assess the effects
of variation in implementation on outcomes.
• Post-experimental (re)specification of the intervention

Thank You
Questions and Discussion