Embed Size (px)
Citation preview

J PROD INNOV MANAG 273 1993; 10:273-290
0 0 0 0
Assessing New Product Development Practices and Performance: Establishing Crucial Norms
Albert L. Page
In 1968 and 1982 cross-sectional studies o f the conduct and performance of new product development were reported, the wide-ranging results o f which have been widely reproduced and cited as norms for product development. Since the more recent study, many changes in the practice and environment o f product development have occurred. Albert Page describes the findings o f a new cross-sectional study, sponsored by PDMA, which reports on the current status of new product development and updates those commonly referred to norms. On the one hand, this article reports that the state of practice, covering both structure and process, has improved, although there is still substantial room for further improvement. On the other hand, the results for five different measures of firm and program performance indicate these practice improvements have not resulted in notable improve- ments in the overall performance o f the new product development activity within the responding companies.
Address correspondence to Albert L. Page, College of Business Administration, University of Illinois Chicago, P.O. Box 4348, Chicago, IL 60680.
Introduct ion
The Product Development and Management Association (PDMA) is dedicated to serving people with a profes- sional interest in the management of new products. Its fundamental purpose is to seek improvements in the theory and practice of new product planning and development. This has led to a commitment to the development of a research tradition and stimulating quality research efforts in the new products field.
PDMA recently reported on its first effort to stimulate research when it presented a research agenda for PDMA [6]. Two of the topics of research emphasized in the report were the need for a study to establish the levels of new product performance and success and failure as well as an examination of good or best practices in the new products field.
To further its contribution to research, PDMA's Board decided the organization would undertake a research project that would have broad interest and value to its members and others working in the areas of innovation and new products. Consistent with its research agenda definition, two primary objectives were identified for what has come to be called PDMA's Best Practices Study. First, they were to provide a description of the current state of the new product work going on in North America as we entered the 1990s, and second, identify the practices that appear to be most effective and produce the best results for the companies that use them. Thus, the Best Practices Study was conceived of as being a broad- based macro-level study. It would also have the additional benefit of providing information that would
© 1993 Elsevier Science Publishing Co., Inc. 0737-6782/93/$6.00 655 Avenue of the Americas, New York, NY 10010

274 J PROD INNOV MANAG A.L. PAGE 1993; 10:273-290
BIOGRAPHICAL SKETCH
Albert L. Page is an Associate Professor of Marketing in the College of Business Administration at the University of Illinois Chicago. Prior to joining the faculty there he was on the faculty of the School of Management, Case Western Reserve University. He earned the MBA and Ph.D. degrees in marketing from Northwestern Univer- sity. His research and teaching interests span the fields of product development, industrial marketing, and strategic market planning. He has published articles on these topics which have appeared in many of the leading journals in these areas including three earlier articles in the Journal of Product Innovation Management. He has also been a consultant to corporate clients on many occasions. Dr. Page is a long-time member of the Product Development and Management Association and has held several offices within the Association. He is currently serving as its President-Elect.
allow longitudinal comparisons to be made with other broad-based studies of the field conducted by Booz, Allen and Hamilton (BAH) in 1968 and 1982 [3,4].
Although the representativeness of the samples on which the BAH studies were based has never been addressed, the two studies produced many findings that have been widely reproduced and cited as norms for the practices and performance of the new product development field. Since those studies were conducted many changes have taken place in the environment affecting new product development. These have undoubtedly resulted in changes in the practices used and perhaps in the resulting performance as well. Therefore, the commonly cited norms from the BAH studies may be no longer accurate reflections of the state of the field today.
The purpose of this article is to introduce the Best Practices Study and report on the study results pertaining to the first objective mentioned above, namely, the descriptive results regarding the current state of new product work which can serve as current norms for the field. The analytical results pertaining to the second objective of identifying "best practices" will be presented in a subsequent article to appear in this journal.
The subsequent sections of this article will describe the sample of companies upon which the study results are based, and the descriptive picture they present of the state of new products work in North America. In the rest of this article the term product will be used to encompass both goods and services except where the difference between the two terms is clearly delineated. Exhibit 1 highlights the most interesting findings of the study, whereas Exhibit 2 summarizes the research methods used for the Best Practices Study. A complete
description of the research design and methodology is presented in the Appendix.
Sample Profile
Table 1 shows that the organizational units represented in the sample tend to be divisions or subsidiaries of larger organizations (70.9%) which are predominantly located in the U.S. (95.2%). There are also many more manufacturing businesses (78.8%) than service-based businesses (13.8%). The manufacturing businesses tend to emphasize product (78.9%) rather than process- based technology (14.3%), and they are about equally split between producing products that are high tech (34.8%), low tech (30.4%), or a combination of both high and low tech (34.8%).
Exhibit 1. Findings of the Best Practices Study
Here are the most notable and interesting findings from the survey of 189 companies.
1. Over 76% of the responding companies now use multidisciplinary teams to develop new products.
2. Only 56.4% of the companies have a specific new product strategy, and only 54.5% have a well-defined new product development process, whereas 32.8% still had neither one!
3. It takes the average company in the study 2.95 years to develop more innovative types of new products.
4. Formal financial criteria to measure the performance of new products are developed by 76% of the companies.
5. Insufficient resources is the most frequently mentioned obstacle to successful product development.
6. Companies are developing one successful new product for of every eleven new product ideas or concepts they consider.
7. Over a recent five-year period, the companies intro- duced an average of 37.5 new products, whereas the median was twelve. These figures are expected to increase to forty-five and twenty, respectively, during the next five-year period.
8. The companies achieved a success rate of 58% of the products they introduced during the recent five-year period.
9. The companies spent 52% of their new product expenditures on new products that were financially successful.
10. In 1990, 32% of company sales came from new products introduced during the previous five years. In 1995, the respondents expect that 38% will come from new products introduced during the 1990-1995 period.

ESTABLISHING CRUCIAL NEW PRODUCT NORMS J PROD INNOV MANAG 275 1993; 10:273-290
Exhibit 2. A Summary of the Best Practices Study Research Methods
The study focused upon the entire new product development program of a corporation or division as the unit of analysis rather than any particular new product(s). In addition to classification questions, information about the program, including organizing the new product activity, compensa- tion plans used, and the development process, was collected along with information regarding the performance of the overall product development program and its impact on the firm or division.
The information was collected via a mail questionnaire sent to PDMA practitioner members and consultant mem- bers in North America. The consultants were asked to pass it on to their clients. The instructions accompanying the questionnaire told the recipient " i f you are not a senior person familiar with the scope of the new product development activities and processes within your organi- zation, please pass this questionnaire on to such a person and ask her/him to complete and return it." The overall response rate to the survey was satisfactory considering the length of the survey booklet and the pass along that was requested. The final sample contained 189 responses.
Comparison of the distribution of the respondents' titles with that from a much larger survey of the PDMA membership [ 14] indicated the Best Practices sample was quite similar to it and, therefore, likely to be representative of the membership. In turn, the PDMA membership is found to be broadly representative of the scope and variety of the industry groups and major markets in North America. Therefore, the Best Practices results should be broadly indicative of the practices and performance of the product development program practices in operation in North America.
The rest of the information in Table 1 provides some quantitative measures of the businesses in the sample as well as of their new product activities. Their average sales were $529 million in 1989, however, the median of the distribution was higher at $1.0 billion indicating there are many businesses with smaller sales in the sample that serve to lower the mean value to nearly one- half the median value. The average business in the sample introduced 8.7 new products in 1989, although the median value was less at 4.0 new products. This average is very similar to the results reported for 1989 in a study by Mahajan and Wind [21]. Their sampling was also from the PDMA membership but was restricted to the Fortune 500 firms within it and resulted in a sample of seventy-eight responses from sixty-nine companies. They do not report a single average for the number of new product introductions for all businesses in their sample, but rather, 1989 averages for five types of
strategic business units. The unweighted average num- ber of new product introductions for those five groups was 9.2 in 1989.
Finally, the five-year average annual expenditure for new product development was $20 million, while the median was only $3 million. The fact that the median is well below the mean for each of the distributions for new product introductions and annual new product expenditures indicates they are skewed by some businesses in the sample reporting very large values for these variables.
Organizing for New Product Development
Every product development textbook devotes one or two chapters to the issue of organizing for new product
Table 1. A Profile of the Sample
Location?
U.S. = 95.2% Canada = 4.8%
Goods or service business?
Goods = 78.8% Service = 13.8% Both = 6.4%
Corporate level or division/subsidiary?
Corporate = 29.1% Division/subsidiary = 70.9%
For companies that manufacture a product, are the products high tech, low tech or both?
High Tech = 34.8% Low Tech = 30.4% Both = 34.8%
For companies that manufacture a product, is the organi- zation's major emphasis on process technology, product technology, or both?
Process Technology = 14.3% Product Technology = 78.9% Both = 6.8%
Sales of the responding business unit in 1989?
Average = $529 Mil. Median = $1.0 Bil.
Five-year average annual expenditure for new product development?
Average = $20 Mil. Median = $3.0 Mil.
Number of new products introduced in 1989?
Average = 8.71 Median = 4.00

276 J PROD INNOV MANAG A.L. PAGE 1993; 10:273-290
development and discusses the different options that are available for structuring the new products activities of the firm. Yet there is little information available about how businesses are actually dealing with that problem today. In fact, the impressiop gained from the recent new product development literature [ 1,2,8,20] is that multifunctional or multidisciplinary new product teams are currently the focus of management's interest and attention, while Crawford suggests that industry seems to be in a constant state of flux with regard to how to most effectively organize their new product activities [9, p. 407].
Type of Organization
In 1968, BAH reported that 86% of the best-known companies had formal new products departments, while in 1982 they found almost half of the companies surveyed used more than one type of organizing structure for their innovation activities.
Respondents were asked to indicate which of six forms of new product organization structure best described the ones used by their firm. The results, shown in Figure 1, suggest that a noteworthy change has occurred since the 1968 and 1982 reports. The multidisciplinary team is now by far the most widely used organizing structure to which firms resort. It is utilized by over 76% of the sample businesses, while the new products department has fallen out of favor, with only 30% of the sample now utilizing it.
The sum of the percentages shown in Figure 1 exceeds 100% because the respondents were asked to report all the forms of organizing structures used. The percentage of respondents indicating their organiza- tion uses more than one form remained about the same as in 1968 (53%) with an average of 1.86 forms used per respondent, while 25.9% of them reported combin- ing two types of structures, and 16.9% used three. Not surprisingly, the most frequently reported structures used in combinations were also those used most frequently, and the most frequently reported combina- tions were as follows:
Multidisciplinary team and product manager (23.8% of companies)
Multidisciplinary team and new product man- ager (19.0%)
Multidisciplinary team and new product depart- ment (19.0%)
• Multidisciplinary team and new product com- mittee (12.2%)
Functional Areas
With the use of multidisciplinary teams and the combinations of organizational forms prevailing in new products work today the questions also arise as to which functional areas are involved in working on new products on a day-to-day basis, and how much of their time is devoted to new products work as opposed to their primary functional responsibilities? Figures 2 and 3 shed light on these questions.
Figure 2 shows the functional areas that participate in new product development on a day-to-day basis. The three primary functional areas involved in working on new products in more than 50% of the companies are marketing, followed by R&D, and then engineering, while the functions that are involved in new products work in less than half the companies are manufacturing, new products, sales, and finance. Other functions occasionally involved in new product work, but not shown in Figure 2 because they were mentioned less than 6% of the time, included marketing research, legal/regulatory, quality control/ assurance, field/customer service, systems/opera- tions, design/industrial design, and clinical affairs/ research. In 1984 Crawford called for the need for multifunctionality in organizing for new product innovation [23, p. 59]. These results confirm the multidisciplinary nature of new product development work as we entered the 1990s and indicate his call is being answered.
Time Spent By Function
The results just described indicate that most of the work done in the course of developing new products is carried out by people from other functional areas. How much of the time of those other areas is devoted to working on new products? Figure 3 shows the answers to this question. The R&D, engineering, and marketing areas devote 55.8%, 34.1%, and 28.4% of their available time to supporting new product development activities in their organizations, while manufacturing, sales, and finance devote a much lower share of their time to it. Interestingly, business unit general manag- ers devote almost 18% of their time to the new products efforts in their units, however, corporate management devotes only 10% of its time to it. Perhaps this low level of attention is indicative of why

ESTABLISHING CRUCIAL NEW PRODUCT NORMS J PROD INNOV MANAG 277 1993; 10:273-290
. . . . . . . . . . . . . . . . . . . . . . . . . . . . . . . . 8 0 % o f C o m p a n i e s .........................................................................
........................................
. . . . . . . . . . . . . . . . . . . . . . . . . . . . . . . . . . . 600 ............................................................... ! :
. . . . . . . . . . . . . . . . . . . . . . . . . . . . . . . . . 40% . . . . . . . . . . . . . . . . . . . . . . . . . . . . . . . . . . . . . . . . . . . . . . . . . . . . . . . . . . . . .
New Multidisciplinary Products Product
Team Department Manager
New New Product Products Venture Manager Committee Team
Figu re 1. Organ i za t i ona l s t r u c t u r e s used for new product development.
many new products people cite lack of top manage- ment support as one of the obstacles to successful innovation [25; and also see Table 4].
The Role of the Product Champion
One of the concepts that diffused widely through the new products field in the early 1980s was the "Product Champion." Peters and Waterman popularized the zealous, volunteer champion and championing sys- tems in their 1982 book In Search of Excellence [27], and in 1982 BAH found almost one-half of all firms encouraged champions. Today the importance of the champion's role in innovation is acknowledged in both textbooks [9] and business books [19]. Yet the respondents to the Best Practices Survey indicated that there has been no change in the champion's status in the profession• As in 1982, only 43.4% of the responding firms actually encouraged champions, while another 31.7% acknowledged their existence and 18% were indifferent to them. The remainder had no champions or actually discouraged them.
C o m p e n s a t i n g N e w P r o d u c t P r o f e s s i o n a l s
One area of new products management where we have very little hard information about actual practices is compensation of new product professionals. Feldman [14] reported actual compensation levels but nothing about the compensation plans that were used, while Miller [24] reports that both he and Feldman have found almost no literature available on the topic of compensating new products people.
The purpose of any compensation program should be to motivate behavior, yet the greater risk inherent in new products work makes it challenging for managements to devise plans that effectively address the risk/reward dimension and suitably encourage risk-taking behavior [5]. Kuczmarski believes that new products compensation is still in the "dark ages" and is the "most underdeveloped area of new products management" [19]. Most textbooks do not even mention the issue of how to compensate new products people. The only hard information we have had on this issue comes from BAH. In 1982 they reported that 38% of companies had compensation plans for their new products people that utilized only

278 J PROD INNOV MANAG A.L. PAGE 1993; 10:273-290
. . . . . . . . . . . . . . . . . . . . . . . . . . . . . . . . . . . . . . 100% of Companies . . . . . . . . . . . . . . . . . . . . . . . . . . . . . . . . . . . .
t . . . . . . . . . . . . . . . . . . . . . . . . . . . . . . . . . . . 8 0 0 ~ O . . . . . . . . . . . . . . . . . . . . . . . . . . . . . . . . . . . . . . . . . . . . .
i
t
I" . . . . . . . . . . . . . . . . . . . . . . . 60% . . . . . . . . . . . . . . . . . . . . . . . . . . . . . . . . . . . . . . . . . . . . .
O
O
Research and New All
Marketing Development Engineering Manufacturing Products Sales Finance Other
Figure 2. Func t iona l a r ea s involved in new p r o d u c t work .
a base salary, while 57% reported they tied compensa- tion to general performance, and only 5% tied compensation directly to new product performance.
Compensation Plans
What is the situation today? The Best Practices respondents told us that 47% of their companies used compensation plans based on straight salary, an increase of 9% from 1982, while 51% said their plans were based on a base salary plus a bonus, and 2% reported their companies used both types of approaches when com- pensating their new products professionals. These results seem to indicate that, currently, even less effort is expended on using compensation plans to motivate entrepreneurial and risk-taking behavior among their new products people.
The 53% of respondents who said their company's compensation plan involved a bonus were also asked upon what factors the bonus was based. The many different answers given were grouped into four major categories and an "other" group. The four major bases for bonuses were as follows:
• Company profitability (20.1% of companies)
• Individual performance (20.1%)
• Successful accomplishment of the new product project (15.9%)
• Performance of the new product (7.4%)
• Other (13.2%)
Only 7.4% of the 189 companies tie their compensa- tion plans directly to successful performance of new products, which represents only a slight increase from eight years earlier. Instead, companies use other criteria that are less closely tied to new product performance such as company profitability, individual performance, and the accomplishment of the new product project, for determining bonuses for new product professionals.
Awards and Recognition
Awards and other forms of recognition that are not directly tied to the compensation program can be powerful tools management can use to motivate its
ESTABLISHING CRUCIAL NEW PRODUCT NORMS J PROD INNOV MANAG 279 1993; 10:273-290
Research and
Development Engineering Marketing
Business Unit General
Manager
F i g u r e 3. Percent o f t ime devoted to working on new products.
Corporate Manufacturing Sales Management Finance
new products people [19,24]. The Best Practices Survey asked the respondents to describe the use of these tools by their organizations. Only 20.6% of the respondents indicated that their organizations used incentives and awards as motivation tools and men- tioned 112 specific answers that fell into four different groupings. They were the following:
• Promotion/career advancement (12.7% of companies)
• Major financial incentives (7.9%)
• Minor financial awards (7.9%)
• Non financial awards and recognition (10.0%)
The largest direct financial award reported was $3000 with the most frequent amounts reported in the range of $500 to $1000, while promotion and career advancement can also be thought of as representing the largest financial incentive of all. Nonfinancial awards and minor recognition included answers like annual award, quarterly recognition dinner, public recogni- tion, lunch, company news letter article, and "pat on the back."
The New Product Development Process
Probably the most frequently researched and written about aspect of new product development is the actual process itself. Some version of it appears in every new products text and the original Booz, Allen and Hamilton formulation is widely utilized and cited. The Best Practices Study investigated different characteris- tics of the process, as it is employed today, beginning with whether or not companies use a new product planning process and whether it is driven by a new product strategy [ 15].
The Use of Strategy and Process
In 1982 Booz, Allen and Hamilton reported that 75% of its surveyed companies had a new product strategy as part of their new product process and said "most companies use a formal new product process usually beginning with identifying the new product strategy" [3, p. 6]. Yet other studies suggest that 75% is too high. Feldman and Page [15] and Moore [22] found the use of formal new product strategies to be lacking in most of the companies they examined. The percentages of

280 J PROD INNOV MANAG A.L. PAGE 1993; 10:273-290
companies using formal new product strategies in their studies were only 11% and 33%, respectively, a very substantial difference from 75%.
The results from this study fall in between that range. The Best Practices respondents reported 56.4% of their organizations had a specific strategy for its new product activities which directs and integrates the entire new products team, while only 54.5% said a well-defined, structured process for the development of all or most of its new products was followed. Furthermore, only 43.4% had both a new product strategy and formal development process, whereas a substantial 32.8% still had neither one! The organiza- tions that reported using a well-defined new product development process also said they had adopted it recently, using it for an average of only 4.7 years.
Almost ten years ago Feldman and Page [15] pointed out that there was a substantial gap between the principles of product development and its practice. Today, these Best Practices results suggest that substantial room for improvement in the utilization of new product strategy and process still remains.
Cycle Time
Fast new product development cycle time and time based competition have become the norms for the 1990s [28-30,32]. The overall impression is that the companies surveyed are responding to the growing need for speed. Respondents said their organizations typically took 2.95 years to develop more innovative types of new goods and services. Nearly 41% of the respondents said their organizations were developing new products more quickly than five years ago, while 36.8% said they were taking about the same amount of time to do it today and encouragingly, only 16.4% reported they were taking longer to do it today than they did five years ago. Also, 51.9% of the respondents reported their organizations regularly obtained assis- tance from outside consultants during the course of their new product development work.
Stages in the Process
There are many conceptions of the new product development process and they are presented as containing varying numbers of steps, stages, and/or activities. Crawford [9] presents a process with five stages and as many as 67 specific activities, while Cooper and Kleinschmidt [7] researched thirteen
different steps in the process. This variety in concep- tions and composition, along with differences in terminology present difficulties when researching the new product development process.
The approach taken in the Best Practices Survey was to ask respondents whether seven carefully described new product development activities were recognized as part of their organization's product development process, and if so, how long it typically took for each activity to be completed. This approach avoided the potential difficulty of differences in terminology across respondents. The seven activities are similar to the stages of the commonly referenced BAH concep- tion of the new product development process. Their descriptions and the results are shown in Table 2.
The results in Table 2 demonstrate usage of the seven steps ranging from a low of 76.2% for the concept screening activity to a high of 98.9% for the product development activity. These rates of usage are similar to those reported by Moore [22] as well as by Mahajan and Wind [21] for eleven more specific process activities. They are also higher than those reported by Cooper and Kleinschmidt [7] for the thirteen more disaggregated activities they researched. Some of these differences may be attributable to the degree of specificity of their activity descriptions. Thus the respondents recognize certain activities that they usually perform when developing new products for their organizations even though they do not have what they would characterize as a "well-defined, structured process for the development of all or most" of their new products. If that is the case, then it seems what is required is an explicit structuring and ordering of these activities into a coherent process.
The two least frequently used activities are concept screening and concept testing which both occur at the front end of the process. This suggests that working with concepts before they are developed may be the area of the development process where companies are weak, and that improvement in product development could be achieved by greater utilization of these activities. Only 20% percent of the respondents also listed other activities that were performed as part of their process. This indicates that most of the respon- dents felt the seven activities specified broadly represented their complete process. The two identifia- ble categories to the "other" answers had to do with the patent process and registration and regulatory process approval and registration.
Those respondents who said they used each activity also reported how long it typically took to perform it.

ESTABLISHING CRUCIAL NEW PRODUCT NORMS J PROD INNOV MANAG 281 1993;10:273-290
Table 2. New Product Development Process Activities: Usage and Time Spent
Activity Percent Using Months Spent
Concept Search This includes brainstorming and other creativity-stimulating techniques, 89.9 preliminary discussions about the product's design, and identifying new product opportunities.
Concept Screening This may include scoring and ranking concepts according to some criteria and 76.2 eliminating unsuitable concepts.
Concept Testing This covers preliminary market research to determine market need, niche, and 80.4 attractiveness.
Business Analysis An evaluation of the product concept in financial terms as a business 89.4 proposition
Product Development The technical work to convert a concept into a working product. 98.9
Product Use Testing, Field Testing, and/or Market Testing Offering the product to a preselected group of potential buyers to determine its 86.8 suitability and/or marketability.
Commercialization Launching the new product into full-scale production and sales. 96.3
Other Process Activities Includes regulatory approval/registration and patent process filing. 20.1
3.51
2.96
3.63
2.58
14.37
6.04
6.46
8.59
The results for the time spent to accomplish each of the activities is also shown in Table 2. As would be expected the activity of product development takes the longest to perform at 14.4 months, while the business analysis activity takes only 2.6 months.
If the times for the seven specific activities shown in Table 2 are added together and divided by twelve, the total time to perform the seven steps is 3.3 years which is only slightly longer than the 2.95 years reported earlier for the time it takes to develop a new product.
One of the means to speed up the development process that is frequently mentioned in the new product literature is "parallel processing" or concur- rent activities [26,31]. The comparison of the two measures of the total time to develop new products implies that relatively little parallel processing is going on in North American product development. The processes are almost completely sequential with only about 10% overlap. These results indicate more parallel processing probably can be used to further speed up the development process.
Johne has described the development process as comprising two main phases: those of initiation and
implementation [17]. Initiation involves the front-end activities of idea generation, concept screening, and concept testing and development, while implementa- tion includes product development proper, market testing, and commercialization. These two main phases can be considered the front and back ends of the process. In Table 2, the first four activities comprise that front end and take 12.7 months, or 32% of the total elapsed time, while the other three are the back end and those activities take 26.9 months and account for 68% of the time. In 1968 BAH called for devoting more time to the front end of the develop- ment process. Based on the usage and time results in Table 2, it seems as though this recommendation is still appropriate.
Measures o f New Product Performance
An important part of the front end work necessary for product development is evaluating the new product concept in financial terms as a business proposition. Once this business analysis has been performed the

282 J PROD INNOV MANAG A.L. PAGE 1993; 10:273-290
estimates of the new product's future financial performance become objectives against which to compare the product's subsequent actual market performance and determine whether it is successful or not, and, if so, to what degree.
In 1982 BAH found that two-thirds of all companies measured new product performance and nearly two- thirds used more than one measure of success. Among the survey respondents, 76.2%, an increase of about 10% from 1982, said their organizations develop formal financial objectives against which the product's actual performance will later be measured. Furthermore, 73.9% of those respondents also said the financial objectives are different for each new product project indicating they manage their new product projects as a portfolio of different financial investments.
Griffin and Page [16] have identified seventy-five different measures of new product performance and success/failure culled from the new product literature and a survey of a limited number of practitioners. What are the financial objectives this larger sample of 189 organizations use for measuring product performance and do they use any nonfnancial criteria for determin- ing a successful new product? Table 3 shows the answers to the survey questions regarding financial and nonfinancial objectives.
Table 3. Criteria Used to Measure New Product Per formance
A. Financial Criteria Used to Measure the Performance of New Products
Return on investment Various profit margin measures Sales and sales growth Various profit measures Payback and payback period Internal rate of return ROA, ROE, and ROCE Breakeven and breakeven point Share and market share Return on sales Net present value Other financial measures
23.3% 20.6% 20.6% 16.4% 8.5% 8.5% 8.5% 5.3% 4.8% 3.2% 2.6%
16.9%
B. Nonfinancial Criteria Used to Measure the Performance of New Products
Sales performance of new products Market share achieved Satisfy customer needs Other marketing-related benefits Strategic issues/fit/synergy Technical aspects/performance Uniqueness of the new products Other nonfinancial factors
30.7% 24.9% 21.2% 18.5% 13.2% 9.0% 1.6%
10.6%
Financial Measures
In 1982 prof t contribution, return on investment, and sales were the most frequently used financial measures of new product performance. In 1990 these three were still among the most widely used but eleven different categories of financial measures were reported in use by some portion of the respondents, and the average respondent mentioned using 2.0 different measures. Table 3 reveals the most frequently used measures in 1990 were ROI, profit margin measures, sales and sales growth, and profit measures. These results are very similar to those reported by Mahajan and Wind [21] as well as those from 1982. Together the similarity of these findings suggest that we do know the criteria firms use to measure the performance of new products, and that their choices of criteria have not changed much over recent years.
Other Measures
Companies may also specify nonfinancial criteria for their new products to achieve. We note 82% of the companies reported also using an average of 1.6
different nonfinancial measures of performance with the most frequently mentioned being sales, market share, and satisfying customer needs. Some respon- dents felt sales and market share are financial measures, while others felt they are nonfinancial. If the two sets of these answers in Table 3 are combined, they are the two performance criteria most frequently used by the responding companies, with 51.3% using sales measures and 29.6% using share measures.
Obstacles to Successful New Product Development
Each of the two BAH studies examined the kinds of problems faced by new product development practitio- ners. In 1968, organizational-type problems were the predominant ones reported with 81% of companies reporting such problems, and half of all the problems mentioned fell into this category. Poor control and follow-up, poorly defined objectives and inadequate business analysis were the other major problems cited. The 1982 report found lack of attention to new

ESTABLISHING CRUCIAL NEW PRODUCT NORMS J PROD INNOV MANAG 283 1993; 10:273-290
products, emphasis on short-term profitability, inade- quate market research, and delays in decision making as the primary problems cited by practitioners. All four of these problems were mentioned by 30% or more of the respondents.
The Best Practices Survey asked the same obstacles question in order to make longitudinal comparisons of the major obstacles faced by new product managers across three studies conducted over twenty years. The results for this question are shown in Table 4, where the 383 specific problems mentioned as obstacles to successful new product development are grouped into twelve specific categories, plus an "other" category. On the average, each respondent mentioned just over two major obstacles and five respondents did not mention any.
The results from 1990 show a greater variety of problems cited by the respondents and a lesser frequency of mentions than in the two earlier studies suggesting that the obstacles to new product develop- ment are more varied and less uniform across companies today than they were in earlier years. The most frequently mentioned problem area, which involves executing the activities involved in the development process, was mentioned by only 28.6% of the respondents.
Most of the major obstacles mentioned in earlier years are still to be found among those shown in Table 4, although at a lower frequency. The most interesting addition to the list is the set of three problems related to the resources necessary for product development. Answers relating to financial resources, human re- sources, and other such resources as engineering, marketing research, or design did not appear in the two earlier studies. However, if the three resource groups are combined, they then represent the most frequently mentioned obstacle in the study with 39.2% of the companies mentioning one or more of these resource problems.
The recent economic and business environment has caused most businesses in North America to cut back on their organizations, people, and budgets in the past few years. In this light it certainly appears as though the most frequent major obstacle faced by new product practitioners today is insufficient resources to develop successful new products, whereas twenty years ago it was organizational problems, and ten years ago it was lack of attention to new products. This lack of resources may be also a partial explanation for the high incidence of the reported regular use of consultants since consultants represent
Table 4. Obstacles to Successful New Product Development
Percent Obstacles Mentions
Activities within the new product development 28.6 process
Top management role/support in product 25.4 development
Financial resources/support for product 24.9 development
Role of marketing in new product development 19.6
Management/organization for new product 16.9 development
Risk in new product development/company 15.9 risk attitude
Bureaucratic nature of the organization 12.7
People resources/support for new product 12.2 development
Other resources/support for new product 10.6 development
Short-term outlook/orientation 6.9
Communications in new product development 6.9
Time available to do new product work 6.3
Other factors 15.9
an outside source of expert resources that can be used on an as-needed basis.
Performance of New Product Programs
We have examined many aspects of companies' new product organizations, processes, and practices. The final question to be considered here is how well do they work for the respondents' new product programs? How well are the new product programs of businesses in North America performing?
The questionnaire contained many questions that focused on new product program performance rather than the performance of individual products. If the Best Practices sample can be considered representa- tive of the new products community in North America, then taken together, the answers to these questions provide a pretty complete picture of how new product development is performing in North American companies.
They also serve as norms against which individual companies can start to assess their own new product performance. It should be noted that the results presented below are not the benchmarks provided by

284 J PROD INNOV MANAG A.L. PAGE 1993;10:273-290
the performance of the very best finns but rather the average performance for a broad cross-section of firms. As such they are a place to begin assessing individual company performance. Furthermore, when they are compared to similar measures from ten and twenty years ago, as well as from other studies, they also give us some insight into the changes that have occurred in the performance of new product programs across those years.
The Decay Curve of New Product Ideas
A widely referenced concept in the new products field is the decay curve of new product ideas. It depicts the percentage of any firm's new product ideas that survive through the successive stages of the develop- ment process. It is the result of all the firm's individual evaluation decisions, and is, therefore, one measure of the overall effectiveness of a new product program [9].
In 1968 BAH found that it typically took fifty-eight new product ideas in order to actually produce one successful new product. In 1982 they found this number had dropped dramatically to only seven, pointing to a substantial improvement in the ability of firms to focus their search for new product ideas.
In 1990 the responding firms indicated that their development processes were operating at the following rates: out of 100 new product ideas that enter their development process, 26.6 of them are typically tested in some formal manner, 12.4 of them are introduced into the market, and 9.4 are typically commercially successful. Nine successful new products from 100 ideas converts to one successful new product for every eleven new product ideas which is a slight decline in overall program effectiveness from the 1982 figure of s e v e n t o o n e .
The Number of New Products Introduced
Another measure of new product program performance is the number of new products the program develops and the trend in that number. In 1982 BAH found that the median number of new products introduced during the five-year period from 1976 to 1981 was five, and the companies expected to double the number of new products introduced during the next five years. We have already seen in this study that the number of new products introduced in 1989, alone, by the respondent companies averaged 8.7, while the median was 4.0. Clearly, there has been some substantial acceleration in the pace of new product introductions since 1982.
Over a comparable five-year period the difference is even more noteworthy. The respondents in this study indicated their organizations had introduced an aver- age of 37.5 new products during the 1985-1989 period, while the median number of introductions was 12.0, which amounts to a substantial 140% increase over the BAH figure for the 1976-1981 period. For the 1991-1995 period, the respondents expect a further increase in the number of new product introductions to an average of 45.3 during the five years and a median number of 20. The respondents expect the acceleration in the pace of new product introductions to continue, and these figures give us some idea of what their expectations are. However, the respondents to the 1982 study have been shown to have substantially underesti- mated the pace of the increase! Surely the pressure put on new products practitioners to develop more new products will increase and they will have to do it in an environment of fewer resources.
The New Products Success Rate
The success rate of new products is another measure of the effectiveness of a new product program. Widely varying estimates of the new product success and failure rates have appeared in the literature and have been carefully tracked down and evaluated by Crawford [10-12]. Just what are the rates today and how have they changed, if at all, over the years?
In 1968 BAH reported 67% of the new products commercialized during the 1963-1968 period were successful, while in 1982 they reported that 65% of the products introduced during the 1976-1981 period were successful. In this study the average success rate, based upon the respondent company's own definition of what constitutes success, was 58% for the 1985-1989 period. When the respondents were asked to specify the success rate when the criteria was profitability to the organization it was only slightly lower at 55%.
These rates are very similar to those found in the recent study of success/failure in Japan and England by Edgett et al. [13] and add to our confidence in the estimates. They found success rates of 59.8% for Japan and 54.3% for England. When taken together these results suggest that the overall success rate of new product introductions has declined to below 60% during the 1980s. Presumably this decline is attributa- ble, at least in part, to intensified foreign and domestic competition during the past ten years.

ESTABLISHING CRUCIAL NEW PRODUCT NORMS J PROD INNOV MANAG 285 1993; 10:273-290
What percent of the corporation's or division's sales come/will come from:
Internally developed new Past 5 Y e a r s / p r o d u c t s introduced during
past/next 5 years ? ~ Next 5 Years
Pr ~edrUCt?acqu 'ere d ~rr°ng ~ ~ __ past/next 5 years? ~ . ~ ~
Products which were part ~ ~ u . • ze of the business at the s t a r t ~ of the 5 year period? " ~ ~ ~ ~ - ~ ~
Figure 4. Sales impact of new products.
The Percent of the New Products Budget Spent On Successful Products
The "hit rate" for new products should be closely associated with the percentage of the new products budget spent on successful projects which is another measure of program performance. In 1968 BAH found only 30% of the new products budget was being spent on successful products. In 1982 this percentage had increased substantially to 54%. Since the new product success rate has declined relative to 1982 we would expect this performance measure to decline from the reported 1982 level also.
The respondents indicated their organizations spent 52.6% of all their new product development expendi- tures on products that were financially successful. In contrast to expectations, this represents about the same level of effectiveness as in 1982.
The Impact o f New Products on Sales and Profits
Another type of program performance measure is the impact of the program on the organization's sales and profits. These measures quantify the force the program has on two important lines of the firm's profit and loss statement and convert the results of its new product activities into business financial performance.
In 1982 BAH reported that new products introduced in the previous five years contributed 23% of that year's profits and that percentage was expected to
increase to 32% for the 1981-1986 period. They made no mention of the impact of new products on sales.
The profit impact of new products did increase after 1982 as the respondents to that study expected. The Best Practices Study respondents indicated that an average of 33.2% of 1990 profits came from internally developed new products introduced during the previ- ous five years. Furthermore, they expected this percentage to increase to 45.6% for new products introduced during the 1990-1994 period. This repre- sents a substantial anticipated increase in the profit impact of new products.
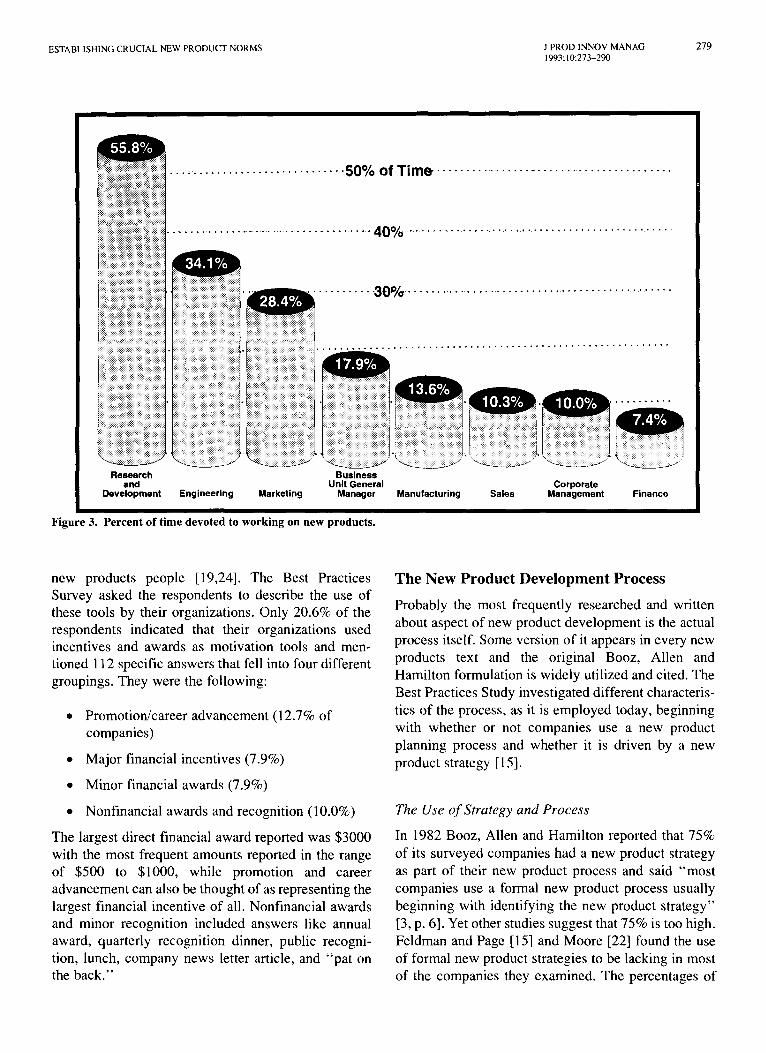
During any time period the growth in a company's sales can be attributed to one of three sources: the introduction of internally developed new products, the acquisition of products from both external sources and from further growth of already-existing products. Figure 4 portrays the composition of the 1990 sales of the responding firms as to their source during the previous five years as well as the respondents' estimates of what these percentages will be in 1995.
The results in Figure 4 show that the impact on 1990 sales from new products introduced during the 1985-1989 period was 32.6% which is a somewhat lesser impact of new products on sales than the 25% from three years reported recently by Mahajan and Wind [21]. The respondents expect the 32.6% sales impact to grow by 6%-38.6% of 1995 sales for new products introduced during the 1990-1994 period. This indicates an expanded contribution of new

286 J PROD INNOV MANAG A.L. PAGE 1993; 10:273-290
products to both sales and profits in the years ahead.
External acquisitions can also be a source of products which are new to the company and contribute to sales growth. Figure 4 illustrates that new product acquisitions during the 1985-1989 period accounted for 8.9% of 1990 sales. In 1995 the respondents expect this percentage to increase by 4.4% to 13.3% of total 1995 sales for products acquired during the 1990-1994 period. Furthermore, these results indicate internal development had more than three times as much impact on sales than did acquisitions during the 1985-1989 period.
These results for the sales and profit impacts of new products indicate that companies anticipate a growing reliance on new products to grow their businesses during the first half of the 1990s. Sales from established products which were part of the business five years earlier represented 58.5% of sales in 1990. That percentage is expected to decline by 10.4% to only 48.1% of total sales by 1995. Therefore, the typical company in the sample expects to have to produce nearly 52% of its anticipated 1995 sales from internally developed new products and/or acquisitions that were not a part of their 1990 portfolio of products.
Conclusion
To the degree the PDMA membership is broadly representative of the practices and performance of the product development community in North America the Best Practices Survey results provide us with a cross-sectional picture of new product development today. The individual findings can serve as norms that CEOs and managers can use to assess their firms' practices as well as performance. They also provide a longitudinal picture of some of the changes that have taken place within the field since 1968 and 1982.
The responses to the survey provided by knowledge- able, senior new products people indicate most areas of practice show changes and improvements since the earlier studies were conducted, and that these are in line with what experts and textbooks would suggest are appropriate practices for new product develop- ment. On the other hand, when just under half still do not have a new product strategy and just under half still do not have a well-defined new product process, there clearly is still room for further improvement in the state of new product practice. These improvements will have to occur if companies are to fulfill their expectations that more of their 1995 sales and profits
will come from recent new products than was the case in 1990.
The new product practices used by the respondents' firm's affect the overall performance of their new product development programs. It is in this area that the results of the study are not as favorable. The results for the five categories of program performance measures show that new product programs have declined in some areas and improved in others. In comparison to the two earlier BAH studies somewhat more ideas are now required to produce a successful new product than in 1982, and the success rate has declined as has the percentage of new product expenditures spent on successful new products. On the other hand, the number of new product introduc- tions has increased as has their impact on profits. The mixed set of performance results suggest, on balance, that overall performance of new product programs may not have improved over the last decade. Rather, the improvements noted in the practices reported by the respondents suggest that they were running harder to stay in place in a more difficult external environ- ment where the pace of new product development was accelerating and markets were becoming more com- petitive during the 1980s. At the same time they were also faced with an internal environment of insufficient resources available for product development. These circumstances are certain to intensify during the 1990s and it seems clear that companies will need to continue to improve their new product practices if they are to be able to bring improvement to their program performance. The results presented here suggest there is still substantial room for improvement in both areas.
The author wishes to acknowledge the helpful suggestions provided by Laurence Feldman, Thomas Hustad, Thomas Kuczmarski, and Lee Meadows. He also expresses thanks to the
JPIM editor and two anonymous referees for their constructive comments on an earlier draft of this article.
References 1. Anthony, M. T. and McKay, J. Balancing the product development
process: Achieving product and cycle-time excellence in high- technology industries. Journal of Product Innovation Management 9:140-147 (June 1992).
2. Barczak, G. and Wilemon, D. Successful new product team leaders. Industrial Marketing Management 21:61-68 (January-February 1992).
3. Booz, Allen and Hamilton, Inc. New Products Management for the 1980's New York, NY: Booz, Allen and Hamilton, 1982.

ESTABLISHING CRUCIAL NEW PRODUCT NORMS J PROD INNOV MANAG 287 1993; 10:273-290
4. Booz, Allen and Hamilton, Inc. Management of New Products Chicago: Booz, Allen and Hamilton, 1968.
5. Brown, R. Managing the "S" curves of innovation. Journal of Business and Industrial Marketing 7(3):42-54 (Summer 1992).
6. Burger, P. C. A report on the development of a research agenda for the Product Development and Management Association. Journal of Product Innovation Management 6:51-60 (March 1989).
7. Cooper, R. G. and Kleinschmidt, E. J. An investigation into the new product process: Steps, deficiencies and impact. Journal of Product Innovation Management 3:71-85 (June 1986).
8. Crawford, C. M. The hidden costs of accelerated product development. Journal of Product Innovation Management 9:188-199 (September 1992).
9. Crawford, C. M. New Products Management. Homewood, IL: Richard D. Irwin, 1991.
10. Crawford, C. M. New product failure rates: A reprise. Research Management 30(4):20-24 (July-August 1987).
11. Crawford, C. M. New product failure rates--facts and fallacies. Research Management 22:9-13 (September 1979).
12. Crawford, C. M. Marketing research and the new product failure rate. Journal of Marketing 41:51-61 (April 1977).
13. Edgett, S., Shipley, D., and Forbes, G. Japanese and British companies compared: Contributing factors to success and failure in NPD. Journal of Product Innovation Management 9:3-11 (March 1992).
14. Feldman, L. P. A profile of the new product professional. Journal of Product Innovation Management 8:252-266 (December 1991 ).
15. Feldman, L. P. and Page, A. L. Principles versus practice in new product planning. Journal of Product Innovation Management 1:43-55 (January 1984).
16. Griffin, A. and Page, A. L. An interim report on measuring product development success and failure. Journal of Product Innovation Management 10:291-308 (September 1993).
17. Johne, F. A. How experienced new product innovators organize. Journal of Product Innovation Management 1:210-223 (December 1984).
18. Johne, F. A. and Snelson, P. Success factors in product innovation: A selective review of the literature. Journal of Product Innovation Management 5: I 14-128 (June 1988).
19. Kuczmarski, T. D. Managing New Products: The Power of Innovation, 2d edition. Englewood Cliffs, NJ: Prentice Hall, 1992.
20. Mabert, V. A., Muth, J. F., and Schmenner, R. W. Collapsing new product development: Six case studies. Journal of Product Innovation Management 9:20(0212 (September 1992).
21. Mahajan, V. and Wind, J. New product models: Practice, shortcomings and desired improvements. Journal of Product Innovation Manage- ment 9:128-139 (June 1992).
22. Moore, W. L. New product development practices of industrial marketers. Journal of Product Innovation Management 4:6-20 (March 1987).
23. Members of the Editorial Board. Significant issues for the future of product innovation. Journal of Product Innovation Management 1:56-66 (January 1984).
24. Miller, C. W. Motivating the troops: The role of compensation in the product development process. Visions 16(2):8-13 (May 1992).
25. Miller, C. Survey: New product failure is top management's fault. Marketing News 27(3): 3 (February 1, 1993).
26. Millson, M. R., Raj, S. P., and Wilemon, D. A survey of major approaches for accelerating new product development. Journal of Product Innovation Management 9:53-69 (March 1992).
27. Peters, T. J. and Waterman, R. H., Jr. In Search of Excellence New York, NY: Harper & Row, 1982.
28. Rosenau, M. D. Jr. Faster new product development. Journal of Product Innovation Management 5:150-153 (June 1988).
29. Rosenau, M. D. Jr. Faster New Product Development. New York, NY: AMACOM, 1990.
30. Smith, P. G. and Reinertsen, D. G. Developing New Products in Hall" the Time. New York, NY: Van Nostrand Reinhold, 1991.
31. Takeuchi, H. and Nonaka, I. The new product development game. Harvard Business Review 137-146 (January-February 1986).
32. Uttal, B. Speeding new ideas to market. Fortune 62-66 (March 2, 1987).
Appendix
Research Design The first issue addressed in designing the study was to decide upon the level at which firms' new product activity would be examined. Most research into new product development focuses on the individual new product or project as the focus of study. For instance, one approach has sought to derive generalizations about new product programs from a comparison of the development of a successful new product with another that was not a success [7]. Alternatively, it can be studied at the more aggregate or macro level of the organization's entire new product program which comprises the structures, processes, activities, and results for all of its individual new products and projects [18].
F i r m a n d p r o g r a m - l e v e l i n f o r m a t i o n a b o u t p r o d u c t
d e v e l o p m e n t p r e s e n t s a be t t e r p i c tu r e o f the o r g a n i z a -
t i o n ' s o v e r a l l n e w p r o d u c t p e r f o r m a n c e t han do
i n d i v i d u a l p r o d u c t o r p ro j ec t l eve l r e su l t s . A f t e r al l , a
c o m p a n y c a n b e p l e a s e d w i t h the s u c c e s s o f a
p a r t i c u l a r n e w p r o d u c t a n d st i l l f i n d the ove ra l l
c o n t r i b u t i o n o f i ts n e w p r o d u c t s p r o g r a m to its
c o r p o r a t e p e r f o r m a n c e to be u n s a t i s f a c t o r y . F o r this
r e a s o n the B e s t P r a c t i c e s S t u d y took this m o r e m a c r o
v i e w a n d f o c u s e d o n the o r g a n i z a t i o n ' s ove ra l l n e w
p r o d u c t p r o g r a m as i ts un i t o f m e a s u r e .
T h i s s t u d y was d e s i g n e d to b e a c r o s s - s e c t i o n a l
s u r v e y o f P D M A ' s p r a c t i t i o n e r m e m b e r s a n d the
c l i en t s o f P D M A ' s c o n s u l t a n t m e m b e r s . T h e s u r v e y
w a s c o n d u c t e d d u r i n g the Fa l l o f 1990. T h e ac tua l
s u r v e y w o r k w a s p e r f o r m e d b y a w e l l - k n o w n r e s e a r c h
f i rm , E l r i c k a n d L a v i d g e , a n d f o l l o w e d e s t a b l i s h e d
s u r v e y r e s e a r c h p rac t i ce . T h e s u r v e y i n s t r u m e n t w a s a
m a i l q u e s t i o n n a i r e c o n t a i n i n g th i r ty q u e s t i o n s that
c o v e r e d the f o l l o w i n g f o u r m a j o r areas :
1. T h e o r g a n i z a t i o n a l s t ruc tu res a n d c o m p e n s a t i o n
p l a n s u s e d for n e w p r o d u c t d e v e l o p m e n t .
2. T h e p r o c e s s u s e d for m a n a g i n g the d e v e l o p m e n t o f
n e w p r o d u c t s .
3. T h e p e r f o r m a n c e o f the c o m p a n i e s " n e w p r o d u c t
p r o g r a m s .
4. D e m o g r a p h i c i n f o r m a t i o n a b o u t the r e s p o n d i n g
c o m p a n i e s .

288 J PROD INNOV MANAG A.L. PAGE 1993; 10:273-290
Principal/Partner Senior/Chief/ 2.7%
Senior/Chief/Head/Lead President/Proprietor/Owner Head/Lead Other ----0% 6.2% / 4.6% 4.7%
/ Principal/Partner Other ~ 0% 2.
This Study ~ Membership Study [14] =
Figure A1. Distribution of job titles in two surveys of PDMA membership. 1These percentages are based on a total of 194 since five respondents mentioned two titles such as "Vice President and Director" and both were coded. 2These percentages are based on a total of 408 rather than the total of 538 shown in Table 4 of [14]. This is because academic and other noncomparable titles were removed from the distribution shown in that table. The distribution used here was provided by Feldman at the request of the author.
A number of the questions used in the questionnaire had been used in the two earlier BAH studies [3,4].
The questionnaire was a self-administered eight- page booklet that was mailed along with a nonperson- alized cover letter, and a prepaid return envelope. One follow-up letter was sent to all the recipients of the survey three weeks after it was mailed. Pretests indicated the questionnaire could be completed in fifteen to twenty minutes.
To help ensure that the respondent was familiar with the full scope of their organization's new product program, the instructions indicated to the recipients " i f you are not a senior person familiar with the scope of the new product development activities and processes within your organization, please pass this question- naire on to such a person and ask her/him to complete and return it." Subsequent anecdotal evidence sug- gests this instruction was complied with frequently.
It was also necessary to provide the respondents with a common definition of the term new product, upon which they were to base their answers since it could have different meanings in different companies. They were told the following:
For the purpose of this study, we will be discussing the
more innovative types of new products and services, such as new applications, new products, and product lines, and new-to-the- world products rather than new products such as repositionings, brand or product line extensions, and product improvements.
Overall, the response rate to the practitioner part of the survey was satisfactory, especially for a survey of business respondents, given the length of the survey booklet, and in light of the request to pass on the questionnaire. The survey was sent to 608 practitioner members. Responses were received from 168 for a rate of 27.6%, about what was predicted from the pretests of the questionnaire.
Questionnaires were also sent to the consultant members of PDMA who were asked to pass the questionnaire on to their clients along with a personal request that the clients fill it out. Each of the 134 consultant members received five copies of the ques- tionnaire. This double pass-on approach was less successful. From these 670 questionnaires, an additional twenty-one were received for a response rate of 3.1%. This increased the final sample to 189. The group of responses from the consultant members' clients was too small to compare with the other 168 for differences in

ESTABLISHING CRUCIAL NEW PRODUCT NORMS J PROD INNOV MANAG 289 1993;10:273-290
~ P l a n n i n g Managementl ~ 3 6 1 ~ % ..~'~::[~ Non-r~i/~p ~ ' 7 onse
Figure A2. The respondents' primary functional area.
the respondents and their responses. Dropping them out of the analysis does not meaningfully change the results or conclusions so they were included as part of the final sample.
S a m p l e Val idat ion
The value of the results of the Best Practices Study to PDMA members and to the new products profession will depend upon the degree to which they are representative of the membership and the greater new products community. The degree to which the sample is representative of the PDMA membership was estimated by comparing the distribution of the respon- dents' titles with those found in the results from PDMA's recently published Membership Survey [14].
Each respondent's title was coded separately as to its "level" and "function" following the procedure used by Feldman where "Director" denotes level, and "Director, New Products" denotes level and function' [ 14, p. 257]. Figure A 1 compares the distribution of the level of titles from the Best Practices Survey with those from the Membership Survey which was conducted a few months earlier, in April 1990, and which had a higher 64% overall response rate from the PDMA membership.
From Figure A1 it can be seen that the two distributions are generally similar to one another, although the Best Practices sample is somewhat underrepresented in the higher-level proprietor/presi- dent/owner and principal/partner categories. This indicates the Best Practices sample of respondents is quite similar to the much larger sample, which, in turn, is likely to be representative of the PDMA membership because of its high response rate.
Figure A1 shows over 90% of the respondents were at the level of Manager/Assistant Manager or higher,
whereas over 50% were at the level of Director or higher. This distribution of respondents' ranks indi- cates they should be knowledgeable about the new product work at the program level within their respective organizations, and adds to our confidence about the quality of the data they provided in the
survey. The function part of each respondent's title pro-
duced over forty specific function designations which were subsequently grouped together into sixteen broader groups plus an "other" category. The separate functional designations were judgmentally placed into these groups because they were felt to represent essentially the same functional activity. For example, product development and new product development were grouped together as were planning, corporate planning, and strategic planning. It was then observed that these sixteen groups could be, in turn, structured into the four primary functional areas of marketing, technology, management, and planning.
Table A1. The Functional Areas of the Respondents
Groups of Functions Percent
Technical Engineering 7.4 Research 2.1 Research & Development 6.3 Scientist 0.5 Technology 4.2 Project(s)/special project(s) 2.1 Total 22.6
Marketing Business development/new business development 10.1 Commercial development/market development 0.5 Marketing 9.5 Marketing research/information 5.3 Total 25.4
Management Product line management 1.1 Product management/new product management 13.8 Product planning/new product planning 1.6 Product development/new product development 17.5 Program management 2.1 Total 36.1
Planning Planning/corporate planning/strategic planning 3.7
Other 11.1
Nonresponse 1.1
Total 100.0

290 J PROD INNOV MANAG A.L. PAGE 1993; 10:273-290
Figure A2 shows the distribution of the 189 PDMA member respondents across the four primary functions. The distribution is relatively even across marketing (25.4%), technical (22.6%), and management (36.1%), with only a small portion of the respondents coming from the planning function (3.7%).
Table A1 shows the sixteen groups of functions and how they relate to the four primary functions. It also illustrates the very wide variety of functional areas that the respondents gave as their functional homes within their organizations. This breadth of functional titles also shows strong similarities with those reported in the Membership Survey [14, Table 7] and provides further support for the generalizability of the Best Practices results to the population of PDMA practitio- ner members. It is also evidence of the strong interdisciplinary nature of the new product develop-
ment profession today. Whether or not the Best Practices study results are
representative of the broader universe of firms doing new product work in North America today depends in turn on how representative PDMA's membership is of that broader new products community. The best evidence on the representativeness of PDMA's membership also comes from the Membership Sur- vey. Those results indicate that it is broadly, if not precisely, representative of the scope and variety of industry groups and the major markets served in North America [14, Figure 1 and Table 3]. Therefore, we conclude the Best Practices Study results should be broadly generalizable to the new products commu- nity in North America and indicative of their recent new product organizations, processes, and perform- ance.