Embed Size (px)
Citation preview

Assessing new technologies and techniques that could
improve the cost-effectiveness and robustness of recreational
fishing surveys Proceedings of the national workshop,
Adelaide, South Australia, 10-12 July 2018
C. Beckmann, S. Tracey, J. Murphy, A. Moore, B. Cleary and M. Steer
March 2019
FRDC Project No 2017-198

ii
© Year Fisheries Research and Development Corporation and South Australian Research and Development Institute. All rights reserved. ISBN: 978-1-876007-13-3
Assessing new technologies and techniques that could improve the cost-effectiveness and robustness of recreational fishing surveys. Proceedings of the national workshop, Adelaide, South Australia, 10-12 July 2018.
2017-198
2019
Ownership of Intellectual property rights
Unless otherwise noted, copyright (and any other intellectual property rights, if any) in this publication is owned by the Fisheries Research and Development Corporation and the South Australian Research and Development Institute. This work is copyright. Apart from any use as permitted under the Copyright Act 1968 (Cth), no part may be reproduced by any process, electronic or otherwise, without the specific written permission of the copyright owner. Neither may information be stored electronically in any form whatsoever without such permission.
This publication (and any information sourced from it) should be attributed to: Beckmann, C., Tracey, S., Murphy, J., Moore, A., Cleary, B. and Steer, M. South Australian Research and Development Institute (Aquatic Sciences) 2019, Assessing new technologies and techniques that could improve the cost-effectiveness and robustness of recreational fishing surveys. Proceedings of the national workshop, Adelaide, South Australia, 10-12 July 2018. Adelaide, March.
Creative Commons licence
All material in this publication is licensed under a Creative Commons Attribution 3.0 Australia Licence, save for content supplied by third parties, logos and the Commonwealth Coat of Arms.
Creative Commons Attribution 3.0 Australia Licence is a standard form licence agreement that allows you to copy, distribute, transmit and adapt this publication provided you attribute the work. A summary of the licence terms is available from creativecommons.org/licenses/by/3.0/au/deed.en. The full licence terms are available from creativecommons.org/licenses/by/3.0/au/legalcode.
Inquiries regarding the licence and any use of this document should be sent to: [email protected]
Disclaimer
The authors warrant that they have taken all reasonable care in producing this report. The report has been through the SARDI internal review process, and has been formally approved for release by the Research Director, Aquatic Sciences. Although all reasonable efforts have been made to ensure quality, SARDI does not warrant that the information in this report is free from errors or omissions. SARDI does not accept any liability for the contents of this report or for any consequences arising from its use or any reliance placed upon it. Material presented in these Administrative Reports may later be published in formal peer-reviewed scientific literature. The information, opinions and advice contained in this document may not relate, or be relevant, to a readers’ particular circumstances. Opinions expressed by the authors are the individual opinions expressed by those persons and are not necessarily those of the publisher, research provider or the FRDC. The Fisheries Research and Development Corporation plans, invests in and manages fisheries research and development throughout Australia. It is a statutory authority within the portfolio of the federal Minister for Agriculture, Fisheries and Forestry, jointly funded by the Australian Government and the fishing industry.
Researcher Contact Details FRDC Contact Details
Name:
Address:
Phone:
Fax:
Email:
Mike Steer
SARDI Aquatic Sciences
PO BOX 120 Henley Beach SA 5022
08 8429 0342
Address:
Phone:
Fax:
Email: Web:
25 Geils Court
Deakin ACT 2600
02 6285 0400
02 6285 0499
www.frdc.com.au
In submitting this report, the researcher has agreed to FRDC publishing this material in its edited form.

iii
Contents
Acknowledgments .................................................................................................................................. v
Abbreviations ........................................................................................................................................ vi
Executive Summary ............................................................................................................................ vii
1. Introduction .............................................................................................................................. 1
2. Objectives .................................................................................................................................. 2
3. Method ....................................................................................................................................... 3
3.1 Presentations ................................................................................................................................3
4. Results ....................................................................................................................................... 4
4.1 Survey Objectives .....................................................................................................................4
4.2 Off-site Recreational Fishing Surveys ......................................................................................4
4.3 On-site recreational fishing surveys .......................................................................................10
5. Discussion ................................................................................................................................ 13
5.1 The future of large-scale off-site recreational fishing surveys ...............................................13
5.2 Improving accuracy and precision of information through on-site surveys ...........................14
5.3 Engaging the recreational fishing community ........................................................................14
6. Conclusion ............................................................................................................................... 16
7. Implications ............................................................................................................................. 17
8. Recommendations .................................................................................................................. 18
8.1 Recommended approach ............................................................................................................18
8.2 Further development ..................................................................................................................18
9. Extension and Adoption ......................................................................................................... 20
References ............................................................................................................................................ 21
Appendices ........................................................................................................................................... 25

iv
Figures
Figure 1: Summary of the seven key steps in designing a recreational fishing survey ................................. 5

v
Acknowledgments
The editors would like to thank everybody who attended the workshop for their valuable input in discussing
the current and future technologies and techniques that could improve the cost-effectiveness and robustness
of recreational fishing surveys. A special thank you to all those who presented for sharing their expertise in
the area of survey design, emerging technologies, engagement strategies and options for the national social
and economic survey. We are grateful to Dr Sean Tracey for facilitating the workshop discussions. Thank
you to Steve Taylor and Karina Ryan for their valuable contribution to the report. This project was funded
by the Fisheries Research and Development Corporation.

vi
Abbreviations
ABARES Australian Bureau of Agricultural and Resource Economics and Sciences
ACMA Australian Communications and Media Authority
ANPR Automatic Number Plate Recognition
ARFF Australian Recreational Fishing Foundation
CATI Computer Assisted Telephone Interview
CRAGS CSIRO's ruggedised autonomous gigapixel camera system
CSIRO Commonwealth Scientific and Industrial Research Organisation
DAF Department of Agriculture and Fisheries
DPIRD Department of Primary Industries and Regional Development's
FRDC Fisheries Research and Development Corporation
G-NAF Geocoded National Address File
GPS Global Positioning System
IGFA International Game Fish Association
IMAS Institute for Marine and Antarctic Studies
IPND Integrated Public Number Database
NIWA National Institute of Water and Atmospheric Research
PIRSA Primary Industries and Regions South Australia
RDD Random Digit Dialling
SARDI South Australian Research and Development Institute
SAPS Supplemented Access Point Surveys
VMS Vehicle Monitoring System

vii
Executive Summary
Currently, the most significant gap in our knowledge in assessing the status of community-shared fisheries
is determining the relative contribution by the recreational sector. To explore this issue, a two-day national
workshop was held from 10-12 July 2018 at the South Australian Research and Development Institute
(SARDI). The key focus was advancing the ‘best practice’ approach in design, execution, and analysis of
recreational fishing surveys as described in Georgeson et al. (2015; FRDC 2007-014). This project also
builds on recent work by Griffiths et al. (2014; FRDC 2011-036) and Moore et al. (2015; FRDC 2012-
022.20). The overarching aim of this workshop was to assess the usefulness of new technologies and
techniques for enhancing the cost-effectiveness and reliability of recreational fishing surveys. The attendees
included recreational fisheries scientists, managers, a national peak body representative, an international
expert, representatives from Deckhand© and a Fisheries Research and Development Corporation (FRDC)
representative.
The specific objectives of the workshop were to:
1. explore options to improve the precision and cost-effectiveness of recreational fishing surveys;
2. assess whether emerging technologies can be feasibly integrated into future surveys; and
3. identify strategies that positively engage the recreational sector in fisheries science and management.
Recently, changes to the availability of traditional phone and address listings and rapid transformations in
the way people communicate, have led to a need to re-evaluate how recreational fishing is assessed. The
telephone directory (e.g. White Pages©) has traditionally been the primary sampling frame for large-scale
recreational fishing surveys; however, it has become less representative of the overall population. The
workshop identified that the most cost-effective option for future large-scale surveys is to gain access to a
national register of recreational fishers (without exemptions). This would allow probabilistic sampling of
the target population, improved precision of catch and effort estimates and alleviate the reliance on broad-
scale population sampling. Where a complete registry is not available, other general population databases,
such as; the Geocoded National Address File (G-NAF), the Integrated Public Number Database (IPND),
boat registration databases, commercial databases, and online panels may provide alternative sampling
frames, or a multi-frame design using combinations of these may be employed.
It was recognised that face-to-face screening is an effective method to reduce non-response bias and soft
refusals. However, face-to-face sampling can be prohibitively expensive due to the time and effort required
to adequate sample recreational fishers, which typically comprise a small component (<20%) of the general
population. Face-to-face sampling methods are more likely to be effective if they target small geographic
areas (e.g. boat ramps, marinas, popular shore-based fishing locations). Where face-to-face screening is not
practical, phone screening is likely to be the preferred method.
At the data collection phase of surveys, phone-surveys provide a cost-effective method to survey a large
number of fishers over broad spatial and temporal scales. Future surveys may utilise smartphone
applications and/or the internet as a more cost-efficient and modern alternative to data collection. It is
important to note, however, that web-based and smartphone technologies are more likely to complement
probabilistic based survey designs rather than replace them, by offering another platform to obtain extra
information about recreational fishing activities and an avenue to increase sectorial engagement.
Wash-up attitudinal surveys, undertaken following the completion of the large-scale survey, remain an
important tool to assess awareness of regulatory and educational information, gauge the sector’s attitudes
towards fisheries management, determine the social values of recreational fisheries, and to collect additional
economic information that may relate to expenditure or contingency evaluation. These surveys also have
considerable flexibility to gain information at a regional level, where questions can be formulated around
specific jurisdictional issues such as biosecurity (i.e. White Spot Disease in Queensland’s prawn fisheries,
or Pacific Oyster Mortality Syndrome in southern Australia). Consumptive orientation, socio-demography,
viii
social licence and choice modelling surveys are also likely to be relevant for future national and or State
wide surveys.
On-site surveys should continue to complement large-scale off-site methods by providing an important
avenue to collect necessary biological information (e.g. fish length and weight data). This level of biological
information is important as it is relied upon to convert fish numbers to weight, and subsequently the
estimated total harvest of the recreational fishing sector. In situations where the objective of the survey is to
quantify a specific regional component of the recreational fishing community such as the reopening of a
spatial closure, an on-site survey may be sufficient and preclude the need to undertake a larger off-site
investigation. Workshop participants agreed that the accuracy and precision of data obtained from large-
scale offsite surveys could be improved with complementary and innovative technologies. On-site
surveillance techniques such as static boat ramp cameras, aerial surveys, thermal imaging, automated traffic
counting systems, Automatic Number Plate Recognition (ANPR) software, and targeted drone surveys may
be particularly useful for developing proxies of fishing effort in between off-site surveys.
Recreational fishing surveys provide key information used to inform fisheries management. In some
jurisdictions (e.g. South Australia), recreational catch estimates are used to determine shares against pre-
described allocations that underpin resource management. Improving the accuracy and precision of these
estimates was a key focus of this workshop. However, the currently available sampling frames and survey
methods mean that it is generally cost-prohibitive to increase the amount of sampling coverage to reduce
bias and increase precision for many species. This is particularly relevant for niche species that are rarely
caught (i.e. Southern Bluefin Tuna in southern Australia), and consequently their estimated catches are often
bounded by large error variances. Such imprecise estimates for these species can erode stakeholder
confidence in the science and undermine the integrity of the entire survey. Educating stakeholders about
how recreational fishing surveys are undertaken, why only a small proportion of the population is surveyed,
and how the numbers are scaled up regionally to provide an estimate of total catch (and effort), is
fundamental in rebuilding their trust in the process. However, this remains a significant challenge. Modern
and rapidly advancing communication platforms may provide an appropriate avenue to bridge the
‘education’ gap. Social media platforms, smartphone applications or internet chat forums have quickly
infiltrated the population as a reliable means for mainstream communication, and currently provide a vehicle
to engage the recreational fishing community in fisheries related issues.
Keywords
Recreational fishing, survey, phone-diary, online-panel, creel, smart-phone, technology, engagement.

1
1. Introduction
Assessing and managing community-shared fisheries resources among various user groups and stakeholders
is challenging particularly where knowledge gaps exist surrounding the relative contribution by the recreational
sector. To enable effective and sustainable management of these shared resources, fisheries scientists need to
account for the combined total harvest of individual species across the different sectors. Most commercial
fishers are obligated to report their catch and fishing activity as part of their licence conditions and
consequently their impact can be assessed and regulated, whereas fishing activity amongst the recreational
sector is largely unknown and can be difficult to assess. Recreational fishers are unlikely to report their catch
at the same level of detail or frequency as the commercial sector, so in order to obtain an estimate of their total
catch, a representative sample of the population needs to be surveyed periodically. The key focus of this
workshop was advancing the ‘best practice’ approach in design, execution, and analysis of recreational fishing
surveys as described in Georgeson et al. (2015). The overarching aim of this workshop was to assess the
usefulness of new technologies and techniques for enhancing the cost-effectiveness and reliability of
recreational fishing surveys.
In Australia, the most commonly used method for estimating the total catch from the recreational sector is
through phone-diary interviews and associated on-site creel surveys (Georgeson et al. 2015). Phone-diary
surveys typically involve randomly sampling the general population, screening and interviewing a sub-set of
the sampled population, recruiting intending fishers to participate in a telephone-diary survey, regularly
assessing their fishing activities over a defined time period, and scaling-up the data to obtain a population
estimate. These off-site surveys are often complemented with on-site investigations that aim to intercept
anglers at boat ramps, jetties, marinas and prominent shore-based fishing locations (e.g. breakwaters) to obtain
useful information about their catch and fishing experiences.
While these types of recreational fishing surveys are considered to adopt ‘world’s best practice’, they typically
rely on sampling the general population, which recreational fishers often account for a small proportion. For
jurisdictions that require recreational fishers to have a licence, or register prior to undertaking any fishing
activity, their sampling frame becomes refined to a more representative population that can be surveyed more
cost-effectively. When sampling a subset of the population, the sample selection can be either random
(probabilistic sampling) or non-random (non-probabilistic sampling). Random sampling is preferred as the
precision of the estimates can be assessed by calculating associated confidence intervals or margins of error
(Georgeson et al. 2015). However, as recreational fishers represent a small proportion of the population (~20%)
and a small proportion of recreational fishers catch the majority of fish, catch estimates are usually bounded
by large confidence intervals (Henry and Lyle 2003). Levels of error can be reduced by increasing the sample
size; however, for species caught infrequently, or from niche recreational fisheries, it can be difficult to achieve
precise estimates using large-scale survey designs. The dynamic nature of the recreational fishing sector, both
within and between jurisdictions, means that there is unlikely to be a single survey design that can provide
accurate and precise estimates of recreational catch and effort for all species.
Changes in the availability of traditional sampling frames and rapid transformations in telecommunication
have increased the need to re-evaluate the way recreational fishing is assessed. For example, large-scale
population surveys have traditionally relied on the telephone directory (e.g. White Pages©) as a representative
sampling frame, however, it is becoming less representative as the population continues to shift away from
landline telecommunications to become increasingly reliant on unlisted mobile devices (Griffiths et al. 2017).
As such, there is a need to investigate alternative sampling frames and associated methodologies to ensure that
survey designs continue to provide the highest quality information in the most cost-effective way. This includes
assessment of available sampling frames, suitable screening surveys, data collection platforms, validation
methods and follow-up attitudinal (‘wash-up’) surveys. As recreational fishing surveys are generally
conducted periodically (e.g. every 5 years in South Australia, SA), they are limited in their ability to capture
the highly dynamic nature of the recreational fishing sector. Therefore, there is also a need to identify
appropriate proxies for estimating catch between surveys. This may include the use of emerging technologies
(e.g. static cameras, drones and thermal imaging), data processing systems (e.g. machine learning and image
recognition software) and data collection platforms (e.g. smart phone applications). Increasing the frequency
of catch and/or effort estimates is an important step in improving the accuracy and precision of data. The result
would likely be increased stakeholder confidence in recreational survey estimates, which support management
decisions and assessments.

2
2. Objectives
The objectives of the National Recreational Fishing Workshop were to:
1. Identify options to improve the precision and cost-effectiveness of recreational fishing surveys.
2. Identify strategies that positively engage the recreational sector in fisheries science and management.
3. Assess whether emerging technologies can be feasibly integrated into future surveys.

3
3. Method
The South Australian Research and Development Institute (SARDI) hosted a technical workshop from 10–12
July 2018 at the South Australian Aquatic Sciences Centre, West Beach. The workshop was combined with a
workshop for another national project ‘Determining the design, output specifications and sample size for a
national social and economic survey of recreational fishers in Australia’ (FRDC 2016-126). Participants at the
workshop included recreational fisheries scientists, managers, a national recreational peak body representative
and an international expert in recreational fishing surveys from New Zealand. The New Zealand representative
provided valuable case studies and insights into optimising survey designs. A list of attendees is available in
Appendix 2 and the workshop agenda is available in Appendix 3. The workshop, which was chaired by Dr
Sean Tracey (IMAS), was broken into several sessions to align with the workshop objectives; (i) improve the
precision and cost-effectiveness of surveys, (ii) emerging technologies and engagement strategies, and (iii)
national social and economic survey of recreational fishers. During these sessions, 11 presentations were given
(six of which were provided by attendees and have been presented in Appendices 4-9), followed by a discussion
session.
This report provides a synthesis of the standard methods currently used, as well as considering new and
emerging methods for conducting off-site surveys (i.e. sampling frames, screening survey methods, data
collection methods and wash-up attitudinal surveys) and on-site surveys (i.e. access point, roving,
complementary). The intention of this report is to provide a suite of options for researchers conducting future
large-scale off-site surveys and to assess emerging technologies to improve the accuracy and precision of on-
site surveys.
3.1 Presentations
1. “Don’t throw the baby out with the bath water” presented by Dr Jeremy Lyle- IMAS, Tasmania (Appendix
4).
2. “Applying innovation to off-site survey designs and statistical methods” presented by Dr Karina Ryan-
DPIRD, Western Australia (Appendix 5).
3. “Use of internet surveys” presented by Mr Andy Moore- ABARES, Canberra (Appendix 6).
4. “Surveys in a changing social landscape: Addressing the challenges of achieving representative population
samples” presented by Dr Jacki Schirmer- University of Canberra.
5. “What role can digital camera monitoring of boat retrievals play in informing fisheries management”
presented by Mr Bruce Hartill- NIWA, New Zealand (Appendix 7).
6. “Integrating remote camera data and aerial surveys into the monitoring of two WA recreational fisheries”
presented by Dr Stephen Taylor- DPIRD, Western Australia (Appendix 8).
7. “High resolution camera works (CRAGS)” presented by Dr Tim Lynch- CSIRO, Tasmania.
8. “Can ‘Deckhand’ transition from the commercial to the recreational sector” presented by Mr Simon Dick-
Deckhand, South Australia.
9. “Improved data on Aboriginal and Torres Strait Islanders fisheries resource use to better inform
community planning and agency decision-making” presented by Mr Shane Holland- PIRSA, South
Australia.
10. “Expectations of the recreational sector” presented by Mr Brett Cleary- ARFF, Tasmania.
11. “A national social and economic survey: options” presented by Mr Andy Moore- ABARES, Canberra
(Appendix 9).

4
4. Results
4.1 Survey Objectives
On-going data collection is important to measure the relative impact of fishing mortality to allow for
sustainable resource management. Therefore, the primary objective of many large-scale surveys is to quantify
catch and effort for a range of species. While catch and effort information is typically available through
mandatory reporting in commercial fisheries, it is challenging to collect equivalent data from recreational
fisheries (Georgeson et al. 2015). The size and complexity of survey methodology varies depending on the
scale and objectives of the study (Pollock et al. 1994). Most commonly, off-site survey methods are used for
these large-scale surveys. Off-site surveys are also suited to social and economic objectives including
participation, demographic profiling, expenditure, and attitudes and awareness related to fisheries management
issues. While on-site surveys can collect similar information, they are often targeted at estimating catch or
effort related to specific activities (e.g. shore-based or boat-based), areas/water bodies or species of interest.
Such studies frequently examine spatial and temporal trends in catch and effort and can be complementary to
large-scale off-site surveys. Achieving these objectives, often results in a trade-off between the accuracy and
precision required and the cost of an appropriate method (Georgeson et al. 2015).
4.2 Off-site Recreational Fishing Surveys
Off-site methodologies are often utilised for large-scale surveys where the target population is widely dispersed
and on-site sampling is unlikely to be cost-effective. The most commonly used off-site methods include
telephone, mail, internet or modern surveillance surveys. Following the identification of the objectives and
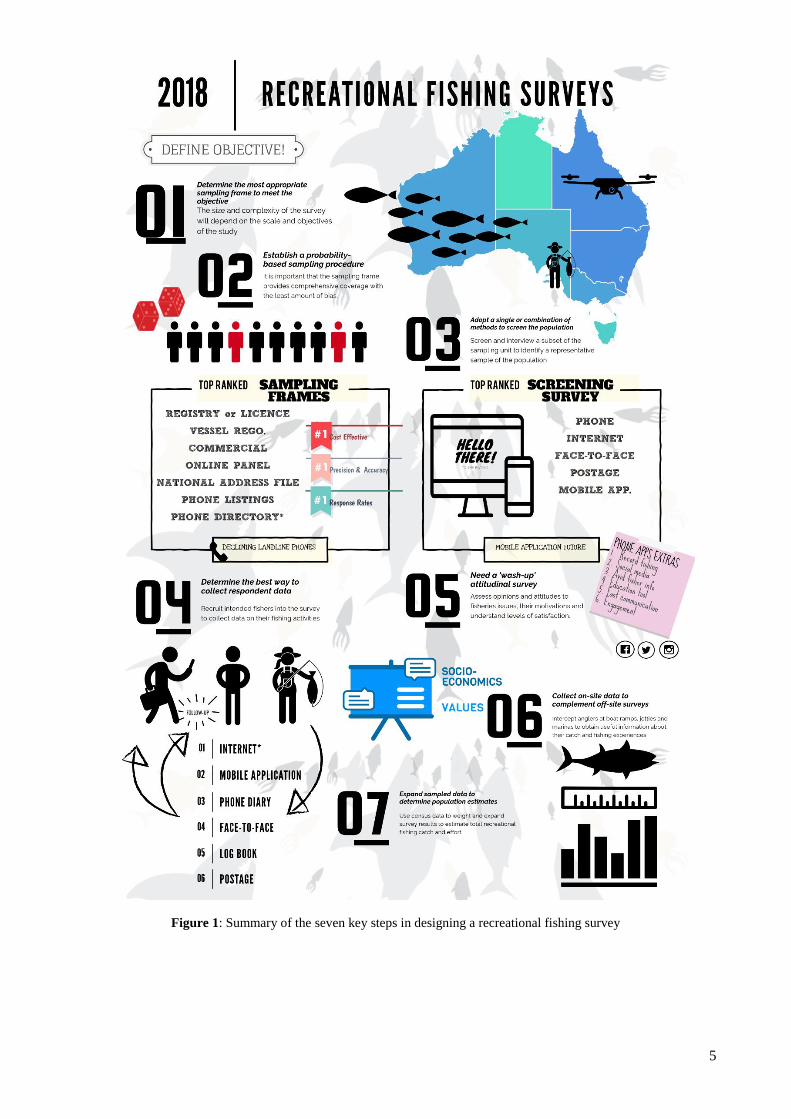
scope of the survey, six key steps were identified as the preferred approach to undertaking an off-site
recreational fishing survey: (1) select a representative population sampling frame under either a single or multi-
frame design; (2) establish a probability-based sampling procedure; (3) contact the selected sampling units to
conduct a screening survey and recruit eligible participants to the data collection phase; (4) collect off-site data
from the selected sample using the most appropriate survey method; (5) conduct ‘wash-up’ attitudinal surveys;
(6) complement off-site surveys with on-site surveys to obtain additional information about catch and fishing
experiences; and (7) assess sample representation to provide weightings for expanded population estimates
(Figure 1).
5
Figure 1: Summary of the seven key steps in designing a recreational fishing survey
6
4.2.1 Sampling frames
To access the target population, sampling frames of addresses, phone numbers or geographical areas need to
be identified. Sampling frames are a list of sampling units from which samples are selected. For each frame,
the primary sampling unit (e.g. household, person, fishing location, etc.) also needs to be determined. Sampling
the entire population (census) is problematic as some individuals will be hard to locate, the population is always
changing and it is unlikely to be cost-effective. To overcome this, methodologies have been developed to select
a segment of the population and apply appropriate weightings to expand results to population estimates.
Therefore, it is important that the chosen sampling frame will provide comprehensive coverage with the least
amount of bias to avoid high levels of variation or error.
The level of bias for each sampling frame will vary depending on the sampling methodology. The quota
sampling method (non-probability) pre-defines groups (e.g. demographics) using existing information and
involves selecting a specified number of cases (quota) from each group. This is a lower cost method compared
to probability sampling, but can result in biased estimates due to discrepancies in fisher contact availability
(Griffiths et al. 2010). Probability sampling involves randomly drawing samples from list frames or area
frames, whereby all samples or sampling units have a known probability of being drawn and confidence
intervals can be calculated (Pollock et al. 1994). Cluster sampling is commonly used for recreational fishing
surveys, particularly where there is no frame listing (Schaeffer et al. 1996).
General population sampling
Population databases provide a broad and representative sample of the population. The general population has
traditionally been sampled using address-based sampling frames (ICES 2010; Armstrong et al. 2013) or phone
numbers as a proxy for private dwelling listings (Henry and Lyle 2003; Lyle et al. 2002; Coleman 2003; Jones
2009; Giri and Hall 2015). Phone numbers are commonly sourced from a telephone directory (e.g. the White
Pages ©). In recent Australian examples, large-scale recreational fishing surveys have relied on physical
random sampling of public telephone directories, as it is currently illegal to use digital listings (Georgeson et
al. 2015). Future surveys could explore the use of the Geocoded National Address File (G-NAF), a database
of all 14.1 million Australian addresses compiled by the Public Sector Mapping Agencies (Public Sector
Mapping Agencies, 2013). This database includes address data and coordinate references (or geocode) for
street addresses in Australia. The Australian Communications and Media Authority (ACMA) manage an
equivalent database for phone-listings in the Integrated Public Number Database (IPND). This includes all
domestic and mobile phone numbers (over 80 million) in Australia (Georgeson et al. 2015).
The advantage of general population sampling frames is the potential to conduct probabilistic sampling over
any defined geographic area. The key challenge is obtaining access to a complete and accurate database. Until
recently, telephone directories were a relatively cost-effective way to achieve good coverage of the general
population. However, the rise in unlisted numbers and mobile phone usage has reduced the overall coverage
of traditional telephone directories, raising concerns around coverage bias particularly in relation to some
socio-demographic groups (i.e. under- or over-coverage of particular groups). As the White Pages© contains
only 81% of all residential households in Australia and the electronic version is no longer available, it is
unlikely to be the most effective sampling frame for future surveys (Ryan et al. 2013, Georgeson et al. 2015).
The IPND provides a more complete database, although this can only be accessed through Commonwealth
Government Research, unlisted numbers cannot be contacted, and random sampling of listed domestic
numbers within each postcode is not possible (Georgeson et al. 2015). Of these general population-sampling
frames, the G-NAF appears to provide the most tractable option for random sampling geocoded to the dwelling
level.
4.2.2 Screening surveys
Screening surveys involve interviewing a representative subset of the sampling units, which can be stratified
and weighted based on a number of criteria, e.g. residential statistical division. This allows the identification
and recruitment of subjects who participate in recreational fishing to take part in a follow-up diary survey.
Screening surveys can also be used to collect demographic information (e.g. age, gender, ethnicity, previous
and future levels of participation in recreational fishing, association memberships, recreational fishing licence
status, and socio-economic information (Henry and Lyle 2003).
7
Phone
Phone-based screening surveys involve either using random digit dialling (RDD) or contacting directory-listed
phone numbers, usually using a stratified random sampling approach. Historically, geographical regions could
be targeted based on landline prefix or address data listed in the phone directory. Phone surveys are preferable
to written surveys as it reduces issues associated with illiteracy, vision impediments, and respondent burden.
In Australia, response rates have typically been high (75% to 85%) for phone-based surveys, however, non-
response (non-contact or refusal) rates are increasing (Georgeson et al. 2015).
Face-to-face
The face-to-face (or door-to-door) method of screening is likely to be the most effective method to reduce non-
response bias and soft refusals. This is because the ease of response is attractive to respondents that have
difficulty in answering mail, or telephone surveys, due to lack of time/interest, poor literacy levels, disability
or infirmity. However, face-to-face surveys can be cost prohibitive due to the labour and training required to
undertake them. Consequently, this method is often limited to a small geographic area and may be appropriate
for some targeted studies.
Postage/mail
Generally, mail surveys are used to make initial contact and follow-up surveys can be undertaken using
alternative data collection methods. The advantage of using mail surveys is that a cover letter can be included
to provide additional information on the study. The level of non-response bias is likely to be higher for mail
survey methods compared to phone or face-face surveys, as response rates are generally much lower due to
respondent burden.
4.2.3 Collection of respondent catch and effort data
Following the screening survey, intending recreational fishers are identified and recruited into the data
collection phase (catch and effort) of the recreational fishing survey. This generally involves a longitudinal
panel survey, which collect repeated observations of the same variables over a defined period. This survey
consists of a carefully designed sequence of questions that are developed in-line with the survey objectives.
The data collected usually includes catch and effort information such as species targeted, species caught,
number of fish landed by species, fishing location, water body type and catch and release details.
Face-to-face
The face-to-face (or door-to-door) method typically involves trained personnel conducting regular interviews
over a pre-determined period. While this method is likely to be expensive, it provides a high level of
engagement resulting in more precise data and limited bias (Pollock et al. 1994). Due to the high cost of face-
to-face surveys, the key application is likely to be as a benchmark to corroborate results obtained through other
methods.
Postage/mail
Mail surveys are a type of self-reporting diary or logbook, which participants return at the end of a pre-
determined survey period. While this method is likely to be cost-effective, without telephone or face-to-face
contact, workshop participants generally agreed that the level of engagement can be low, resulting in sub-
optimal response rates, infrequent reporting and reduced data quality.
Phone diary
A combination of phone and respondent diaries are the most common method used in Australia to conduct
large-scale recreational fishing surveys. Diaries, logbooks or ‘memory joggers’, can be used to assist in data
collection by encouraging participants to record key information for all their fishing activity. Respondents are
contacted periodically to retrieve data and anglers who are more avid are contacted more frequently to reduce
recall bias. The phone-diary method is a cost-effective way to survey a large number of fishers over extensive
spatial and temporal scales (Griffiths et al. 2010; Georgeson et al. 2015). Computer Assisted Telephone
Interview (CATI) systems, where interviewers follow a script provided by a software application, could

8
provide a more efficient data collection platform, but connection delays can lead to high refusal or hang-up
rates. Response rates for this method are generally higher than mail surveys but lower than on-site creel surveys
(Griffiths et al. 2010; Georgeson et al. 2015). Where diaries are used, surveys have a higher level of response
burden but the accuracy and precision of data are likely to be increased. In New Zealand, the respondent burden
is lower as there is no requirement to complete a diary, and phone contact is more regular (Heinemann et al.
2015). Similarly, in Tasmania, diarists are regularly contacted with the frequency of contact tailored to the
needs and behaviour of the individual respondent (Lyle and Morton 2004). These examples highlight the
importance of trained interviewers to ensure quality and completeness of surveys.
4.2.4 Wash-up attitudinal surveys
Wash-up attitudinal (post-enumeration) surveys are often conducted at the end of the diary survey to assess
awareness and attitude, and detect differences among respondents. Wash-up surveys can verify recreational
fishing behaviour (i.e. fished or not), collect additional expenditure data, collect profiling information (such as
boat ownership details, use of technologies), and assess opinions and attitudes to fisheries issues (Georgeson
et al. 2015). In particular, it is important for fisheries management agencies to understand levels of satisfaction,
motivating factors and influences on fishing activities. Generally, jurisdictions also conduct a separate survey
for a sub-sample of non-intending fishers who were not included in the main survey, allowing the identification
of any unexpected fishing to correct for participation rates when data are expanded to the population level
(Georgeson et al. 2015).
The questions included in wash-up surveys are likely to be largely jurisdiction-specific and will depend on the
overall objectives of the survey. Often stakeholder consultation is required to formulate the specific questions
and the right balance of questions is established to ensure the level of respondent burden is not too high. Socio-
demographic profiling is likely to be relevant across all jurisdictions as different values, beliefs, behaviours
and preferences may influence the population through time. The key advantage of collecting socio-
demographic data is disaggregating survey results by demographic groups and linking wash-up results to
identifiers in the main survey. Questions about fisher motivations are also likely to be relevant across all
jurisdictions as they provide insight into what recreational fishers expect of their fishing experience and can
vary significantly. This can include factors associated with satisfaction such as their consumptive orientation,
or the degree to which fishers value the catch-related aspects of the fishing experience. A successful fishing
experience may also be linked to attitudes around fisheries management and policy. Depending on the survey
objectives, wash-up surveys can provide an opportunity to gauge opinion on representation and
communication, and to determine which strategies are successful in engaging the recreational fishing
community. Questions concerning the community perceptions of fishing (social licence), may also be
important in reflecting the opinions and expectations of the broader community. These questions may be more
relevant at the Commonwealth level. Finally, wash-up surveys can provide an opportunity to investigate topical
jurisdictional issues such as determining the awareness of biosecurity threats, changes in fisheries
management, or community-based initiatives.
Wash-up attitudinal surveys may also provide an opportunity to incorporate questions using a choice modelling
approach. Choice modelling involves posing a series of questions about preferences and the outputs can be
used to estimate ‘use’ and ‘non-use’ values of recreational fishing (Georgeson et al. 2015). While use values
are associated with the direct use of the resource, non-use values are those that people derive from the existence
of a species or ecosystem even if they do not use it. The advantage of choice modelling is that it provides a
more structured approach to predict behaviour and estimate economic value compared to expenditure based
questions. Nevertheless, choice modelling would increase the level of respondent burden, hence would be most
appropriate as a separate survey to the standard wash-up attitudinal survey. Depending on the length of the
choice modelling questionnaire, consideration should be given to delivery through a respondent-directed
method such as the internet. This method involves existing sample members recruiting new members to the
sample from their social network. To avoid bias, it would be important to sub-sample identifiable members of
the respondent sample representing the population.

9
4.2.4 Options for improvements to off-site surveys
Registry sampling frames
General population surveys are unlikely to be the most efficient method of collecting data, as recreational
fishers are relatively rare in the population. The most effective solution would be the creation of a
comprehensive registry of all recreational fishers. This would provide a targeted sampling frame improving
efficiency, precision and cost-effectiveness.
Currently, recreational fishing licences exist in New South Wales (NSW), Victoria (Ryan et al. 2009; Ford and
Gilmour 2013), and Western Australia (WA) (Ryan et al. 2009; 2017). Residents primarily purchase a
recreational fishing licence, however, a small number of interstate or overseas visitors also take out licences.
Some of these licence schemes have exemptions (e.g. pensioners, under 18s) and only apply to shore-based
fishers in Western Australia (Georgeson et al. 2015). Additional licence frames that could be accessed include
recreational rock lobster pot licences in WA (DeLestang et al. 2012), species and gear specific licences in
Tasmania (Melville-Smith and Anderton 2000; Lyle and Morton 2004; Lyle et al. 2005) and rock lobster pots
registrations in South Australia (SA, Currie et al. 2006). The major concern with registry sampling frames is
potential non-response bias related to avidity, meaning that follow-up surveys or adjustments may be required.
Vessel registration, or boat licence databases, are also likely to provide an effective alternative sampling frame,
as people who own a boat are more likely to participate in recreational fishing. While such licence frames may
not provide full coverage of the target population, they can be effective for targeting particular species or
fishing methods (e.g. boat-based fishing for offshore species).
Commercial databases and online panels
Commercial databases, such as those used for healthcare and market research, contain records from a sample
of the population and can be purchased, or leased, from commercial vendors. The types of data generally
include specific identifiers, i.e. names and addresses, and key demographic variables. They may also contain
indicators of wealth, purchasing behaviour, and leisure or professional activities. While coverage in these
databases is generally good, the accuracy and completeness of data available can be variable. The biggest
challenge presented by commercial databases is the lack of information available on data source and quality
control procedures. Further work is required to understand the potential biases in these datasets to aid
interpretation of outcomes when used for recreational surveys.
As it is often difficult to source a suitable sampling frame, online panels can provide access to a pool of subjects
who have agreed to take part in online studies on a regular basis. Non-probability panels are open for anyone
to join, this means that the probability of selection for each member is unknown and so it is not possible to
calculate confidence intervals. Probability-based online panels, where samples are randomly drawn from list
or area frames, are the preferred option to target recruits from either the general population or a pre-recruited
panel. The key advantages of online-panel data frames are ease of access, relative cost-effectiveness, and
increased likelihood of accurate and honest responses. With ongoing survey participation, it is also possible to
collect comprehensive demographic background information on panel members. One of the potential biases
of this method is that respondents may provide inaccurate answers to complete a survey faster, particularly if
there are, incentives involved (Hillygus et al. 2014). In addition, coverage bias, where a research sample is not
representative, can occur where the internet is the source of panel member recruitment. The quality of online
panels is likely to be highly variable between providers. More research is required to develop robust methods
for sampling and weighting to improve representativeness where this method is to be used in recreational
fishing surveys.
Internet surveys
The internet provides an online platform for the completion of surveys, which is a cost-efficient and modern
alternative for data collection. The main concerns are around the precision and bias of the data collected.
Specifically, not all of the target population will have access to the internet and levels of computer literacy are
likely to vary among socio-demographic groups. In addition, biases towards anglers that are more avid may
occur and overall response rates can be low, particularly in relation to zero catch reporting (Georgeson et al.
2015). The Netherlands successfully implemented monthly online diary surveys between 2010 and 2011,
demonstrating the potential of online surveys for cost effective data collection (van der Hammen 2016). Some

10
of the key issues to consider relate to designing questionnaires to reduce non-response bias, adjusting for
avidity and respondent bias, and exclusion of dropouts (those who were intending to fish but did not).
Smartphones
Smartphone applications (apps) may provide a cost-effective method to collect supplementary data on
recreational catch (Gutowsky et al. 2013, Papenfuss et al. 2015; Venturelli et al. 2017). As most app
subscriptions are self-selected, sampling is non-probability based and it is not possible to calculate confidence
intervals and margins of error. The unknown level of non-response bias has major implications in the expansion
of catch data from the sample of fishers who opt-in to the survey and the broader population. Selection bias
towards fishers who own and effectively operate smartphones and may belong to specific socio-demographic
groups can also occur. For this reason, apps are unlikely to be suitable as a stand-alone method to collect
accurate and precise information on recreational fishing at this point in time.
Modern smartphones have potential to provide accurate spatial and species-specific data assisted by
technologies such as the Global Positioning System (GPS), high-resolution digital cameras, accelerometers
and gyroscopes. The supplementary data that apps can provide may be useful in engaging the recreational
sector and as an educational tool. Examples of currently used apps include iAngler (Muller and Taylor 2013)
and the International Game Fish Association Catchlog (IGFA 2018) in Florida, iFishWatcher in Europe (Abou-
Tair et al. 2013), and iSnapper in Texas (Stunz et al. 2014). Potential biases associated with app-based data
collection include transiency (short-term use), avidity, accuracy (exaggerated catches) and avoidance (lack of
trust or reluctance to share), as well as design issues in relation to user demographics (Papenfuss et al. 2015).
As apps generally rely on voluntarily, self-reported data, supplementary data from on-site surveys may be
required to corroborate catch estimates.
In addition, apps can provide a more efficient data collection method where traditional paper logbooks are
currently in place. This transition has already occurred in some commercial fisheries. For example, the
Deckhand app has replaced paper logbooks in the Southern Rock Lobster Fishery in SA (Phillips 2015), The
Institute for Marine and Antarctic Studies (IMAS) has recently engaged Real Time Data to modify the
commercial reporting app to be used by on-site creel clerks during Southern Bluefin Tuna surveys (Tracey
pers. comm). If used appropriately, app-based data collection can increase cost-efficiency, improve quality
assurance and quality control by reducing double handling and incorporating inbuilt redundancy checks, and
provide Work Health and Safety advantages though GPS monitoring capabilities for on-site survey
interviewers.
4.3 On-site recreational fishing surveys
On-site recreational fishing surveys are frequently conducted to validate components of large-scale off-site
methods or assess specific fisheries in defined areas (Georgeson et al. 2015). On-site surveys can be useful for
collecting information to monitor change between survey periods and collect additional biological information
on catch composition (e.g. length and weight of fish caught). This level of biological information is important
as it is relied upon to convert fish numbers to weight, and subsequently the estimated total harvest of the
recreational fishing sector. As interviews take place either during, or directly after, a fishing trip, a key
advantage of on-site surveys is improved accuracy and precision of data. On-site surveys also provide an
opportunity to assess residential location and access information from interstate or overseas visitors who may
not be accessible within State-based sampling frames where they exist.
4.3.1 Access point surveys
Access-point surveys focus on boat ramps, jetties and marinas where interviewers intercept anglers
immediately after a fishing trip is completed (Pollock et al. 1994). This method is most appropriate where there
are defined access points where fishers enter the fishery, usually places where anglers can park vehicles.
Stratified sampling is typically required due to higher recreational fishing effort on weekends and holidays.
Access points are usually chosen at random from a current and complete list to ensure that effort is not over-
or under-estimated. In Australia, access-point surveys using the ‘bus-route’ design are commonly used as
fishing generally occurs over a broad geographic area with many access points (Conron and Coutin 1995,
1998; McGlennon and Kinloch 1997; Murray-Jones and Steffe 2000; Sumner et al. 2002, 2008; Webley et al.
2009).

11
4.3.2 Roving Surveys
Where access is more widely dispersed and particularly for shore-based fisheries, interviewers can conduct
roving surveys either by boat or on foot (Pollock et al. 1994). Sampling methodology is similar to access-point
surveys, however, the main difference is the spatial extent of the sampling frame (i.e. there are no discrete
sites) and that interviews are conducted with anglers who have not yet completed their fishing trip. Roving
surveys can provide wider spatial coverage away from access points, however, trip data are often incomplete
or influenced by avidity and ‘length of stay bias’ as the probability of intercepting a fisher is proportional to
the length of their fishing trip (Pollock et al. 1994).
4.3.3 Complementary surveys
Complementary survey methods can improve the accuracy and precision of fishing effort and harvest estimates
(Steffe et al. 2008). While traditional creel surveys provide an opportunity to collect fishing effort information
and interview individual fishers, there is often a trade-off between sample coverage and cost. Increased
temporal coverage can be achieved by collecting supplemented auxiliary effort data, generally quantifying the
number of fishers or boats to calculate total effort.
For boat-based fishing activity, interviewers at boat ramps commonly undertake direct counts of boats or
trailers. Increased temporal coverage can be achieved by incorporating surveillance methods such as automatic
traffic counters at choke points to provide an indirect measure of boat movements, recording all vehicles
entering or leaving an area (Steffe et al. 2008). This is particularly useful in high traffic, or remote areas,
providing a cost-effective option for continuous monitoring which is important for highly variable recreational
fisheries. While they provide a low cost, low maintenance, and theft resistant option, they are unable to
distinguish between fishing and non-fishing vehicles and on-site validation is generally required (van Poorten
et al. 2018). Similarly, static boat ramp cameras can enable counts of boats launching and retrieving, however,
information on the proportion of boats that recreationally fish is required to measure recreational fishing effort
as opposed to overall boating activity. These cameras are commonly used to monitor trailer boats returning to
high traffic boat ramps in New Zealand (Hartill et al. 2016) and in Western Australia, boat ramps and groins
have also been surveyed (Smallwoood et al. 2012; Ryan et al. 2013, 2015, 2017; Steffe 2017). Future work
should look to automate the boat counting process from video footage to ensure consistent and repeatable
analysis. This could be facilitated by incorporating Automatic Number Plate Recognition (ANPR) software.
Shore-based fishing presents different challenges for surveyors to boat-based fishing as activity often extends
into the night. Sampling during the night has historically been challenging due to visibility and the safety of
observers. In Western Australia, dual lens cameras incorporating a thermographic lens have been trialled at
several locations to identify night-time shore-based crabbing effort (Steffe et al. 2017; Taylor et al. 2018).
Shore-based fishers are being identified in remote, unlit sections of the Peel-Harvey Estuary foreshore enabling
24-h monitoring of recreational fishing effort. This approach could be applied to other small-scale recreational
fisheries where fishing at night occurs. Future advances in this technology will likely see it become more
readily available and widely used as costs decrease.
Increasing the spatial coverage of on-site recreational fishing surveys is also important in areas where fishing
may occur over a large area, or is difficult to access by a vehicle. Aerial surveys using fixed-wing aircraft are
considered a useful tool for measuring the spatial distribution of effort providing estimates of fishing effort on
a selection of days at high-effort areas (Holdsworth et al. 2018; Hartill et al. 2011, 2013; Smallwood et al.
2012). They can provide instantaneous counts of shore-based anglers and identify spatial distribution and
aggregations of fishers. The main disadvantage is cost-effectiveness over large spatial or temporal scales.
An alternative to fixed-wing aircrafts is the use of drones which can provide video/photographic data with high
spatial accurately. A trial drone survey of recreational fishing activity is currently underway in Freycinet
Estuary, a remote area in Shark Bay, Western Australia (Taylor pers. comm.). This is part of a 12-month survey
to assess the status of local fish stocks and the effect of changes to management of pink snapper in the estuary.
Footage collected from drones is being compared to that collected from simultaneous aerial surveys using
fixed-wing aircraft to assist in evaluating the efficacy of this emerging technique (Taylor, pers. comm.). Some
of the limitations of drones are the certification requirements to pilot drones heavier than 2 kg (remotely piloted
aircraft), costs of equipment, intrusive/privacy concerns, limited flying time/range, local and/or national park
operating restrictions and access, and/or perception bias. Availability biases occur when not all subjects in the
area are observed, while perception biases are inherent with the sampling methodology and can include biases

12
associated with observers, flight characteristics or environmental conditions (Colefax et al. 2018). Another
alternative, which is particularly suitable to remote and isolated areas, is the use of satellite imagery tools to
measure recreational fishing effort (Keramidas et al. 2018). In the Mediterranean, satellite images were used
to count the number of vessels and this was compared against physical counts of recreational vessels at ports
and marinas. High correlations between in situ and satellite data were observed. A similar method that may be
employed in the future is the vessel monitoring system (VMS) which is commonly used to track commercial
fishing vessels (Toonen and Bush 2018).

13
5. Discussion
5.1 The future of large-scale off-site recreational fishing surveys
A comprehensive national registry of all recreational fishers would be the ideal sampling frame to undertake
cost-effective and robust large-scale recreational fishing surveys. A registry would provide access to a
representative sample of the target population and enable comprehensive sampling coverage while minimising
bias. From this, a robust offsite probabilistic sampling protocol can be implemented. While a national registry
would result in some cost savings due to increased sampling efficiency, there would likely be some additional
cost to maintain the database. However, the benefits of this approach would likely outweigh the cost due to
increased quality and quantity of data and improved public confidence in survey outputs.
The currently available registry databases are restricted to State-issued fishing licences, such as those available
in New South Wales, Victoria and Tasmania, or the Western Australian Recreational Fishing from Boat
Licence database. These sampling frames are generally subject to a range of exemptions (e.g. under 18,
concession card holders, pensioners, people fishing in private waters, Aboriginal or Torres Strait Islander
people). This may result in a sampling frame that does not capture all of the potential respondents affecting
the robustness of any estimates. In some instances, a dual-frame approach may be an appropriate option to
reduce biases introduced by relying on a single incomplete sampling frame (Georgeson et al. 2015).
Under a dual-frame approach, a general population database would be used as the primary sampling frame and
this would be supplemented with other existing licence databases where available. General population
databases such as phone, or address, listings provide a convenient sampling frame to choose random samples
for surveys. The most commonly used phone-based general population database is the White Pages©, although
in recent years this has become less representative of the overall population (Griffiths et al. 2017). While the
IPND, would provide a more complete phone-based list, it can only be accessed by Commonwealth
Government research agencies. Therefore, commercial databases, or probability-based online panels, which
are frequently used in social science and medical research, were identified as a potential alternative to
traditional telephone directories. As commercial databases and online panels do not cover the entire population,
it will be important to account for potential high levels of bias when scaling up results to the target population
level. Where face-to-face or mail-based surveys are acceptable as a primary contact method, the G-NAF would
provide the most complete address-based listing of Australian households.
Regardless of the sampling frame selected, longitudinal diary surveys are currently the most common platform
for collecting recreational fishing data in Australia (Georgeson et al. 2015). The required level of engagement
to achieve accurate and precise responses is likely to vary depending on personal preferences (of respondents)
related to factors such as age, language, literacy and technical ability. While phone-surveys are the most
commonly used method to undertake the diary surveys, respondent-driven methods such as online surveys
may become more popular in the future due to the speed and convenience offered by this platform. An internet
platform may provide a more cost-effective alternative with suitable flexibility to design surveys that will
likely appeal to a broader range of respondents. As internet-based surveys are respondent driven (i.e. they are
completed voluntarily), the key challenge is likely to be participant apathy towards surveys which can result
in bias and inaccuracy. Smartphone, or tablet apps, may provide another convenient method for data collection
and could replicate online surveys. Similar technology is already in place in the commercial sector in Australia,
where e-logbooks are submitted using apps that replace traditional paper logbooks (e.g. the South Australian
Southern Rock Lobster Fishery). Some fisheries also offer the option of submission manually or by using
electronic logbooks (e.g. fisheries managed by the Australian Fisheries Management Authority).
Following the main data collection surveys, wash-up attitudinal surveys are generally conducted to assess
awareness and attitude of recreational fishers and detect differences among respondents. As there are a large
number of recreational fishers, there are many potential biases that can influence recreational harvest estimates.
In particular, socio-demographic characteristics (e.g. age, race, ethnicity, gender, socio-economics), fisher
profile (boat size/power, use of technology), attitudes, values and motivations are all highly variable.
Workshop participants generally agreed that standard questions similar to those used in the Tasmanian wash-
up survey could easily be adapted to suit other jurisdictions. It is unlikely that all jurisdictions would include
choice modelling, as this sophisticated approach would be more suitable as a federal survey analysed by

14
Australian Bureau of Agricultural and Resource Economics and Sciences (ABARES) but potentially
distributed by the states/territories. In addition, wash-up surveys may provide an opportunity to explore
Aboriginal, Indigenous and traditional fishing which would be relevant to inform allocation policies and
decisions around native title claims.
5.2 Improving accuracy and precision of information through on-site surveys
On-site recreational fishing surveys can provide cost-effective methods to collect catch, effort and biological
data for small-scale, or specific, recreational fisheries. Traditional creel surveys, using established roving or
access point methods, provide a mechanism to repeatedly survey important areas to identify changes through
time (Pollock et al. 1994). On-site surveys have also been used to complement off-site surveys providing
additional information that improve cost effectiveness (Georgeson et al. 2015). Compared to off-site surveys,
on-site surveys have the advantage of reduced recall bias and can provide opportunities for interviewers to
measure and weigh catch.
As recreational fishing activity is complex and highly variable over large spatial and temporal scales, it can be
difficult to sample all access points where fishing occurs. Where large geographical areas need to be covered,
aerial surveys are sometimes used to determine effort (counts of boats or shore-based fishers). Emerging
technologies such as drones and satellite imagery may provide a future alternative suitable to remote and hard
to access areas. Increased coverage can also be achieved with new and emerging on-site methods such as static
boat ramp cameras, ANPR and thermal imaging cameras. These technologies are being trialled in several
Australian jurisdictions and New Zealand as complementary methods to improve data on fishing effort.
Camera based surveillance methods are becoming more commonly used and this will likely continue to
increase as more cost-effective methods of data and image/video analysis are developed. Further comparative
studies using dual or multi-survey approaches will require collaboration across jurisdictions with a view to
build Australia’s capability in this area.
As effort and catch rates can be spatially and temporally structured and subject to different sources of
variability (Cabanellas-Reboredo et al. 2017), there is a clear need to develop cost-effective methods to
improve the accuracy of recreational harvest estimates and address specific management questions. As large-
scale surveys are generally undertaken infrequently, on-site methods may also provide a suitable proxy for
effort and could serve to capture the variation in fishing activity between off-site surveys.
5.3 Engaging the recreational fishing community
Recreational fishing surveys provide key information used to inform fisheries management. In some
jurisdictions (e.g. SA and WA), recreational catch estimates are used to determine shares against pre-described
allocations that underpin resource management (PIRSA 2011; 2017; Ryan et al. 2016). Improving the accuracy
and precision of these estimates was a key focus of this workshop. However, it has been identified that
stakeholders’ lack of understanding of survey methodologies when interpreting survey results can undermine
their integrity. As a result, the strategies to engage the recreational sector in fisheries science and management
were discussed. Workshop participants agreed that for future surveys, it would be important to engage with
the recreational fishing community at all stages of planning, implementation and delivery to ensure
understanding and acceptance of the outcomes. An example of this was the recent “Recfishing Champions”
workshop hosted by Recfish SA. This provided an opportunity for 15 recreational fishers to learn more about
managing our valuable fisheries resources with training from fishery managers and scientists. Increasing
recreational fisher involvement in fisheries management will likely require the development of programs to
build a sense of community (Copeland et al. 2017).
One way to engage the recreational fishing community is by developing citizen science capacity and spreading
educational messages through social media platforms and smartphone apps. Social media (e.g. Facebook,
Instagram) provides a platform for networks of individuals to share information in real-time. Social media
forums and smartphone apps provide opportunities to improve fishing experiences and are already popular
within the recreational fishing community. Social media and apps facilitate the sharing of fishing locations
through integrated mapping software, provide communication forums (brag boards, photo sharing), weather
and tide information, boat ramp locations and details, fish identification guides, fishing tips and tricks,

15
competitions, fishing rules and regulations, news and other information. There may be some situations where
social media and apps can provide a cost-effective mechanism for community monitoring. However, they are
unlikely to be representative of the entire population and biases such as avidity will be difficult to account for.
In order to answer management questions and collect reliable data that are comparable to previous surveys,
the most tractable approach would be to undertake probabilistic sampling with a specifically designed app.
Other more active engagement approaches, such as the ‘Send in your Skeletons’ initiative implemented in
Western Australia and the King George Whiting (KGW) frame donation project in SA (FRDC 2016-003),
have been positive exercises in engaging more broadly with the sector, as they enabled fishers to collect and
contribute important biological information on their catches.
In addition to harvest estimates, effective recreational fishing surveys provide important insights into the social
and economic contribution of recreational fishing. Understanding the motivations of the recreational fishing
community is important to ensure that fishing is not only sustainable but also satisfying. As fishing motivations
are likely to differ between the commercial and recreational sector, a sustainable fishery may not be the sole
focus of the recreational sector, but more so the availability of target species (positive fishing experience). This
is complicated where allocation issues exist within shared access fisheries. An improved understanding of
recreational fisher attitudes and motivations is important when implementing changes to fishing rules and
regulations and to interpret fisher’s behaviour through time. Recreational fishing surveys play a key role in
understanding this shifting landscape as they provide an opportunity to understand fishing motivations that can
be either catch- or non-catch related (Finn and Loomis 2001).

16
6. Conclusion
Rapid evolution in the way people communicate is occurring due to technological change and cultural shifts
towards less personalised communication. This presents challenges for undertaking future recreational surveys
and surveyors need to adapt to this changing landscape. The results of this workshop re-inforce the importance
of designing surveys to explicitly deal with fishery-management related issues. For large-scale surveys, the
most suitable and clearly defined sampling frame for future surveys is a national database of recreational
fishers. Where a complete sampling frame is not available, a dual-frame design incorporating a commercial
database or online panel should be investigated. It is likely that internet-based surveys will provide a cost-
efficient mechanism for undertaking recreational fishing surveys in the future. On-site surveys were identified
as a tool to provide a useful proxy for estimates of catch and effort between large-scale surveys. On-site surveys
should continue to be used to collect important catch, effort and essential biological information, particularly
where surveys occur over small-scales or where specific fisheries are being investigated. The accuracy and
precision of data collected during on-site surveys will likely be improved through use of new and emerging
technologies.
Wash-up attitudinal surveys, which are generally undertaken after the main survey, remain as an important
tool to provide insights into the socio-economic contribution of recreational fishing. Understanding the
motivations of recreational fishers continues to be an important component of recreational fishing surveys.
Smartphone apps were identified as a potential way to engage the recreational fishing community; however,
they are unlikely to replace robust non-probability survey methods. While this workshop was an important
first step in engaging with the recreational fishing community through their peak body, further engagement
will be required at the jurisdictional level to identify engagement strategies relevant to their user groups.

17
7. Implications
The main constraint to undertaking recreational fishing surveys is the lack of a complete sampling frame.
Establishing a national registry of recreational fishers would avoid the need to investigate alternative sampling
frames. Until a national database becomes available, alternative sampling frames (e.g. existing licence frames
and/or population databases), will continue to be used to conduct large-scale recreational fishing surveys. The
use of these sampling frames is likely to introduce bias and for State wide surveys, interstate visitors are
unlikely to be sampled. There are potential opportunities to improve the accuracy and precision of data through
on-site sampling using modern sampling techniques and use of innovative technologies, although the utility of
such approaches required further investigation. A collaborative approach, across jurisdictions, will build
Australia’s capability in this area.

18
8. Recommendations
8.1 Recommended approach
The workshop identified that the most cost-effective option for future large-scale surveys is to gain access to
a national register of recreational fishers (without exemptions). This would allow probabilistic sampling of the
target population, improved precision of the catch and effort estimates and alleviate the reliance on broad-scale
population sampling. Where a complete registry is not available, other general population databases, such as;
the Geocoded National Address File (G-NAF), the Integrated Public Number Database (IPND), boat
registration databases, commercial databases, and online panels may provide alternative sampling frames, or
a multi-frame design using combinations of these may be employed. Future surveys should consider the use
of internet-based data collection as a cost-efficient alternative to phone-surveys. Standard wash-up attitudinal
surveys should be developed using questions similar to the Tasmanian wash-up survey (Lyle 2018), which
could easily be adapted to suit all jurisdictions.
On-site surveys are recommended as a tool to provide useful proxies for estimates of catch and effort between
large-scale surveys. They also provide important catch, effort and essential biological information over small-
scales or where specific fisheries are being investigated. Consideration needs to be given to new and emerging
technologies to improve the accuracy and precision of data. Smartphone applications should be considered as
a tool for increasing engagement with the recreational community but are unlikely to replace more robust
survey methods. It is recommended that further engagement of the recreational fishing community is required
at the jurisdictional level to identify strategies relevant to their user groups.
8.2 Further development
The need to develop closer cross-jurisdictional collaborations to improve the cost-effectiveness and precision
of State-based recreational fishing surveys was acknowledged during the workshop. In particular, there is a
need to compare the effectiveness of new and emerging sampling frames, such as commercial databases or
online panels, given the decreasing coverage phone directories offer and the lack of a comprehensive registry
of recreational fishers. Whilst the needs of the various jurisdictions are likely to differ, there is overall
agreement regarding the underlying principles of recreational fishing surveys and the need to tailor the surveys
accordingly. It was the consensus of the workshop participants that a research proposal be developed to explore
the cost-effectiveness and precision of various data-collection methods. A comparison of direct interviews
and online data gathering techniques, along with combining both methods, would be the underlying objective,
however, these collection methods would need to be applied within the same sample frame. Applying this
comparative method analysis across the jurisdictions would add considerable value. For example the vessel
registration database could be used in WA, whereas a commercially purchased data-base could be assessed in
other jurisdictions (e.g. Qld, SA). This would lead to multiple experiments across the different states that can
be tailored to their respective situations and needs, while collectively contributing to improving Australia’s
overall understanding of recreational catch and effort, participation rates, and value.
From this workshop, it was recommended that periodic off-site State wide surveys be supplemented with more
regular, targeted, on-site investigations to establish a continuous proxy for recreational catch and effort.
Emerging surveillance technology is beginning to be used in some jurisdictions to support fisheries
management. These technologies include, static boat ramp cameras, aerial surveys, and thermal imaging, and
they are typically supported with on-site creel surveys to gain further insight into the dynamics and behaviour
of recreational fishers. Further research should aim to build upon the expertise from Australia and New Zealand
by assessing whether emerging technologies (e.g., ANPR and targeted drone surveys) can be effectively
integrated with small-scale boat-ramp surveys. By coupling passive long-term surveillance with periodic State
wide surveys such research will be able to develop proxies for catch and effort, determine the relative fishing
capacity (i.e. use of fishing technologies), and explore the underlying motivation that is driving the recreational
fishing sector.
The use of apps as a simple means of collecting recreational fishing data is often touted by the broader
community as the ‘panacea’ to surveying and assessing recreational catch and effort. However, reliance on this

19
technology is problematic. There may be opportunities to investigate the potential of this technology, but this
should be undertaken from the standpoint of recreational fisher engagement and education to support the
sector’s understanding of the need for statistically rigorous, probabilistic, surveys.

20
9. Extension and Adoption
There are clear benefits to establishing a national registry of recreational fishers to be used as the primary
sampling frame for off-site recreational fishing surveys. This would avoid the need for general population
sampling and enable a targeted approach to sampling. Where incomplete licence frames exist and general
population sampling is required, probabilistic (random) sampling will ensure appropriate representation and
reduce bias. While commercial databases present an opportunity for general population sampling under a dual-
frame approach, uncertainty around data sources and quality control procedures means that further work is
required to understand the potential biases in these datasets. As preferences in communication are changing,
we are likely to see a switch from traditional phone-surveys to online surveys. Similarly, on-site survey
methods continue to evolve with the advent of new technologies. The benefits are likely to be increased
sampling efficiency and reduced costs. As jurisdictions prepare for future recreational fishing surveys, the
results of this workshop provide a toolbox for building on the ‘best practice’ approach described in Georgeson
et al. (2015).

21
References
Abou-Tair, D., Bourimi, M., Tesoriero, R., Heupel, M., Kesdogan, D., and Ueberschär, B. (2013). An end-
user tailorable generic framework for privacy-preserving location-based mobile applications. Applied
Mathematics & Information Sciences 7:2137–2148.
Armstrong, M., Brown, A., Hargreaves J., Hyder K., Pilgrim-Morrison S., Munday, M., Proctor, S., Roberts,
A., & Williamson K. (2013). Sea Angling 2012 – a survey of recreational sea angling activity and economic
value in England. Department for Environment Food and Rural Affairs, Manchester, UK. 16pp.
Cabanellas-Reboredo, M., Palmer, M., Alós, J., & Morales-Nin, B., (2017). Estimating harvest and its
uncertainty in heterogeneous recreational fisheries. Fisheries Research 188, 100–111.
https://doi.org/10.1016/j.fishres.2016.12.008
Colefax, A.P., Butcher, P.A., & Kelaher, B.P. (2018). The potential for unmanned aerial vehicles (UAVs) to
conduct marine fauna surveys in place of manned aircraft, ICES Journal of Marine Science. 75(1) 1-8.
Coleman, A. P. M. (2003). The National Recreational Fishing Survey: The Northern Territory. Northern
Territory Department of Business, Industry and Resource Development. Fishery Report 72.
Conron S., Coutin P.C. (1995). ʹA pilot survey of the recreational snapper fishery of PPB 1994/95.ʹ Progress
Report No. 1. Victorian Fisheries Research Institute, Queenscliff.
Conron S., & Coutin P.C. (1998). ʹThe recreational snapper catch from PPB: A pilot study of the boat–based
fishery 1994/1995.ʹ Marine and Freshwater Resources Institute Internal Report No. 11. Marine and Freshwater
Resources Institute, 11, Queenscliff.
Copeland, C., Baker, E., Koehn, J.D., Morris, S.G., & Cowx, I.G., (2017). Motivations of recreational fishers
involved in fish habitat management. Fisheries Management and Ecology 24, 82–92.
https://doi.org/10.1111/fme.12204
Currie, D.R., Sorokin, S.J., Ward, T.J.M., (2006). Survey of recreational rock lobster fishing in South Australia
during 2004/05. South Australia Research and Development Institute Research Report Series.
De Lestang, S., Caputi, N., How, J., Melville-Smith, R., Thomson, A., & Stephenson, P. (2012). Stock
Assessment for the West Coast Rock Lobster Fishery. Fisheries Research Report No. 217. Department of
Fisheries, Western Australia. 200pp.
Finn, K.L., & Loomis, D.K. (2001). The Importance of Catch Motives to Recreational Anglers: The Effects of
Catch Satiation and Deprivation. Human Dimensions of Wildlife 6, 173–187.
https://doi.org/10.1080/108712001753461275
Ford, J., & Gilmour, P. (2013). The state of recreational fishing in Victoria: a review of ecological
sustainability and management options, a report to the Victorian National Parks Association, Melbourne.
Georgeson, L., Moore, A., Ward, P., Stenekes, N., Kancans, R., Mazur, K., Curtotti., R Tracey, S., Lyle, J.,
Hansen, S., Chambers, M., Finn, M., & Stobutzki, I. (2015). A framework for regular national recreational
fishing surveys, ABARES, Canberra, November . CC BY 3.0.
Giri, K., & Hall, K. (2015). South Australian recreational fishing survey. Fisheries Victoria Internal Rep ort
Series No. 62.
Griffiths, S., Lynch T., Lyle J., Wotherspoon S., Wong L., Devine C., Pollock K., Sawynok W., Donovan A.,
Fischer M., Tickell S., & Moeseneder C. (2017). Trial and validation of Respondent-Driven Sampling as a
cost-effective method for obtaining representative catch, effort, social and economic data from recreational
fisheries
22
Griffiths, S.P., Pollock, K.H., Lyle, J.M., Pepperell, J.G., Tonks, M.L., & Sawynok, W., (2010). Following the
chain to elusive anglers. Fish and Fisheries 11, 220–228. https://doi.org/10.1111/j.1467-2979.2010.00354.x
Gutowsky, L.F.G., Gobin J., Burnett N.J., Chapman J.M, Stoot L.J., & Bliss, S. (2013). Smartphones and
Digital Tablets: Emerging Tools for Fisheries Professionals, Fisheries, 38:10, 455-461, DOI:
10.1080/03632415.2013.838133
Hartill, B., Bian, R., Rush, N., & Armiger, H., (2013). Aerial-access recreational harvest estimates for snapper,
kahawai, red gurnard, tarakihi and trevally in FMA 1 in 2011–12. New Zealand Fisheries Assessment Report
70, 44.
Hartill, B.W., Payne, G.W., Rush, N., & Bian, R., (2016). Bridging the temporal gap: Continuous and cost-
effective monitoring of dynamic recreational fisheries by web cameras and creel surveys. Fisheries research
183, 488–497.
Hartill, B.W., Watson, T.G., & Bian, R. (2011). Refining and Applying a Maximum-Count Aerial-Access
Survey Design to Estimate the Harvest Taken from New Zealand's Largest Recreational Fishery, North
American Journal of Fisheries Management, 31:6, 1197-1210, DOI: 10.1080/02755947.2011.646454
Heinemann, A., Wynne-Jones, J., Gray, A., & Hill, L., (2015). National Panel Survey of Marine Recreational
Fishers 2011–12: Rationale and Methods. New Zealand Fisheries Assessment Report 2015/48
Henry, E.W., & Lyle, J.M. (2003). The National Recreational and Indigenous Fishing Survey. Fisheries
Research and Development Corporation, Project No. 99/158. Canberra, Australia: Australian Government
Department of Agriculture, Fisheries and Forestry.
Hillygus, D.S., Jackson, N., & Young, M. (2014). Professional respondents in non-probability online panels.
In M. Callegaro, R. Baker, J. Bethlehem, A. S. Goritz, J. A. Krosnick, & P. J. Lavrakas (Eds.), Online panel
research: A data quality perspective (pp. 219–237). Chichester: John Wiley & Sons.
Holdsworth, J.C., Hartill, B.W., Heinemann, A., & Wynne-Jones, J. (2018). Integrated survey methods to
estimate harvest by marine recreational fishers in New Zealand. Fisheries Research 204, 424–432.
https://doi.org/10.1016/j.fishres.2018.03.018
ICES (2010). Report of the Planning Group on Recreational Fisheries (PGRFS), 7-11 June 2010, Bergen,
Norway. ICES CM 2010/ACOM:34. 168 pp.
International Game Fish Association (IGFA). (2018) "What is IGFA CatchLog?" August 2018.
http://www.igfacatchlog.org/About.aspx
Jones, K. (2009). South Australian Recreational Fishing Survey 2007/08. South Australian Fisheries
Management Series Paper No. 54. Adelaide, Australia: Primary Industries and Resources South Australia
(Fisheries).
Keramidas, J., Dimarchopoulou, D., Pardalou, A., & Tsikliras, A.C. (2018). Estimating recreational fishing
fleet using satellite data in the Aegean and Ionian Seas (Mediterranean Sea). Fisheries Research. 208, 6pp.
https://doi.org/10.1016/j.fishres.2018.07.001.
Lyle, J.M. (2018). Tasmanian recreational rock lobster and abalone fisheries: 2017–18 fishing season. Institute
for Marine and Antarctic Studies, University of Tasmania, Hobart, Tasmania. 33pp.
Lyle, J., & J Morton, A., (2004). Survey of the 2002/03 Tasmanian recreational rock lobster and abalone
fisheries. TAFI Technical Report 22. Tasmanian Aquaculture and Fisheries Institute, Hobart, Tasmania. 33pp.
Lyle, J.M., Coleman, A.P.M, West, L., Campbell, D., & Henry, G.W. (2002). New large-scale survey methods
for evaluating sport fisheries. In: Recreational Fisheries: Ecological, Economic and Social Evaluation, Pitcher,
T.J., and Hollingworth, C.E. (eds). pp 207-226. Fish and Aquatic Resources Series No. 8, Blackwell Science,
Oxford, UK

23
Lyle, J.M., Morton, & A.J., Forward, J. (2005). Characterisation of the recreational fishery for southern rock
lobster, Jasus edwardsii, in Tasmania, Australia: Implications for management, New Zealand Journal of
Marine and Freshwater Research, 39:3, 703-713, DOI: 10.1080/00288330.2005.9517346
McGlennon D., & Kinloch M.A. (1997). Evaluation of the bus‐route creel survey method in a large Australian
marine recreational fishery II. Pilot surveys and optimal sampling allocation. Fisheries Research 33, 89–99
Melville-smith, R., & Anderton, S.M., (2000). Western rock lobster mail surveys of licensed recreational
fishers 1986/87 to 1998/99. Fisheries Research Report No. 122. Fisheries Research Division, WA Marine
Research Laboratories, Perth, WA. 39 pp.
Murray-Jones, S., & Steffe, A.S., (2000). A comparison between the commercial and recreational fisheries of
the surf clam, Donax deltoides. Fisheries Research 44, 219–233. https://doi.org/10.1016/S0165-
7836(99)00095-8
Muller, R.G., & Taylor, R.G. (2013). The 2013 Stock Assessment Update of Common Snook, Centropomus
Undecimalis. Florida Fish and Wildlife Conservation Commission, Fish and Wildlife Research Institute Report
2013-004, 157 pp.
Papenfuss, J.T., Phelps, N., Fulton, D., & Venturelli, P.A. (2015). Smartphones Reveal Angler Behavior: A
Case Study of a Popular Mobile Fishing Application in Alberta, Canada, Fisheries, 40:7, 318-327, DOI:
10.1080/03632415.2015.1049693
Phillips J. (2015). Southern Rock Lobster IPA: Assessing functionality and suitability of the iPhone [iPad]
application 'Deckhand' for on-board electronic data capture in Southern Australian Rock Lobster (Jasus
edwardsii) fisheries. FRDC Report No 2011/250.
PIRSA. (2011). Allocation Policy- Allocation of Access to Fisheries Resources between Fishing Sectors,
Primary Industries and Regions South Australia, 39p, Primary Industries and Regions South Australia.
PIRSA. (2017). Management Plan for Recreational Fishing in South Australia, 56p, Primary Industries and
Regions South Australia.
Pollock, K.H., Jones, C.M. & Brown, T.L. (1994). Angler survey methods and their applications in fisheries
management, American Fisheries Society, Special Publication 25, Bethesda, Maryland.
Public Sector Mapping Agencies. (2013). G-NAF Data Product Description Version 2.9
Ryan K.L., Hall N.G., Lai E.K., Smallwood C.B., Taylor S.M., & Wise B.S. (2017). Statewide survey of boat-
based recreational fishing in Western Australia 2015/16. Fisheries Research Report No. 287, Department of
Primary Industries and Regional Development, Western Australia. 205pp.
Ryan, K.L., Hall, N.G., Lai, E.K., Smallwood, C.B., Taylor, S.M., & Wise, B.S. (2015). State-wide survey of
boat-based recreational fishing in Western Australia 2013/14. Fisheries Research Report No. 268, Department
of Fisheries, Western Australia. 208pp. Final report to Fisheries Research and Development Corporation
Project No. 2012/021. CSIRO, Hobart. 145 pp.
Ryan K.L., Morison A.K., & Conron S. (2009). Evaluating methods of obtaining total catch estimates for
individual Victorian bay and inlet recreational fisheries. Final report to Fisheries Research and Development
Corporation Project No. 2003/047. Department of Primary Industries, Queenscliff.
Ryan K.L., Trinnie, F.I., Jones, A., Hart, A.M., & Wise, B.S (2016). Recreational fisheries data requirements
for monitoring catch shares. Fisheries Management and Ecology. 23, 218–233.
Ryan, K.L., Wise, B.S., Hall, N.G., Pollock, K.H., Sulin, E.H., & Gaughan, D.J. (2013). An integrated system
to survey boat-based recreational fishing in Western Australia 2011/12. Fisheries Research Report No. 249,
Department of Fisheries, Western Australia. 168pp.

24
Schaeffer, R.L., Mendenhall, W., & R.L. Ott (1996) Elementary survey sampling, fifth edition. Duxbury
press, Belmont California
Smallwood, C.B., Pollock, K.H, Wise, B. S., Hall, N. G., & Gaughan, D. J. (2012) Expanding Aerial–Roving
Surveys to Include Counts of Shore-Based Recreational Fishers from Remotely Operated Cameras: Benefits,
Limitations, and Cost Effectiveness, North American Journal of Fisheries Management, 32:6, 1265-1276,
DOI: 10.1080/02755947.2012.728181
Steffe, A.S., Murphy, J.J., & Reid, D.D. (2008). Supplemented access point sampling designs – a cost-effective
way of improving the accuracy and precision of fishing effort and harvest estimates derived from recreational
fishing surveys. North American Journal of Fisheries Management 28, 1001-1008.
Steffe, A. S., Taylor, S. M., Blight, S. J., Ryan, K. L., Desfosses, C. J., Tate, A. C., Smallwood, C. B., Lai, E.
K., Trinnie, F. I., & Wise, B. S. (2017). Framework for Integration of Data from Remotely Operated Cameras
into Recreational Fishery Assessments in Western Australia. Fisheries Research Report No. 286, Department
of Primary Industries and Regional Development, Western Australia. 36pp.Sumner, N.R., Williamson, P.C.,
Blight, S.J., & Gaughan, D.J. (2008). A 12-month survey of recreational boatbased fishing between Augusta
and Kalbarri on the West Coast of Western Australia during 2005-06. Fisheries Research Report No. 177,
Department of Fisheries, Western Australia, 44p.
Sumner, N. R., Williamson, P. C., & Malseed, B. E. (2002). A 12-month survey of recreational fishing in the
Gascoyne bioregion of Western Australia during 1998-99, Fisheries Research Report No. 139, Department of
Fisheries, Western Australia, 54p.
Stunz, G.W., Johnson, M. J., Yoskowitz, D., Robillard, M., & Wetz, J. (2014). iSnapper: Design, Testing, and
Analysis of an iPhone-based Application as an Electronic Logbook in the for-hire Gulf of Mexico Red Snapper
Fishery. National Oceanic and Atmospheric Administration Final Report NA10NMF4540111. 64 pp.
Taylor S.M., Blight, S.J., Desfosses, C.J., Steffe S.S., Ryan, K.L., Denham, A.M., & Wise, B.S. (2018).
Thermographic cameras reveal high levels of crepuscular and nocturnal shore-based recreational fishing effort
in an Australian estuary, ICES Journal of Marine Science. doi:10.1093/icesjms/fsy066
Toonen, H.M., & Bush, S.R. (2018). The digital frontiers of fisheries governance: fish attraction devices,
drones and satellites, Journal of Environmental Policy & Planning, DOI: 10.1080/1523908X.2018.1461084
Van der Hammen, T., de Graaf, M, & Lyle, J.M. (2016). Estimating catches of marine and freshwater
recreational fisheries in the Netherlands using an online panel survey. ICES Journal of Marine Science. 73(2)
441-450p.
van Poorten., B.T., & Brydle,S. (2018) Estimating fishing effort from remote traffic counters: Opportunities
and challenges. Fisheries Research, 204:231-238p.
Venturelli, P.A., Hyder, K., & Skov, C., (2017). Angler apps as a source of recreational fisheries data:
opportunities, challenges and proposed standards. Fish and Fisheries 18, 578–595.
https://doi.org/10.1111/faf.12189
Webley, J., Taylor, S., Mayer, D., Dew, K., & Olyott, L., (2009). Survey of marine boat-based recreational
fishing in south-eastern Queensland (2007–08). Queensland Government. 61 pp.

25
Appendix 1: Project Staff
Dr Mike Steer: South Australian Research and Development Institute (SARDI)
Dr Sean Tracey: Institute for Marine and Antarctic Studies (IMAS)
Mr Andy Moore: Department of Agriculture & Water Resources (DAWR)
Mr Brett Cleary: Game Fishing Association of Australia (GFAA)
Dr Crystal Beckmann SARDI
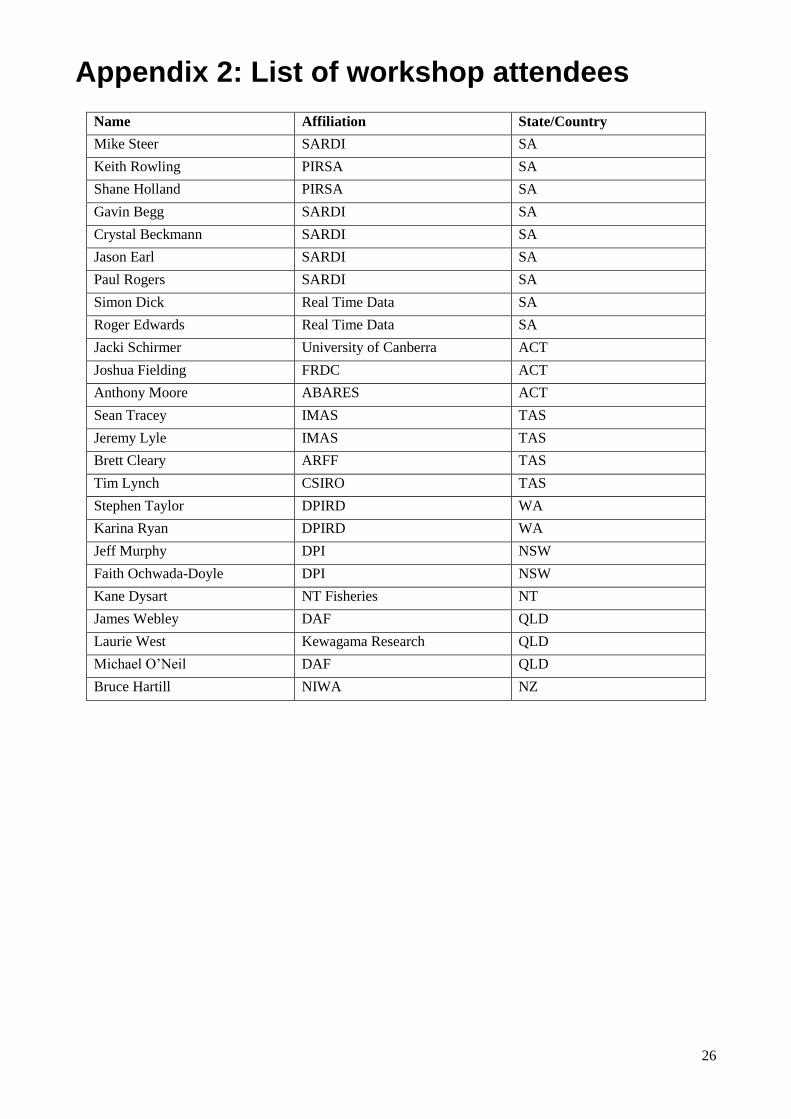
26
Appendix 2: List of workshop attendees
Name Affiliation State/Country
Mike Steer SARDI SA
Keith Rowling PIRSA SA
Shane Holland PIRSA SA
Gavin Begg SARDI SA
Crystal Beckmann SARDI SA
Jason Earl SARDI SA
Paul Rogers SARDI SA
Simon Dick Real Time Data SA
Roger Edwards Real Time Data SA
Jacki Schirmer University of Canberra ACT
Joshua Fielding FRDC ACT
Anthony Moore ABARES ACT
Sean Tracey IMAS TAS
Jeremy Lyle IMAS TAS
Brett Cleary ARFF TAS
Tim Lynch CSIRO TAS
Stephen Taylor DPIRD WA
Karina Ryan DPIRD WA
Jeff Murphy DPI NSW
Faith Ochwada-Doyle DPI NSW
Kane Dysart NT Fisheries NT
James Webley DAF QLD
Laurie West Kewagama Research QLD
Michael O’Neil DAF QLD
Bruce Hartill NIWA NZ

27
Appendix 3: Agenda
NATIONAL WORKSHOP:
ASSESS NEW TECHNOLOGIES AND TECHNIQUES THAT COULD IMPROVE THE COST-EFFECTIVENESS AND ROBUSTNESS OF RECREATIONAL FISHING SURVEYS (FRDC 2017/198)
In-conjunction with
DETERMINING THE DESIGN, OUTPUT SPECIFICATIONS AND SAMPLE SIZE FOR A NATIONAL SOCIAL AND ECONOMIC SURVEY OF RECREATIONAL FISHERS IN AUSTRALIA (FRDC 2016/126)
TUES 10TH TO THUR 12TH JULY 2018
SOUTH AUSTRALIAN RESEARCH & DEVELOPMENT INSTITUTE (SARDI)
2 HAMRA AVE, WEST BEACH, SOUTH AUSTRALIA
WORKSHOP CHAIR: DR SEAN TRACEY (IMAS)
NEED:
It is proposed that a national workshop is needed to:
1. Identify options to improve the precision and cost-effectiveness of recreational fishing surveys; 2. Assess whether emerging surveillance technologies can be feasibly integrated into future surveys; 3. Identify strategies that positively engage the recreational sector in fisheries science and
management.
Although all States are expected to benefit from the outcomes of the proposed workshop, South Australia is particularly reliant on the shared expertise, transfer of knowledge and advice regarding the execution of scientifically robust, routine recreational fishing surveys. The South Australian Government is committed to undertaking a recreational fishing survey every five years. All previous surveys have been carried out by interstate experts, however, there is a commitment by PIRSA/SARDI to develop recreational fisheries science capability at a sufficient level to undertake all future State-based surveys. It is expected that the workshop will establish South Australia’s role as an active participant in the national assessment of recreational fisheries, increase data harmonisation opportunities across the jurisdictions, and contribute in advancing recreational fisheries science.
The second part of the workshop will focus on options for implementing a national social and economic survey. Various options will be discussed in the hope on adopting a way forward that is beneficial to all jurisdictions.
OUTCOMES:
It is anticipated that a discussion paper will be a key output of this national recreational fishing workshop. Ideally, it would be beneficial to structure this paper as a ‘survey instrument’ that serves as a best-practice guideline to undertake a contemporary recreational survey. It may contain a series of decision rules based on the situation cascading from an established data-frame scenario to a lack of an appropriate sampling framework. As a group, it will be good to determine how prescriptive this will need to be and what should be incorporated into the tool box.

28
PROGRAM
TUES 10TH JULY
10:00 ARRIVAL/MORNING TEA
DAY 1 - IMPROVE THE PRECISION AND COST-EFFECTIVENESS OF SURVEYS
10:30 WELCOME/OBJECTIVES/INTRODUCTIONS (ROWLING – PIRSA)
DON’T THROW THE BABY OUT WITH THE BATH WATER (LYLE - IMAS)
APPLYING INNOVATION TO OFF-SITE SURVEY DESIGNS AND STATISTICAL METHODS
(RYAN – DPIRD)
USE OF INTERNET SURVEYS (MOORE – ABARES)
SURVEYS IN A CHANGING SOCIAL LANDSCAPE: ADDRESSING THE CHALLENGES OF ACHIEVING REPRESENTATIVE POPULATION SAMPLES (SCHIRMER – UNI. CAN)
13:00 LUNCH
GENERAL/OPEN DISCUSSION – SURVEY INSTRUMENT DEVELOPMENT
HOW TO DEAL WITH DIFFERENT SCENARIOS
15:30 AFTERNOON TEA
GENERAL/OPEN DISCUSSION – SURVEY INSTRUMENT DEVELOPMENT… CONTINUED…
17:00 CLOSE – DAY 1
WEDS 11TH JULY
09:00 ARRIVAL/COFFEE/BISCUITS
DAY 2 - EMERGING TECHNOLOGIES AND ENGAGEMENT STRATEGIES
WHAT ROLE CAN DIGITAL CAMERA MONITORING OF BOAT RETRIVALS PLAY IN INFORMING FISHERIES MANAGEMENT (HARTILL – NIWA)
INTEGRATING REMOTE CAMERA DATA AND AERIAL SURVEYS INTO THE MONITORING OF TWO WA REC FISHERIES (TAYLOR- DPIRD)
10:30 MORNING TEA
HIGH RESOLUTION CAMERA WORK (CRAGS) (LYNCH – CSIRO)
CAN 'DECKHAND' TRANSITION FROM THE COMMERCIAL TO THE RECREATIONAL SECTOR? (DICK – DECKHAND)
13:00 LUNCH
GENERAL/OPEN DISCUSSION – SURVEY INSTRUMENT DEVELOPMENT
WHY AND WHEN TO USE TECH

29
15:30 AFTERNOON TEA
IMPROVED DATA ON ABORIGINAL AND TORRES STRAIT ISLANDERS FISHERIES RESOURCE USE TO BETTER INFORM COMMUNITY PLANNING AND AGENCY DECISION-MAKING (HOLLAND – PIRSA)
EXPECTATIONS OF THE RECREATIONAL SECTOR (CLEARY – ARFF)
GENERAL/OPEN DISCUSSION – SURVEY INSTRUMENT DEVELOPMENT
ENGAGEMENT STATEGIES, EXPERIENCES, SUCCESSES
17:30 CLOSE – DAY 2
19:00 MOSELEY BAR & KITCHEN (DINNER – **EXCLUDING ALCOHOL**)
THURS 12TH JULY
09:00 ARRIVAL/MORNING TEA
DAY 3 - NATIONAL SOCIAL AND ECONOMIC SURVEY OF RECREATIONAL FISHERS
A NATIONAL SOCIAL AND ECONOMIC SURVEY: OPTIONS (MOORE – ABARES)
10:30 MORNING TEA
GENERAL/OPEN DISCUSSION - BEST WAY FORWARD FOR A NATIONAL SOCIAL AND ECONOMIC SURVEY
13:00 LUNCH
GENERAL/OPEN DISCUSSION - BEST WAY FORWARD FOR A NATIONAL SOCIAL AND ECONOMIC SURVEY CONTINUED…
14:30 END

30
Appendix 4: Don’t throw the baby out with the bath water
Dr Jeremy Lyle- IMAS, Tasmania

31

32

33
Appendix 5: Applying innovation to off-site survey designs and statistical methods
Dr Karina Ryan- DPIRD, Western Australia (Appendix 5)

34

35

36
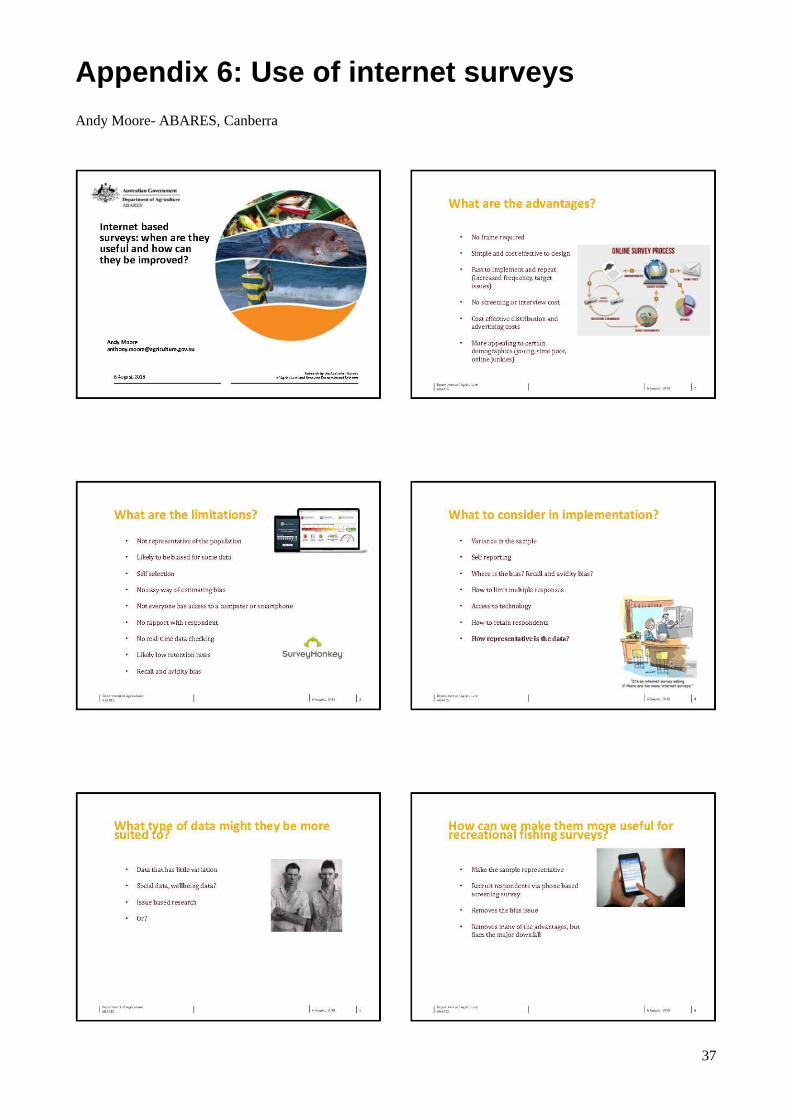
37
Appendix 6: Use of internet surveys
Andy Moore- ABARES, Canberra

38

39
Appendix 7: What role can digital camera monitoring of boat retrievals play in informing fisheries management
Bruce Hartill- NIWA

40

41

42
Appendix 8: Integrating remote camera data and aerial surveys into the monitoring of two WA recreational fisheries
Steve Taylor- DPIRD, Western Australia

43
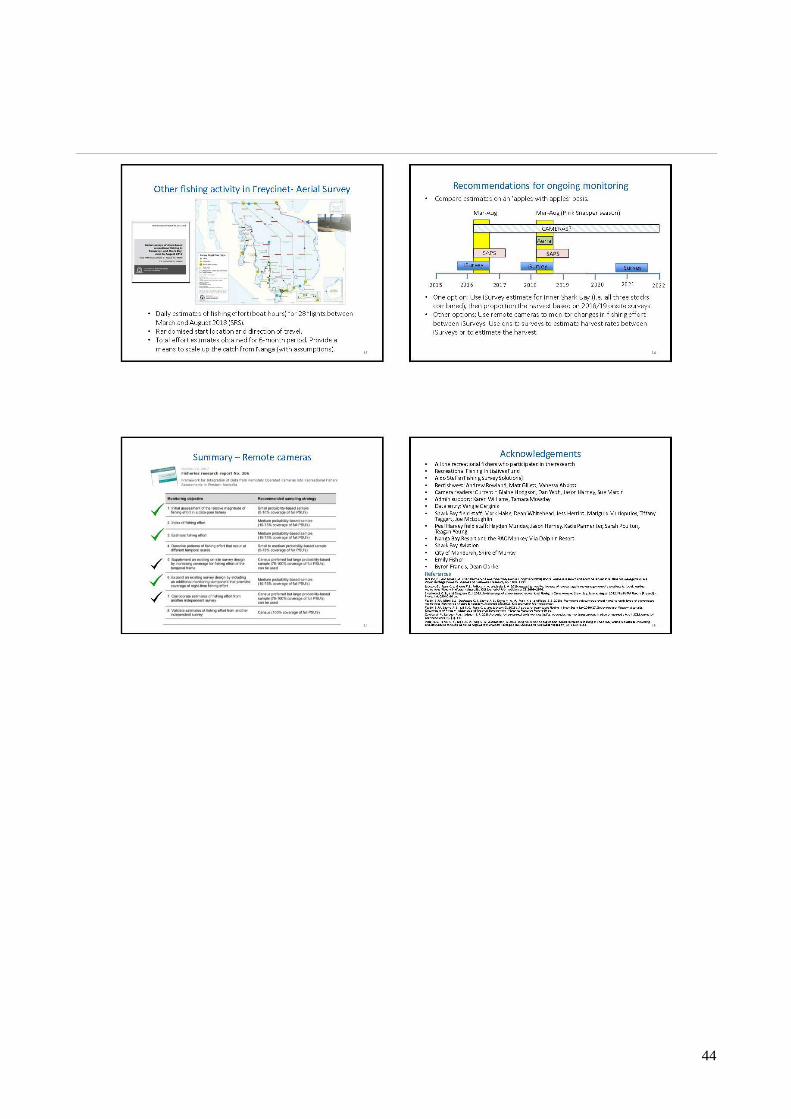
44
45
Appendix 9: A national social and economic survey: options
Andy Moore- ABARES, Canberra
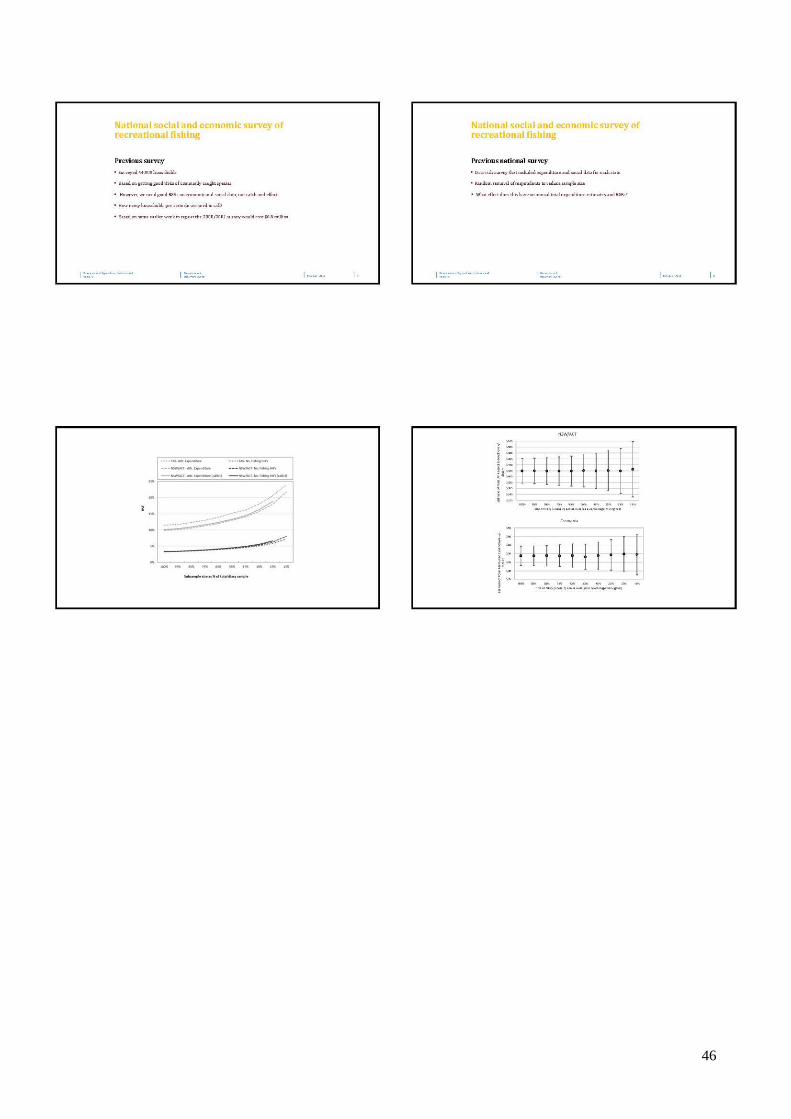
46