Embed Size (px)
Citation preview
Internet and Online Media Usage on Mobile Phones
among Low-Income Urban Youth in Cape Town1
Tino Kreutzer2
“Mobile 2.0: Beyond Voice?”
Pre-conference workshop at the International Communication Association (ICA)
Conference
Chicago, Illinois
20 – 21 May 2009
1 Some rights reserved: This work is licensed under a Creative Commons Attribution-Share Alike 3.0 Unported License.
Complete results, survey topline, questionnaire and dataset are available on tinokreutzer.org/mobile
2 Centre for Film and Media Studies
University of Cape Town
Internet and Online Media Usage on Mobile Phones among Low‐Income Urban Youth in Cape Town
1
Abstract
Cell phones introduce a range of new possibilities for social networking and communication,
media use and production, political activism, as well as education. Young people in South Africa have
adopted a range of innovative communicative practices, notably those which exploit low-cost mobile
applications, as well as a growing host of rich-media and Internet-based applications. Until now, little
quantitative data has been available to describe exactly to what extent and how young people access
and use cell phones.
This paper reports an extensive study, which surveyed 500 students from very low-income
areas in Cape Town, South Africa. The students reported intensive use of cell phones, at a level which
overshadows their use of less widely accessible technologies such as desktop computers. Notably, the
extensive use of mobile Internet applications which students reported shows that many young urban
South Africans first access the Internet via their phones, and that their concepts of the Internet and
media in general are consequently strongly shaped by a distinct set of mobile applications.
An exploratory technology usage approach was chosen to determine the extent to which very
specific cell phone applications are used. An extensive questionnaire was distributed to students from
grade 11 classes in 10 school (n=500). The schools are located in the city’s bottom 50% most
deprived areas – often serving communities in extreme poverty. The findings can be used to describe
the character of cell phone usage among low-income urban South Africans in this age group. Various
qualitative methods and a rigorous pilot study were used to provide further depth to the findings.
Detailed activity-based questions indicate that virtually all respondents (97%) were found to
have used a cell phone on the previous day for at least one communication, information-seeking,
gaming or multimedia activity. The high usage patterns and expenditures on conventional telephony
are particularly surprising given the low income levels that prevail in these areas. Interpersonal
communication was the most common use of phones, with 91% of respondents making calls or sending
SMS messages on a typical day.
Despite the near-universal use of cell phones among all respondents, a significant minority
(25%) of the sample did not own their own personal handset. While phone ownership correlated
strongly with a sense of economic deprivation, there was no significant difference in phone usage
patterns between this apparently more impoverished group, who used and borrowed other peoples’
phones, and the possibly more well-to-do group of phone owners.
In particular, however, the pilot suggests the possibility that the majority of urban South
Africans in this age group can and do access the Internet via their phones (83% were found to so on a
typical day). The popularity of Web access, instant messaging and other applications within this group
suggests that their use of the Internet differs from those whose access is primarily via desktop devices.
Internet and Online Media Usage on Mobile Phones among Low‐Income Urban Youth in Cape Town
2
These findings have significant implications for mobile media and social development applications, as
does the fact that a majority of students also reported gaming on their phones on a typical day (53%).
These detailed findings provide rich and novel insight into the increasingly advanced usage
patterns of cell phones among low-income South African youth. The paper points to a growing
competition between cell phones and established media, particularly the computer-based Internet,
newspapers, and magazines and calls for an increase in research on mobile media and the mobile
Internet.
Introduction
Mobile phones have long surpassed traditional landlines as the most common voice
communication technology – particularly due to the marked growth in new mobile phone users in most so-
called developing countries (Feldmann, 2003). In South Africa, a country still trying to escape its legacy
of dramatic racial inequalities, mobiles have enjoyed spectacular growth over the past decade, with more
than 60% of all South Africans above the age of 16 already owning a phone themselves (Research ICT
Africa [RIA], 2009; All Media and Product Survey [AMPS], 2008). This rapid growth – up from just 18%
in 2000 (International Telecommunications Union [ITU], 2001) – is at least partly due to the immense
popularity of prepaid subscriptions and low-cost phones (Hodge, 2005; Esselaar & Stork, 2005), which
have made it possible even for many of the country’s youth (most of whom remain in stark poverty) to
own or use a phone themselves. But this growth extended beyond the number of young people texting or
calling each other: As early results of this study have indicated (Kreutzer, 2008), urban South African
youth have long begun to seize on the mobile phones available to them to ardently make use of the
Internet – defying an environment with extremely scarce computer-based Internet access.
This observation coincides with the enormous popularity of the mobile instant messenger MXit
over the past two years (Francke & Weideman, 2007), which requires an Internet connection to transmit
its messages. According to several respondents interviewed for this study, many youths had only enabled
their phones for Internet access for this specific purpose, while usage of other resources on the Web
followed suit for many of them – especially with the intention of downloading videos and music.
The importance of this transition becomes evident if one looks at the level of ICT available to the
majority of South African students. Research ICT Africa found only 15% of all households to have a
working computer, while just 5% reported having ‘a working Internet connection’ (RIA, 2009). Even
computers and Internet access at schools have only recently started to become available to the majority of
South African sub-elite schools, but often remain behind their actual potential (Prinsloo & Walton, 2009).
This study reports on a specific set of results obtained from a detailed quantitative survey,
conducted in October, 2008 on a broad array of mobile phone usage among grade 11 students in high-
deprivation areas in Cape Town (Kreutzer, 2009). In particular, as this study follows a mass
Internet and Online Media Usage on Mobile Phones among Low‐Income Urban Youth in Cape Town
3
communication and media science perspective and focuses mostly on usage of online media3, it will not
merely address the question of access to or adoption of mobile phones, computers, or the Internet. Rather,
it assesses their detailed usage based on a multitude of activities, with specific focus on the following
questions: How can students’ use of the Internet, and in particular of online media be characterized?
What are the patterns of phone ownership, and to what extent do students access and use specific handsets
and their features? Can we detect significant differences for users in this population, based on ownership,
gender, language groups, academic or socioeconomic status?
The Digital Divide(s) – and the need for more usage-based data
Research focusing on measuring ownership or access to mobile phones suggests often a
dichotomy based on haves and have-nots. The underlying digital divide paradigm has often been
politicized, usually concentrating on population groups or countries with significantly lower access to
such technologies. Further studies linking access to ICT to economic progress (Norris, 2001) have
increasingly cemented the importance of binary access or ownership data. But the actual merit of such
numbers and the digital divide concept is contested (Warschauer, 2003).
South Africa’s ‘digital divides’ follow shifting and complex lines. Some distinctions demarcate
the computer-based information practices of much wealthier (though very small) upper and middle classes
from the analog sources available to the impoverished majority. Other divides, such as the inequalities of
access to computers and the Internet within the education system, indicate how South Africa has failed to
achieve redress for the formerly racial basis of resource allocation that characterized so-called Bantu
education under apartheid. This study shifts attention to the ways in which, for many young South
Africans, the relatively inexpensive mobile phone handsets are fast becoming the Internet platform and
multimedia device of their choice – regardless of whether an individual owns a phone with a given feature,
or merely accesses it through a friend or family member. Although this does not mark the end of the
digital divide paradigm, it questions the validity of a clear-cut division based merely on access or adoption,
while the actual lines between Internet users and non-users might be much harder to draw (ITU, 2007).
There is a growing wealth of data and analyses of mobile phone usage in South Africa and several other
3 This study puts significant emphasis on the distinction between the Internet and the World Wide Web, stemming from a technical as well as from a mass media perspective. Thereby, the Internet is considered an application‐neutral technology of interconnected computer networks, or rather, the underlying infrastructure that is used by various applications, including the interlinked pages of the (World Wide) Web. The Web, on the other hand, is used synonymous with online media within this study, referring to mass media accessible through the Internet. I use the term Web to include hypertext pages and publicly accessible audiovisual content of all kind, or in short, content that is viewable in a Web browser. ‘Mobile Web’ thereby simply means ‘the Web accessed through a mobile phone’. The term excludes, however, instant messaging applications, email, and other programs using non‐http protocols. As we are witnessing an increasing integration of such applications into the Web browser format, it is important that this study’s usage of the term Web is thus mostly adhering to a mass media point of view rather than a strictly technical one.
Internet and Online Media Usage on Mobile Phones among Low‐Income Urban Youth in Cape Town
4
developing nations, often with an underlying interest in attaining certain development goals with this new
technology (Donner, 2008), though many studies still follow the binary idea of technology adoption.
Quantitative research into mobile phone use is often motivated by the need to document diffusion
of technology in a particular country as an index of its level of or readiness for development (e.g.
Waverman, Meschi & Fuss, 2005; Heeks & Jagun, 2007) – and as an indicator of potential market
opportunities (Goldstuck, 2007). In the case of young people, interest has focused on potentially beneficial
applications of mobile phone use, such as health and education projects or ‘m-Learning’ (Attewell &
Savill-Smith (Eds.), 2005) as well as other pointed ‘mobile for development’ projects (Donner, Verclas &
Toyoma, 2008). These studies are at least partially motivated by an interest in designing technologies with
more appeal to the large potential market of people at the ‘Base of the Pyramid’, a term referring to a
society’s least affluent but often most numerous members (Prahalad, 2005).
A small number of researchers (e.g. Donner, 2007; Zainudeen, Sivapragasam, de Silva, Iqbal, &
Ratnadiwakara, 2007; Chipchase, 2006), with an interest in better understanding the markets for mobile
technologies and services in developing countries, focus on investigating the ways in which poverty and a
lack of other technological infrastructure mean that people use mobile phones very differently in these
contexts. While these studies highlight the non-binary reality of mobile phone usage, there have not been
in-depth studies further embracing cultural and sociological questions that have been discussed in much
depth in wealthy nations (e.g. Ito & Okabe, 2005; Rheingold, 2003; Ling & Yttri, 2002; Ling, 2004; Katz
& Sugiyama, 2006).
Reliable figures for mobile Internet use in South Africa have so far been difficult to assess, as
most of the data available focuses on broad figures of overall access to mobile phones – provided either
by the networks themselves (e.g. Goldstuck, 2007; Sutherland, 2008) or through nationally representative
household or individual surveys (e.g. All Media and Products Survey (AMPS), 2008; Esselaar, Gillwald,
& Stork, 2007; Kaiser Family Foundation and South African Broadcasting Corporation (KFF/SABC),
2006). Such research has shown, for example, that 67% of South Africans ‘own a cell phone’ (AMPS,
2008) or that 62% ‘own a mobile phone or an active SIM card’ (Research ICT Africa (RIA), 2009).
Similarly, 72% of 15 to 24-year-olds reported to ‘have a cell phone’ (KFF/SABC, 2006), whereas Tlabela
et al. (2007) found only 33% of South African households to be ‘households with access to cell phones’.
RIA (2009) shows 15% of South African households have ‘a computer at home’, while 5% of households
have ‘a working Internet connection’.
As a result, we know more or less how many South Africans have access to mobile phones, and
what kind of things researchers and activists think they should be doing with the phones for
developmental purposes. In contrast, we know very little about how South Africans actually choose to use
mobile phones to access information or entertainment media or to create and distribute their own media.
Internet and Online Media Usage on Mobile Phones among Low‐Income Urban Youth in Cape Town
5
Methodology
Sample and field access
Data was collected as random clustered availability samples without the intention of making large
generalizations about secondary school students or even South African youth as a whole. This method was
chosen for economical reasons and to achieve a larger sample size than would otherwise have been
feasible through random sampling. However, by using full classrooms, we can account for significant
heterogeneity within a given school, and by extension, the neighborhood in which it is located.4 Common
knowledge about Cape Town – and South Africa in general – points to very stark socio-economic
variation between different neighborhoods and schools (owing to the legacy of apartheid policies) that
need to be considered for proper research design (Bhorat & Kanbur, 2006; Lam et al, 2008).
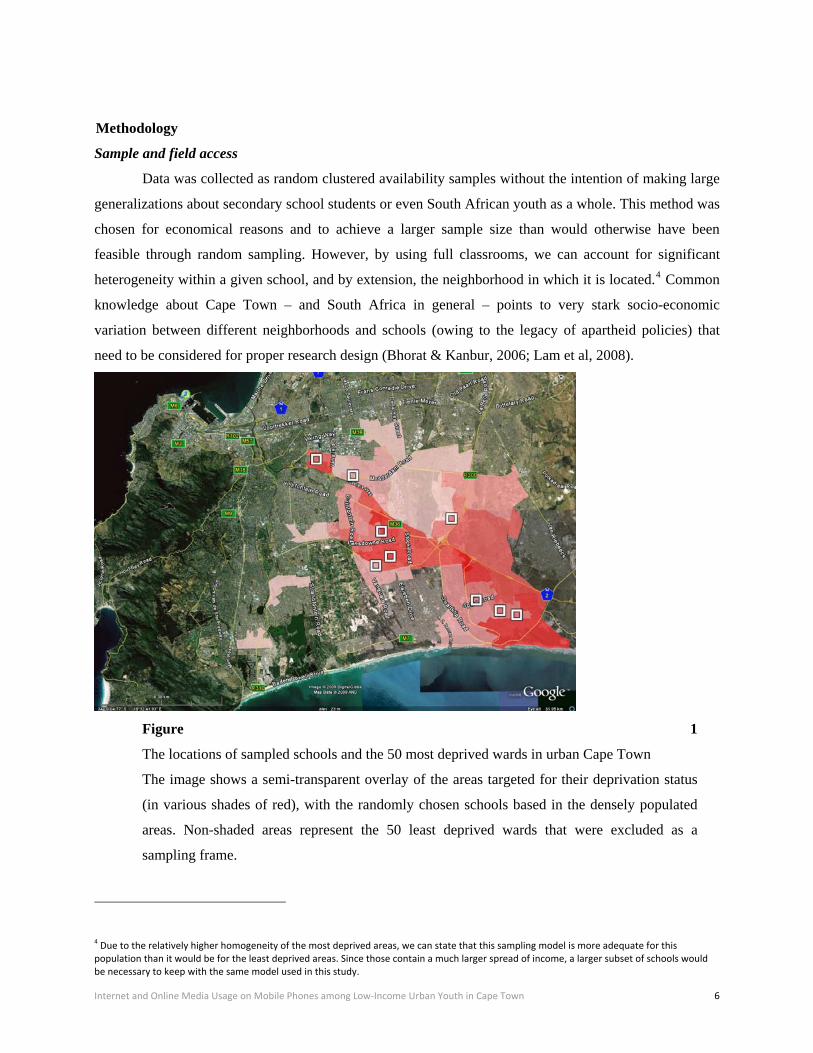
Figure 1
The locations of sampled schools and the 50 most deprived wards in urban Cape Town
The image shows a semi-transparent overlay of the areas targeted for their deprivation status
(in various shades of red), with the randomly chosen schools based in the densely populated
areas. Non-shaded areas represent the 50 least deprived wards that were excluded as a
sampling frame.
4 Due to the relatively higher homogeneity of the most deprived areas, we can state that this sampling model is more adequate for this population than it would be for the least deprived areas. Since those contain a much larger spread of income, a larger subset of schools would be necessary to keep with the same model used in this study.
Internet and Online Media Usage on Mobile Phones among Low‐Income Urban Youth in Cape Town
6
In order to concentrate on ‘low-income’ youth for this study, a novel approach had been chosen:
By using the selection factor of relative deprivation, I was able to account for a much broader and more
reliable measure of poverty than by simply using average income levels (cf. Townsend, 1979). The basis
for selection in this research was drawn on the Provincial Indices of Multiple Deprivation for the Western
Cape province (Noble et al., 2006; Barnes, Wright, Noble, & Dawes, 2007). Through this index, the
bottom 50% (i.e. most deprived) of all electoral wards in the Cape Town municipal area were included for
the purpose of identifying the location of schools to be targeted through random cluster sampling.5 Public
secondary schools located in these areas were chosen randomly, while in each participating school one or
two full classrooms were chosen as an availability or convenience subset as the first general class(es)6 to
become available after arriving at the school. This process was continued until a minimum sample size of
400 students was achieved.7
Of the total sample of 441 respondents, the average age was 17.8 (SD = 1.49), which may reflect the
relatively late enrollment age for many South Africans (Lam et al, 2008). 79% mentioned Xhosa as one of
their home languages, while 53% did so for English, and 17% for Afrikaans. Asked for their racial self-
categorization, 78% considered themselves as black and 17% as coloured. 60% of respondents were
female, mirroring 2001 census data on school attendance in this age group (STATSSA, 2001).8 However,
the sample does not include a sizable share of the overall population in the targeted area within this age
bracket who no longer attend school.9 Due to the small number of cluster samples and the high level of
uncertainty regarding the exact strata found in the overall population, survey weights have not been used
as it would only imply an inappropriate level of representativeness that is neither desired, nor warranted
by this study’s approach and data.
Procedure/Data Collection
The survey took place as a planned classroom activity for the students, with the prior permission of
the Western Cape Department of Education, thereby receiving legal consent from the responsible teacher
5 Three electoral wards were excluded due to their very large size and very unequal population distributions. These include the Atlantic Seaboard area (Camps Bay to Hout Bay, which includes the Imizamu Yethu township), the Noordhoek‐Fishhoek area (which includes the Masiphumelele township), and the widespread northern area (mostly rural, also includes the Witsrand and Vissershoek townships). For these areas it would not be possible to choose random schools as low‐income areas are very small and are surrounded by far more affluent suburbs. 6 Only so‐called general classes were considered for participation, as smaller specialized classes (science, accounting, etc) would have led to an uncontrollable pre‐selection bias. 7 In total, 16 schools had to be selected in the process to reach the desired sample size. Of those, two could not be reached due to invalid phone numbers, two declined due to time constraints, and three had to be dismissed because continued delaying would have jeopardized the project’s time frame, which was limited to the pre‐exam period. 8 The census showed that, in 2001, 58% of 16 to 19‐year‐olds within the 50 targeted most deprived electoral wards were female. The gender ratio of school attendance for the excluded 50 electoral wards in the same age group, according to the census data, lies at 50 percent. The stronger imbalance for poorer neighborhoods indicates a stronger pressure (or willingness) for male students to drop out of school earlier. 9 19% of 17‐year‐old South Africans are not attending any form of educational institution; in Cape Town, this rate is even higher at 23% (STATSSA, 2008; STATSSA, 2001). Cape Town is below the national average for those not attending any education form within all ages surveyed by the census, beginning with age 16.
Internet and Online Media Usage on Mobile Phones among Low‐Income Urban Youth in Cape Town
7
(as well as the individual students themselves). The questionnaire booklet was handed out by the
researcher in the presence of the teacher to all students of a particular class. The students were briefed that
their answers are treated anonymously and independent from the school authorities. As a result, 100%
response rate and thus a complete picture of the surveyed classrooms could be achieved. On average
across all classes, 9% of students were found to be absent based on school registries.10
The questionnaire was in simplified English and has been piloted previously (Kreutzer, 2008) for
optimal comprehension and design, while translations or multilingual questionnaires were thoroughly
considered but ultimately ruled out after interviews with respondents showed that such a move would be
perceived as “patronizing” and might inflict a negative bias against the researcher. Poor reading skills,
regardless of the language, were a larger challenge for respondents, which was reflected in the large
difference in time required to fill out the questionnaire (ranging from 30 to 50 minutes).
Variables
The questionnaire consisted of 48 questions on 13 pages, and included predominantly closed-ended
rating scale questions (Likert scales) or multiple choice items. Several open-ended questions offered the
respondents the chance to provide answers in more detail. The survey resulted in 299 direct variables, of
which several are grouped into multiple response sets or represent variations of the same theme question.
Several additional variables have been recoded from the results to provide a broader measure of a given
problem, including relative deprivation, technology ownership and usage, the different activity indices,
and others.
Questions asking subjects about their use of certain technologies (or specific applications therein)
were modeled after the Pew Internet & American Life surveys (Pew Internet, 2006; Horrigan, 2008) to
avoid the “recall problem” (Deacon et al, 2007, p. 72): Respondents are asked whether they have ever
used a technology or application, and whether they have done so yesterday – an important technique also
used in this study. The findings provide us with reliable figures for absolute usage as well as for a typical
day by asking about the most recent use on the previous day. (When conducting the survey on a Monday,
respondents were asked to refer to Friday instead.)
The absence of commonly accepted terminology was a major challenge for this study. Questions
using terms such as online, Web, Internet and similar terms have varying meanings for different people
(Horst & Miller, 2006) and have thus been largely excluded from the survey. As was demonstrated in the
pilot stages, outright questions, such as ‘have you used a mobile phone yesterday’11, have only a very
limited validity: There were no differences between respondents answering ‘yes’ and ‘no’ to this question,
10 Though this number may appear high to some standards, most teachers could not make out the names or the number of those absent in a given lesson. In addition, some classrooms did not have enough tables or chairs even to fit those present. 11 In the questionnaire and in the pilot study, the term ‘cell phone’ rather than ‘mobile phone’ has been used, as this is the most widely used term in South Africa.
Internet and Online Media Usage on Mobile Phones among Low‐Income Urban Youth in Cape Town
8
as both groups had in fact done the same number of activities on a mobile phone on the previous day. This
was revealed by asking detailed activity questions, some of which may not be associated by subjects with
the phrase ‘using a mobile phone’. The reason for the accuracy of this question type, as conversations
have shown, is largely due to varying concepts of technology usage: ‘Using a mobile phone’ is sometimes
considered as synonymous for using traditional phone applications, rather than referring to advanced uses
such as browsing the Web or using instant messaging clients.
Results and Discussion
The survey conclusively supports very high, if not quite universal usage of mobile phones among
respondents. Almost all targeted students reported having used a mobile phone on the previous day, while
only 4% said they had used one in the past but not ‘yesterday’. Fifty-two variables were used to create a
detailed account of the activities for which respondents reported using mobile phones. While no such list
of variables can ever be complete, the final survey included several additions that respondents had
suggested during the piloting stages, or which had been gleaned from the interviews and observations
reported earlier. Overall, the results suggest the key role of online and digital media in comparison to other
mobile phone applications, a preference which also emerges strongly when compared to traditional mass
media use by respondents.
Ownership vs. Usage
More than three-quarters (77%) of respondents reported that they owned a personal handset rather
than using or sharing someone else’s phone (18%). A small minority uses someone else’s phone but own a
personal SIM card (4%). Less than 1% claimed not to use mobile phones, or said that their phone had been
stolen recently. Nonetheless, even respondents in this group have all used several mobile phone
applications in the past, as could be seen in their responses to the other usage-related questions in the
survey. For this reason, all respondents can be termed ‘mobile-phone users’, although this group includes
both mobile owners and ‘co-users’12. It should be noted that practically all respondents were found to
sometimes use other phones for access to more advanced technical features, even if they owned a personal
handset. ‘Co-users’, however, is used to refer to only those individuals not owning a personal mobile
phone.
There is a statistically significant difference in social comparison levels for economic status (t(337)
= 2.557, p = .011) as well as academic standing (t(333) = 2.581, p = .01) within the classroom: Students
who do not own their personal phone consider themselves as worse off economically and academically
12 For the sake of comparison, this group includes those saying they own a SIM card, and the small number (n = 3) who said they do not use mobile phones, but responded positively about having used several features in the past or even on the previous day. The term ‘co‐users’ is used to describe these respondents who do not own a personal handset, but have used a mobile phone for at least one application ‘ever’ or ‘yesterday’.
Internet and Online Media Usage on Mobile Phones among Low‐Income Urban Youth in Cape Town
9
than their phone-owning classmates. This important perceived lower socioeconomic status would confirm
theories of the digital divide (Mehra et al., 2004), whereby the absence of a technology (originally
computers, later the Internet) leads to a marginalization within society. However, the data does not support
actual marginalization, nor can it indicate any causal relationship; it merely refers to students’ perception
of being at an inferior scholastic and economic level than their peers.
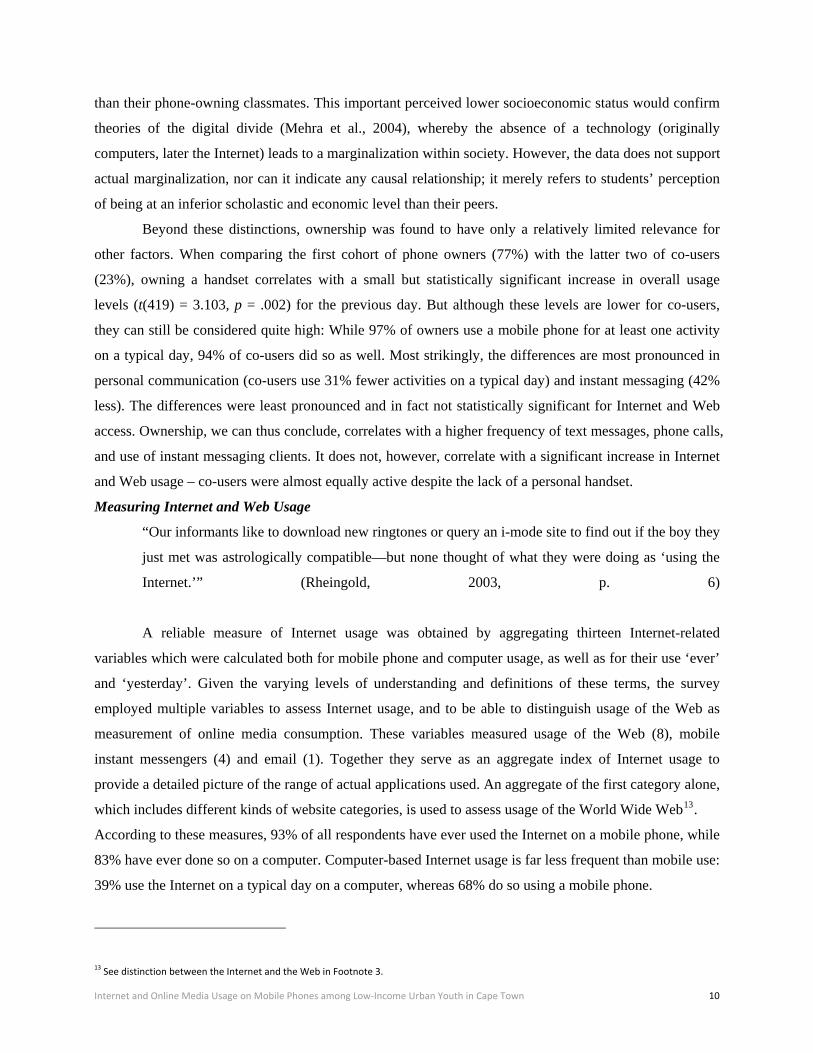
Beyond these distinctions, ownership was found to have only a relatively limited relevance for
other factors. When comparing the first cohort of phone owners (77%) with the latter two of co-users
(23%), owning a handset correlates with a small but statistically significant increase in overall usage
levels (t(419) = 3.103, p = .002) for the previous day. But although these levels are lower for co-users,
they can still be considered quite high: While 97% of owners use a mobile phone for at least one activity
on a typical day, 94% of co-users did so as well. Most strikingly, the differences are most pronounced in
personal communication (co-users use 31% fewer activities on a typical day) and instant messaging (42%
less). The differences were least pronounced and in fact not statistically significant for Internet and Web
access. Ownership, we can thus conclude, correlates with a higher frequency of text messages, phone calls,
and use of instant messaging clients. It does not, however, correlate with a significant increase in Internet
and Web usage – co-users were almost equally active despite the lack of a personal handset.
Measuring Internet and Web Usage
“Our informants like to download new ringtones or query an i-mode site to find out if the boy they
just met was astrologically compatible—but none thought of what they were doing as ‘using the
Internet.’” (Rheingold, 2003, p. 6)
A reliable measure of Internet usage was obtained by aggregating thirteen Internet-related
variables which were calculated both for mobile phone and computer usage, as well as for their use ‘ever’
and ‘yesterday’. Given the varying levels of understanding and definitions of these terms, the survey
employed multiple variables to assess Internet usage, and to be able to distinguish usage of the Web as
measurement of online media consumption. These variables measured usage of the Web (8), mobile
instant messengers (4) and email (1). Together they serve as an aggregate index of Internet usage to
provide a detailed picture of the range of actual applications used. An aggregate of the first category alone,
which includes different kinds of website categories, is used to assess usage of the World Wide Web13.
According to these measures, 93% of all respondents have ever used the Internet on a mobile phone, while
83% have ever done so on a computer. Computer-based Internet usage is far less frequent than mobile use:
39% use the Internet on a typical day on a computer, whereas 68% do so using a mobile phone.
13 See distinction between the Internet and the Web in Footnote 3.
Internet and Online Media Usage on Mobile Phones among Low‐Income Urban Youth in Cape Town
10
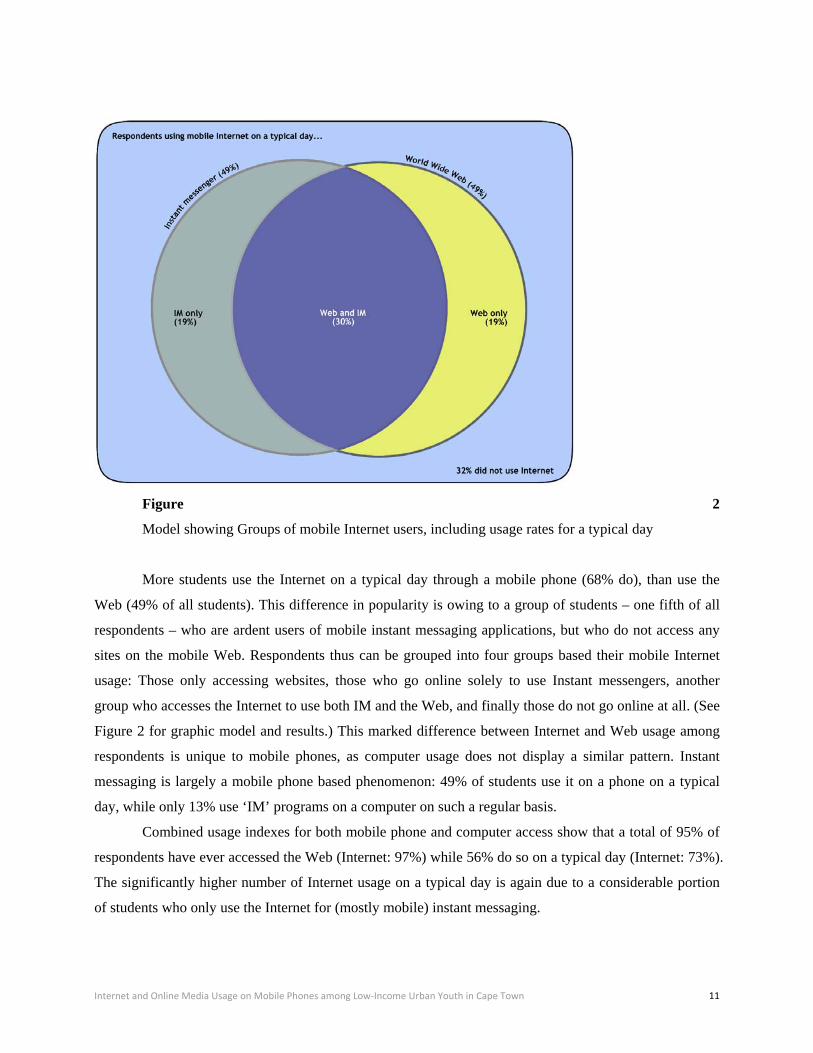
Figure 2
Model showing Groups of mobile Internet users, including usage rates for a typical day
More students use the Internet on a typical day through a mobile phone (68% do), than use the
Web (49% of all students). This difference in popularity is owing to a group of students – one fifth of all
respondents – who are ardent users of mobile instant messaging applications, but who do not access any
sites on the mobile Web. Respondents thus can be grouped into four groups based their mobile Internet
usage: Those only accessing websites, those who go online solely to use Instant messengers, another
group who accesses the Internet to use both IM and the Web, and finally those do not go online at all. (See
Figure 2 for graphic model and results.) This marked difference between Internet and Web usage among
respondents is unique to mobile phones, as computer usage does not display a similar pattern. Instant
messaging is largely a mobile phone based phenomenon: 49% of students use it on a phone on a typical
day, while only 13% use ‘IM’ programs on a computer on such a regular basis.
Combined usage indexes for both mobile phone and computer access show that a total of 95% of
respondents have ever accessed the Web (Internet: 97%) while 56% do so on a typical day (Internet: 73%).
The significantly higher number of Internet usage on a typical day is again due to a considerable portion
of students who only use the Internet for (mostly mobile) instant messaging.
Internet and Online Media Usage on Mobile Phones among Low‐Income Urban Youth in Cape Town
11
Sources of Internet Usage
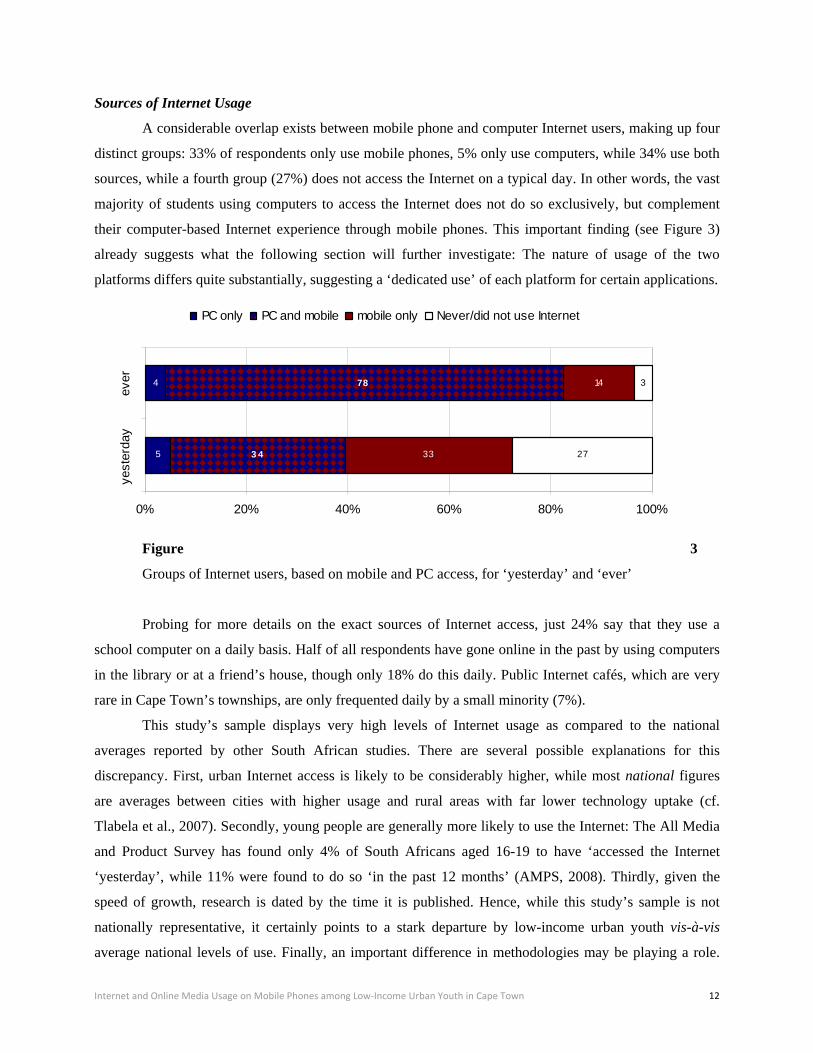
A considerable overlap exists between mobile phone and computer Internet users, making up four
distinct groups: 33% of respondents only use mobile phones, 5% only use computers, while 34% use both
sources, while a fourth group (27%) does not access the Internet on a typical day. In other words, the vast
majority of students using computers to access the Internet does not do so exclusively, but complement
their computer-based Internet experience through mobile phones. This important finding (see Figure 3)
already suggests what the following section will further investigate: The nature of usage of the two
platforms differs quite substantially, suggesting a ‘dedicated use’ of each platform for certain applications.
5
4
3 4
78
33
14
27
3
0% 20% 40% 60% 80% 100%
yest
erda
yev
er
PC only PC and mobile mobile only Never/did not use Internet
Figure 3
Groups of Internet users, based on mobile and PC access, for ‘yesterday’ and ‘ever’
Probing for more details on the exact sources of Internet access, just 24% say that they use a
school computer on a daily basis. Half of all respondents have gone online in the past by using computers
in the library or at a friend’s house, though only 18% do this daily. Public Internet cafés, which are very
rare in Cape Town’s townships, are only frequented daily by a small minority (7%).
This study’s sample displays very high levels of Internet usage as compared to the national
averages reported by other South African studies. There are several possible explanations for this
discrepancy. First, urban Internet access is likely to be considerably higher, while most national figures
are averages between cities with higher usage and rural areas with far lower technology uptake (cf.
Tlabela et al., 2007). Secondly, young people are generally more likely to use the Internet: The All Media
and Product Survey has found only 4% of South Africans aged 16-19 to have ‘accessed the Internet
‘yesterday’, while 11% were found to do so ‘in the past 12 months’ (AMPS, 2008). Thirdly, given the
speed of growth, research is dated by the time it is published. Hence, while this study’s sample is not
nationally representative, it certainly points to a stark departure by low-income urban youth vis-à-vis
average national levels of use. Finally, an important difference in methodologies may be playing a role.
Internet and Online Media Usage on Mobile Phones among Low‐Income Urban Youth in Cape Town
12
For example, the AMPS questionnaire asks subjects directly “Have you PERSONALLY accessed the
Internet/World Wide Web in the PAST 12 MONTHS [or YESTERDAY]?” (emphasis in original). As
discussed earlier, the term ‘Internet’ is commonly misunderstood, and is often not considered to include
instant messaging use. Consequently, it is possible that these national surveys may be underestimating
levels of Internet usage at least with regard to the current practices of younger urban respondents.
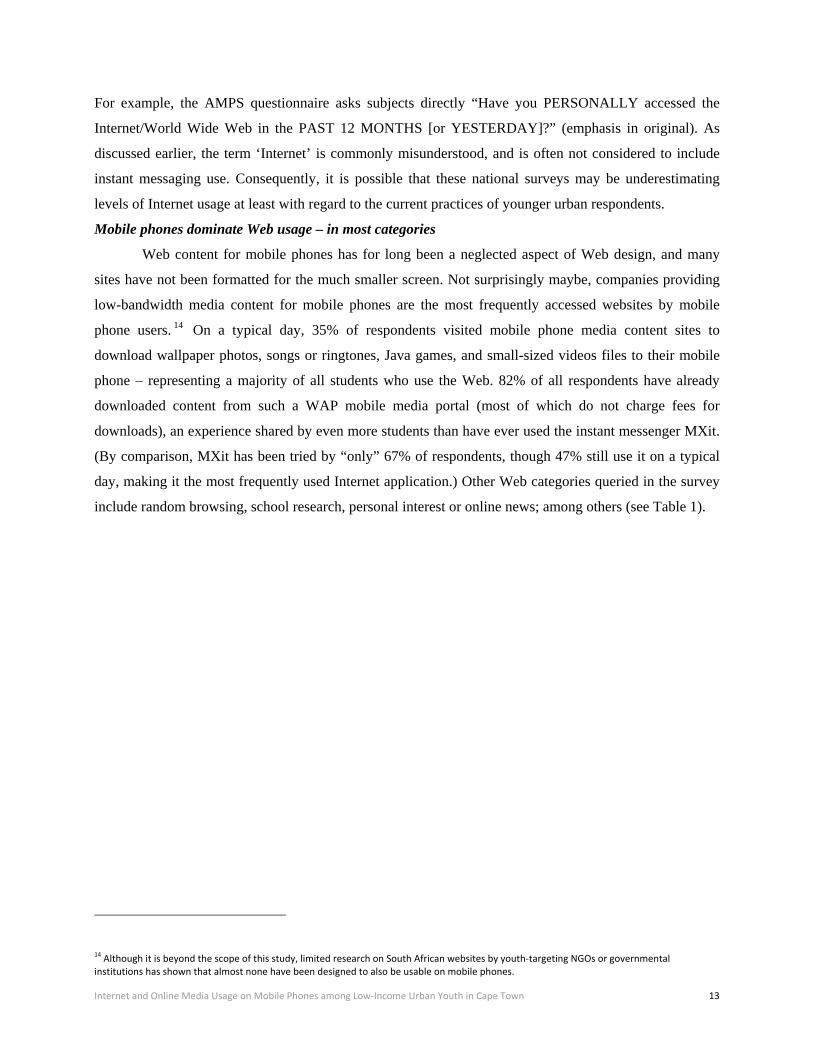
Mobile phones dominate Web usage – in most categories
Web content for mobile phones has for long been a neglected aspect of Web design, and many
sites have not been formatted for the much smaller screen. Not surprisingly maybe, companies providing
low-bandwidth media content for mobile phones are the most frequently accessed websites by mobile
phone users. 14 On a typical day, 35% of respondents visited mobile phone media content sites to
download wallpaper photos, songs or ringtones, Java games, and small-sized videos files to their mobile
phone – representing a majority of all students who use the Web. 82% of all respondents have already
downloaded content from such a WAP mobile media portal (most of which do not charge fees for
downloads), an experience shared by even more students than have ever used the instant messenger MXit.
(By comparison, MXit has been tried by “only” 67% of respondents, though 47% still use it on a typical
day, making it the most frequently used Internet application.) Other Web categories queried in the survey
include random browsing, school research, personal interest or online news; among others (see Table 1).
14 Although it is beyond the scope of this study, limited research on South African websites by youth‐targeting NGOs or governmental institutions has shown that almost none have been designed to also be usable on mobile phones.
Internet and Online Media Usage on Mobile Phones among Low‐Income Urban Youth in Cape Town
13
Mobile phone Computer
Ever
Yesterda
y
Ever
Yesterda
y
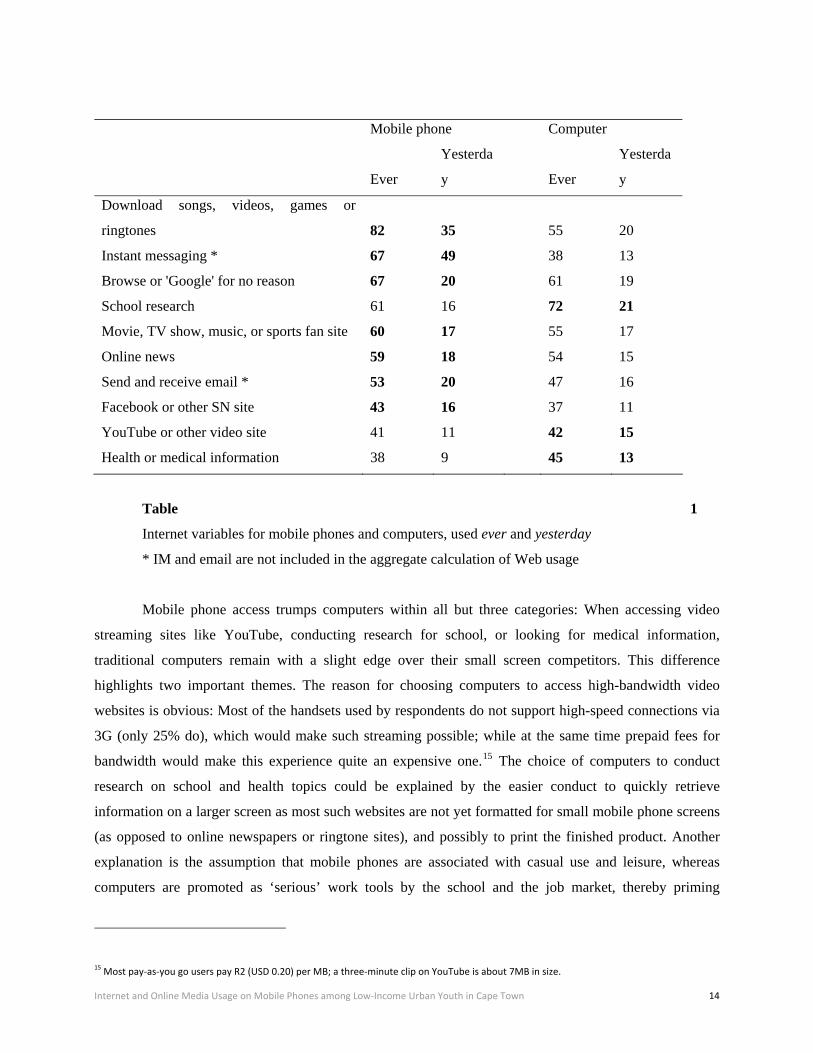
Download songs, videos, games or
ringtones 82 35
55 20
Instant messaging * 67 49 38 13
Browse or 'Google' for no reason 67 20 61 19
School research 61 16 72 21
Movie, TV show, music, or sports fan site 60 17 55 17
Online news 59 18 54 15
Send and receive email * 53 20 47 16
Facebook or other SN site 43 16 37 11
YouTube or other video site 41 11 42 15
Health or medical information 38 9 45 13
Table 1
Internet variables for mobile phones and computers, used ever and yesterday
* IM and email are not included in the aggregate calculation of Web usage
Mobile phone access trumps computers within all but three categories: When accessing video
streaming sites like YouTube, conducting research for school, or looking for medical information,
traditional computers remain with a slight edge over their small screen competitors. This difference
highlights two important themes. The reason for choosing computers to access high-bandwidth video
websites is obvious: Most of the handsets used by respondents do not support high-speed connections via
3G (only 25% do), which would make such streaming possible; while at the same time prepaid fees for
bandwidth would make this experience quite an expensive one.15 The choice of computers to conduct
research on school and health topics could be explained by the easier conduct to quickly retrieve
information on a larger screen as most such websites are not yet formatted for small mobile phone screens
(as opposed to online newspapers or ringtone sites), and possibly to print the finished product. Another
explanation is the assumption that mobile phones are associated with casual use and leisure, whereas
computers are promoted as ‘serious’ work tools by the school and the job market, thereby priming
15 Most pay‐as‐you go users pay R2 (USD 0.20) per MB; a three‐minute clip on YouTube is about 7MB in size.
Internet and Online Media Usage on Mobile Phones among Low‐Income Urban Youth in Cape Town
14
students to choose them over mobile phones on certain occasions. Individual conversations with students
have shown some support for both hypotheses, indicating a variety of individual reasons.
Google – and a long tail
Respondents were asked to provide examples of their most frequently accessed websites along
several categories (news, school, health, and leisure), as well as their favorite websites overall. Within
each category there was separate spacing for sites accessed from a computer, and from a mobile phone. In
total, respondents provided 2,115 valid website addresses or identifiable titles. The most striking
occurrence is Google – the search giant was mentioned in 37% of all instances, making it the most popular
website in each category and regardless whether a mobile phone or computer was used. No other site
enjoys anywhere near the same popularity. The next three sites, each enjoying about 6% of all responses,
are waptrick.com, nabster.wen.ru (both very basic WAP-formatted sites with media content of all kinds),
and Yahoo. The two WAP mobile media portals are exclusively made and designed for mobile phones,
and can be regarded as more of a portal with its own content, but also providing a host of links to very
similar-looking sites.16 The abovementioned four websites make up for 57% of all websites listed, with
the remainder being made up of a larger number of sites each mentioned less than 2%, respectively
(including Facebook or Wikipedia). This indicates a “long tail” of websites among students, though
Google is really the only item that dominates all categories as the “head” (cf. Anderson, 2006). Indeed, the
high prominence of Google as a universal multi-purpose point of entry for most topics (including news)
leads to believe that the ‘long tail’ is in fact a lot longer, as search results are used in lieu of favorite sites.
WAP media portals mentioned by respondents make up at least 15% (not all addresses have been
tested, so the actual number could be slightly higher), which indicates a significant and unique form of
online media that will require additional in-depth research to further our understanding of these sources.
MTN’s portal MTN Loaded17, a ‘walled garden’ portal offering limited news for free, as well as some
media content at significant additional costs to subscribers, enjoys fifth rank of all mentioned sites – but
that at just 2% of all sites listed. The importance here is hence the absence of walled garden portals among
students’ web usage, which depicts an obvious departure from the early years of WAP mobile phone
Internet access (as personal experience in Europe and North America suggests), when walled garden
portals were or still are the dominant Web resource whereby other websites were either disabled, or
charged at higher cost.
16 Several respondents named ‘napster.wen.ru’ or ‘napstar’ instead of the original site http://nabster.wen.ru/. But these sites, which obviously profit from their similar names, do exist – and offer almost the same content as the original. WAP media portals are often very similar in their design (also due to technical limitations), as well as in their organization of offered content. “Sexy videos” are often among the top categories, between MP3, wallpaper, or lyrics downloads. 17 MTN is the network used by 78% of respondents (15% said to use more than one SIM card); http://mtnloaded.mtn.co.za
Internet and Online Media Usage on Mobile Phones among Low‐Income Urban Youth in Cape Town
15
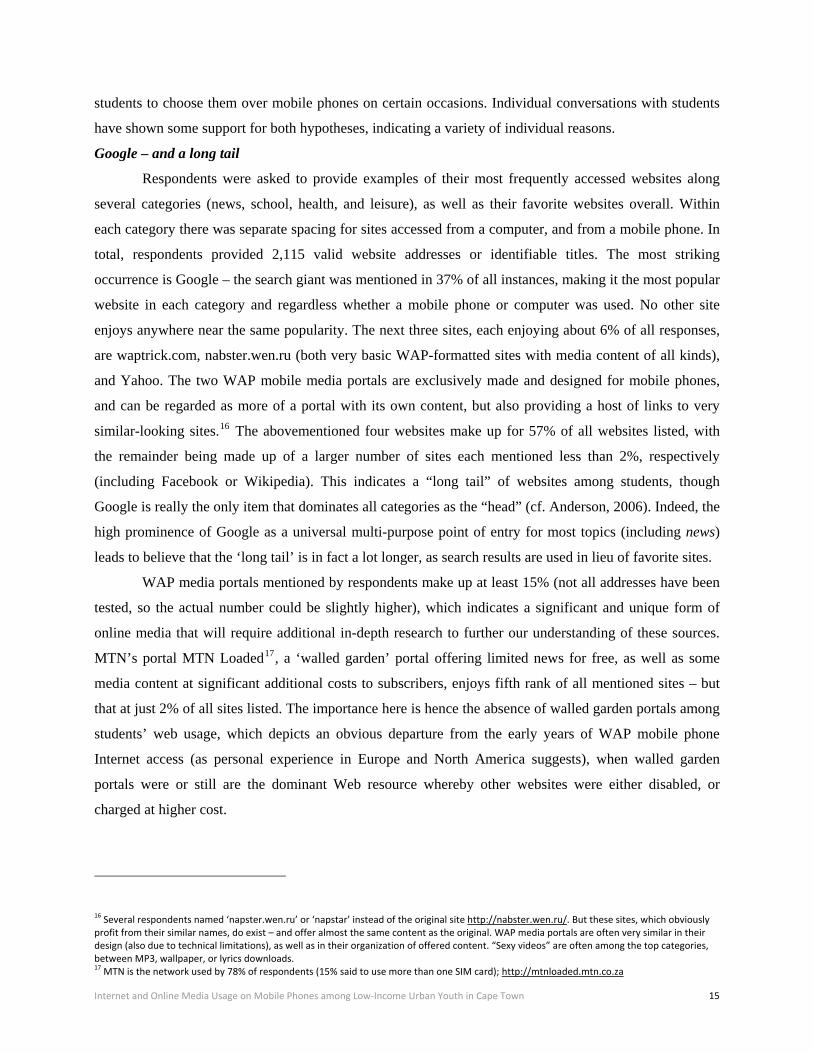
Comparing online and traditional media usage
Television sets are the device owned by most families (87%) according to respondents. Most other
technologies – including computers, game consoles, MP3 players, or digital cameras – constitute luxury
goods and are only found in less than 20% of households 18 . This relative scarcity of media-related
technologies emphasizes the importance of more sophisticated mobile phones among low-income youth
(Horrigan, 2008).
99
93
9895 96 96
88
8181
68 67
56
50 49 49
37
0%
20%
40%
60%
80%
100%
TV
Internet
(Cell
) *ra
dio
Web (C
el l &
PC)
magazin
e
newspa
per
Web (C
ell)
Web (
PC)
Ever
Yesterday
Figure 4
Comparison between different types of mass media and Web access by different sources
* this count contains non-Web usage (instant messaging, email), thus cannot be directly
compared to other media types
For all technologies assessed in this survey, the number of youths ever having used them
dramatically exceeds the number of owners – which becomes most obvious in the case of desktop
computers: 90% of respondents have used one in the past, but only 20% said to have one at home. The
special status of computers is likely to be related to many schools’ recently installed computer labs.
Interviews with students and school principles showed, however, that these labs are not always accessible
18 It should be kept in mind that very close proximity to neighbors and other family members within densely populated townships makes household ownership more difficult to assess since close and distant family members can occupy several houses or shacks, thereby stretching the concept of what is found in an ‘individual household’.
Internet and Online Media Usage on Mobile Phones among Low‐Income Urban Youth in Cape Town
16
for a number of reasons (access is prioritized for 12 graders or teachers, teachers often have insufficient
technical knowledge, and technical problems are frequent) (cf. Prinsloo & Walton, 2009).
It is important to understand Web usage in the context of overall media consumption (see Figure 4).
Besides the relatively high values of TV and radio access, just half of the students read magazines
or newspapers on the previous day (50% and 49%, respectively). When counting both computer and
mobile phone-based access, the share of respondents using the Web on a typical day (56%) is slightly
above that of newspaper and magazines, but remains behind TV and radio consumption (81% and 67%,
respectively). Of course, the intention for using these sources, the kind of content retrieved, and the civic
value attached to either of those media sources varies from case to case, given the relatively specific
nature of most newspapers, and the broader realm of the Web. Computer-based Web access is lowest in
this list with 37% accessing any website on a typical day.
Conclusion
This study set out to explore the usage of the mobile Web among low-income urban South
African youth as a contribution to a variety of related fields, but foremost to the discipline of media
studies. Media research has largely ignored the phenomenon of mobile phone based media access, and
particularly so in South Africa, where increasingly widespread access to more capable phones has
provided low-income urban youth with a personal and highly accessible gateway to access online media
and other services on the Internet. By using a quantitative approach, this study was able to provide
detailed data on the targeted population, as well as highlight statistically significant relationships between
different factors, such as mobile phone ownership which correlates with a perceived better academic
performance. In particular, the detailed, thoroughly field-tested survey was of key importance as it
provided a better methodological approach to answer questions about the actual usage of technologies,
rather than adoption, access, or ownership. By sampling youth from nine schools in Cape Town’s most
deprived neighborhoods (N = 441), this study did not intend to provide statistical representativeness of
low-income urban youth in South Africa. Rather, it set out to describe the emerging phenomenon of
intense usage of online and digital media on mobile phones among this volatile demographic group.
As has been emphasized throughout the study, there remain countless questions about the still largely
unknown patterns of media usage through mobile phones among South African youth. This study may
even have raised more questions than it has answered. But I am hopeful that the methodological
approaches proposed in this report will enable us to conduct a more fact-based discussion about the role of
mobile phones in the media landscape, and that the insights of this study could spark additional research
which to explore the many facets of this fascinating, fast-evolving field.
Internet and Online Media Usage on Mobile Phones among Low‐Income Urban Youth in Cape Town
17
References
AMPS (2008), 'All Media Products Survey - Publiciti AMPS 2008A', Retrieved on November 29, 2008,
from stand-alone database in the Commerce Library, University of Cape Town.
Anderson, C. (2006), The long tail: why the future of business is selling less of more, New York: Hyperion.
Attewell, J. & Savill-Smith, C., ed. (2005), Mobile learning anytime everywhere: A book of papers from
MLEARN 2004, London: Learning and Skills Development Agency, Retrieved on April 14, 2008
from
http://www.mobilearn.org/download/events/mlearn_2004/MLEARN_%202004_book_of_confere
nce_papers.pdf.
Barnes, H.; Wright, G.; Noble, M. & Dawes, A. (2007), The South African Index of Multiple Deprivation
for Children: Census 2001, Cape Town: HSRC Press.
Bhorat, H. & Kanbur, R. (2006), Poverty and Policy in Post-apartheid South Africa, Cape Town: Human
Sciences Research Council.
Chipchase, J. (2006), 'Tour Bus Ethnography', Blog post from January 14, 2006. Retrieved on April 14,
2008 from http://www.janchipchase.com/blog/archives/2006/01/post_30.html.
Deacon, D.; Pickering, M.; Golding, P. & Murdock, G. (2007), Researching Communications: A Practical
Guide to Methods in Media and Cultural Analysis, New York: Oxford University Press.
Donner, J. (2007), 'The Rules of Beeping: Exchanging Messages Via Intentional "Missed Calls" on
Mobile Phones', Journal of Computer-Mediated Communication, 13(1).
Donner, J. (2008), 'Research Approaches to Mobile Use in the Developing World: A Review of the
Literature', The Information Society, 24(3), 140 - 159.
Donner, J.; Verclas, K. & Toyama, K. (2008), 'Reflections on MobileActive 2008 and the M4D
Landscape', Retrieved December 26, 2008 from
http://mobileactive.org/files/DVT_M4D_choices_final.pdf.
Esselaar, S. & Stork, C. (2005), 'Mobile cellular telephone: Fixed-line substitution in sub-Saharan Africa',
South African journal of information and communication, 6, 64-73.
Esselaar, S.; Gillwald, A. & Stork, C. (2007), 'Towards an African e-Index 2007 - Telecommunications
Sector Performance in 16 African countries: a supply-side analysis of policy outcomes', Retrieved
on September 15, 2008, from
http://www.researchictafrica.net/images/upload/Africa_comparativeCORRECTED.pdf.
Feldmann, V. (2003), 'Mobile Overtakes Fixed: Implications for Policy and Regulation', Geneva:
International Telecommunications Union. Retrieved on March 8, 2008, from
http://www.itu.int/osg/spu/ni/mobileovertakes/Resources/Mobileovertakes_Paper.pdf.
Francke, E. & Weideman, M. (2007), 'South African youth and mobile technology impact: The MXit
phenomenon', in proceedings of the 9th Annual Conference on World Wide Web Applications 5-7
Internet and Online Media Usage on Mobile Phones among Low‐Income Urban Youth in Cape Town
18
September 2007, Johannesburg, South Africa, Retrieved on March 29, 2008 from
http://staging.uj.ac.za/www2007/documents/proceedings/Francke__Weideman_SA_youth_and_m
obile_technology_impacy.pdf.
Goldstuck, A. (2007), The Hitchhiker's Guide to Going Mobile, Cape Town: Double Storey.
Heeks, R. & Jagun, A. (2007), 'Mobile phones and development: The future in new hands?', Retrieved on
January 6, 2008 from http://www.id21.org/insights/insights69/art00.html.
Hodge, J. (2005), 'Tariff structures and access substitution of mobile cellular for fixed line in South Africa',
Telecommunications Policy, 29(7), 493-505.
Horrigan, J. (2008), 'Mobile Access to Data and Information', Pew Internet American Life Project,
Retrieved on April 4, 2008 from http://pewinternet.org/pdfs/PIP_Mobile.Data.Access.pdf.
Horst, H. & Miller, D. (2006), The Cell Phone: An Anthropology of Communication, Oxford: Berg
Publishers.
International Telecommunications Union (ITU) (2001), 'World Telecommunication/ICT Indicators
Database: Mobile cellular subscribers 2000', Accessed on January 10, 2008 from the online ITU
ICT Indicators Database (data published in 2001) http://www.itu.int/ITU-
D/ICTEYE/Indicators/Indicators.aspx.
International Telecommunications Union (ITU) (2007), 'World Information Society Report 2007',
Retrieved on June 8, 2008 from
http://www.itu.int/osg/spu/publications/worldinformationsociety/2007/.
Ito, M. & Okabe, D. (2005), The Inside Text: Social, Cultural and Design Perspectives on SMS, New
York: Springer, chapter Intimate Connections: Contextualizing Japanese Youth and Mobile
Messaging, pp. 127-145.
Katz, J. E. & Sugiyama, S. (2006), 'Mobile phones as fashion statements: evidence from student surveys
in the US and Japan', New Media & Society, 8(2), 321-337.
Kreutzer, T. (2008), 'Assessing Cell Phone Usage in a South African Township School', Paper presented
at e/merge 2008, July 7 - 18, 2008 in Cape Town, South Africa. Retrieved on September 1, 2008
from
http://emerge2008.net/access/content/group/emerge2008/PresentationFiles/Kreutzer/Cell%20Phon
e%20Usage.pdf.
Kreutzer, T. (2009), 'Generation Mobile: Online and Digital Media Usage on Mobile Phones among Low-
Income Urban Youth in South Africa'. Retrieved on March 30, 2009, from
http://tinokreutzer.org/mobile/MobileOnlineMedia-SurveyResults-2008.pdf.
Lam, D.; Ardington, C. & Leibbrandt, M. (2008), 'Schooling as a Lottery: Racial Differences in School
Advancement in Urban South Africa', University of Michigan: Population Studies Center
Internet and Online Media Usage on Mobile Phones among Low‐Income Urban Youth in Cape Town
19
Research Report 08-632. Retrieved on May 10, 2008, from
http://www.psc.isr.umich.edu/pubs/pdf/rr08-632.pdf.
Ling, R. (2004), The Mobile Connection: The Cell Phone's Impact on Society, San Francisco: Morgan
Kaufmann.
Ling, R. & Yttri, B. (2002), Perpetual contact: Mobile communication, private talk, public performance,
Cambridge, England: Cambridge University Press, chapter Hyper-coordination via mobile phones
in Norway, pp. 139-169.
Mehra, B.; Merkel, C. & Bishop, A. P. (2004), 'Internet for Empowerment of Minority and Marginalized
Communities', New Media & Society 6(6), 781-802.
Noble, M.; Babita, M.; Barnes, H.; Dibben, C.; Magasela, W.; Noble, S.; Ntshongwana, P.; Phillips, H.;
Rama, S.; Roberts, B.; Wright, G. & Zungu, S. (2006), The Provincial Indices of Multiple
Deprivation for South Africa 2001, Centre for the Analysis of South African Social Policy,
University of Oxford, UK.
Pew Internet & American Life Project (2006), 'Annual Gadgets Survey: Final Topline. Data for February
15 – April 6, 2006', Princeton Survey Research Associates International for the Pew Internet
American Life Project. Retrieved on April 2, 2008, from
http://www.pewinternet.org/pdfs/PIP.Typology.Topline.pdf.
Prahalad, C. (2005), Fortune at the Bottom of the Pyramid, The: Eradicating Poverty Through Profits,
Philadelphia: Wharton School Publishing.
Prinsloo, M. & Walton, M. (2008), Yearbook 2008: African Media, African Children, Göteborg:
Nordicom, Göteborgs universitet, chapter Situated responses to the digital literacies of electronic
communication in marginal school settings, pp. 99-116.
Research ICT Africa (RIA) (2009), 'RIA e-Access & Usage Household Survey (database)', SPSS statistics
package made available to the author. Reports available on http://www.ResearchICTAfrica.net.
Accessed January 20, 2009.
Rheingold, H. (2003), Smart Mobs: The next social revolution, New York: Perseus Books.
Statistics South Africa (STATSSA) (2001), 'Primary tables South Africa: Census ‘96 and 2001 compared',
Retrieved on March 29, 2008 from http://www.statssa.gov.za/census01/html/RSAPrimary.pdf.
Statistics South Africa (STATSSA) (2008), 'Community Survey, 2007 - Basic Results: Municipalities',
Retrieved on January 17, 2009 from
http://www.statssa.gov.za/Publications/P03011/P030112007.pdf.
Sutherland, E. (2008), 'Counting mobile phones, SIM cards & customers', Retrieved on May 15, 2008,
from http://www.itu.int/ITU-D/ict/statistics/material/sutherland-mobile-numbers.pdf.
Tlabela, K.; Roodt, J. & Paterson, A. (2007), ICT Access in South Africa, Cape Town: HSRC Press.
Townsend, P. (1979), Poverty in the United Kingdom, Harmondsworth: Penguin Books.
Internet and Online Media Usage on Mobile Phones among Low‐Income Urban Youth in Cape Town
20
Warschauer, M. (2003), Technology and Social Inclusion: Rethinking the Digital Divide, Cambridge: MIT
Press.
Waverman, L.; Meschi, M. & Fuss, M. (2005), 'Africa: The Impact of Mobile Phones', The Vodafone
Policy Paper Series, Number 3. Retrieved on May 12, 2008, from
http://www.vodafone.com/etc/medialib/attachments/cr_downloads.Par.78351.File.dat/GPP_SIM_
paper_3.pdf.
Zainudeen, A.; Sivapragasam, N.; de Silva, H.; Iqbal, T. & Ratnadiwakara, D. (2007), 'Teleuse at the
Bottom of the Pyramid: Findings from a Five-Country Study', Background paper prepared for ‘3rd
Global Knowledge Conference’, Kuala Lumpur, 11-13 December 2007. Retrieved on October 2,
2008 from http://lirneasia.net/wp-content/uploads/2008/07/tbop-gk3.pdf.
Internet and Online Media Usage on Mobile Phones among Low‐Income Urban Youth in Cape Town
21