Embed Size (px)
Citation preview

Received: 29May 2017 Revised: 29 June 2017 Accepted: 30 June 2017
DOI: 10.1002/humu.23293
S P E C I A L A RT I C L E
Assessing predictions of fitness effects of missensemutationsin SUMO-conjugating enzymeUBE2I
Jing Zhang1 Lisa N. Kinch2 Qian Cong1 JochenWeile3,4,5 Song Sun3,4,5
Atina G. Cote3,4,5 Frederick P. Roth3,4,5,6 Nick V. Grishin1,2
1Departments of Biophysics andBiochemistry,
University of Texas SouthwesternMedical
Center, Dallas, Texas
2HowardHughesMedical Institute, University
of Texas SouthwesternMedical Center, Dallas,
Texas
3Lunenfeld-TanenbaumResearch Institute,
Mount Sinai Hospital, Toronto,Ontario, Canada
4TheDonnelly Centre, University of Toronto,
Toronto,Ontario, Canada
5Department ofMolecularGenetics, University
of Toronto, Toronto,Ontario, Canada
6Department of Computer Science, University of
Toronto, Toronto,Ontario, Canada
Correspondence
NickV.Grishin,HowardHughesMedical
Institute,University ofTexasSouthwestern
MedicalCenter, 5323HarryHinesBoulevard,
Dallas, Texas75390-9050.
Email: [email protected]
For theCAGISpecial Issue
Funding Information
Contract grant sponsors:NIH (U41HG007346,
R13HG006650).
AbstractThe exponential growth of genomic variants uncovered by next-generation sequencing necessi-
tates efficient and accurate computational analyses to predict their functional effects. A number
of computational methods have been developed for the task, but few unbiased comparisons of
their performance are available. To fill the gap, The Critical Assessment of Genome Interpreta-
tion (CAGI) comprehensively assesses phenotypic predictions on newly collected experimental
datasets. Here, we present the results of the SUMO conjugase challengewhere participants were
predicting functional effects of missense mutations in human SUMO-conjugating enzyme UBE2I.
The performance of the predictors is similar to each other and is far from perfection. Evolution-
ary information from sequence alignments dominates the success: deleterious mutations at con-
served positions and benign mutations at variable positions are accurately predicted. Prediction
accuracy of other mutations remains unsatisfactory, and this fast-growing field of research is yet
to learn the use of spatial structure information to improve the predictions significantly.
K EYWORDS
CAGI, performance, predictors, substitutions, SUMO
1 INTRODUCTION
Ever-growingnext-generation sequencing efforts identify copiousmis-
sense variants that lead to single amino acid substitutions in pro-
teins. Phenotypic effects for most of these variants are unknown, and
their comprehensive functional studies are not feasible considering
the scale. A number of computational methods have been developed
to predict the effects of missense mutations and prioritize them for
experimental work. Thesemethods can be divided into threemain cat-
egories: single predictors based on evolutionary considerations from
sequence, single predictors deriving from additional information such
as 3D structure and physicochemical attributes of amino acids, and
metapredictors that integrate scores from several other predictors
(Gnad, Baucom, Mukhyala, Manning, & Zhang, 2013; Miosge et al.,
2015). Compared with the abundance of prediction methods (Ade-
bali, Reznik, Ory, & Zhulin, 2016; Adzhubei et al., 2010; Bromberg &
Rost, 2007; Choi & Chan, 2015; Katsonis & Lichtarge, 2014; Kircher
et al., 2014; Kumar, Henikoff, & Ng, 2009; Li et al., 2009; Martelli et al.,
2016; Niroula, Urolagin, & Vihinen, 2015; Pejaver et al., 2017; Thomas
& Kejariwal, 2004; Yue, Melamud, & Moult, 2006), independent
studies assessing their performanceare scarce (Martelottoet al., 2014;
Miosge et al., 2015; Schiemann & Stowell, 2016). The reliability of pre-
vious assessments remains unclear because predictors perform incon-
sistently across benchmarks, which may indicate unintended overlap
between training and testing data sets (Grimm et al., 2015). Therefore,
a community-wide experiment on de novo generated testing sets is
required to: (1) objectively assess different predictors, (2) reveal the
strengths and weaknesses of methods, (3) highlight the most promis-
ing trends in the field, and (4) provide guidance for people outside the
field in choosing optimal methods.
Here, we evaluate the SUMO conjugase challenge in the Critical
Assessment of Genome Interpretation (CAGI), in which participants
were asked to predict the fitness effects of missense mutations in
the human SUMO-conjugating enzyme (UBC9, also known as UBE2I).
UBE2I is the only known human SUMO ligase (E2 enzyme) that trans-
fers SUMO from the E1 complex to downstream substrates through
a conserved Cys residue. UBE2I recognizes substrates by their con-
sensus motif and catalyzes the sumoylation reaction, which can be
assistedbyE3 ligases (Geiss-Friedlander&Melchior, 2007). TheSUMO
pathway affects multiple transcription factors and regulates diverse
HumanMutation. 2017;38:1051–1063. c© 2017Wiley Periodicals, Inc. 1051wileyonlinelibrary.com/journal/humu
1052 ZHANG ET AL.
cellular processes including protein degradation, cell proliferation,
signal transduction, nuclear transport, and chromosome segregation
(Flotho & Melchior, 2013; Gareau & Lima, 2010). UBE2I regulates
proliferation and transformation in different cancers and is targeted
by multiple viruses, including HIV, EBV, and HPV (Everett, Boutell, &
Hale, 2013; Jaber et al., 2009; Li, Lu, & Prochownik, 2007; Qin et al.,
2011; Seeler &Dejean, 2017). A large number of novel missensemuta-
tions in UBE2I have been identified recently in cancer patients, but
their functional impact remains unclear (Wu et al., 2014). Further-
more, high-resolution spatial structures of different macromolecular
complexes of UBE2I with its substrates and regulators are available,
enabling predictors to use extensive structural information (Alontaga
et al., 2015; Bernier-Villamor, Sampson, Matunis, & Lima, 2002; Capili
& Lima, 2007; Streich & Lima, 2016). Therefore, UBE2I is an excellent
target for testing computational predictions of mutational effects.
Thedataset usedhere to assess predictionswas a collection of func-
tional impact scores for humanUBE2Imutantsmeasured in a compan-
ion study (Weile et al., unpublished results). Briefly, effects ofmissense
mutations in UBE2I were measured using a previously-described Sac-
charomyces cerevisiae (yeast) complementation assay, in which a yeast
strain carrying a temperature-sensitive allele of the endogenousUBC9
gene exhibits loss of growth that can be rescued by expressing human
UBE2I (Sun et al., 2016). The impact of specific mutants or mutant
combinations was assessed by the relative growth rate in a compet-
itive growth assay. This high-throughput experiment measured over
5,000 UBE2I mutants (682 single mutations, and 4,427 distinct muta-
tion combinations) for predictions.
We received 16 prediction datasets from nine groups. The assess-
ment shows that most predictors are capturing qualitative (e.g., dele-
terious vs. benign) effects of mutations on proteins. However, the
quantitative agreement between predictions and experimental mea-
surements remains modest. The accuracy of predictions varies greatly
among mutations and correlates strongly with the evolutionary signal
in sequence alignment.While deleteriousmutations at conservedposi-
tions are predicted best, predictions are poor for deleterious muta-
tions at nonconserved positions and benign or beneficial mutations at
conserved sites. Thus, significant improvements are needed and may
come from more rigorous integration of features, better treatment
of 3D structural information, consideration of epistatic effects, and
analysis of interacting partners.
2 MATERIALS AND METHODS
2.1 UBC9 variant fitnessmeasurements
For over 5000 humanUBC9 protein variants, we used the scores mea-
suring the ability of each variant human UBC9 protein to replace the
function of yeast UBC9 in the context of a human-yeast complementa-
tion assay. Experimental data and a complete description of the DMS-
BarSEQ assay employed for this purpose are provided in a companion
study byWeile et al. 2017.
For each variant in the assay, a score was calculated, such that the
score will be zero if a clone’s fitness matches that of the mode of null
controls, and it will be 1 if it matches the mode of wild-type UBC9
controls. Statistical testing revealed that clones that received negative
scores did not significantly differ from the controls and can thus sim-
ply be considered as complete loss of function variants. A number of
clones were found to grow significantly faster than the wild type con-
trols. A detailed discussion of these cases can be found in theWeile et
al. 2017 companion study.
Three subsets of data were provided in the challenge. Subset 1 is
the most accurate and consists of 213 single amino acid mutations for
which at least three independent barcoded clones are represented,
providing internal replicates of the experiment. Subset 2 contains
another 410 single variants, while Subset 3 contains 4,427 mutants
with two or more substitutions. To help participants calibrate numeric
values, the distribution of experimental growth scores was provided in
the challenge.
2.2 Positive control and the baseline predictor
To provide a reference for predictions, we defined a positive and a
baseline predictor control. The positive control was the “perfect” pre-
diction one would expect when experimental errors were considered.
A prediction for each variant in the positive control was a randomly
selected value from a Gaussian distribution with the given competi-
tive growth score as mean and the experimental standard error as the
standard deviation. The baseline predictorwas based on the frequency
of amino acids at each position in a UBC9 family multiple sequence
alignment (MSA). The MSA was constructed using Promals3D (Pei &
Grishin, 2014) from UBC9 and its 228 orthologs/inparalogs from the
InPararoid (Sonnhammer & Ostlund, 2015) database (sequences and
alignment are included in Supp. Material). For subsets 1 and 2, predic-
tions were calculated using the following formula:
lnQm
Pm− ln
Qw
Pw
whereQm andQw are the estimated probabilities of mutated andwild-
type amino acids at a mutated position in the alignment as defined
in, and Pm and Pw are Robinson–Robinson background frequencies
(Robinson & Robinson, 1991) of the mutated and wild-type amino
acids. For subset 3 with multiple mutations, we used the sum of the
predictions for each single mutation.
2.3 Quantile transformation of original predictions
Most participants ignored calibrating their predictions using the distri-
bution of experimental growth score given to them. Thus, rescaling of
predictions was required tomake predictors comparable in their scale,
which is especially important for numeric comparison. We performed
quantile transformation of the original predictions from participants
and of our baseline predictor. Because predictors were not allowed to
predict negative values and the negative competitive growth scores
obtained in experiments did not show statistically significant differ-
ence from 0, all negative competitive growth scores were shifted to
0 before transformation. The mutations were ranked by the predicted
values, and each mutation was assigned the experimental score with
ZHANG ET AL. 1053
the same rank. The assigned experimental scores for mutants that are
predicted to be ties are further averaged to obtain the final trans-
formed predictions.
2.4 Scores for prediction assessment
Eachmethodwas evaluated by their ability to: (1) to classifymutations
into categories suchasdeleteriousandnondeleteriousmutations (clas-
sification), (2) to rank mutations by their impacts on the protein func-
tion (ordinal association), and (3) to predict experimental competitive
growth scores (numeric comparison). For the assessment, mutations
were assigned by the growth score to the following categories: lower
or equal to 0.3 for deleterious, between 0.3 and 0.7 for intermediate,
from 0.7 to 1.3 for wild type, and greater than 1.3 for advantageous.
Table 1 summarizes scores for each aspect. Four out of these scores,
that is, area under ROC (AUC) for classification of deleterious muta-
tions and the threeordinal association scores, relyon the rankof exper-
imental scores and predictions, both of which contain ties and requires
special treatment as noted in Table 1.
2.5 Evaluation of overall performance and its
statistical significance
Four (three scores for ordinal association and AUC) of the measure-
ments listed in Table 1 were purely based on rank and were not sen-
sitive to the distribution of numeric values. Five others depended on
the distribution of numeric values and thus were calculated with both
original and quantile-transformed predictions. For eachmeasurement,
we transformed the original scores to Z scores, and positive control
and baseline predictorwere excluded from the calculation ofmean and
standard deviation of original scores to avoid their influence on the
score distribution. The average Z scores of the rank-based, original-
value-based, and transformed-value-based measurements were com-
puted and summed up to be the final score to assess the performance
on each subset. The final assessment score was a weighted sum of
the scores from three subsets. Because the experimental competitive
scores in subset 1 were more accurate (with replicates) than those in
subsets 2 and 3, subset 1wasweighted twice asmuch as the other two
subsets.
To take experimental errors into consideration, we assumed that
the growth score for each mutant in a dataset (subsets 1, 2, and 3)
can be randomly drawn from a Gaussian distribution defined by the
reported growth score and the standard error. We repeated this pro-
cedure 1,000 times to generate 1,000 derived datasets from subset
1. Then, we performed bootstrap resampling on each derived dataset
40 times, and thus generated 40,000 samples from subset 1. Similarly,
we obtained 40,000 samples from subset 2 but just 200 samples (40
derived datasets each resampled five times with bootstrap) for subset
3 due to time constraints required by the large number ofmutants in it.
We randomly chose three simulated samples fromsubsets1, 2, and3 to
formanew test set. A total of 40,000new test setswere generated and
used to assess the predictors using the same procedure as described
above. We obtained the distribution of ranks for each group on these
test sets. In addition, for each pair of groups, we compared their
performance on each of the new test sets and counted their number
of wins (head-to-head test).
2.6 Identification and characterization of
well-predicted and poorly predicted variants
The absolute difference between the experimental score and trans-
formed prediction was used to assess the prediction quality for each
mutation by each group. A heat map was plotted and visualized by
ClustVis (Metsalu & Vilo, 2015) to illustrate the prediction quality
of each mutation from every predictor and the baseline prediction
control. To find common properties shared by well-predicted and
poorly predicted variants, we calculated conservation by AL2CO (Pei
& Grishin, 2001) and relative solvent accessibility of residues by DSSP
(Kabsch & Sander, 1983).
3 RESULTS
3.1 UBE2Imutation bias toward being deleterious
to competitive growth
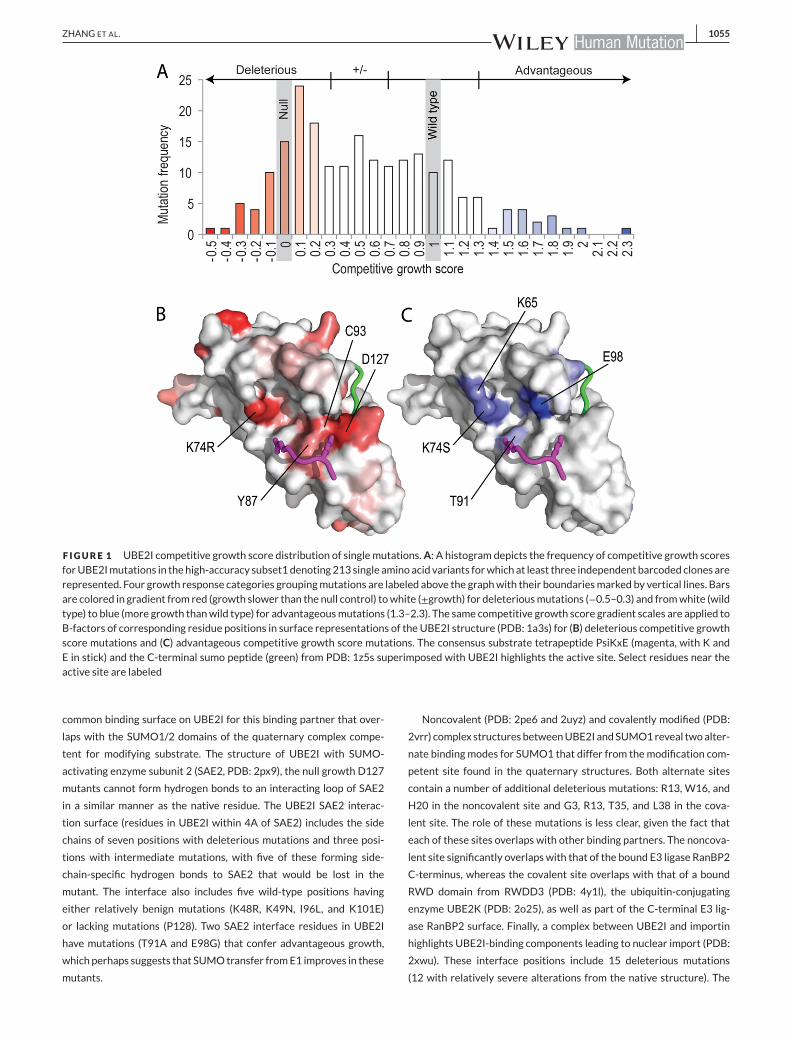
The effect of variants in the single-mutation high-accuracy subset 1
on competitive growth is illustrated in Figure 1A. Out of 219 variants,
six without a given competitive growth score or standard error were
excluded from the analysis. The competitive growth scoreswere scaled
so thatmutant cloneswith growth identical to a null controlwere0 and
those with growth identical to a wild-type control were 1. 41% of all
high-accuracy subset 1mutations were deleterious (Fig. 1A).
The remaining single amino acid variants (subset 2, 410 informative
mutations) without replicates followed a similar distribution (Supp.
Fig. S1A), with 48% of subset 2 mutations falling in the deleteri-
ous category. For those remaining variants with multiple amino acid
substitutions (subset 3, 3,872 clones with experimental measure-
ments; Supp. Fig. S1A), the distribution shifts further toward null (67%
of subset 3 mutations). Thus, almost half of the UBE2I single amino
acid mutations and a majority of multiple mutations were detrimental
to growth. On the other hand, relatively few UBE2I amino acid vari-
ants (42 or 6.7%of single-mutant variants and 209 or 5.4%ofmultiple-
mutant variants) were advantageous.
3.2 Deleterious and advantageousmutations
mapped to the UBE2I structure suggest functional
effects
High-accuracy subset 1 deleterious mutations mapped to the UBE2I
structure distribute across the surface (Fig. 1B), with only 8% of the
mutations being completely buried (seven out of the 87 have solvent
accessibility score of 0). Many of the mutations cluster around the
active siteC93,with seven deleteriousmutation positions beingwithin
5 A of the catalytic residue. For example, mutation of either of the two
residues (D127 to V or G and Y87 to C or N) that surround the con-
sensus substrate tetrapeptide lysine residue that gets ligated to the C-
terminus of SUMO results in null-level growth. A more conservative
1054 ZHANG ET AL.
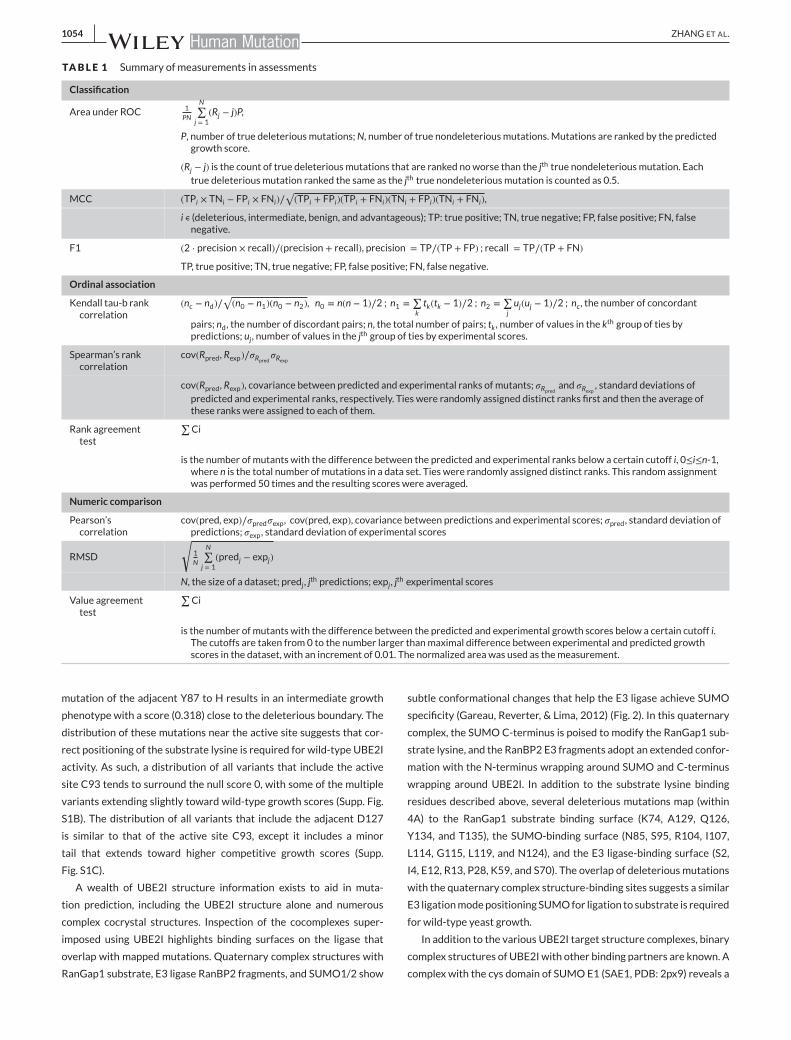
TABLE 1 Summary of measurements in assessments
Classification
Area under ROC 1PN
N∑j = 1
(Rj − j)P,
P, number of true deleteriousmutations;N, number of true nondeleteriousmutations. Mutations are ranked by the predictedgrowth score.
(Rj − j) is the count of true deleteriousmutations that are ranked noworse than the jth true nondeleteriousmutation. Eachtrue deleteriousmutation ranked the same as the jth true nondeleteriousmutation is counted as 0.5.
MCC (TPi × TNi − FPi × FNi)∕√(TPi + FPi)(TPi + FNi)(TNi + FPi)(TNi + FNi),
i ∊ (deleterious, intermediate, benign, and advantageous); TP: true positive; TN, true negative; FP, false positive; FN, falsenegative.
F1 (2 ⋅ precision × recall)∕(precision + recall), precision = TP∕(TP + FP) ; recall = TP∕(TP + FN)
TP, true positive; TN, true negative; FP, false positive; FN, false negative.
Ordinal association
Kendall tau-b rankcorrelation
(nc − nd)∕√(n0 − n1)(n0 − n2), n0 = n(n − 1)∕2 ; n1 =
∑ktk(tk − 1)∕2 ; n2 =
∑juj(uj − 1)∕2 ; nc , the number of concordant
pairs; nd, the number of discordant pairs; n, the total number of pairs; tk , number of values in the kth group of ties bypredictions; uj , number of values in the jth group of ties by experimental scores.
Spearman’s rankcorrelation
cov(Rpred , Rexp)∕𝜎Rpred𝜎Rexp
cov(Rpred , Rexp), covariance between predicted and experimental ranks of mutants; 𝜎Rpred and 𝜎Rexp , standard deviations ofpredicted and experimental ranks, respectively. Ties were randomly assigned distinct ranks first and then the average ofthese ranks were assigned to each of them.
Rank agreementtest
∑Ci
is the number of mutants with the difference between the predicted and experimental ranks below a certain cutoff i, 0≤i≤n-1,where n is the total number of mutations in a data set. Ties were randomly assigned distinct ranks. This random assignmentwas performed 50 times and the resulting scores were averaged.
Numeric comparison
Pearson’scorrelation
cov(pred, exp)∕𝜎pred𝜎exp , cov(pred, exp), covariance between predictions and experimental scores; 𝜎pred, standard deviation ofpredictions; 𝜎exp, standard deviation of experimental scores
RMSD
√1N
N∑j = 1
(predj − expj)
N, the size of a dataset; predj , jth predictions; expj , j
th experimental scores
Value agreementtest
∑Ci
is the number of mutants with the difference between the predicted and experimental growth scores below a certain cutoff i.The cutoffs are taken from 0 to the number larger thanmaximal difference between experimental and predicted growthscores in the dataset, with an increment of 0.01. The normalized area was used as themeasurement.
mutation of the adjacent Y87 to H results in an intermediate growth
phenotype with a score (0.318) close to the deleterious boundary. The
distribution of these mutations near the active site suggests that cor-
rect positioning of the substrate lysine is required for wild-type UBE2I
activity. As such, a distribution of all variants that include the active
site C93 tends to surround the null score 0, with some of the multiple
variants extending slightly toward wild-type growth scores (Supp. Fig.
S1B). The distribution of all variants that include the adjacent D127
is similar to that of the active site C93, except it includes a minor
tail that extends toward higher competitive growth scores (Supp.
Fig. S1C).
A wealth of UBE2I structure information exists to aid in muta-
tion prediction, including the UBE2I structure alone and numerous
complex cocrystal structures. Inspection of the cocomplexes super-
imposed using UBE2I highlights binding surfaces on the ligase that
overlap with mapped mutations. Quaternary complex structures with
RanGap1 substrate, E3 ligase RanBP2 fragments, and SUMO1/2 show
subtle conformational changes that help the E3 ligase achieve SUMO
specificity (Gareau, Reverter, & Lima, 2012) (Fig. 2). In this quaternary
complex, the SUMOC-terminus is poised to modify the RanGap1 sub-
strate lysine, and the RanBP2 E3 fragments adopt an extended confor-
mation with the N-terminus wrapping around SUMO and C-terminus
wrapping around UBE2I. In addition to the substrate lysine binding
residues described above, several deleterious mutations map (within
4A) to the RanGap1 substrate binding surface (K74, A129, Q126,
Y134, and T135), the SUMO-binding surface (N85, S95, R104, I107,
L114, G115, L119, and N124), and the E3 ligase-binding surface (S2,
I4, E12, R13, P28, K59, and S70). The overlap of deleterious mutations
with the quaternary complex structure-binding sites suggests a similar
E3 ligationmodepositioning SUMOfor ligation to substrate is required
for wild-type yeast growth.
In addition to the various UBE2I target structure complexes, binary
complex structures of UBE2Iwith other binding partners are known. A
complex with the cys domain of SUMOE1 (SAE1, PDB: 2px9) reveals a
ZHANG ET AL. 1055
F IGURE 1 UBE2I competitive growth score distribution of single mutations.A: A histogram depicts the frequency of competitive growth scoresforUBE2Imutations in thehigh-accuracy subset1denoting213 single aminoacid variants forwhich at least three independent barcoded clones arerepresented. Four growth response categories groupingmutations are labeled above the graphwith their boundariesmarked by vertical lines. Barsare colored in gradient from red (growth slower than the null control) towhite (±growth) for deleteriousmutations (−0.5–0.3) and fromwhite (wildtype) to blue (more growth thanwild type) for advantageousmutations (1.3–2.3). The same competitive growth score gradient scales are applied toB-factors of corresponding residue positions in surface representations of the UBE2I structure (PDB: 1a3s) for (B) deleterious competitive growthscore mutations and (C) advantageous competitive growth score mutations. The consensus substrate tetrapeptide PsiKxE (magenta, with K andE in stick) and the C-terminal sumo peptide (green) from PDB: 1z5s superimposed with UBE2I highlights the active site. Select residues near theactive site are labeled
common binding surface on UBE2I for this binding partner that over-
laps with the SUMO1/2 domains of the quaternary complex compe-
tent for modifying substrate. The structure of UBE2I with SUMO-
activating enzyme subunit 2 (SAE2, PDB: 2px9), the null growth D127
mutants cannot form hydrogen bonds to an interacting loop of SAE2
in a similar manner as the native residue. The UBE2I SAE2 interac-
tion surface (residues in UBE2I within 4A of SAE2) includes the side
chains of seven positions with deleterious mutations and three posi-
tions with intermediate mutations, with five of these forming side-
chain-specific hydrogen bonds to SAE2 that would be lost in the
mutant. The interface also includes five wild-type positions having
either relatively benign mutations (K48R, K49N, I96L, and K101E)
or lacking mutations (P128). Two SAE2 interface residues in UBE2I
have mutations (T91A and E98G) that confer advantageous growth,
which perhaps suggests that SUMOtransfer fromE1 improves in these
mutants.
Noncovalent (PDB: 2pe6 and 2uyz) and covalently modified (PDB:
2vrr) complex structuresbetweenUBE2I andSUMO1reveal twoalter-
nate bindingmodes for SUMO1 that differ from themodification com-
petent site found in the quaternary structures. Both alternate sites
contain a number of additional deleterious mutations: R13, W16, and
H20 in the noncovalent site and G3, R13, T35, and L38 in the cova-
lent site. The role of these mutations is less clear, given the fact that
each of these sites overlaps with other binding partners. The noncova-
lent site significantly overlaps with that of the bound E3 ligase RanBP2
C-terminus, whereas the covalent site overlaps with that of a bound
RWD domain from RWDD3 (PDB: 4y1l), the ubiquitin-conjugating
enzyme UBE2K (PDB: 2o25), as well as part of the C-terminal E3 lig-
ase RanBP2 surface. Finally, a complex between UBE2I and importin
highlights UBE2I-binding components leading to nuclear import (PDB:
2xwu). These interface positions include 15 deleterious mutations
(12 with relatively severe alterations from the native structure). The
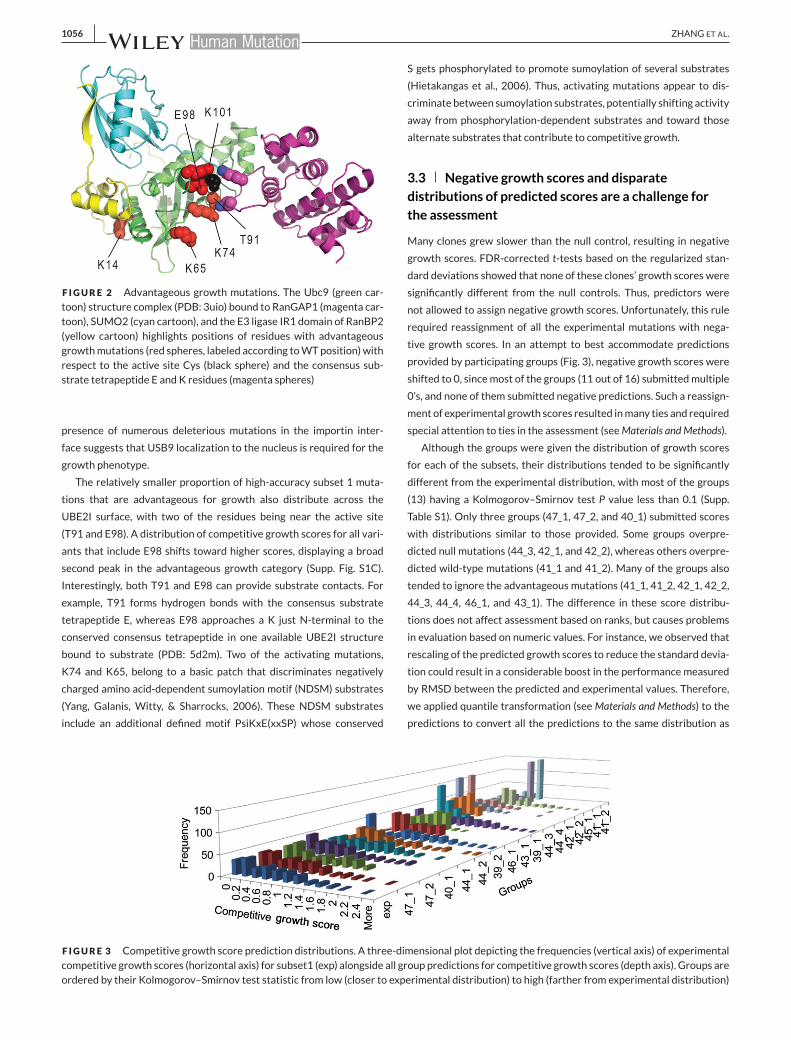
1056 ZHANG ET AL.
F IGURE 2 Advantageous growth mutations. The Ubc9 (green car-toon) structure complex (PDB: 3uio) bound to RanGAP1 (magenta car-toon), SUMO2 (cyan cartoon), and the E3 ligase IR1 domain of RanBP2(yellow cartoon) highlights positions of residues with advantageousgrowthmutations (red spheres, labeled according toWTposition)withrespect to the active site Cys (black sphere) and the consensus sub-strate tetrapeptide E and K residues (magenta spheres)
presence of numerous deleterious mutations in the importin inter-
face suggests that USB9 localization to the nucleus is required for the
growth phenotype.
The relatively smaller proportion of high-accuracy subset 1 muta-
tions that are advantageous for growth also distribute across the
UBE2I surface, with two of the residues being near the active site
(T91 and E98). A distribution of competitive growth scores for all vari-
ants that include E98 shifts toward higher scores, displaying a broad
second peak in the advantageous growth category (Supp. Fig. S1C).
Interestingly, both T91 and E98 can provide substrate contacts. For
example, T91 forms hydrogen bonds with the consensus substrate
tetrapeptide E, whereas E98 approaches a K just N-terminal to the
conserved consensus tetrapeptide in one available UBE2I structure
bound to substrate (PDB: 5d2m). Two of the activating mutations,
K74 and K65, belong to a basic patch that discriminates negatively
charged amino acid-dependent sumoylation motif (NDSM) substrates
(Yang, Galanis, Witty, & Sharrocks, 2006). These NDSM substrates
include an additional defined motif PsiKxE(xxSP) whose conserved
S gets phosphorylated to promote sumoylation of several substrates
(Hietakangas et al., 2006). Thus, activating mutations appear to dis-
criminate between sumoylation substrates, potentially shifting activity
away from phosphorylation-dependent substrates and toward those
alternate substrates that contribute to competitive growth.
3.3 Negative growth scores and disparate
distributions of predicted scores are a challenge for
the assessment
Many clones grew slower than the null control, resulting in negative
growth scores. FDR-corrected t-tests based on the regularized stan-
dard deviations showed that none of these clones’ growth scores were
significantly different from the null controls. Thus, predictors were
not allowed to assign negative growth scores. Unfortunately, this rule
required reassignment of all the experimental mutations with nega-
tive growth scores. In an attempt to best accommodate predictions
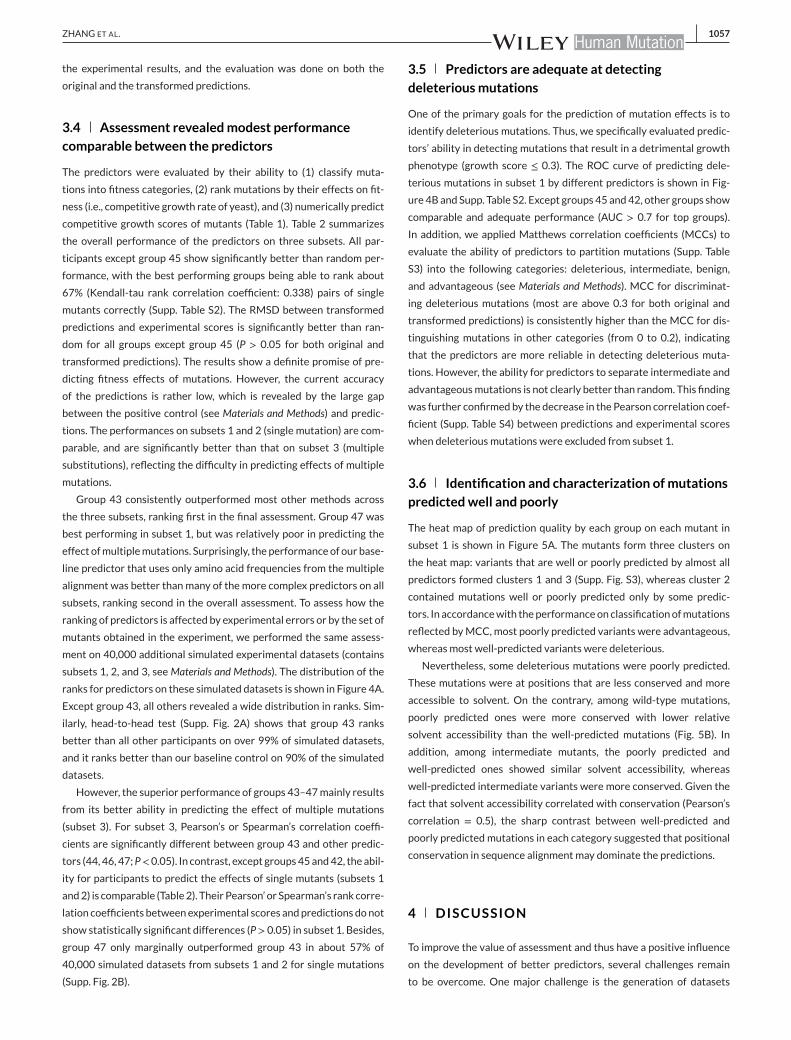
provided by participating groups (Fig. 3), negative growth scores were
shifted to 0, sincemost of the groups (11 out of 16) submittedmultiple
0’s, and none of them submitted negative predictions. Such a reassign-
ment of experimental growth scores resulted inmany ties and required
special attention to ties in the assessment (seeMaterials andMethods).
Although the groups were given the distribution of growth scores
for each of the subsets, their distributions tended to be significantly
different from the experimental distribution, with most of the groups
(13) having a Kolmogorov–Smirnov test P value less than 0.1 (Supp.
Table S1). Only three groups (47_1, 47_2, and 40_1) submitted scores
with distributions similar to those provided. Some groups overpre-
dicted null mutations (44_3, 42_1, and 42_2), whereas others overpre-
dicted wild-type mutations (41_1 and 41_2). Many of the groups also
tended to ignore the advantageous mutations (41_1, 41_2, 42_1, 42_2,
44_3, 44_4, 46_1, and 43_1). The difference in these score distribu-
tions does not affect assessment based on ranks, but causes problems
in evaluation based on numeric values. For instance, we observed that
rescaling of the predicted growth scores to reduce the standard devia-
tion could result in a considerable boost in the performance measured
by RMSD between the predicted and experimental values. Therefore,
we applied quantile transformation (seeMaterials and Methods) to the
predictions to convert all the predictions to the same distribution as
F IGURE 3 Competitive growth score prediction distributions. A three-dimensional plot depicting the frequencies (vertical axis) of experimentalcompetitive growth scores (horizontal axis) for subset1 (exp) alongside all group predictions for competitive growth scores (depth axis). Groups areordered by their Kolmogorov–Smirnov test statistic from low (closer to experimental distribution) to high (farther from experimental distribution)
ZHANG ET AL. 1057
the experimental results, and the evaluation was done on both the
original and the transformed predictions.
3.4 Assessment revealedmodest performance
comparable between the predictors
The predictors were evaluated by their ability to (1) classify muta-
tions into fitness categories, (2) rank mutations by their effects on fit-
ness (i.e., competitive growth rate of yeast), and (3) numerically predict
competitive growth scores of mutants (Table 1). Table 2 summarizes
the overall performance of the predictors on three subsets. All par-
ticipants except group 45 show significantly better than random per-
formance, with the best performing groups being able to rank about
67% (Kendall-tau rank correlation coefficient: 0.338) pairs of single
mutants correctly (Supp. Table S2). The RMSD between transformed
predictions and experimental scores is significantly better than ran-
dom for all groups except group 45 (P > 0.05 for both original and
transformed predictions). The results show a definite promise of pre-
dicting fitness effects of mutations. However, the current accuracy
of the predictions is rather low, which is revealed by the large gap
between the positive control (see Materials and Methods) and predic-
tions. The performances on subsets 1 and 2 (single mutation) are com-
parable, and are significantly better than that on subset 3 (multiple
substitutions), reflecting the difficulty in predicting effects of multiple
mutations.
Group 43 consistently outperformed most other methods across
the three subsets, ranking first in the final assessment. Group 47 was
best performing in subset 1, but was relatively poor in predicting the
effect ofmultiplemutations. Surprisingly, the performanceof our base-
line predictor that uses only amino acid frequencies from the multiple
alignment was better than many of the more complex predictors on all
subsets, ranking second in the overall assessment. To assess how the
ranking of predictors is affected by experimental errors or by the set of
mutants obtained in the experiment, we performed the same assess-
ment on 40,000 additional simulated experimental datasets (contains
subsets 1, 2, and 3, seeMaterials and Methods). The distribution of the
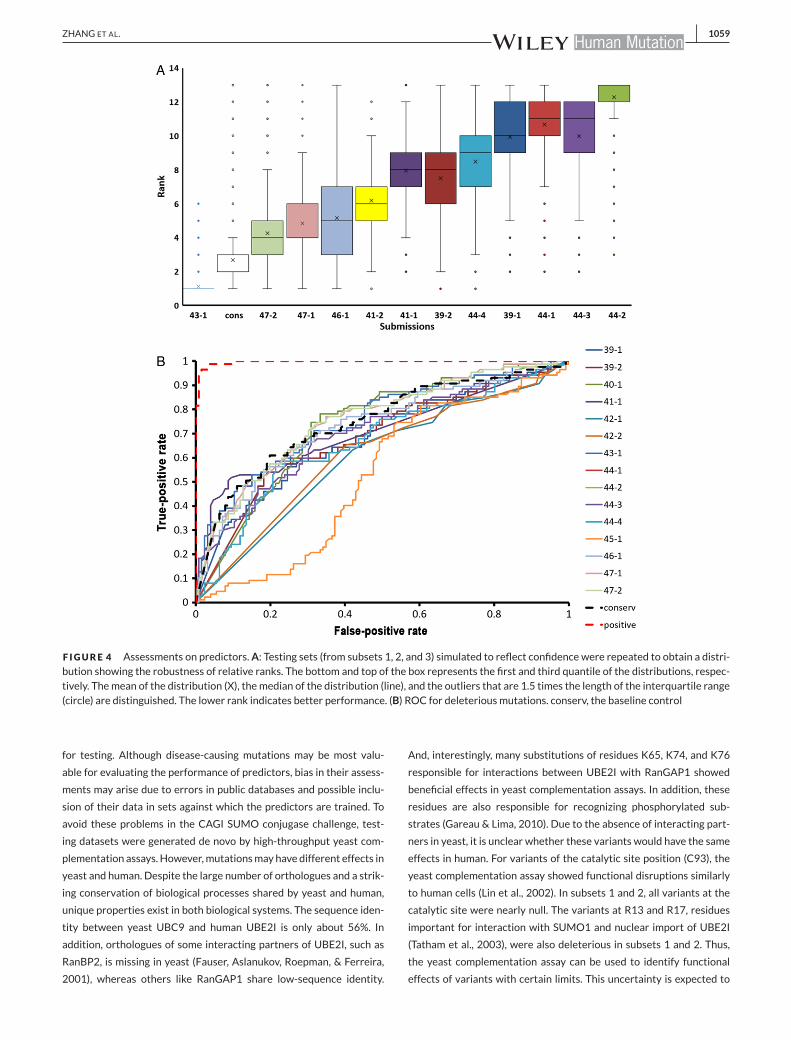
ranks for predictors on these simulated datasets is shown in Figure 4A.
Except group 43, all others revealed a wide distribution in ranks. Sim-
ilarly, head-to-head test (Supp. Fig. 2A) shows that group 43 ranks
better than all other participants on over 99% of simulated datasets,
and it ranks better than our baseline control on 90% of the simulated
datasets.
However, the superior performance of groups 43–47mainly results
from its better ability in predicting the effect of multiple mutations
(subset 3). For subset 3, Pearson’s or Spearman’s correlation coeffi-
cients are significantly different between group 43 and other predic-
tors (44, 46, 47;P<0.05). In contrast, except groups45and42, the abil-
ity for participants to predict the effects of single mutants (subsets 1
and2) is comparable (Table2). TheirPearson’ or Spearman’s rank corre-
lation coefficients betweenexperimental scores andpredictions donot
show statistically significant differences (P> 0.05) in subset 1. Besides,
group 47 only marginally outperformed group 43 in about 57% of
40,000 simulated datasets from subsets 1 and 2 for single mutations
(Supp. Fig. 2B).
3.5 Predictors are adequate at detecting
deleteriousmutations
One of the primary goals for the prediction of mutation effects is to
identify deleterious mutations. Thus, we specifically evaluated predic-
tors’ ability in detecting mutations that result in a detrimental growth
phenotype (growth score ≤ 0.3). The ROC curve of predicting dele-
terious mutations in subset 1 by different predictors is shown in Fig-
ure 4Band Supp. Table S2. Except groups 45 and42, other groups show
comparable and adequate performance (AUC > 0.7 for top groups).
In addition, we applied Matthews correlation coefficients (MCCs) to
evaluate the ability of predictors to partition mutations (Supp. Table
S3) into the following categories: deleterious, intermediate, benign,
and advantageous (see Materials and Methods). MCC for discriminat-
ing deleterious mutations (most are above 0.3 for both original and
transformed predictions) is consistently higher than the MCC for dis-
tinguishing mutations in other categories (from 0 to 0.2), indicating
that the predictors are more reliable in detecting deleterious muta-
tions. However, the ability for predictors to separate intermediate and
advantageousmutations is not clearly better than random. This finding
was further confirmedby the decrease in the Pearson correlation coef-
ficient (Supp. Table S4) between predictions and experimental scores
when deleterious mutations were excluded from subset 1.
3.6 Identification and characterization ofmutations
predictedwell and poorly
The heat map of prediction quality by each group on each mutant in
subset 1 is shown in Figure 5A. The mutants form three clusters on
the heat map: variants that are well or poorly predicted by almost all
predictors formed clusters 1 and 3 (Supp. Fig. S3), whereas cluster 2
contained mutations well or poorly predicted only by some predic-
tors. In accordancewith theperformanceon classificationofmutations
reflected byMCC,most poorly predicted variants were advantageous,
whereas most well-predicted variants were deleterious.
Nevertheless, some deleterious mutations were poorly predicted.
These mutations were at positions that are less conserved and more
accessible to solvent. On the contrary, among wild-type mutations,
poorly predicted ones were more conserved with lower relative
solvent accessibility than the well-predicted mutations (Fig. 5B). In
addition, among intermediate mutants, the poorly predicted and
well-predicted ones showed similar solvent accessibility, whereas
well-predicted intermediate variants were more conserved. Given the
fact that solvent accessibility correlated with conservation (Pearson’s
correlation = 0.5), the sharp contrast between well-predicted and
poorly predicted mutations in each category suggested that positional
conservation in sequence alignmentmay dominate the predictions.
4 DISCUSSION
To improve the value of assessment and thus have a positive influence
on the development of better predictors, several challenges remain
to be overcome. One major challenge is the generation of datasets

1058 ZHANG ET AL.
TABLE2
Summaryofassessm
entsonthreesubsets
CAGISUMO-ligasechallenge
perform
ance
Group
Subset1Z-scores
Subset2Z-scores
Subset3Z-scores
Overall
RankAvg
TransAvg
OrigAvg
Sum
Rank
RankAvg
TransAvg
OrigAvg
Sum
Rank
RankAvg
TransAvg
OrigAvg
Sum
Rank
Sum
Rank
Positive
6.43
10.50
6.94
23.86
na
4.40
7.24
6.26
17.90
na
27.57
24.54
13.18
65.29
na
130.91
na
43-1
0.97
0.58
1.07
2.62
30.51
0.33
0.98
1.82
11.79
1.18
1.58
4.55
111.62
1
conserv
0.71
0.43
0.51
1.65
50.47
0.50
0.57
1.54
41.29
0.94
0.63
2.85
27.69
2
47-2
0.99
0.94
0.95
2.87
10.57
0.57
0.01
1.16
5−0.51
−0.84
−0.20
−1.56
11
5.35
3
47-1
1.00
0.92
0.77
2.68
20.57
0.57
0.61
1.75
2−0.71
−0.94
−0.49
−2.13
12
4.99
4
46-1
0.69
0.60
1.01
2.30
40.10
0.17
−0.10
0.17
10
−0.67
0.49
−0.03
−0.21
74.57
5
41-2
0.40
0.46
0.25
1.11
70.43
0.40
−0.11
0.72
71.11
0.35
−0.60
0.87
53.80
6
41-1
0.40
0.46
0.25
1.12
60.42
0.40
−0.11
0.72
80.83
0.15
−1.00
−0.01
62.94
7
39-2
0.17
0.33
−0.23
0.27
11
−0.04
0.13
−0.30
−0.21
11
−0.39
1.62
0.75
1.97
42.29
8
44-4
−0.15
0.16
0.56
0.56
80.22
0.27
1.08
1.57
3−0.09
−0.54
−0.42
−1.06
91.64
9
40-1
0.27
0.05
0.15
0.46
9na
na
na
na
na
na
na
na
na
na
0.93
10
39-1
0.11
0.28
−0.81
−0.42
14
0.06
0.11
−0.62
−0.45
13
0.45
1.05
0.51
2.01
30.72
11
44-1
−0.13
0.16
−0.09
−0.07
13
0.25
0.27
0.45
0.97
6−0.12
−0.54
−0.01
−0.67
80.17
12
44-3
0.31
−0.04
0.08
0.35
10
0.07
−0.03
0.35
0.39
9−0.70
−0.99
0.40
−1.29
10
−0.20
13
44-2
0.31
−0.04
−0.26
0.01
12
0.08
−0.03
−0.41
−0.36
12
−0.98
−1.00
−0.49
−2.47
13
−2.82
14
42-2
−1.21
−0.82
−0.70
−2.72
15
na
na
na
na
na
na
na
na
na
na
−5.44
15
42-1
−1.43
−1.16
−0.71
−3.31
16
na
na
na
na
na
na
na
na
na
na
−6.61
16
45-1
−2.69
−2.87
−2.28
−7.84
17
−3.25
−3.19
−1.83
−8.27
14
na
na
na
na
na
−23.95
17
Notes:Thescoresweredivided
into
threeclasses(see
MaterialsandMethods).Ran
kAvg,theaverageZ-scoresofm
easuremen
tsincludingKen
dallTau
-b,Spearm
an’scorrelation,ran
kagreem
enttest,andROCcurvefor
deleteriousmutations;Tran
sAvg,theaverageZ-score
ofF
1,M
CC,RMSD
,valueagreem
enttest,andPearson’scorrelationfortran
sform
edpredictions;OrigAve,theaverageofZ
-scoresofthesamemeasuremen
tsas
Tran
sAvg
butfororiginalpredictions.Overall,theweigh
tedsumoffi
nalscore
fromthreesubsets.2*Z
subset1+Zsubset2+Zsubset3.positive,thepositive
controlexcluded
intherank;conserv,thebaselinecontrolincluded
intherank.
ZHANG ET AL. 1059
F IGURE 4 Assessments on predictors.A: Testing sets (from subsets 1, 2, and 3) simulated to reflect confidence were repeated to obtain a distri-bution showing the robustness of relative ranks. The bottom and top of the box represents the first and third quantile of the distributions, respec-tively. Themean of the distribution (X), themedian of the distribution (line), and the outliers that are 1.5 times the length of the interquartile range(circle) are distinguished. The lower rank indicates better performance. (B) ROC for deleteriousmutations. conserv, the baseline control
for testing. Although disease-causing mutations may be most valu-
able for evaluating the performance of predictors, bias in their assess-
ments may arise due to errors in public databases and possible inclu-
sion of their data in sets against which the predictors are trained. To
avoid these problems in the CAGI SUMO conjugase challenge, test-
ing datasets were generated de novo by high-throughput yeast com-
plementation assays. However,mutationsmay have different effects in
yeast and human. Despite the large number of orthologues and a strik-
ing conservation of biological processes shared by yeast and human,
unique properties exist in both biological systems. The sequence iden-
tity between yeast UBC9 and human UBE2I is only about 56%. In
addition, orthologues of some interacting partners of UBE2I, such as
RanBP2, is missing in yeast (Fauser, Aslanukov, Roepman, & Ferreira,
2001), whereas others like RanGAP1 share low-sequence identity.
And, interestingly, many substitutions of residues K65, K74, and K76
responsible for interactions between UBE2I with RanGAP1 showed
beneficial effects in yeast complementation assays. In addition, these
residues are also responsible for recognizing phosphorylated sub-
strates (Gareau & Lima, 2010). Due to the absence of interacting part-
ners in yeast, it is unclear whether these variants would have the same
effects in human. For variants of the catalytic site position (C93), the
yeast complementation assay showed functional disruptions similarly
to human cells (Lin et al., 2002). In subsets 1 and 2, all variants at the
catalytic site were nearly null. The variants at R13 and R17, residues
important for interaction with SUMO1 and nuclear import of UBE2I
(Tatham et al., 2003), were also deleterious in subsets 1 and 2. Thus,
the yeast complementation assay can be used to identify functional
effects of variants with certain limits. This uncertainty is expected to

1060 ZHANG ET AL.
F IGURE 5 Performance evaluation on single mutations. A: The absolute difference between experimental competitive growth scores and thatpredicted by each group method (using transformed data), as well as a baseline predictor (cont) based on residue frequency in multiple alignment,were calculated to reflect prediction quality for each mutation in subset1. Difference data were uploaded to the ClustVis Web tool to visualizethe corresponding heatmap, with mutations (horizontal axis) colored from red (high difference) to blue (low difference). Mutations were clustered(depicted as a tree above the heatmap) using Euclidean distance withWardminimum variancemethod linkage criterion. The three largest clusterscorrespond to overall poor prediction quality (red), intermediate prediction quality (green), and good prediction quality (blue). B: Group 1 poorlypredictedmutations (left, labeledbelow) andgroup3well-predictedmutations (right, labeledbelow)were split intogrowthperformancecategoriesaccording to experimental growth score: deleterious, intermediate, wild type, and advantageous (none in well-predicted mutations). Properties ofthe categorized mutations are illustrated in a bar chart: the frequency of mutations in each category with respect to the total in the group (bluebars, fraction), the average conservation fraction (red bars, conservation) measured by Al2Co, and the average solvent accessibility fraction (greenbars, surface) measured by DSSP
be resolved in future CAGI by using unpublished clinical data or data
from human-derived cell lines.
Another problem arising in the CAGI assessment was the differ-
ence in numeric scale of predictions. Different numeric scales of pre-
dictions can skew the performance. For example, the shrinkage of
numeric prediction scale may lead to better RMSD, which does not
necessarily reflect better predictions.We tried several transformation
methods, including normalization and standardization; however, they
did not lead to consistent results in numeric comparison. Therefore,
the assessment was affected by transformation and there were possi-
ble biases introduced. However, compared with other rescaling meth-
ods, our choice of directly assigning experimental competitive scores
to predictions by comparing ranks was expected to minimize the dif-
ferences between prediction and experimental score distributions. To
address possible biases of score transformations,we introducedbinary
classification and ordinal association scores, whichweremore tolerant
to numeric differences. We also evaluated scores for both original and
transformed predictions and included them in the assessment to off-
set the concerns triggeredby transformation.All of these score choices
were aimed at removing bias and resulted in reasonable assessments.
To address the problem in the futureCAGI, a standard and agreedupon
rescaling procedure for submitted predictions could be automatically
applied when participants submit their results.
Participants of CAGI4 included five published predictors: SAVER
(Adebali et al., 2016) (group40), SNAP (Bromberg&Rost, 2007) (group
41), INPS3D (Savojardo, Fariselli,Martelli, &Casadio, 2016) (group42),
evolutionary action method (Katsonis & Lichtarge, 2014) (group 43),
MutPred (Li et al., 2009), and MutPred2 (Pejaver et al., 2017) (group
44) and four newly developed predictors (groups 39 and45–47). These
predictors can be classified into three groups: purely sequence based
(groups 39–41 and43), those that combine sequence and spatial struc-
ture (groups 42, 44, and 46), andmetapredictors that integrate various
predictions (groups 45 and 47) (Supp. Table S5). Each predictor offers
unique implementation and combination of features. While all predic-
tors use sequence alignments, they differ in how alignments are con-
structed and how alignment information is used. For instance, groups
ZHANG ET AL. 1061
39 and 41 aligned all confident HHblits (Remmert, Biegert, Hauser, &
Soding, 2011) and PSI-BLAST (Altschul et al., 1997) hits as defined by
E value cutoff and length coverage, whereas group 40 differentiated
orthologs and paralogs based on phylogenetic trees.Most groups used
substitution frequencies to predict the effects of mutations, but group
41 predicted structural (solvent accessibility) and functional (annota-
tion from UniProt) features from the sequences and integrated them
withmachine learningmethods. Solvent accessibility is used by all pre-
dictors that incorporate structure information. Other features such as
B-factor and secondary structure are also frequently used. In addition,
group 46 analyzed biological assemblies and used different interac-
tion interfaces present in all available structures of UBE2I. Most pre-
dictors use machine-learning methods to integrate various features
and predictions. For example, group 47 integrated 12 available pre-
dictors including two of the most popular methods SIFT (Kumar et al.,
2009) and POLYPHEN2 (Adzhubei et al., 2010) using SVMwith anRBF
kernel.
The performance of most predictors was comparable on single
mutations regardless of different factors and methods they used to
make predictions. Most predictors could adequately predict deleteri-
ous mutations, especially those in conserved positions, and wild-type
mutations in nonconserved positions. Similar performance of most
predictors suggest predictions may heavily rely on sequence conser-
vation. This idea was further strengthened by the surprising result
that a simple conservation-based baseline predictor ranked among
the top. This performance suggests that other attributes such as pro-
tein structures may not be fully utilized by current predictors. How-
ever, whether protein structures can improve predictions significantly
is still a matter of debate (Capriotti & Altman, 2011; Kumar et al.,
2009; Saunders & Baker, 2002; Schaefer & Rost, 2012). While some
previous studies implied that addition of protein structure considera-
tions to predictions only marginally elevates the performance(Kumar
et al., 2009; Saunders & Baker, 2002), others claimed the introduc-
tion of protein structures led to 6% improvements (Capriotti &Altman,
2011). It is possible that the usefulness of protein structures for pre-
dictions depends on the protein of interest, the positions of variants,
or even on the quality of sequence conservation analysis performed
by a predictor. More comprehensive studies are expected to clar-
ify whether the introduction of structural features can contribute to
better predictions.
For subset 3, where each target is a combination of single vari-
ants, the performance of predictors decreased. Different summation
schemes of predictions on single variants were used to assign the final
prediction to the target. The best-performing group 43 in subset 3
assigned the sum of the predictions of single variants to the target,
whereas group 47, which scored best in subset 1, assigned predictions
of most deleterious variant to the target. The discrepancy in perfor-
mance between these groups suggested that the effects of multiple
mutations on fitnessmay be additive and should be taken into account.
However, experiments with our baseline predictor did not support this
explanation. We compared the performance of two baseline predic-
tors: the one that assigns the sum of scores for all mutations with
the one that assigns the minimal score (i.e., most deleterious mutation
only). Theperformanceof the twopredictors did not differ significantly
(Kendall tau-b values for correlation between predictions and exper-
imental data were 0.17 and 0.18). In addition, the Pearson’s correla-
tion between the two controls was 0.91, suggesting highly similar pre-
dictions. Therefore, it remains unclear whether the consideration on
additive effects of variantswas themajor reason that group 43 had the
best performance in subset 3. However, the results from our baseline
predictor may not be generalizable, because the effect of summation
scheme on performance may depend on specifics of how predictions
for single variants are computed.
Notably, many variants have high standard errors even in subset
1 (with several replicates). The small number of replicates is a pos-
sible reason. However, the distributions of experimental competitive
growth scores for both null mutants and wild-type clones with more
than three replicates also showed a wide distribution, implying vary-
ing responses from individuals with the same mutation. Such disper-
sion may be reflective of the measurement precision one might expect
in a growth-based assay.
In summary, the SUMO conjugase challenge highlights better per-
formance of methods for predictions of deleterious mutations at con-
served sites, the type ofmutations that is highly likely to cause disease.
It also reveals that substantial improvements of predictions areneeded
to predict deleterious variants at nonconserved sites and benignmuta-
tions at conserved sites.
REFERENCES
Adebali, O., Reznik, A. O., Ory, D. S., & Zhulin, I. B. (2016). Establishing the
precise evolutionary history of a gene improves prediction of disease-
causingmissensemutations.Genetics in Medicine, 18(10), 1029–1036.
Adzhubei, I. A., Schmidt, S., Peshkin, L., Ramensky, V. E., Gerasimova, A.,
Bork, P., … Sunyaev, S. R. (2010). A method and server for predicting
damagingmissensemutations.Nature Methods, 7(4), 248–249.
Alontaga, A. Y., Ambaye, N. D., Li, Y. J., Vega, R., Chen, C. H., Bzymek, K. P.,…Chen, Y. (2015). RWDDomain as an E2 (Ubc9)-InteractionModule. TheJournal of Biological Chemistry, 290(27), 16550–16559.
Altschul, S. F., Madden, T. L., Schaffer, A. A., Zhang, J., Zhang, Z., Miller, W.,
& Lipman, D. J. (1997). Gapped BLAST and PSI-BLAST: A new genera-
tion of protein database searchprograms.Nucleic Acids Research,25(17),3389–3402.
Baldi, P., & Long, A. D. (2001). A Bayesian framework for the analysis
of microarray expression data: Regularized t-test and statistical infer-
ences of gene changes. Bioinformatics, 17(6), 509–519.
Bernier-Villamor, V., Sampson, D. A., Matunis, M. J., & Lima, C. D. (2002).
Structural basis for E2-mediated SUMOconjugation revealed by a com-
plex between ubiquitin-conjugating enzyme Ubc9 and RanGAP1. Cell,108(3), 345–356.
Bromberg, Y., & Rost, B. (2007). SNAP: Predict effect of non-synonymous
polymorphisms on function.Nucleic Acids Research, 35(11), 3823–3835.
Capili, A. D., & Lima, C. D. (2007). Structure and analysis of a complex
between SUMO and Ubc9 illustrates features of a conserved E2-Ubl
interaction. Journal of Molecular Biology, 369(3), 608–618.
Capriotti, E., & Altman, R. B. (2011). Improving the prediction of
disease-related variants using protein three-dimensional structure.
BMC Bioinformatics, 12(Suppl 4), S3. https://www.ncbi.nlm.nih.gov/
pubmed/21992054
Choi, Y., & Chan, A. P. (2015). PROVEAN web server: A tool to predict the
functional effect of amino acid substitutions and indels. Bioinformatics,31(16), 2745–2747.
1062 ZHANG ET AL.
Everett, R.D., Boutell, C., &Hale, B.G. (2013). Interplaybetweenviruses and
host sumoylation pathways. Nature Reviews Microbiology, 11(6), 400–411.
Fauser, S., Aslanukov, A., Roepman, R., & Ferreira, P. A. (2001). Genomic
organization, expression, and localization of murine Ran-binding pro-
tein 2 (RanBP2) gene.Mammalian Genome, 12(6), 406–415.
Flotho, A., & Melchior, F. (2013). Sumoylation: A regulatory protein modi-
fication in health and disease. Annual Review of Biochemistry, 82, 357–385.
Gareau, J. R., & Lima, C. D. (2010). The SUMO pathway: Emerging mech-
anisms that shape specificity, conjugation and recognition. NatureReviewsMolecular Cell Biology, 11(12), 861–871.
Gareau, J. R., Reverter, D., & Lima, C. D. (2012). Determinants of small
ubiquitin-like modifier 1 (SUMO1) protein specificity, E3 ligase, and
SUMO-RanGAP1 binding activities of nucleoporin RanBP2. The Journalof Biological Chemistry, 287(7), 4740–4751.
Geiss-Friedlander, R., & Melchior, F. (2007). Concepts in sumoylation: A
decade on.Nature ReviewsMolecular Cell Biology, 8(12), 947–956.
Gnad, F., Baucom, A., Mukhyala, K., Manning, G., & Zhang, Z. (2013). Assess-
ment of computational methods for predicting the effects of missense
mutations in human cancers. BMC Genomics, 14(Suppl 3), S7. https://www.ncbi.nlm.nih.gov/pubmed/?term=Assessment+of+computational+
methods+for+predicting+the+effects+of+missense+mutations+in+
human+cancers
Grimm, D. G., Azencott, C. A., Aicheler, F., Gieraths, U., MacArthur, D. G.,
Samocha, K. E.,…Borgwardt, K.M. (2015). The evaluation of tools used
to predict the impact of missense variants is hindered by two types of
circularity.HumanMutation, 36(5), 513–523.
Hietakangas,V., Anckar, J., Blomster,H.A., Fujimoto,M., Palvimo, J. J., Nakai,
A., & Sistonen, L. (2006). PDSM, amotif for phosphorylation-dependent
SUMO modification. Proceedings of the National Academy of Sciences ofthe United States of America, 103(1), 45–50.
Jaber, T., Bohl, C. R., Lewis, G. L., Wood, C., West, J. T. Jr., & Weldon, R. A.
Jr. (2009). Human Ubc9 contributes to production of fully infectious
human immunodeficiencyvirus type1virions. Journal ofVirology,83(20),10448–10459.
Kabsch, W., & Sander, C. (1983). Dictionary of protein secondary struc-
ture: Pattern recognition of hydrogen-bonded and geometrical fea-
tures. Biopolymers, 22(12), 2577–2637.
Katsonis, P., & Lichtarge, O. (2014). A formal perturbation equation
between genotype and phenotype determines the Evolutionary Action
of protein-coding variations on fitness.Genome Research, 24(12), 2050–2058.
Kircher, M., Witten, D. M., Jain, P., O’Roak, B. J., Cooper, G. M., & Shendure,
J. (2014). A general framework for estimating the relative pathogenicity
of human genetic variants.Nature Genetics, 46(3), 310–315.
Kumar, P., Henikoff, S., & Ng, P. C. (2009). Predicting the effects of coding
non-synonymous variants on protein function using the SIFT algorithm.
Nature Protocols, 4(7), 1073–1081.
Li, B., Krishnan, V. G., Mort, M. E., Xin, F., Kamati, K. K., Cooper, D. N., …Radivojac, P. (2009). Automated inference of molecular mechanisms
of disease from amino acid substitutions. Bioinformatics, 25(21), 2744–2750.
Lin, D., Tatham, M. H., Yu, B., Kim, S., Hay, R. T., & Chen, Y. (2002). Identifi-
cation of a substrate recognition site on Ubc9. The Journal of BiologicalChemistry, 277(24), 21740–21748.
Li, Y., Lu, J., & Prochownik, E. V. (2007). Dual role for SUMO E2 conjugase
Ubc9 inmodulating the transforming and growth-promoting properties
of the HMGA1b architectural transcription factor. The Journal of Biolog-ical Chemistry, 282(18), 13363–13371.
Martelli, P. L., Fariselli, P., Savojardo, C., Babbi, G., Aggazio, F., & Casa-
dio, R. (2016). Large scale analysis of protein stability in OMIM dis-
ease related human protein variants. BMC Genomics, 17(Suppl 2), 397.https://www.ncbi.nlm.nih.gov/pubmed/?term=27356511
Martelotto, L. G., Ng, C. K., De Filippo, M. R., Zhang, Y., Piscuoglio, S.,
Lim, R. S., … Weigelt, B. (2014). Benchmarking mutation effect
prediction algorithms using functionally validated cancer-related
missense mutations. Genome Biology, 15(10), 484. https://www.ncbi.nlm.nih.gov/pubmed/?term=25969447
Metsalu, T., & Vilo, J. (2015). ClustVis: A web tool for visualizing clustering
of multivariate data using principal component analysis and heatmap.
Nucleic Acids Research, 43(W1),W566–W570.
Miosge, L. A., Field, M. A., Sontani, Y., Cho, V., Johnson, S., Palkova, A.,
… Andrews, T. D. (2015). Comparison of predicted and actual conse-
quences of missense mutations. Proceedings of the National Academy ofSciences of the United States of America, 112(37), E5189–E5198.
Niroula, A., Urolagin, S., & Vihinen, M. (2015). PON-P2: Prediction method
for fast and reliable identification of harmful variants. PLoS One, 10(2),e0117380. https://www.ncbi.nlm.nih.gov/pubmed/?term=25647319
Pei, J., & Grishin, N. V. (2001). AL2CO: Calculation of positional conser-
vation in a protein sequence alignment. Bioinformatics, 17(8), 700–712.
Pei, J., & Grishin, N. V. (2014). PROMALS3D: Multiple protein sequence
alignment enhanced with evolutionary and three-dimensional struc-
tural information.Methods in Molecular Biology, 1079, 263–271.
Pejaver, V., Urresti, J., Lugo-Martinez, J., Pagel, K. A., Lin, G. N., Nam,
H. J., … Mooney, S. D. (2017). MutPred2: Inferring the molecular
and phenotypic impact of amino acid variants. Submitted. http://www.
biorxiv.org/content/early/2017/05/09/134981
Qin, Y., Xu, J., Aysola, K., Begum, N., Reddy, V., Chai, Y.,… Rao, V. N. (2011).
Ubc9 mediates nuclear localization and growth suppression of BRCA1
and BRCA1a proteins. Journal of Cellular Physiology, 226(12), 3355–3367.
Remmert,M., Biegert, A., Hauser, A., & Soding, J. (2011). HHblits: Lightning-
fast iterative protein sequence searching by HMM-HMM alignment.
Nature Methods, 9(2), 173–175.
Robinson, A. B., & Robinson, L. R. (1991). Distribution of glutamine and
asparagine residues and their near neighbors in peptides and proteins.
Proceedings of the National Academy of Sciences of the United States ofAmerica, 88(20), 8880–8884.
Saunders, C. T., &Baker,D. (2002). Evaluationof structural andevolutionary
contributions to deleterious mutation prediction. The Journal of Molecu-lar Biology, 322(4), 891–901.
Savojardo, C., Fariselli, P., Martelli, P. L., & Casadio, R. (2016). INPS-MD: A
web server to predict stability of protein variants from sequence and
structure. Bioinformatics, 32(16), 2542–2544.
Schaefer, C., & Rost, B. (2012). Predict impact of single amino acid
change upon protein structure. BMC Genomics, 13(Suppl 4), S4.
https://www.ncbi.nlm.nih.gov/pubmed/?term=22759652
Schiemann, A. H., & Stowell, K. M. (2016). Comparison of pathogenicity
prediction tools on missense variants in RYR1 and CACNA1S associ-
atedwithmalignant hyperthermia. British Journal of Anaesthesia, 117(1),124–128.
Seeler, J. S., &Dejean,A. (2017). SUMOand the robustness of cancer.NatureReviews Cancer, 17(3), 184–197.
Sonnhammer, E. L., & Ostlund, G. (2015). InParanoid 8: Orthology analy-
sis between 273 proteomes, mostly eukaryotic. Nucleic Acids Research,43(Database issue), D234–D239.
Streich, F. C. Jr., & Lima, C. D. (2016). Capturing a substrate in an activated
RING E3/E2-SUMO complex.Nature, 536(7616), 304–308.

ZHANG ET AL. 1063
Sun, S., Yang, F., Tan, G., Costanzo, M., Oughtred, R., Hirschman, J.,… Roth,
F. P. (2016). An extended set of yeast-based functional assays accurately
identifies human diseasemutations.Genome Research, 26(5), 670–680.
Tatham,M.H., Kim, S., Yu, B., Jaffray, E., Song, J., Zheng, J.,…Chen, Y. (2003).
Role of an N-terminal site of Ubc9 in SUMO-1, -2, and -3 binding and
conjugation. Biochemistry, 42(33), 9959–9969.
Thomas, P. D., & Kejariwal, A. (2004). Coding single-nucleotide polymor-
phisms associated with complex vs. Mendelian disease: Evolutionary
evidence for differences inmolecular effects. Proceedings of the NationalAcademy of Sciences of the United States of America, 101(43), 15398–15403.
Wu, T. J., Shamsaddini, A., Pan, Y., Smith, K., Crichton, D. J., Simonyan,
V., & Mazumder, R. (2014). A framework for organizing cancer-
related variations from existing databases, publications and NGS data
using a High-performance Integrated Virtual Environment (HIVE).
Database (Oxford), 2014, bau022. https://www.ncbi.nlm.nih.gov/
pubmed/?term=24667251
Weile, J., Sun, S., Cote, A. G., Knapp, J., Verby, M., Mellor, J. C., … van
Lieshout, N. (2017). Expanding the Atlas of Functional Missense Vari-
ation for HumanGenes. bioRxiv:166595.
Yang, S. H., Galanis, A., Witty, J., & Sharrocks, A. D. (2006). An extended
consensus motif enhances the specificity of substrate modification by
SUMO. EMBO Journal, 25(21), 5083–5093.
Yue, P., Melamud, E., & Moult, J. (2006). SNPs3D: Candidate gene and
SNP selection for association studies. BMC Bioinformatics, 7, 166.https://www.ncbi.nlm.nih.gov/pubmed/?term=16551372
SUPPORTING INFORMATION
Additional Supporting Informationmay be found online in the support-
ing information tab for this article.
How to cite this article: Zhang J, Kinch LN, Cong Q, et al.
Assessing predictions of fitness effects of missense muta-
tions in SUMO-conjugating enzyme UBE2I. Human Mutation.
2017;38:1051–1063. https://doi.org/10.1002/humu.23293