Embed Size (px)
Citation preview

Assessing public policy impacts: one application of Cooperatives Participating of Agricultural Cooperatives Capitalization Program (Procap-Agro) in Brazil
Neves, Mateus de Carvalho Reis; Braga, Marcelo José Federal University of Viçosa, Brazil
In this paper we proposed an instrumental framework for assessing impacts of credit
public policies applied to agricultural cooperatives in Brazil. Considering whether
cooperatives that received funding of the Agricultural Cooperatives Capitalization
Program (PROCAP-AGRO) have undergone changes related to operating efficiency
and financial structure. For this, was used financial ratios and econometric
approach. Results indicating improvements in the cooperatives after the PROCAP-
AGRO on certain financial ratios and distinct effects on the technical efficiency, as a
result of the varied use of program resources. Finally, we conclude about the
potential of the proposed assessment methodology.

1. Introduction
According to Cook (1995), there are some problems provided by vaguely defined
property rights, which affect both members incentives to invest in organization and overall
ability of cooperative to expand your net worth. Moreover, Chaddad, Cook and Heckelei
(2005) states that financially constrained firms only invest when they generate sufficient cash
flow arising from its operations, while firms not constrained are able to acquire venture
capital from external sources.
Authors such as Parliament and Lerman (1993) and Moller, Featherstone and Barton
(1996) already indicated the occurrence of financial constraint in United States cooperatives,
with small and large ones affected differently: while in the smaller, main difficulty was the
low returns of its operating assets, in the largest, were the high level of debt and high interest
rates charged on bank loans.
In the 2000s, Brazilian government began to partly provide the demand for external
equity financing of these cooperatives, introducing, under the agricultural cooperative,
programs like RECOOP1, PRODECOOP2 and the Capitalization Program of Agricultural
Cooperatives (PROCAP-AGRO)3, to enable the cooperatives to make investments, to
mitigate financial constrains and to business reorganization of their financial structures.
The purpose of this study is to evaluate a Brazilian experience to improve financial
structure of agricultural cooperatives, the Agricultural Cooperatives Capitalization Program
(PROCAP-AGRO), presenting a methodology that enables to check whether the cooperatives
that received funding have undergone any change in their operational efficiency, in their
degree of indebtedness and hence in their financial structure.
As results of the econometric approach in this study, it is observed virtuous potential
of proposed assessment methodology, with the results indicating improvements after the
PROCAP-AGRO on certain financial ratios and distinct effects on the technical efficiency of
cooperatives, as a result of the varied use of program resources, influenced, among other
issues, by the cooperative size.
1 Revitalization Program of the Brazilian Agricultural Cooperatives. 2 Cooperative Development Program for Adding Value to Agricultural Production. 3 Aimed at promoting financial reorganization and formation of capital by individual stations exclusively for agriculture, agribusiness, and aquaculture or fisheries resources through the National Bank for Economic and Social Development.

The paper is structured in three other sections besides this introduction. In the second
section was described the methodology and data used. In third section it’s presented the
results and, finally, the fourth section presents the conclusions.
2. Methodology
In the literature regarding the assessment of government programs, the usage of
models related to Estimation of Treatment Effects such as Propensity Score4 has been
observed. However, the characteristics of the available data not always allow the application
of these models. The impracticability of obtaining information about a relatively large group
of control, with aspects similar to the group of program beneficiaries, as well as the
possibility of using data that contain information about the same individuals before and after
treatment may suggest the usage of other methodologies.
As an alternative, the assessment methodology used in this paper involved the
calculation of financial indicators from balance sheets obtained with the studied cooperatives.
Subsequently, a means and medians test for the selection of those indicators changed during
the period considered in the analysis was carried out. Next, an econometric method of
dynamic panel for establishing the importance of PROCAP-AGRO as an explanatory factor
of variation in financial indicators was employed. The next step was to obtain efficiency
scores using the methodology of Data Envelopment Analysis (DEA). Finally, estimation was
made of the Tobit econometric model to study the significance of the PROCAP-AGRO as an
explanatory variable of changes in the levels of efficiency scores.
2.1. Economic Financial Indicators
From the financial statements published in the reports of the directors of agricultural
cooperatives for the period comprising 2006 to 2010, the analysis was developed using the
following steps:
a) standardization of financial statements;
4 Studies such as those by Magellan, Silveira Neto, Dias and Barros (2006) and Duarte Sampaio Sampaio (2007) used the methodology of estimation of treatment effects. For details on these models, cf. Becker and Ichino (2002) and Khandker, Koolwal and Samad (2010).

b) correction of their nominal values by the Brazilian General Index of Market Prices
(IGP-M), of Getúlio Vargas Foundation, with 2010 as the taxable year;
c) reclassification of equity accounts;
d) calculation of financial indicators.
Subsequently, the financial statements were studied according to the analysis
techniques of balance sheets tailored to the socioeconomic reality of partnerships.
The Equity Ratios refer to comparisons between values of the equity structure of the
organization, i.e., those observed in the Balance Sheet. For better representation of the
results, these asset values can be obtained by arithmetic means between the initial and final
balance of the accounts or distinguished group of balances (not proceeding with the simple
use of balances at end of the year). Thus, we can examine both the sources of funds
(enforceable and non-enforceable obligations) and their applications (assets and rights),
establishing relationships, according to the branch of activity of the company, allowing better
visualization of results obtained from the performed operations (ASSAF NETO, 2010).
The ratios of Asset Variations, in turn, are derived from a comparison of both main
components of financial reports: the Statement of Income for the Year and the Balance Sheet.
As in equity ratios, assets and liabilities used for calculation can be represented by means of
the review period.
Chart 1 presents the key ratios that were calculated for the sample of cooperatives.
[Chart 1]
As this is the study of a Program aimed at improve the working capital of assisted
cooperatives, the dynamic indicators for this particular item were also analyzed according to
the approach suggested by Fleuriet (1980)5. These indicators can be found in Chart 2.
[Chart 2]
2.2. Effects of PROCAP-AGRO on Economic and financial indicators
The mean and median tests are the first step of data treatment by univariate analysis,
aiming to capture the behavior of the accounting and financial indicators (also called
quotients) used in the study before and after the implementation of the Program of
5 For more details, cf. Assaf Neto (2010) and Marques and Braga (1995).

Capitalization of Agricultural Cooperatives – PROCAP-AGRO. These tests tell whether the
indicators are statistically the same or different in the periods before and after the Program.
This study tested whether the indicators followed a normal distribution6, and if not, no
differences in means were evaluated. Additionally, a non-parametric test was used to assess
whether there are differences in medians.
In summary, we verified whether the financial indicators changed in the periods
before and after the entry of the Cooperative in PROCAP-AGRO.
2.3. Determinants of the cooperatives performance
Under a model of panel data, we sought to evaluate the results of PROCAP-AGRO on
agricultural cooperatives fitting to the Program, using the calculated indicators, as shown in
the previous section, and the control variables, in order to capture other characteristics that
may have caused changes in the performance of these cooperatives, without this factor being
directly linked to PROCAP-AGRO.
According to a study by Anuatti-Neto et al. (2005), the use of dynamic panel data
becomes suitable for the analysis of financial indicators, where it is expected that the
inclusion of the lagged dependent term between the explanatory variables capture an element
of persistence.
According to Greene (2008), by resorting to the estimation of dynamic panel, it is
asserted that in addition to the variables that are able to generate the dependent variable in a
given period, the entire history of the dependent variable is deemed important in this respect.
Thus, the empirical model used in this work, considering the use of the dynamic panel
data, is represented below by equation (1):
𝐼𝐷!" = 𝛼 + 𝛽!𝐼𝐷! !!! + 𝛽!𝑃𝑅𝑂𝐶𝐴𝑃!" + 𝛽!𝐺𝐷𝑃𝐵!"#$!" + 𝛽!𝐸𝑋𝐶𝐻𝐴𝑁𝐺𝐸!" + 𝛽!𝐴𝐺𝐸!! + 𝛽!𝐴𝑆𝑆𝐸𝑇𝑆!"
+ 𝜀!"
(1)
where 𝐼𝐷!" represents each performance indicator described in Charts 1 and 2; 𝐼𝐷! !!!
represents the lagged 𝐼𝐷!" variable; the PROCAP-AGRO Dummy variable takes value 0
(zero) for the years previous to the contract of PROCAP-AGRO and value 1 (one) for the
years subsequent to PROCAP-AGRO, and aims to capture the possible effect of the Program 6 For more details on the tests of normality, cf. Doornik and Hansen (1994).

on the variation of indicators ; GDPAGRO refers to the Gross Domestic Product – Agricultural,
whose source of data is the Brazilian Institute of Geography and Statistics (IBGE);
EXCHANGE is the commercial Exchange Rate for sale: real (R$) / US dollar (US$) – end of
period, published on the Bulletin of the Central Bank of Brazil (BCB); AGE is the age in
years of cooperatives; and ASSETS is the total assets of each cooperative. Finally, we have
the term 𝜀!" = 𝜂! + 𝑢!", where 𝑢!" is the stochastic disturbance, and 𝜂! is the stochastic term
for single units, capturing factors that affect the indicators and are constant over time, but
differ from cooperatives, consisting of the so-called individual heterogeneity.
Due to the dynamic nature of the esteemed panel, the developments made by Blundell
and Bond (1998)7 for the estimation of the model were used.
2.4. The Model for Data Envelopment Analysis and Efficiency Analysis
To measure the levels of efficiency in agricultural cooperatives, a non-parametric
technique with approach to multiple inputs and outputs of data envelopment analysis - DEA,
developed by Charnes, Cooper and Rhodes (1978), from Farrell (1957), was used as an
alternative to conventional parametric methods.
To facilitate the implementation of the method, Ferreira (2005) enumerated some
basic assumptions that must be met, namely: a) the set of inputs and outputs used by the
DMUs8 should be the same; b) each DMU should be autonomous in decision making and; c)
the DMUs should be homogeneous and operate in the same unit of measure.
This work overcomes the assumption of higher amount of DMU's relative to the
number of model inputs, using a number of cooperatives greater than the number of inputs
and outputs used in the DEA.
The assumption of homogeneity of DMU’s, which could become a limitation for the
study, was met as both the product and the inputs are measured from a single measurement,
the monetary value of the output and inputs. Thus, although the cooperatives negotiate
various outputs, the measure is the same for all.
7 According to Baltagi (2005), the estimator of Blundell and Bond (1998) has indicated its use for generating efficient to model the dynamic panel estimators when the number of periods of analysis is small. 8 The term DMU (Decision Making Unit) refers to production units in which the relative efficiency of the group being analyzed.

Another limitation that may affect the possibility of DEA providing reliable results
would be the measurement of variables. Thus, in order to minimize this problem, inputs and
outputs were measured on the same basis: monetary and standardized.
The use of the model with variable returns (BCC), capable of capturing technical
efficiency of cooperatives, was chosen. The orientation for output was also chosen,
depending on the specificities of the agricultural products market, which seeks the best use of
basic raw material, determining the quest for an answer to the following question: what is the
maximum that could be produced, given the amount of existing inputs?
The following algebraic notation (2) can represent the BCC model, which assumes
variable returns to the scale and orientation for output:
𝑚𝑎𝑥!,!𝜙,
(2)
𝑠.𝑎.𝜙𝑦! − 𝑌𝜆 ≤ 0,
−𝑥! + 𝑋𝜆 ≤ 0,
𝑁!𝜆 = 1
−𝜆 ≤ 0,
where N1 is a (n x 1) vector of numbers one; 𝑦! is a vector (m x 1) of quantities of output of
the i-th DMU; 𝑥! is a vector (k x 1) of amounts of input from the i-th DMU; Y is a matrix (n x
m) of outputs of n DMU’s; X is a matrix (n x k) of inputs of n DMU’s; λ is a vector (n x 1) of
weights; and φ is a scalar that has values equal to or greater than 1 and indicates the
efficiency score of DMU’s. It is worth noting that the score of technical efficiency of the i-th
DMU, ranging from 0 to 1, can be obtained by 1/φ.9
The work of Ferreira and Braga (2007), who also employed such measures of output
and input to measure the efficiency of cooperatives that operated with multiple outputs, was
used as a reference for application of DEA in cooperatives in Brazil.
The output and inputs, consisting of annual data from 2006 to 2010, were selected
based on studies of Reis, Braga and Bressan (2010): Output (Y) - GROSS SALES (R$) of
each cooperative, represented by the sales volume of cooperatives, providing a measure of
overall outcome of the DMU. Input (X) - OPERATING EXPENSES (R$), which represent
the size of the operational structure, in addition to representing a proxy for the level of 9 For further details about the parametric and nonparametric approaches used in efficiency measurement, cf., Cooper et al. (1995), Reinhard (1999), Perelman and Coelli (1999), Reinhard, Thijssen and Lovell (2000).

professionalization of the cooperative management, since much of the amount is made up by
Expenses with Salaries; PERMANENT ASSETS (R$), which represent the amount of capital
of the cooperatives applied in fixed assets, usually high in agricultural cooperatives.
2.5. Effects of PROCAP-AGRO regarding efficiency scores of agricultural cooperatives
Checking the efficiency, by itself, brings many elements that could indicate whether,
in fact, there was some interaction of PROCAP-AGRO with calculated scores, which made it
necessary to use econometric models able to capture the existence or non-existence of
relationship between the variation of the efficiency and the Program.
Thus, with the values or the efficiency scores of the surveyed cooperatives, in a
second moment, the Tobit model was used in Panel to investigate, after the implementation of
PROCAP-AGRO, whether the surveyed agricultural cooperatives benefited or not in terms of
efficiency.
Tobit model is used where the dependent variable is situated between certain values
or concentrated in equal aspects to a threshold value (Greene, 2008). This is the case in the
present study, as the efficiency scores range from 0 to 1 (zero to one). In these cases, we
have, in statistical terms, a censored sample. In these situations, the application of the Tobit
model aims to circumvent the problem of restriction in efficiency score range by resorting to
statistical techniques that allow inferences to the entire population without loss of quality, as
it would occur in the case of truncated variables.
Equation (3) shows the variables used in the Tobit model estimated:
𝐷𝐸𝐴!" = 𝛼 + 𝛽!𝑃𝑅𝑂𝐶𝐴𝑃!" + 𝛽!𝐺𝐷𝑃𝐵!"#$!" + 𝛽!𝐸𝑋𝐶𝐻𝐴𝑁𝐺𝐸!" + 𝛽!𝐴𝐺𝐸!" + 𝛽!𝐴𝑆𝑆𝐸𝑇𝑆!"
+ 𝜀!"
(3)
- Dependent variable (Y): in determining the efficiency conditions, the efficiency scores
obtained using the Data Envelopment Analysis were employed as a dependent variable.
Therefore, each DMU has a positive coefficient of efficiency, limited to the range from 0 to
1.
- Independent variables (X): the same variables described in equation 1 referring to the
dynamic panel data model were used.
Grosskopf (1996) states that there are a number empirical studies that use this

methodology, given the characteristics of the distribution of efficiency measures from the
DEA. Moreover, Banker and Natarajan (2008), in a study that analyzed several methods for
assessing the impact of environmental variables on changes in efficiency scores, found no
significant advantages in the use of other methods, compared to the Tobit model.
2.6 The sample
A non-experimental model was adopted, and the sample consisted only of those
cooperatives participating in the Program. Thus, the situation of the period previous to
obtaining the PROCAP-AGRO was compared with that after obtaining it.
All assessment was conducted by an evaluator external to cooperatives and agencies
responsible for formulating and implementing the Program in order to strengthen the
neutrality of the assessment.
We used a representative sample of cooperatives covered with funds from PROCAP-
AGRO, in the crop year of 2009/2010, distributed geographically by states with the highest
number of signed contracts.
In order to determine the sample size, we adopted the formulation proposed by Rea
and Parker (2000), suitable for small populations:
𝑆𝑎𝑚𝑝𝑙𝑒 =𝑍! 𝑝 1− 𝑝 𝑁
𝑍! 𝑝 1− 𝑝 + 𝑁 − 1 𝐶! (4)
where C is the maximum permissible error in terms of proportions; Z indicates the confidence
level in units of standard deviation; p is the proportion of the researched universe; and N
indicates the number of elements of the population.
To determine the sample size, we set up a confidence interval (Z) of 99% and a
maximum margin of error (C) of 10%, where 105 cooperatives obtained PROCAP-AGRO in
the season 2009/2010, with this defined as the number of elements in the population (N). The
Brazilian states of Minas Gerais (MG), Paraná (PR), Rio Grande do Sul (RS) Santa Catarina
(SC) and São Paulo (SP) held together, 91.43% of the cooperatives benefited by PROCAP-
AGRO during the season of 2009/2010, and this is the value of the Population Proportion (p)
used for calculation of the sample size.
From (4), the sample size was set to 36 cooperatives. However, in order to avoid that
fewer cooperatives studied than the minimum specified in the sample size calculation, we
chose to visit a greater number of cooperatives, settling at 40 the number of cooperatives
actually surveyed.
These cooperatives were distributed in order to consider the proportionality of the
number of contracts approved in 2009/2010 in each of the five states taken into consideration.
Thus, 11 cooperatives in MG, 9 cooperatives in PR, eight cooperatives in RS, 5 cooperatives
in SC and 7 cooperatives in SP were visited.
Selected cooperatives were grouped as the Gross Sales of the fiscal year 2010, in
Group 1, containing 26 cooperatives with revenue lower than R$ 500 million, or in Group 2,
containing 14 cooperatives with revenues greater than R$ 500 million, considering the
specificities contained in these two groups of different financial bearings. According to the t-
test of difference of performed means, a significant difference between the average Gross
Sales of the two groups of specified cooperatives was found.
The collection of quantitative data (primarily financial statements) and the application
of semi-structured interviews with professionals and/or managers of cooperatives were held
at the chosen cooperatives to obtain qualitative data.
Table 1 contains information regarding the evolution of the Gross Sales of
cooperatives studied during the five years of the analysis.
[Table 1]
As it can be noticed, the years 2009 and 2010 were marked by a decline in average
gross income, which can also be a reflection of the international economic crisis.
The spread of the crisis had as a consequence a reduction in international demand,
which affected domestic exports of farm products, impacting negatively on its prices.
Thus, the cooperatives exercising export activities, or those that, as it usually occurs
in the agricultural sector, are subject to internationally listed commodity prices, suffered
setbacks with the unfolding crisis.
3. Results and Discussion
In this section, the results obtained by analyzing Group 1 are presented, containing the
26 cooperatives with Gross Sales lower than R$ 500 million, and Group 2, containing the 14
cooperatives, which, in 2010, had Gross Sales greater than R$ 500 million.
3.1. Effects of PROCAP-AGRO on Economic and Financial indicators
We evaluated the economic and financial indicators that presented differences in the
period of one year before earning the resources of PROCAP-AGRO with respect to one year
after PROCAP-AGRO. The results are shown in Table 2
Initially, we tested whether the indicators of the groups of Solvency, Capital
Guarantee, Profitability, Growth and Dynamic Analysis of Working Capital had a normal
distribution, to then apply the difference of means test. We also considered the difference of
means test, representing Group 1 of cooperatives with Gross Sales lower than R$ 500 million
and Group 2 of cooperatives with Gross Sales exceeding R$ 500 million.
We note, by the analysis of Table 2, that the majority of indicators have suffered some
sort of statistically significant changes in mean their and/or median during the specified
period, considering Group 1 of the cooperatives.
[Table 2]
Growth was expected from the indicators of the Solvency group, as it was observed
due to lengthened payment terms and the shortage obtained by many of the cooperatives in
hiring PROCAP-AGRO.
With regard to the group of Capital Guarantee, the Short-term debt (DB) was reduced,
as well as the debt in general (LI), indicating the change in the debt profile, as expected,
passing to the long-term profile, with increased LTI. NWC was compromised, being reduced
in the period. However, NCA, conceptualized by Assaf Neto (2010), as the surplus of
permanent resources (long-term), whether self-acquired or from third parties, allocated by the
company, in relation to the amount also applied in the long term, had positive and increasing
value, indicating the possibility of growth in the activities of the cooperative. NCA indicated
improvement in the short-term financial situation, given the conditions of payment of
PROCAP-AGRO. It becomes important to maintain a long-term monitoring in order to
determine if, after the payment of funds, cooperatives will be able to keep improving.
The Profitability group had a decrease in means and/or medians after PROCAP-
AGRO, an expected situation due to increased interest expense, and it may also indicate an
increase in the physical structure, with a consequent increase in operating costs, compared to
the results of the activities of cooperatives, which may be the result of investments that had
not yet completed their period of maturation.

Ratio of the Growth group had different behavior. While the NE and TA indicators
rose in line with expectations, GR decreased, which may be the evidence of a great 2008,
compared to 2010, year of economic activity recovery after the international crisis of 2009
and problems in the price of certain goods, as put by some respondents in the cooperatives.
As these are indicators should be analyzed in a longer period than just one year, if one wants
to observe any trends in their behavior, such indicators depend on more time after obtaining
the PROCAP-AGRO to produce more robust assessments.
With respect to the ratios of the Dynamic Analysis of Working Capital, it was felt that
LT had a positive change in its median, comparing before and after PROCAP-AGRO, which
is an expected result, since long-term pay and shortage of many cooperatives brought
PROCAP-AGRO to compose Non-Current Liabilities, which may have promoted the change
in the debt profile of these cooperatives.
Quotients with differences in statistically significant means and/or medians were
fewer in Group 2, from cooperatives with Gross Sales in 2010 over R$ 500 million. However,
it is worth noting that the General Liquidity indicator (GR), not significant in the analysis of
Group 1, was significant in Group 2, and with drop between the periods of analysis, which
shows, together with the analysis of other liquidity ratios, variations of Non-Current
Liabilities greater than the value of operations in long-term, since this indicator includes
long-term in its composition.
In summary, these results indicate that there are opportunities to capture differences in
the accounting and financial indicators in the periods before and after PROCAP-AGRO from
multivariate econometric models. The use of these models is needed, since the univariate
analyzes presented here do not allow reliable inferences in order to signal whether the
changes in the calculated indicators were due to PROCAP-AGRO.
3.2. Analysis of the effects of PROCAP-AGRO against indicators using Regression model in
Dynamic Panel Data
According to the results estimated by the regression model with dynamic panel data,
using the indicators selected by the mean and median test, only some indicators were
statistically significant to assess the effects of PROCAP-AGRO in the surveyed agricultural
cooperatives.
Table 3 presents the results of the dynamic panel model with respect to the indicators

presented in Table 2, obtained considering only cooperatives in Group 1.
[Table 3]
With respect to the regression of Current Liquidity (CR) of the Solvency group,
presented in Table 3, it is noticed that the coefficient of the PROCAP-AGRO variable was
significant and with a negative sign, indicating that the PROCAP-AGRO resource influences
the ratio inversely. Agustini (1999) states that the CR is related to the ratio of working capital
of the cooperative and can represent its funding sources.
Yet in view of the connection between CR and working capital, Alves (2003)
highlights that agricultural activity requires a large volume of credit, due to the peculiarities
of the sector, such as the seasonality of production and the fact that the capital employed in
the activity becomes unavailable for several months. Thus, the necessary working capital
turns out to be higher than that required in other economic activities, and thus, the
agricultural cooperatives assume the role of redistributors of resources to members.
In the same vein, in a study on the financial management of agricultural cooperatives,
Gimenes and Gimenes (2008) emphasize that the liquidity reduced from the cooperatives of
Parana, which was a function of the magnitude of the Receivables account, accounting for
72.27% of current assets, as the result of a scenario where cooperatives financed their
members, assuming all the risk of default.
Thus, based on the results of the dynamic panel for the CR display, it appears that the
resources of PROCAP-AGRO were not able to allow better management of liquidity of the
surveyed cooperatives, at least in the short term.
The indicator of the Level of Indebtedness (LI) was explained by PROCAP-AGRO,
for Group 1 of cooperatives. It is noted, by examination of Table 3, that the PROCAP-AGRO
variable presented positive sign, having a direct relationship with LI. According to Assaf
Neto (2010), LI is a measure that reveals the level of dependency of the company in relation
to its financing through its own resources. In general, for this indicator, a result higher than 1
denotes greater financial dependence of the company in relation to third-party resources.
Despite the decline of this ratio in the year after joining the program, as shown in
Table 2, this decrease was not due to PROCAP-AGRO, as shown by the positive sign of the
regression displayed in Table 3, which indicates that access to resources is directly linked to
increased LI by elevation of Total Liabilities. Again, this is a consequence considered normal
in the period soon after taking the loans, and the reversal of this trend depends on the use of
these resources.

The indicator of Working Capital Profitability (WCP) was another quotient explained
by PROCAP-AGRO only when Group 1 of the cooperatives was analyzed. The positive sign
indicates an improvement in these WCP after PROCAP-AGRO. This finding goes against
one of the general objectives of the Program – sanitation and financial improvement.
Nevertheless, Table 2 contains information denoting low return on working capital,
with the indicator dropping after PROCAP-AGRO, which confirms the theoretical discussion
about the low levels of profitability of Brazilian agricultural cooperatives.
The positive result of PROCAP-AGRO regarding WCP can be linked to a price
negotiation with suppliers and/or buyers more favorable to cooperatives, given the possibility
of using the resources of the Program, both for cash and storage with a view to better market
conditions for the sale of their outputs, as declared by Group 1.
Thus, it is noticed that, even with worsening levels of WCP after the Program,
PROCAP-AGRO was not responsible for its drop. Instead, it prevented WCP from being
more pronounced.
Finally, with respect to the indicators of Group 2, it was found, by means of
econometric model of dynamic panel, that none of them had significant variable dummy
PROCAP-AGRO to explain them. Therefore, there are no results about this group being
presented. This lack of significance of the PROCAP-AGRO resources to explain changes in
financial and economic ratios of the largest cooperatives may reflect the lower output from
the Program in cooperatives that have large financial structure. However, one cannot dismiss
the importance of this Program for cooperatives in Group 2, including as the result of this on
the efficiency of cooperatives with higher Gross Sales, presented in Table 5.
3.3. Analysis of efficiency using Data Envelopment Analysis (DEA)
Based on accounting data, we applied the model of DEA efficiency analysis, aiming
both to assess the evolution of the efficiency of cooperatives adhering to PROCAP-AGRO
and to analyze changes in the levels of Operating Expenses and Fixed Assets (input) and
Gross Revenue (output) of these cooperatives.
It is relevant to highlight that the efficiency score measured by the DEA model is a
measure concerning the group of cooperatives in the analyzed sample, so a cooperative with
efficiency index equal to 1 (or 100%) in this surveyed group could be classified as inefficient
in another group of agricultural cooperatives.

Table 4 provides an analysis of some important points10. First, there is a small number
of 100% efficient cooperatives when analyzing the billing groups: Group 1 had no more than
23% of 100% efficient cooperatives in 2009, while Group 2 had at most 29%, also in 2009.
[Table 4]
Concerning the mean, the analysis of the evolution of efficiency scores over the years
infers, in Group 1, increase in efficiency, with the measure in 2010 higher than in 2006.
These cooperatives may have taken advantage of the favorable economic situation and high
commodity prices in the second half of the decade, without, however, having been very
affected by the economic crisis of 2009, by basing most of its activities in the domestic
market. However, Group 2 dropped in its mean efficiency score, with constant oscillation
during the study period. The reduced levels of exports of agricultural cooperatives can
explain this result in recent years of the analysis, as evidenced by data from
MDIC/SECEX/DEPLA (2010). The export activity is mainly exerted by the largest Brazilian
cooperatives, which may have been hardest hit by the global economic recession in the most
acute years of the latest crisis.
One must also consider that the sources of inefficiency from cooperatives may be
linked to social demands, since they partly base their decisions on meeting the demands of
the members, even if that means, ultimately, decreased efficiency of operations.
These results present a scenario in which cooperatives in Group 1 behaved more
efficiently after crediting PROCAP-AGRO and showing a drop of efficiency in Group 2.
However, it is not possible to say whether PROCAP-AGRO was responsible for the behavior
observed in the efficiency scores. This item will be clarified in the next section.
3.4. Analysis of the AGRO-PROCAP effects on the efficiency ratio using the Tobit model
In order to verify that the resources of PROCAP-AGRO were significant to explain
the changes observed in the efficiency scores of the surveyed cooperatives, we used the Tobit
econometric model, aiming to identify whether the PROCAP-AGRO dummy variable was
significant. This variable received a value of 0 for the period prior to making the appeal, and
a value of 1 for the period after the decision of the appeal. Control variables that could impact
directly or indirectly on the efficiency scores of cooperatives were added.
10 In Appendix of this paper It lies in Table 1A efficiency scores of each analyzed cooperative.

Given the different dimensions of the surveyed cooperatives, it is valid to use the
Tobit model in both Groups of cooperatives formed from the total sample.
In doing so, we obtained the results presented in Table 5, for Group 1, of cooperatives
with Gross Sales under R$ 500 million, and for Group 2, composed by cooperatives with
Gross Sales exceeding R$ 500 million.
[Table 5]
We note that the PROCAP-AGRO variable is significant for Group 1, with a negative
sign, showing that obtaining the resource interferes negatively in the scores of efficiencies
from cooperatives in this group.
Considering that most cooperatives belonging to Group 1 used the funds obtained in
PROCAP-AGRO to complement the capital used for investment, as quoted in interviews, we
can explain this negative sign by noting that the Operating Expenses and Permanent Assets
(inputs of the DEA model) were high on their values before the Gross Sales (output of DEA
model) was affected by the investment. Thus, it is expected that the PROCAP-AGRO
resources adversely affect the efficiency of scores and that, in the long run, with the recovery
of investment; these scores may be affected positively.
Moreover, the coefficient of the GDPAGRO variable, proxy for economic growth,
represented by the Agricultural GDP, was significant and positive. The EXCHANGE, AGE
and ASSETS variables were not significant in explaining the variations in the efficiency of
cooperatives of Group 1 cooperatives. However, these are control variables used with the
primary purpose of isolating the effect that one wants to capture.
Table 5 also contains the Tobit regression analysis performed only with cooperatives
belonging to Group 2. In this group, the PROCAP-AGRO coefficient was significant and
positive, indicating that the features of the Program are related positively to the efficiency
scores generated by the DEA model. Given the main destination of the resources of
PROCAP-AGRO by the cooperatives of Group 2, as stated in interviews as a source of
working capital for their operations, one can expect almost no impact on Operating Expenses,
as well as in Fixed Assets, inputs of the DEA model; however, there may have been an
indirect positive result in Gross Sales, due to more favorable negotiations with suppliers,
buyers and/or debt renegotiation, which would increase the observed efficiency scores.
Besides the PROCAP-AGRO variable, the EXCHANGE variable also had significant
positive coefficient in the regression that considers the largest cooperatives in the sample,
identifying the importance of export activities concerning the organization of this size.

Thus, given the obtained results, PROCAP-AGRO is a significant factor in explaining
the performance of their efficiency in cooperative groups: in Group 1, the relationship is
negative, but as explained, it is expected that this relationship becomes positive in the long
term; in Group 2, a positive relationship was noted between PROCAP-AGRO and efficiency,
and given the employment reported to perform the resources, we noticed a potential
improvement in the efficiency of these cooperatives after the taking of resources.
4. Conclusions
Characterized as an assessment process of the results of a public policy, which
affected a relatively large universe of agents, we used a sample study in this work due to its
more practical and less costly character.
The used indicators, in addition to seeking to settle the existing subjectivity in surveys
of this kind, provided the basis for the discussion of the presented results. The goal of
applying an econometric analysis model also arises from the attempt to endorse any positive
or negative perceptions about the Program, captured during interviews.
Regarding the results, it was found that, despite the verified efforts of cooperatives in
becoming more efficient and professionalized, it is clear that social issues such as
investments made based on the demands of the members, or the transfer of risks from
operations for these cooperatives, are known points which can contribute to the non-optimal
use of the resources. It is relevant that this social role, which provides cooperative identity to
these organizations, does not substitute their good financial and patrimonial practices, as they
will then succeed, in a sustainable manner, in maintaining their operations and benefits to
society in a more permanent form.
We can notice the value of PROCAP-AGRO with regard to its objectives and
conditions given to borrowers. However, the use of resources in their proper purposes must
be ensured, not being diverted from their duties to offset the lack or difficulty of obtaining
financing lines for long-term investments or loans or funding for rural commercialization.
Thus, it is suggested that deficiencies in these last lines must be met so that these deviations
will not occur.
The need to redefine the scope of the Agricultural Cooperatives Capitalization
Program is remarkable. We should clarify the purpose of its resources: if any, it should be to
finance working capital, which is theoretically how these funds were taken by cooperatives.
By the way, the most recent changes in the Program, with increased financial cost and
decrease in time to discharge, already move in this direction, although they contradict the
expectations of the industry. The total remodeling of PROCAP-AGRO, in this sense, cannot
be a ruled out alternative.
The disadvantages of financing working capital, such as the low yield observed in the
application of funds borrowed, should be stressed to cooperatives and policymakers, which
could hamper the subsequent settlement of the loan. These points bring any funding initiative
in this direction to be monitored closely, in order to not transform cooperatives into eternal
hostages of new funding lines each season.
It is concluded that the proposed assessment methodology involving analysis of
technical efficiency and economic-financial situation of the considered cooperatives was able
to generate the results, which, together, allowed the objectives of this study to be achieved.
Finally, we must emphasize again that the short time between the making and
maturation of the results of applications made by cooperatives of resources by PROCAP-
AGRO may have limited some of the analyzes, despite the use of robust methodology.
Conducting survey on the topic in the coming years is likely to reduce this limitation, since it
can incorporate, to the analysis, more years subsequent to obtaining resources.

Charts and Tables Chart 1 – Performance indicators used in the study11
Name Formula Liquid Ratio (LR) AVLB/CL Quick Ratio (QR) (AVLB + Credits) / CL
Current Ratio (CR) CA / CL General Ratio (GR) (CA + LTA) / (CL + NCL)
Use of Third Party Capital (UTPC) (CL + NCL) / (CL + NCL + NE) Debt Breakdown (DB) CL / (CL + NCL)
Level of Indebtedness (LI) (CL + NCL) / NE Long Term Indebtedness (LTI) NCL / Total Assets Net Working Capital (NWC) NE – NCA
Net Current Assets (NCA) CA – CL Equity Immobilization (IE) Fixed Assets / NE
Equity Profitability (EI) Net Profit / NE Working Capital Profitability (WCP) Operational Result / Total Assets
Gross Margin (GM) Gross Profit / Net Revenue Operating Margin (OM) Operating Income / Net Revenue
Net Margin (NM) Net Profit / Net Revenue Growth in Gross Revenue (GR) [(RBX1/RBX0) - 1] x 100
Growth in Net Equity (NE) [(NE X1/PLX0) - 1] x 100 Growth in Total Assets (TA) [(Total Assets X1/Total AssetsX0) - 1] x 100
Source: Prepared by the author. Chart 2 - Indicators used in the dynamic analysis of the working capital
Name Formula Need for Investment Working Capital (NIC) Operational CA – Operational CL
Treasury (T) Financial CA – Financial CL Net Working Capital (NWC) NE – Permanent Assets
Long Term (LT) NCL – LTA Source: Prepared by the author. Table 1 - Gross Sales of the surveyed cooperatives (thousand R$)
2006 2007 2008 2009 2010 Mean R$422.611,34 R$510.338,39 R$593.715,32 R$584.710,48 R$561.711,32
Standard deviation
R$549.839,84 R$690.885,12 R$861.239,64 R$831.106,20 R$789.141,99
Minimum R$8.841,95 R$16.036,25 R$24.815,83 R$24.186,88 R$25.054,07 Maximum R$3.130.317,10 R$3.992.997,35 R$4.946.878,51 R$4.892.586,25 R$4.583.988,00
Source: Survey data.
11 The Appendix at the end of the study contains Chart 1A, which shows the meaning of the acronyms, used in the formulas of the indicators presented in Charts 1 and 2.
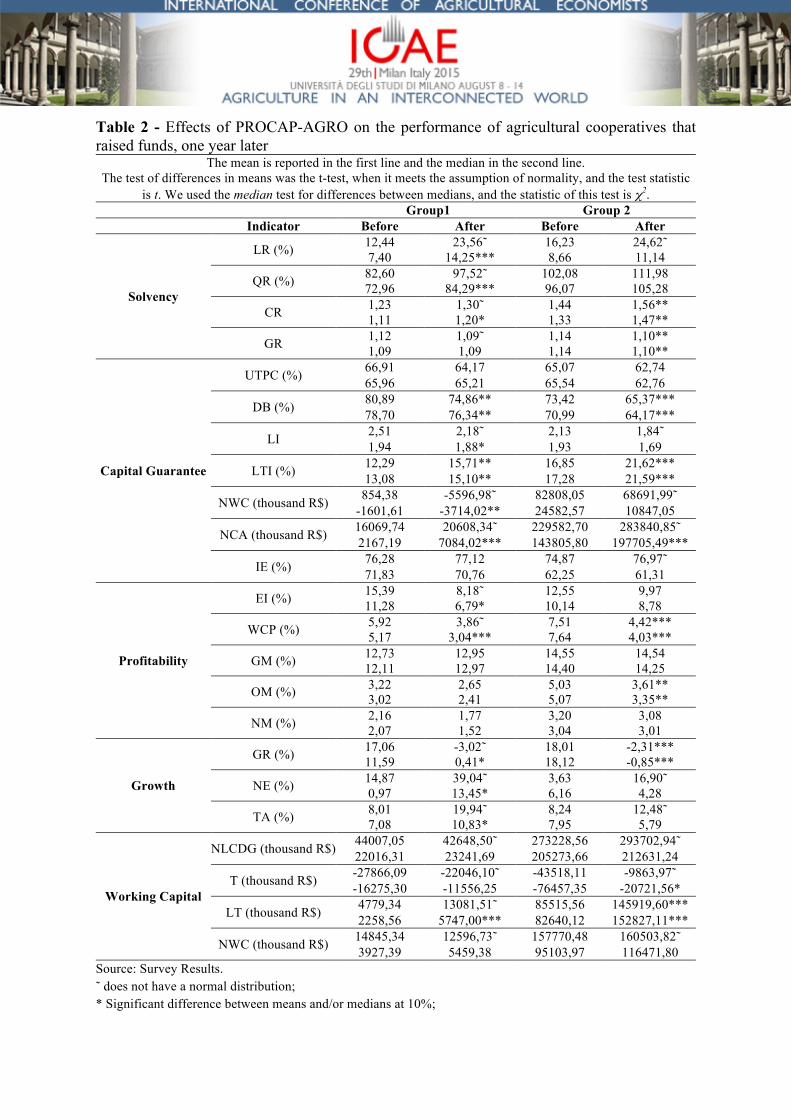
Table 2 - Effects of PROCAP-AGRO on the performance of agricultural cooperatives that raised funds, one year later
The mean is reported in the first line and the median in the second line. The test of differences in means was the t-test, when it meets the assumption of normality, and the test statistic
is t. We used the median test for differences between medians, and the statistic of this test is χ2. Group1 Group 2 Indicator Before After Before After
Solvency
LR (%) 12,44 23,56˜ 16,23 24,62˜ 7,40 14,25*** 8,66 11,14
QR (%) 82,60 97,52˜ 102,08 111,98 72,96 84,29*** 96,07 105,28
CR 1,23 1,30˜ 1,44 1,56** 1,11 1,20* 1,33 1,47**
GR 1,12 1,09˜ 1,14 1,10** 1,09 1,09 1,14 1,10**
Capital Guarantee
UTPC (%) 66,91 64,17 65,07 62,74 65,96 65,21 65,54 62,76
DB (%) 80,89 74,86** 73,42 65,37*** 78,70 76,34** 70,99 64,17***
LI 2,51 2,18˜ 2,13 1,84˜ 1,94 1,88* 1,93 1,69
LTI (%) 12,29 15,71** 16,85 21,62*** 13,08 15,10** 17,28 21,59***
NWC (thousand R$) 854,38 -5596,98˜ 82808,05 68691,99˜ -1601,61 -3714,02** 24582,57 10847,05
NCA (thousand R$) 16069,74 20608,34˜ 229582,70 283840,85˜ 2167,19 7084,02*** 143805,80 197705,49***
IE (%) 76,28 77,12 74,87 76,97˜ 71,83 70,76 62,25 61,31
Profitability
EI (%) 15,39 8,18˜ 12,55 9,97 11,28 6,79* 10,14 8,78
WCP (%) 5,92 3,86˜ 7,51 4,42*** 5,17 3,04*** 7,64 4,03***
GM (%) 12,73 12,95 14,55 14,54 12,11 12,97 14,40 14,25
OM (%) 3,22 2,65 5,03 3,61** 3,02 2,41 5,07 3,35**
NM (%) 2,16 1,77 3,20 3,08 2,07 1,52 3,04 3,01
Growth
GR (%) 17,06 -3,02˜ 18,01 -2,31*** 11,59 0,41* 18,12 -0,85***
NE (%) 14,87 39,04˜ 3,63 16,90˜ 0,97 13,45* 6,16 4,28
TA (%) 8,01 19,94˜ 8,24 12,48˜ 7,08 10,83* 7,95 5,79
Working Capital
NLCDG (thousand R$) 44007,05 42648,50˜ 273228,56 293702,94˜ 22016,31 23241,69 205273,66 212631,24
T (thousand R$) -27866,09 -22046,10˜ -43518,11 -9863,97˜ -16275,30 -11556,25 -76457,35 -20721,56*
LT (thousand R$) 4779,34 13081,51˜ 85515,56 145919,60*** 2258,56 5747,00*** 82640,12 152827,11***
NWC (thousand R$) 14845,34 12596,73˜ 157770,48 160503,82˜ 3927,39 5459,38 95103,97 116471,80
Source: Survey Results. ˜ does not have a normal distribution; * Significant difference between means and/or medians at 10%;

** Significant difference between means and/or medians at 5%; *** Significant difference means and/or medians at 1%;
Table 3 - Effects of PROCAP-AGRO on the economic and financial performance of agricultural cooperatives: Group 1
Solvency Capital Guarantee Profitability
Variables Current Ratio (CR) Level of Indebtedness (LI) Working Capital Profitability (WCP)
ID i(t-1) 0,4635 0,2681** 0,3807*
(0,3584) (0,1201) (0,2162)
PROCAP-AGRO -0,1634*** 0,4518* 2,6850*
(0,0629) (0,2615) (1,5254)
GDPAGRO 5,72e-06*** -0,0001** -0,0001 (1,42e-06) (0,0001) (0,0002)
EXCHANGE -0,1916 0,3743 5,5891** (0,1256) (0,3955) (2,4818)
AGE 0,0052 -0,0657 0,0455
(0,0070) (0,0647) (0,2780)
ASSETS -3,78e-07 4,63e-06 -2,30e-06 (5,91e-07) (4,37e-06) (0,0001)
Constant 0,0808 6,7331* 1,6317
(0,6575) (4,0946) (22,5602) Observations 104 104 78 Number of groups 26 26 26 According to the first-order autocorrelation test of Arellano and Bond, the estimated models do not have autocorrelation issues. Source: Survey Results. * Significant at 10%. ** Significant at 5%. *** Significant at 1%. ( ) standard error of the estimate.
Table 4 - Scores of efficiency assuming Variable Returns to Scale: Group 1 and Group 2
Group Year Efficient Units (%) Mean Standard deviation Maximum Minimum Degree of
Inefficiency
Group 1 (26 coop.)
2006 15,3846 0,5430 0,2770 1,0000 0,1673 84,1533 2007 15,3846 0,5990 0,2813 1,0000 0,1958 66,9462 2008 19,2308 0,6231 0,2761 1,0000 0,2264 60,4851 2009 23,0769 0,5938 0,2858 1,0000 0,1884 68,4093 2010 19,2308 0,6204 0,2630 1,0000 0,2627 61,1895
Group 2 (14 coop.)
2006 28,5714 0,6590 0,2482 1,0000 0,2654 51,7444 2007 28,5714 0,6019 0,2804 1,0000 0,2846 66,1330 2008 21,4286 0,5829 0,2713 1,0000 0,3022 71,5664 2009 28,5714 0,6405 0,2730 1,0000 0,2348 56,1402 2010 21,4286 0,5745 0,2619 1,0000 0,3089 74,0773
Source: Survey results.

Table 5 – Effects of PROCAP-AGRO on economic and financial performance of agricultural cooperatives: Group 1 and Group 2
Variables Efficiency score – Assuming Variable Returns
Group 1 coefficients Group 2 coefficients
PROCAP-AGRO -0,1541** (0,0769)
0,1836** (0,0806)
GDPAGRO 3,77e-06*** (1,37e-06)
-2,78e-06* (1,52e-06)
EXCHANGE -0,0171 (0,1016)
0,3469*** (0,1050)
AGE -0,0012 (0,0036)
0,0118** (0,0058)
ASSETS -4,55e-07 (4,07e-07)
1,03e-07 (1,07e-07)
Constant 0,3401* (0,2720)
0,0152 (0,3390)
Observations 130 70 Number of groups 26 14
Sigma_u: 0,2790*** (0,0456)
0,2810*** (0,0744)
Sigma_e: 0,2040*** (0,0171)
0,01173*** (0,0158)
Rho: 0,6516
(0,0819) 0,8516
(0,0738) Wald χ2 (5): 9,37* 14,10** Source: Survey results. * Significant at 10%. ** Significant at 5%. *** Significant at 1%. ( ) standard error of the estimate.
References AGUSTINI, Carlos A., 1999. Capital de giro: análise das alternativas de financiamento. 2. ed. São Paulo: Atlas.
ALVES, André G.M.P., 2003. As cooperativas agropecuárias e o BRDE: histórico, situação atual e perspectivas. Banco Regional de Desenvolvimento do Extremo Sul, Diretoria de Planejamento, Superintendência de Planejamento.
ANUATTI-NETO, Francisco; BAROSSI-FILHO, Milton; CARVALHO, Antônio G.; MACEDO, Roberto., 2005. Os efeitos da privatização sobre o desempenho econômico e financeiro das empresas privatizadas. Revista Brasileira de Economia, vol.59, n.2. pp. 151-175.
ASSAF NETO, Alexandre., 2010. Finanças Corporativas e Valor. 5. Ed. São Paulo: Atlas.
BALTAGI, Badi H., 2008. Econometric Analysis of Panel Data. 4 ed. West Sussex: John Wiley & Sons.
BANCO CENTRAL DO BRASIL, 2002. Resolução n. 2.987, de 03 de julho de 2002. Institui o Programa de Desenvolvimento Cooperativo para Agregação de Valor à Produção Agropecuária (PRODECOOP), ao amparo de recursos equalizados pelo Tesouro Nacional junto ao Banco Nacional de Desenvolvimento Econômico e Social (BNDES). Diário Oficial da União, Brasília, DF, 04 jul.
BANCO CENTRAL DO BRASIL, 2009 Resolução n. 3.739, de 22 de junho de 2009. Institui, no âmbito do BNDES, o Programa de Capitalização de Cooperativas Agropecuárias (Procap-Agro). Diário Oficial da União, Brasília, DF, 23 jun.
BANKER, Rajiv; NATARAJAN, 2008. Ramachandran, Evaluating Contextual Variables Affecting Productivity Using Data Envelopment Analysis. Operations Survey, v. 56, n. 1, p. 48-58.
BECKER, Sascha O.; ICHINO, Andrea, 2002. Estimation of average treatment effects based on propensity scores. The Stata Journal, v. 2, n. 4, p. 358-377.
BLUNDELL, Richard; BOND, Steve, 1998. Initial conditions and moment restrictions in dynamic panel data models. Journal of Econometrics, 87(1), 115-143.
CHADDAD, F.R., COOK, M.L.; HECKELEI, T., 2005. Testing for the Presence of Financial Constraints in US Agricultural Cooperatives: An Investment Behaviour Approach. Journal of Agricultural Economics, v.56, n.3, p.385–97.
CHARNES, Abraham, COOPER, William W., RHODES, Edwardo, 1978. Measuring the efficiency of decision-making units. European Journal of Operational Survey, v.2, p.429-444.
COELLI, Timothy J., PERELMAN, Sergio, 1999. A comparison of parametric and non-parametric distance functions: with application to European railways. European Journal of Operational Survey, v. 117, p. 326-339.
COOK, M.L., 1995. The Future of US Agricultural Cooperatives: A Neo Institutional Approach. American Journal of Agricultural Economics, v.77, p.1153-59. Dec.
COOPER, William W., KUMBHAKAR, Subal C., THRALL, Robert M., YU, Xuelin, 1995. DEA and stochastic frontier analyses of the 1978 Chinese economic reforms. Socio-Economic Planning Sciences, n. 29, p. 85-112.
DOORNIK, Jurgen A.; HANSEN, Henrik, 2008. An omnibus test for univariate and multivariate normality. Oxford Bulletin of Economics and Statistics, v. 70, n. s1, p. 927-939.
DUARTE, Gisléia B.; SAMPAIO, Breno; SAMPAIO, Yony de S. B., 2008. Impactos do Programa Bolsa Família sobre os Gastos com Alimentos de Famílias Rurais. Revista da ABET, v. 7, n. 1.
FARRELL, Michael J., 1957. The measurement of production efficiency. Journal of the Royal Statistical Society, series A, part III, p.253-290.
FERREIRA, Marco Aurélio M., 2005. Eficiência técnica e de escala de cooperativas e sociedades de capital na indústria de laticínios do Brasil. 158 f. Tese (Doutorado em Economia Aplicada) – Universidade Federal de Viçosa, Viçosa, MG.
FERREIRA, Marco Aurélio M.; BRAGA, Marcelo J., 2007. Eficiência nas Sociedades Cooperativas e de Capital na Indústria de Laticínios. Revista Brasileira de Economia. v.1, n.2, p.231-244.
FLEURIET, Michel; KEHDY, Ricardo; BLANC, Georges, 1980. A dinâmica financeira das empresas brasileiras. Belo Horizonte. Fundação Dom Cabral.
GIAMBIAGI, Fabio; MOREIRA, Maurício M., 1999. A economia brasileira nos anos 90. Rio de Janeiro: Banco Nacional de Desenvolvimento Econômico e Social.
GIMENES, Régio M.T.; GIMENES, Fátima M.P., 2008. Aplicabilidade da análise dinâmica do capital de giro como instrumento de avaliação da gestão financeira em cooperativas agropecuárias. Revista de Economia Contemporânea. Rio de Janeiro, v.12, n.1, p.129-50.
GREENE, William H., 2008. Econometric Analysis. 6.ed. New Jersey: Pearson.
GROSSKOPF, Shawna, 1996. Statistical inference and non-parametric efficiency: a selective survey. Journal of Productivity Analysis, v.7, p.161–176.
KHANDKER, Shahidur R.; KOOLWAL, Gayatri B.; SAMAD, Hussain A., 2010. Handbook on impact assessment – Quantitative methods and practices. Washington, DC: The World Bank; 239p.
MAGALHÃES, André M.; SILVEIRA NETO, Raul; DIAS, Fernando M.; BARROS, Alexandre R., 2006. A experiência recente do PRONAF em Pernambuco: Uma análise por meio de Propensity Score. Economia Aplicada, v. 10, n. 1, p. 57-74.
MARQUES, José Augusto V.C.; BRAGA, Roberto, 1995. Análise dinâmica do capital de giro – o modelo Fleuriet. Revista de Administração de Empresas, São Paulo, v.35, n.3, p.49-63.
MINISTÉRIO DA FAZENDA, 1998. Portaria n. 26 de 13/02/1998. Dispõe sobre medidas de revitalizações de cooperativas de produção agropecuária. Diário Oficial da União, Brasília, DF, 18 feb.

MOLLER, L.G.; FEATHERSTONE, A.M.; BARTON, D.G., 1996. Sources of financial stress in agricultural cooperatives. Journal of Cooperatives, v.11, p.38-50.
MONTEIRO, Geraldo T.M., 2002. A Avaliação dos impactos sociais dos programas de governo. In: Congresso Internacional Del Clad Sobre La Reforma Del Estado Y De La Administración Pública, 7. Lisboa. Anales... Lisboa, Portugal.
PARLIAMENT, C. LERMAN, Z., 1993. Risk and equity in agricultural cooperatives. Journal of Agricultural Cooperation, v.8, p.1-14.
REA, Louis M; PARKER, Richard A., 2000. Metodologia de Pesquisa: do planejamento à execução. São Paulo: Pioneira.
REINHARD, Stijn, 1999. Econometric analysis of economic and environmental efficiency of Dutch dairy farms. 184 f. Tese (Doutorado em Economia Agrícola) - Wageningen Agricultural University, Wageningen.
REINHARD, Stijn; LOVELL, Knox C.A.; THIJSSEN, Geert J., 2000. Environmental efficiency with multiple environmentally detrimental variables: estimated with SFA and DEA. European Journal of Operational Survey, v.121, p.287-303.
REIS, Brício S.; BRAGA, Marcelo J.; BRESSAN, Valéria G.F., 2010. Análise Financeira dos Impactos do RECOOP em Cooperativas Agropecuárias Selecionadas. Viçosa, MG. Relatório.
SANTOS, Ercílio, 2005. Decisões financeiras em uma cooperativa agropecuária: uma análise pelo modelo Fleuriet. In: Congresso da Sociedade Brasileira de Economia e Sociologia Rural, 43. Ribeirão Preto, Anais... Brasília: SOBER.
STAATZ, John M., 1987. The Structural Characteristics of Farmer Cooperatives and Their Behavioral Consequences. In: ROYER, Jeffrey S. (Org.). Cooperative Theory: New Approaches. Washington: USDA Agricultural Cooperative Services. p. 33– 60.
Appendix Chart 1A – Description of variables related to financial indicators
Variable Acronym Description Current Assets CA Total Assets, except Non-Current Assets
Current Liabilities CL Total Assets, except Non-Current Liabilities Financial Current Assets FCA Availabilities, plus Funding of Members
Financial Current Liabilities FCL Funding of Current Liabilities Operational Current Assets OCA Current Assets, except Financial Current Assets
Operational Current Liabilities OCL Current Liabilities, except Financial Current Liabilities Availabilities AVLB Current Assets, except Loans and Stocks
Non-Current Assets NCA Total Assets, except Current Assets Long-term Assets LTA Non-Current Assets, except Investments, Fixed and Intangible

Non-Current Liabilities NCL Total Liabilities, except Non-Current Liabilities
Net Equity NE Share Capital, plus Reserves and Legal and Statutory Funds, plus others
Revenue RV Gross Operating Revenue, except returns and tax Gross Profit GR Revenue, except Costs of Sold Products
Source: Prepared by the authors based on Anuatti-Neto et al. (2005) and Santos (2005). Table 1A - Scores of efficiency assuming Variable Returns to Scale DMU 2006 2007 2008 2009 2010 Coop_1 0,8019 1,0000 1,0000 0,6596 0,9004 Coop_2 0,6841 0,8588 0,7776 0,7321 0,5249 Coop_3 1,0000 0,8447 0,8354 1,0000 1,0000 Coop_4 0,3737 0,5068 0,4347 0,3691 0,6042 Coop_5 0,3670 0,4389 0,7491 1,0000 0,8866 Coop_6 0,5470 0,4557 0,3911 0,3730 0,6429 Coop_7 0,2583 0,3294 0,3183 0,2666 0,2825 Coop_8 0,8030 0,9174 0,7472 0,5331 0,5952 Coop_9 1,0000 1,0000 1,0000 1,0000 1,0000 Coop_10 0,6222 0,7540 0,8261 0,7032 1,0000 Coop_11 1,0000 1,0000 1,0000 0,6637 0,8607 Coop_12 1,0000 1,0000 1,0000 1,0000 0,7846 Coop_13 1,0000 1,0000 0,8507 1,0000 1,0000 Coop_14 0,6436 0,5905 0,6617 0,8055 0,6425 Coop_15 1,0000 1,0000 1,0000 1,0000 1,0000 Coop_16 0,7447 0,6490 0,6149 0,6300 0,4767 Coop_17 0,5131 0,4617 0,4541 0,5599 0,4457 Coop_18 0,4983 0,3137 0,3355 0,4213 0,3262 Coop_19 0,4405 0,4461 0,3787 0,5030 0,3618 Coop_20 0,2278 0,2956 0,2869 0,2089 0,4333 Coop_21 0,6239 0,6749 1,0000 1,0000 1,0000 Coop_22 0,4922 0,8218 0,5881 0,8155 0,7503 Coop_23 0,8332 0,9122 0,9672 1,0000 1,0000 Coop_24 0,3766 0,3301 0,3939 0,5410 0,3311 Coop_25 0,4747 0,3734 0,4437 0,5304 0,4240 Coop_26 0,2139 0,3804 0,4278 0,3398 0,5429 Coop_27 0,2952 0,2493 0,3212 0,2294 0,3468 Coop_28 0,2654 0,2846 0,3022 0,2348 0,4578 Coop_29 0,2214 0,2689 0,2264 0,2473 0,4446 Coop_30 0,6202 0,5589 0,4204 0,5803 0,4492 Coop_31 0,2651 0,3260 0,5169 0,5725 0,3401 Coop_32 0,5423 0,5730 0,5833 0,4909 0,4640 Coop_33 1,0000 1,0000 1,0000 1,0000 1,0000 Coop_34 0,5260 0,3554 0,3299 0,3581 0,2627 Coop_35 0,5915 0,7063 0,7841 0,7342 0,7501 Coop_36 0,5258 0,3969 0,3131 0,3889 0,3652 Coop_37 0,2851 0,3783 0,4575 0,4122 0,4640 Coop_38 0,4997 0,3520 0,3851 0,3124 0,3089 Coop_39 1,0000 1,0000 1,0000 1,0000 0,4333 Coop_40 0,1673 0,1958 0,2381 0,1884 0,2696 Source: Survey results.