Embed Size (px)
Citation preview
1
Assessing Ride Sharing Use at Boston College
Annie Silk & Sarah Hunkins
Environmental Studies Seminar ENVS4943
May 1st, 2019
2
Table of Contents
I. Abstract ..........................................................................................................................3
II. Introduction...................................................................................................................4
III. Methods.......................................................................................................................8
IV. Results.........................................................................................................................9
V. Discussion....................................................................................................................17
Factors That Lead to More Ride Sharing...........................................................17
Impacts on Human Health and the Environment.............................................. 17
Environmental Awareness on Campus.............................................................19
Limitations and Concluding Thoughts...........................................................21
VI. Recommendations.......................................................................................22
Designated “Green” Pick Up Location......................................................22
Increased Frequency and Awareness of Shuttle Services.......................22
Required Canvas Module...........................................................................23
Follow-Up Survey......................................................................................23
VII. References...................................................................................................... 24
3
I. Abstract
Riding sharing apps have been in existence now for over ten years. Although they
have proven to be convenient and cheaper than a typical taxi, there have been serious
concerns surrounding their environmental impact on the planet. As greenhouse gas
emissions continue to rise each year, transportation is at the forefront of the conversation
as to how to become more eco-friendly and environmentally conscious. This report
provides a detailed study and analysis of the habits and perceptions of Boston College
students when it comes to ride sharing apps and their environmental awareness
surrounding transportation. By gathering over one hundred responses to a survey, the aim
of this data collection was to gather information on two distinct questions, “What is the
reason for students’ desire to transport via vehicle sharing apps over public
transportation?” and “How are carbon emissions on campus impacted through the use of
vehicle sharing apps?” The research found that there is a need for a “green” pick up
locations on campus so that Uber and Lyft drivers do not have to idle for too long with
their vehicle running as they wait for their pick up. Another conclusion that was made
was the need for increased frequency and awareness of Boston College shuttle busses to
grocery stores. A third recommendation that was made based on the survey is the need
for a required module for Boston College students to be educated and learn about
becoming more environmentally aware. This research will be sent to the head of
transportation at Boston College with hopes of making improvements on the
transportation efficiency of the campus.
4
II. Introduction
This study’s aim was to build an understanding surrounding the high increase in ride
sharing app use on Boston College’s campus. Since Uber and Lyfts’ creation in the past decade,
there have been questions surrounding their impact on the environment. The problem that
catalyzed the creation of this project was assessing the motives behind Boston College students’
transportation habits. Boston College has shuttle busses that travel around main campus, Newton
campus, as well as Brighton campus. There are also shuttle busses that have limited hours that
take students to Newton center which has easy accessibility to a grocery store. These options are
available at no charge for students; however, there has still been a high increase in the past few
years of ride sharing app use. Boston College is also situated directly next to the green B line of
the MBTA, providing students with a chance to travel into Boston at a low price. Although these
options seem accessible, the low price and convenience of calling a Lyft or Uber seems to attract
many students to their platform. Environmental consciousness was also assessed in this study, to
look at whether students at Boston College are influenced by their ecological footprint when it
comes to choosing their transportation method. The hypothesis for this project was: We believe
that as a result of the convenience and low cost of ride sharing apps, there is a larger amount of
carbon emissions being released on the Boston College campus coming from idling and more
pickups on the actual campus.
The unintended consequences of ride sharing have still not been thoroughly understood
or researched; however, there is a steady amount of literature that has been emerging that helps
shed light on the impacts of ride sharing apps on the environment as well as trends surrounding
use of these services. One of the biggest reasons for wanting to explore the Uber and Lyft habits
of Boston College students is because of this lack of research and knowledge surrounding the
environmental and social effects of this rising form of transportation in our society. Although the
research is limited, Caroline Rodier writes in her analysis, “The Effects of Ride Hailing Services
on Travel and Associated Greenhouse Gas Emissions”, that there has been a rise in research
starting in 2016. She emphasizes that more information surrounding ride-sharing habits can help
policy makers make decisions surrounding transportation in the future (Rodier 18). We hope that
our research will help provide information for Boston College to become more aware of the
5
transportation habits on campus and formulate transportation policies to take into account the
rise in ride-sharing.
A review of the literature on this topic reveals the pros and cons of innovations such as
Lyft and Uber. Juliet Schor points out in her paper “Debating the Shared Economy” that many
people believe the sharing economy has ecological benefits yet carsharing has increased
emissions due to the expanding access to cars (Schor 6). Schor discusses the importance of
paying attention to the ripple effects and not just the surface level changes. She highlights the
idea that an airbnb host may use the extra money made to buy high-impact products and this
model might lead people to buy more new things (Schor 7). She also brings up the fact that if
travel is less expensive, more people might do it increasing ecological and carbon footprints
(Schor 7). Lastly, Schor discusses the idea that the low cost of ride services causes people to
stray away from public transportation due to convenience. This would also increase carbon
emissions.
Murtaza Haider wrote a paper titled, “To Uber or Not to Uber” exploring the pros and
cons of this newer service. One important idea they highlight is that taxicab deregulation will
likely worsen traffic congestion which in turn will increase tailpipe emissions (Haider 1). With
the invention of Uber and Lyft, there are more cars on the road because there are less barriers to
entry in this market. Haider points out that pollutants become more heavily concentrated when
there is traffic because of the stopping and starting of vehicles (Haider 13). This can increase
short-term and long-term morbidity among drivers and households near these roads (Haider 13).
This is a critical fact when translated on to BC’s campus. Ubers and Lyfts are constantly
stopping and starting around campus trying to find their designated students to pick up.
Additionally, Uber and Lyft have likely increased congestion on roads like Beacon Street and
Commonwealth Avenue. This congestion can negatively affect students on campus that live near
these roads. Another important idea Haider et al. discusses is that the level of pollution emitted
by public transportation stays constant whether one person or twenty people use it (Haider 14).
This means the pollution coming from the T and buses will remain the same while increased
congestion will result in increased pollution.
In her paper “Sustainability and Shared Mobility Models” Georgina Santos discusses the
challenges of quantifying the impacts made in the shared mobility model. Unlike public
6
transportation, there are no statistics kept by governments on mobility services (Santos 4). Santos
breaks different car sharing services into separate models. Model 3 is the typical Lyft or Uber
model while Model 4 is the carpooling model such as Lyft Line or Uber Pool. She states that a
100% replacement of all bus and car trips by these new modes would result in CO2 emissions
being reduced by 62% (Santos 5). This is a substantial reduction but it would only happen if
everyone was using these carpooling modes, which is not always the case.
One article that was found to be especially influential was researched and reported by the
Metropolitan Area Planning Council. The report was titled, “Fare Choices: A Survey of Ride-
Hailing Passengers in Metro Boston”, and highlights the mindset in the shifting transportation
industry. They found from their surveys that 42% of passengers would have used public
transportation if a ride-hailing app was not available. Their survey also found that about 12% of
users would have walked or ridden a bike if the service was not available to them (Gehrke et al,
2018, pg. 14). This amounts to 59% of passengers who would normally find a more sustainable
way to travel; however, due to convenience and ease they are helping add additional cars to the
road by promoting these app businesses. This adds to Murtaza Heider’s research who concluded
that public transportation such as a bus will continue to operate whether there is one person or a
full bus. Thus, if more people opt for a ride-hailing app as their mode of transportation there will
still be the same amount of busses operating--creating an uneven distribution and heightening the
level of emissions being emitted (Haider 14).
Interesting trends emerged from the survey that Metropolitan Area Planning Council in
Boston created. Their survey found that 82% of the total surveyors were born after the year 1983.
(Gehrke et al, pg. 6). This helps back up the claim in this paper that college students are one of
the largest cohorts flocking to Uber and Lyft. Thus, looking at Boston College students’ habits
will help illuminate trends that have emerged among millenials.
One of the aims of this research was to assess the environmental consciousness of Boston
College students and if their transportation tendencies have changed due to the higher awareness
of fossil fuel emissions. Joireman and his researchers published an article titled, “Who Cares
about the Environmental Impact of Cars?: Those with an Eye toward the Future”. Their research
found that individuals will act eco-friendly based on the extent that those actions impinge on
their own personal values that they uphold such as relationships, jobs, and their home (Joireman
et al. pg. 7). For example, a person may be concerned that the emissions released from a vehicle
7
will cause higher rates of pollution and thus their scenery will not be as attractive as before. This
will push people to act in a more environmentally friendly way. Assessing what Boston College
students value in terms of transportation will help provide solutions that will be effective to the
community as a whole.
One of the most misconstrued assumptions is that with the rise of ride sharing apps, more
people will be selling or donating their cars in order to fully commit to one mode of
transportation. Mishra and Clewlow wrote a thorough research report titled, “Disruptive
Transportation: The Adoption, Utilization, and Impacts of Ride-Hailing in the United States” that
looks at the way Uber and Lyft have affected the transportation industry and the impacts this has
on the changing climate. In their research, they found that 91% of ride hailing users keep their
car (Mishra and Clewlow, 2017, pg. 5). This means that there continue to be more cars on the
road. However, Clewlow makes a great point when interviewed by Wired, saying that what
really matters is not if people own cars but how many miles are being driven on the road
(Marshall 2018). Mishra and Clewlows research which focused on large metropolitan areas in
the United States, found that Uber and Lyft are likely to contribute to a growth in vehicle miles
traveled (VMT), leading to higher amounts of fossil fuels being emitted into the atmosphere
(Mishra Clewlow pg. 2). This literature has helped provide insight into the questions that should
be pursued for this research of Boston College. Researchers around the country have become
aware of the drastic implications that Uber and Lyft could have on both the environment as well
as human habits and lifestyles.
8
III. Methods
Before beginning the research for this study, approval needed to be gained from the
Institutional Review Board (IRB), since the research required human subjects to be involved.
While this approval was in process, the head of Boston College parking and transportation was
contacted in order to gain more insight into transportation habits and statistics on campus. His
insight, as well as the advice of Professor Juliet Schor, a professor that researches consumption
habits, helped with the creation of survey questions that would be sent out to Boston College
students that live on campus. During the approval process, more and more literature was
gathered in order to bolster the research of the paper. Once IRB approved the research, a
Qualtrics survey was sent out to Boston College students. The students were asked to respond to
21 questions that assessed their Uber and Lyft usage as well as questions that pertained to their
environmental awareness. There were 101 respondents to the survey. Once the information was
gathered, conclusions were able to be made that led to the creation of recommendations for
Boston College to implement.
9
IV. Results
This section provides insight into the data that was collected from the 101 Boston College
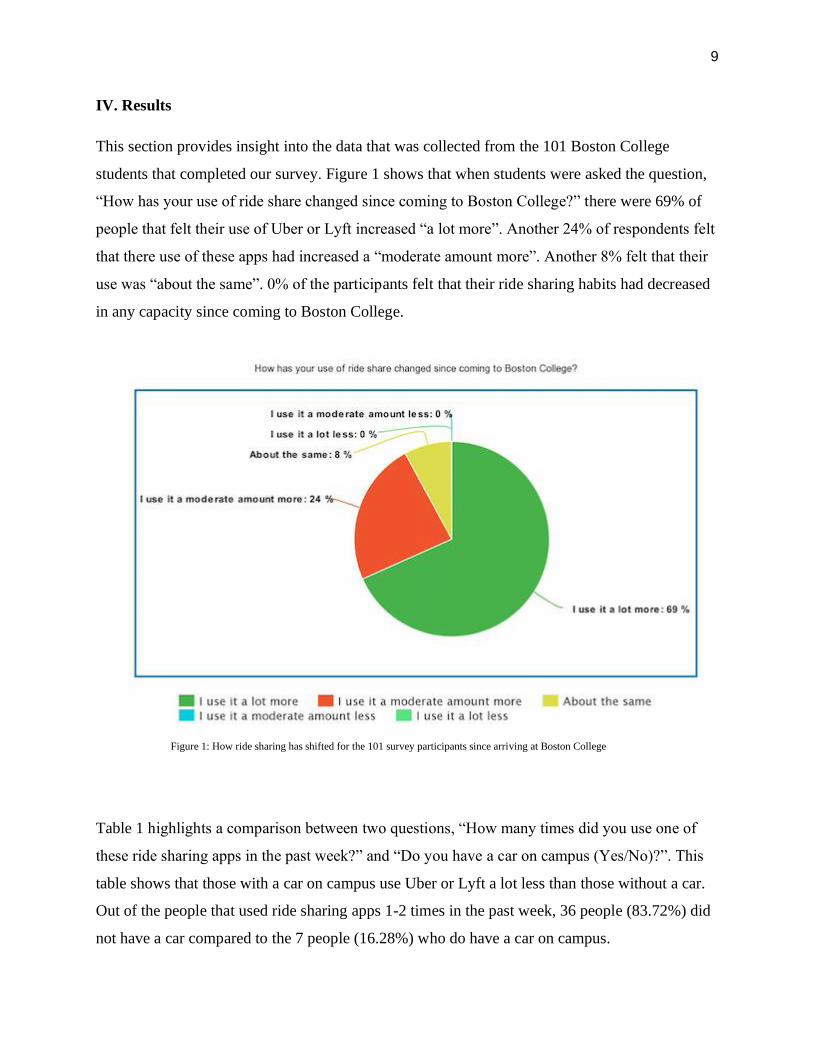
students that completed our survey. Figure 1 shows that when students were asked the question,
“How has your use of ride share changed since coming to Boston College?” there were 69% of
people that felt their use of Uber or Lyft increased “a lot more”. Another 24% of respondents felt
that there use of these apps had increased a “moderate amount more”. Another 8% felt that their
use was “about the same”. 0% of the participants felt that their ride sharing habits had decreased
in any capacity since coming to Boston College.
Table 1 highlights a comparison between two questions, “How many times did you use one of
these ride sharing apps in the past week?” and “Do you have a car on campus (Yes/No)?”. This
table shows that those with a car on campus use Uber or Lyft a lot less than those without a car.
Out of the people that used ride sharing apps 1-2 times in the past week, 36 people (83.72%) did
not have a car compared to the 7 people (16.28%) who do have a car on campus.
Figure 1: How ride sharing has shifted for the 101 survey participants since arriving at Boston College
10
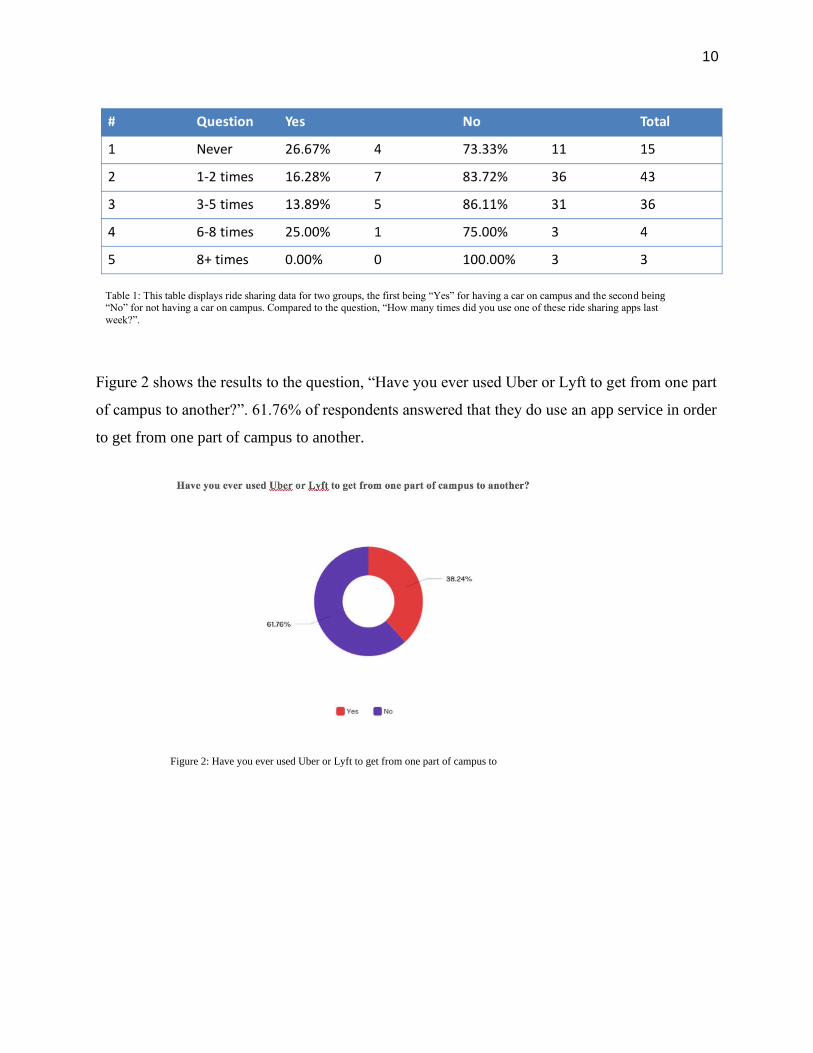
Figure 2 shows the results to the question, “Have you ever used Uber or Lyft to get from one part
of campus to another?”. 61.76% of respondents answered that they do use an app service in order
to get from one part of campus to another.
Table 1: This table displays ride sharing data for two groups, the first being “Yes” for having a car on campus and the second being “No” for not having a car on campus. Compared to the question, “How many times did you use one of these ride sharing apps last
week?”.
Figure 2: Have you ever used Uber or Lyft to get from one part of campus to
another?
11
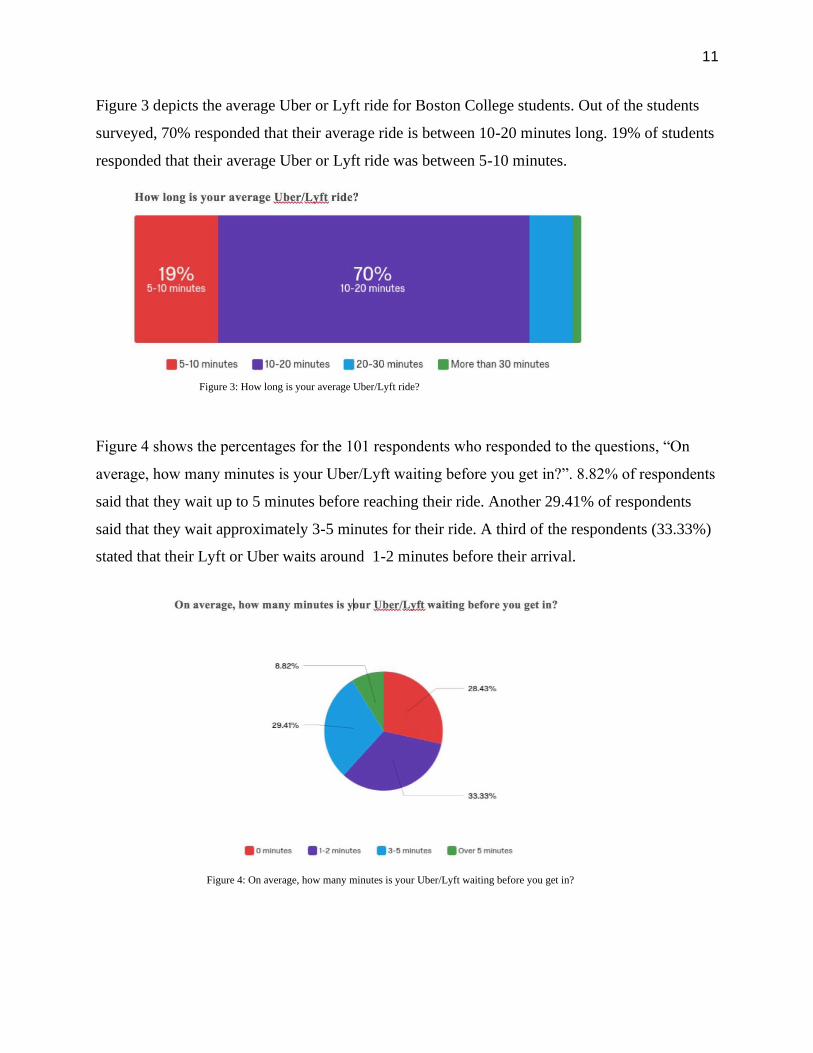
Figure 3 depicts the average Uber or Lyft ride for Boston College students. Out of the students
surveyed, 70% responded that their average ride is between 10-20 minutes long. 19% of students
responded that their average Uber or Lyft ride was between 5-10 minutes.
Figure 4 shows the percentages for the 101 respondents who responded to the questions, “On
average, how many minutes is your Uber/Lyft waiting before you get in?”. 8.82% of respondents
said that they wait up to 5 minutes before reaching their ride. Another 29.41% of respondents
said that they wait approximately 3-5 minutes for their ride. A third of the respondents (33.33%)
stated that their Lyft or Uber waits around 1-2 minutes before their arrival.
Figure 3: How long is your average Uber/Lyft ride?
Figure 4: On average, how many minutes is your Uber/Lyft waiting before you get in?
12
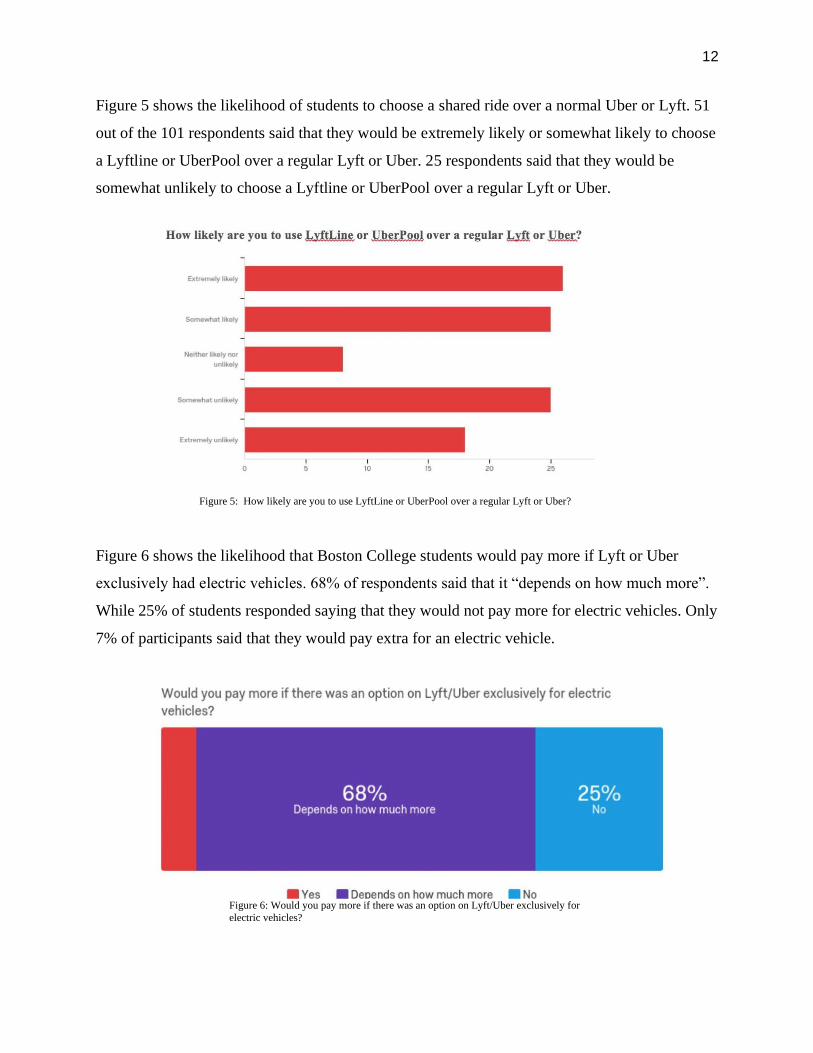
Figure 5 shows the likelihood of students to choose a shared ride over a normal Uber or Lyft. 51
out of the 101 respondents said that they would be extremely likely or somewhat likely to choose
a Lyftline or UberPool over a regular Lyft or Uber. 25 respondents said that they would be
somewhat unlikely to choose a Lyftline or UberPool over a regular Lyft or Uber.
Figure 6 shows the likelihood that Boston College students would pay more if Lyft or Uber
exclusively had electric vehicles. 68% of respondents said that it “depends on how much more”.
While 25% of students responded saying that they would not pay more for electric vehicles. Only
7% of participants said that they would pay extra for an electric vehicle.
Figure 5: How likely are you to use LyftLine or UberPool over a regular Lyft or Uber?
Figure 6: Would you pay more if there was an option on Lyft/Uber exclusively for
electric vehicles?
13
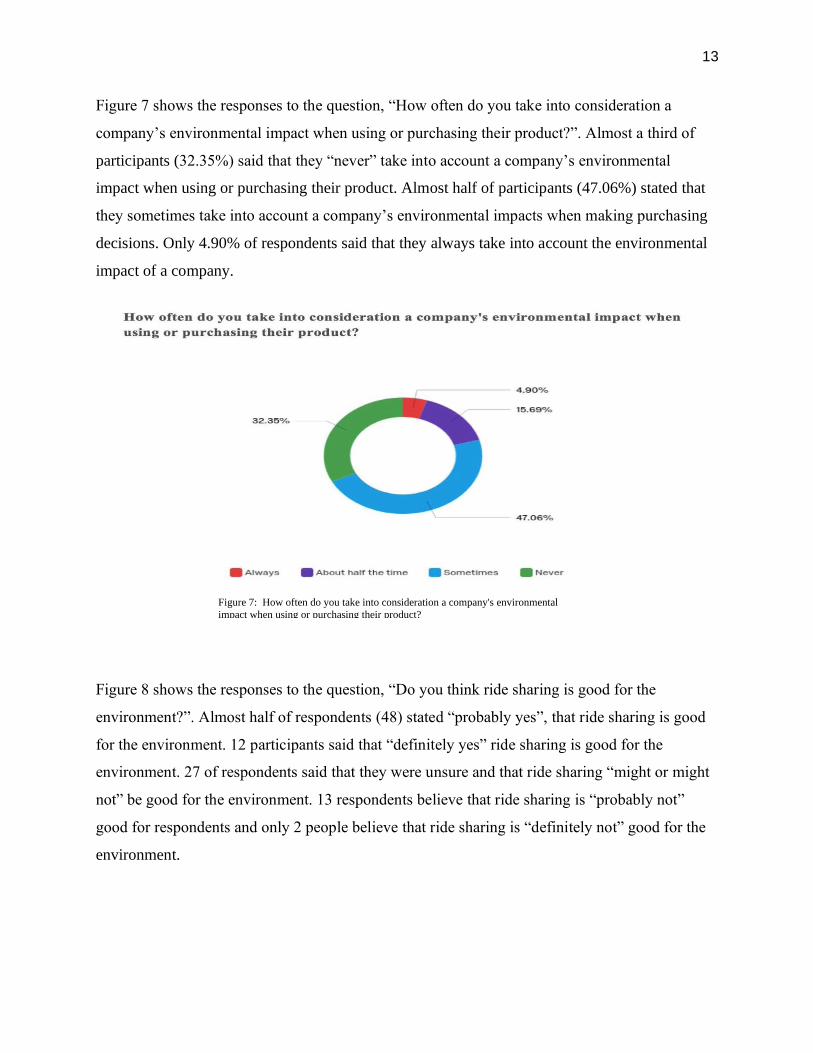
Figure 7 shows the responses to the question, “How often do you take into consideration a
company’s environmental impact when using or purchasing their product?”. Almost a third of
participants (32.35%) said that they “never” take into account a company’s environmental
impact when using or purchasing their product. Almost half of participants (47.06%) stated that
they sometimes take into account a company’s environmental impacts when making purchasing
decisions. Only 4.90% of respondents said that they always take into account the environmental
impact of a company.
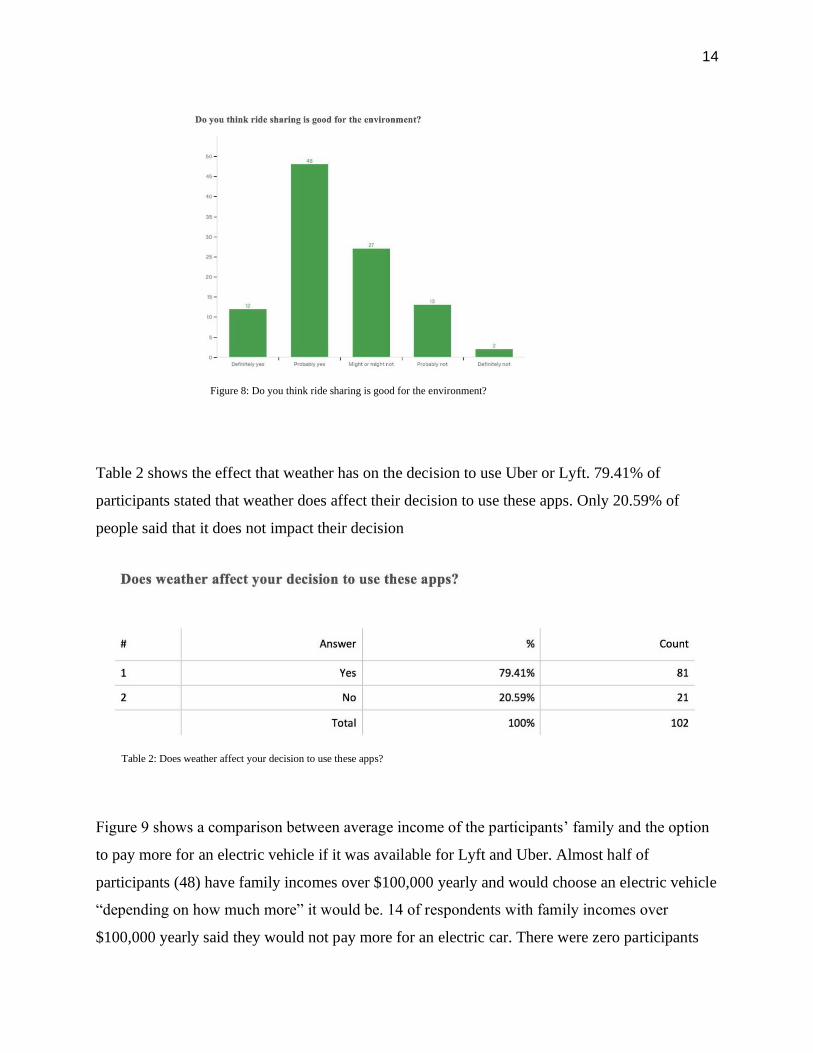
Figure 8 shows the responses to the question, “Do you think ride sharing is good for the
environment?”. Almost half of respondents (48) stated “probably yes”, that ride sharing is good
for the environment. 12 participants said that “definitely yes” ride sharing is good for the
environment. 27 of respondents said that they were unsure and that ride sharing “might or might
not” be good for the environment. 13 respondents believe that ride sharing is “probably not”
good for respondents and only 2 people believe that ride sharing is “definitely not” good for the
environment.
Figure 7: How often do you take into consideration a company's environmental
impact when using or purchasing their product?
14
Table 2 shows the effect that weather has on the decision to use Uber or Lyft. 79.41% of
participants stated that weather does affect their decision to use these apps. Only 20.59% of
people said that it does not impact their decision
Figure 9 shows a comparison between average income of the participants’ family and the option
to pay more for an electric vehicle if it was available for Lyft and Uber. Almost half of
participants (48) have family incomes over $100,000 yearly and would choose an electric vehicle
“depending on how much more” it would be. 14 of respondents with family incomes over
$100,000 yearly said they would not pay more for an electric car. There were zero participants
Figure 8: Do you think ride sharing is good for the environment?
Table 2: Does weather affect your decision to use these apps?
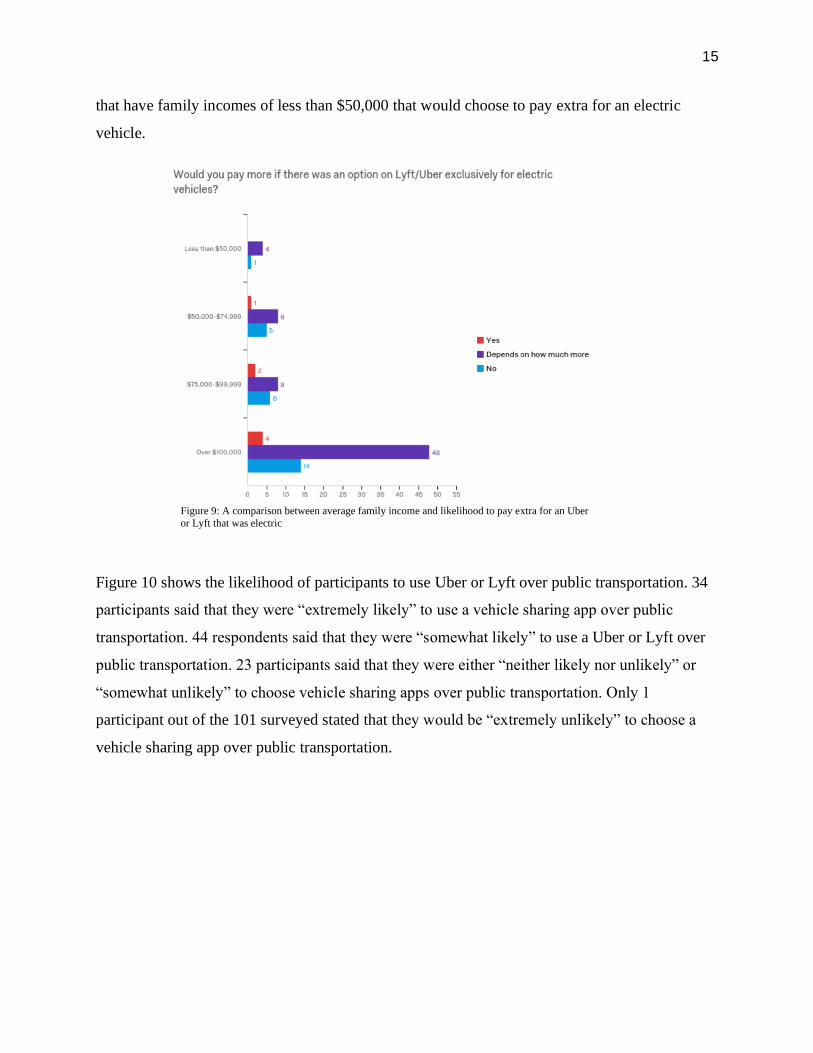
15
that have family incomes of less than $50,000 that would choose to pay extra for an electric
vehicle.
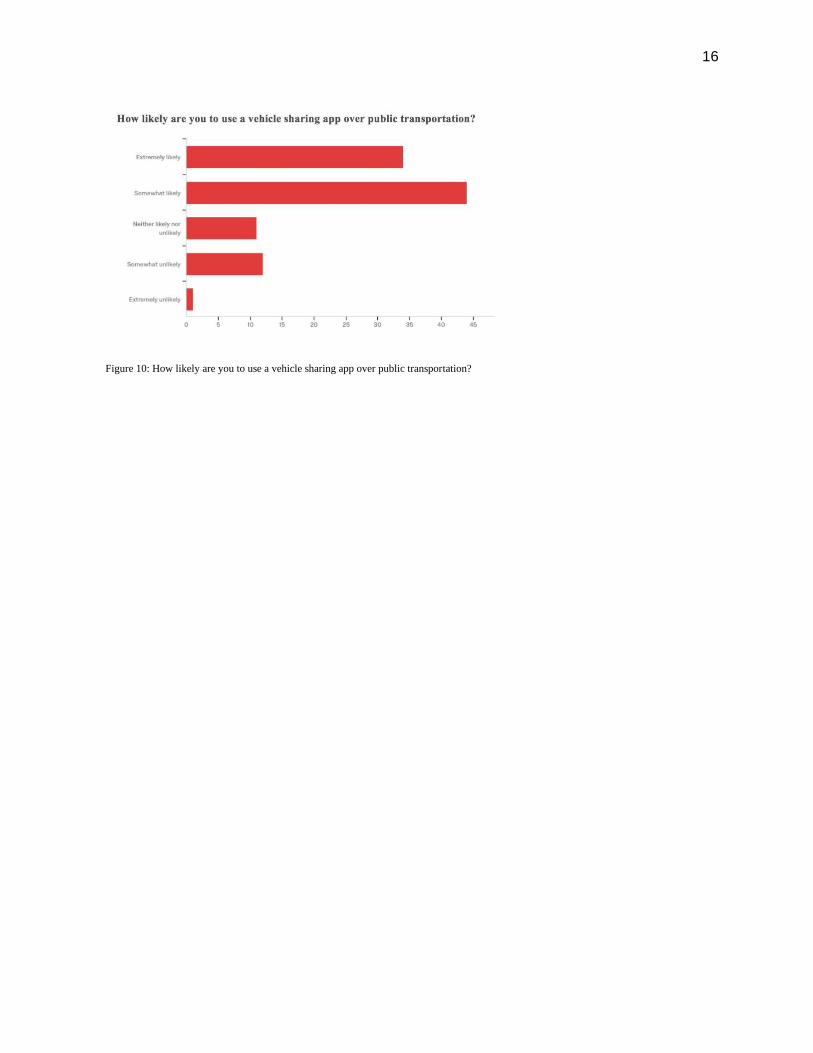
Figure 10 shows the likelihood of participants to use Uber or Lyft over public transportation. 34
participants said that they were “extremely likely” to use a vehicle sharing app over public
transportation. 44 respondents said that they were “somewhat likely” to use a Uber or Lyft over
public transportation. 23 participants said that they were either “neither likely nor unlikely” or
“somewhat unlikely” to choose vehicle sharing apps over public transportation. Only 1
participant out of the 101 surveyed stated that they would be “extremely unlikely” to choose a
vehicle sharing app over public transportation.
Figure 9: A comparison between average family income and likelihood to pay extra for an Uber
or Lyft that was electric
16
Figure 10: How likely are you to use a vehicle sharing app over public transportation?
17
V. Discussion
Factors That Lead to More Ride Sharing
Based off of our research we found that there has been a dramatic rise in using app
services such as Lyft and Uber over other transportation methods that are friendlier for the
environment. One reason for this is due to convenience. As is depicted in Figure 10, 78
participants are either extremely likely or somewhat likely to choose a ride sharing app over
using public transportation. When asked why they would choose ridesharing over public
transportation, survey participants most commonly responded with “convenience” and
“efficiency”. A Lyft or Uber can pick up their customer right outside their home or dorm so BC
students are evidently attracted to to the speed and increased accessibility of this form of
transportation. While the MBTA green line is located only a few steps from campus, it has
received a reputation for being extremely inefficient and unreliable. Time is immensely valuable
to college students so when there is a faster option, it is likely to be the most popular option. It
was also revealed in our research that 38.24% of students had taken an Uber or Lyft to get from
one part of campus to another (Figure 2). This is over a third of our survey participants which is
telling of the way that students decide to use their time. BC’s campus is not large relative to the
size of the student body. It is easily walkable but even still there are bus and shuttle options
offered at no cost through the university. Although there are these two sustainable ways to get
around the campus, a significant portion of students are still opting to allocate money towards the
quickest, most convenient option. Lastly, Table 2 reveals that 79.41% of survey participants
claim that weather affects their decision to use these apps. Almost every single one of these
respondents listed “rain” as a reason to use one of these ride sharing apps. This contributes to the
idea that students value convenience so they do not want to wait for a bus or walk when it is
raining. Our research shows that convenience and ease seems to trump environmental awareness
and protection.
Impacts on Human Health and the Environment
This desire for convenience is not only potentially harmful to human health but also to
the environment. The majority of students that responded to our survey are using these
ridesharing apps to go short distances that they could easily walk or bike. Almost 70% of
18
surveyed students said their average shared ride was 10-20 minutes and 18.63% of respondents
stated that their average Uber or Lyft ride is 5-10 minutes (Figure 3). The majority of students
likely take Uber or Lyft 10-20 minute distances because it would take a decent amount of time to
walk those distances albeit possible. Using ridesharing to travel 5-10 minutes is definitely a
distance students could have walked had these ridesharing apps not offered the speed and
convenience that they do. The idea that students are using these apps in excess to save time
means they may not be prioritizing their health and physical exercise. Physical exercise is critical
to human health but it appears the convenience of ride sharing has decreased the amount of
physical activity some students are receiving. The increased use of ride sharing apps is harmful
to student health in this regard but is also an environmental hazard as Murtaza Heider points out
in his paper. Just because students are calling an Uber or Lyft to get from one part of campus to
another does not mean the BC busses and shuttles or the T stops running due to lack of demand.
These public forms of transportation will continue to run on schedule whether they are
completely full or only carrying one passenger. As Haider said, the increased use of these
ridesharing apps will just contribute to an increased level of emissions (Haider, pg. 14). Another
revealing statistic that supports this idea of increased emissions is that over 41% of surveyed
students that have a car on campus said they used these ride sharing apps 1-2 times in the last
week and a little under 30% said they used these apps 3-5 times in the last week (Table 1). This
means that students are not getting rid of their cars simply because these apps exist but instead
are using them to complement their own vehicle use. At first glance, it appears that the ride
sharing model would be extremely beneficial in reducing emissions and therefore environmental
degradation, however, a more in depth analysis reveals that this might not be the case.
Another harmful yet understated component of this model is vehicle idling. Due to the
fact that an Uber or Lyft driver must find their passenger at a specific pick up location on
campus, there is a lot of idling. About 29.41% of Boston College students said it takes them 3 to
5 minutes to reach their Uber or Lyft (Figure 4). This may be due to the fact that students
typically wait inside until their driver arrives because of Boston’s inclement weather.
Additionally, there is often confusion as to where Uber or Lyft drivers can pick students up on
campus leading to more waiting around. A wait time of 3-5 minutes may seem insignificant but
the aggregate of almost a third of the surveyed population amounts to a range of 90-150 minutes
of idling everytime this population calls a Lyft or Uber. This idling presents some serious health
19
risks such as aggravating asthma and allergies as well as heightening chances of getting
respiratory and cardiovascular diseases (NC DEQ). Ride sharing increases the number of
individual vehicles idling on campus by a significant amount posing serious health risks to
students on campus. Idling also causes the release of more emissions into the atmosphere. When
examining the ride sharing model, idling is a component often left out when it should be taken
more seriously
Environmental Awareness on Campus
Another significant finding in our research was the environmental awareness of students
on BC’s campus. One of our original research goals was to understand why students are making
certain decisions in terms of transportation in their everyday lives. The survey revealed some
interesting habits and choices made by students. For example, when asked if they take into
consideration a company’s environmental impact when using or purchasing their product,
32.35% of respondents said “never” (Figure 7). Almost half responded “sometimes” and only
4.9% said “always” (Figure 7). This is a really interesting result considering the education and
ethics of Boston College students. The majority of students on campus have been exposed to
environmental issues to some extent. Additionally, there is a strong emphasis on decision making
and ethics embedded into the curriculum at BC. When you take these factors into account, this
sample size is most likely skewed towards caring more about environmental issues. This means
if you were to take a larger sample size outside of BC’s campus, it is possible that the “never”
percentage would be even higher.
Another interesting idea is that this generation of young adults is characterized by caring
more about the ethics of companies and pushing for more corporate social responsibility.
Because of this, some of these results may come as a surprise. The following question asked in
the survey was “Would you pay more if there was an option on Uber/Lyft exclusively for electric
vehicles?”. The majority of students (68%) responded with “depends on how much more” while
a quarter of respondents said “no” (Figure 6). Only 7% of students responded with a definite
“yes” (Figure 6). When socioeconomic status is taken into account, the results show some
interesting statistics. In the family income bracket of over $100,000, slightly over 21% of survey
participants said they would definitely not pay for an electric vehicle option (Figure 9). On the
other end in the family income bracket of less than $50,000, just 20% of survey respondents said
20
they would definitely not pay for that option (Figure 9). In the family income bracket from
$50,000-$99,999, almost 37% of respondents said they would definitely not pay for this option
(Figure 9). The results from the highest income bracket are the most significant given that we
had 66 respondents in this bracket compared to only 5 respondents in the lowest bracket. These
results show that students may be aware of certain environmental issues but may not have the
means to act on them.
The survey results also show, however, that students are making certain decisions without
necessarily knowing how they impact the environment. The fact that 48 of our participants
believe ride sharing is “probably” good for the environment and 12 participants think it
“definitely” is represents the idea that there is imperfect information when consuming goods or
services in the economy (Figure 8). These responses prove that the survey respondents are not
aware of the potential harms of the ride sharing model. If there was more information easily
accessible to students, they could make more informed decisions and know how these decisions
affect their health and the environment. For example, more students may take a LyftLine or an
UberPool over a regular Lyft or Uber if they knew the environmental benefits. As mentioned in
the introduction, Georgina Santos highlights the emissions reductions that would be achieved if
all bus and car trips were replaced by the carpool model of LyftLine and UberPool. Our survey
found that students’ responses were pretty evenly distributed when asked how likely they were to
choose one of these services instead of a regular Lyft or Uber (Figure 5). Only 18 respondents
said they were extremely unlikely to select LyftLine or UberPool. It would be interesting to see
how these decisions might be changed by the exposure to research like Santos’.
Limitations and Concluding Thoughts
This research process did pose some limitations, however, these limitations opened doors
for different kinds of research. One of the main limitations was surveying the BC student
population and not a larger population. For the purposes of our research it was necessary to
conduct a survey involving BC students but this sample size is likely to have some bias attached
to it. For example, almost 65% of our participants reported having an approximate family income
of over $100,000. This means they have more access to different forms of transportation solely
due to socioeconomic status. Additionally, every survey respondent is actively pursuing higher
education which also contributes to biased results. The second biggest limitation was limited
21
access to quantitative data. We reached out to both Lyft and Uber in an attempt to obtain data on
the number of pickups and drop offs on or around campus. They unfortunately could not provide
this data limiting the amount of quantitative data we could work with. That being said, this
limitation shifted our focus to more sociological factors. We decided to create a survey with
several questions aimed at understanding how and why students make certain decisions in terms
of transportation habits and the environment. The results we received revealed less about the
amount of emissions and more about the behaviors of students on campus. There are limitations
with every research project so we learned to acknowledge them and then work with them.
Some of the results we received were predicted while some surprised us. We learned how
much our surveyed population values time and convenience and is willing to spend the extra
money to have these two things. The results also proved our predictions that the ride share
market is growing and students are taking advantage of apps like Uber and Lyft. The
convenience and reliability of this form of transportation has made Uber and Lyft extremely
successful and attractive to many. A review of the literature in conjunction with our results
proved that the ride sharing model may be harmful for the environment as well as human health.
The results also showed that many people believe that ride sharing is good for the environment
meaning this knowledge is not easily accessible to them. We were able to better understand the
decision making process of our survey participants through the responses we received. We were
surprised by responses that revealed many students do not prioritize the environment when
making decisions. However, with this information we have learned how BC students can be
more informed consumers and make better decisions not only for themselves but for the
environment as well.
VI. Recommendations
Designated “Green” Pick Up Location
After learning about the harms of vehicle idling and how much of it results from the use
of ride sharing apps, we believe a designated pick up location would benefit the student body of
Boston College. To limit the number of idling vehicles in various locations nearby dorms, BC
could create a designated pick up spot for ridesharing vehicles that is not directly next to a dorm
and is surrounded by trees. The trees would be there to absorb excess CO2 and hopefully offset
22
some emissions. Placing the location away from dorms could limit potential adverse health
effects experienced by students as a result of idling vehicles. Additionally, there could be places
for students to sit so they might be more inclined to wait for their car outside instead of waiting
inside and having their Uber or Lyft driver idle while looking for them. Uber is currently
experimenting with “suggested pick up” locations on the app to make the rider experience more
seamless (Constine). Because this feature already exists, it would be relatively simple to
implement this “green” pick up location on campus.
Increased Frequency and Awareness of Shuttle Services
Many surveyed students listed their primary reason for using ridesharing apps as
groceries and errands. BC currently has shuttle services to Star Market and the shops at Chestnut
Hill but they only run one and two days a week respectively. Additionally, they only run every
hour so if a student only needed a few groceries this student would have to wait a long period of
time before the shuttle came back to pick them up. If BC were to increase the frequency of these
shuttles, more students may take advantage of these services decreasing the number of individual
vehicles on campus. As mentioned above, these shuttles run on schedule even if a small number
of students are using them. If students are choosing ride sharing vehicles over the BC shuttles, it
is only going to increase the amount of emissions. Another recommendation in regards to the
shuttle service is more advertising. Most students are unaware that BC offers these services free
of cost. If the shuttles increased their frequency and advertised more often, more students may
choose to take advantage of the already operating shuttles rather than taking a separate vehicle.
Required Canvas Module
Considering almost a third of surveyed students said they never consider a company’s
environmental impact when using or purchasing a service or product, we believe a basic
educational module on canvas to increase environmental awareness of BC students would be
beneficial. This module could also include the environmental impacts of big companies. This
would make students more informed consumers and allow them to make more informed
decisions in regards to the environment and their purchasing habits.
Follow-Up Survey
23
After analyzing the results of our survey we believe implementing the canvas module and
creating a follow-up survey could be beneficial. Our research revealed that a significant portion
of students do not take environmental factors into consideration when consuming in today’s
economy. The survey also revealed that students have asymmetric information. It would be
beneficial to offer an informative module to our survey participants and then have them take a
follow-up survey to see how their decision making might change. This would not only be
informative to the researchers but it could also create real change by providing students with
more information to make better decisions when purchasing products or services.
24
VII. References
Clewlow, Regina R., and Gouri Shankar Mishra. "Disruptive transportation: The adoption, utilization, and
impacts of ride-hailing in the United States." University of California, Davis, Institute
Transportation Studies, Davis, CA, Research Report UCD-ITS-RR-17-07 (2017).
Constine, Josh. “Uber Is Now Testing ‘Suggested Pickup Points’ – TechCrunch.” TechCrunch,
TechCrunch, 8 July 2015, techcrunch.com/2015/07/08/uber-suggested-pickup-points/.
Gehrke, Steven, A. Felix, and T. Reardon. "Fare choices: A survey of ride-hailing passengers in metro
Boston." Metropolitan Area Planning Council (2018).
Gehrke, Steven, and Timothy Reardon. “Further Evidence of the ride-hailing effect in Metro Boston and
Massachusetts.” Metropolitan Area Planning Council (2018).
Haider, Murtaza. "To Uber or Not to Uber: That is the Question." Repéré à http://stream1. newswire.
ca/media/2015/09/29/20150929_C6395_PDF_EN_508957. pdf (2015).
Joireman, J. A., Van Lange, P. A. M., & Van Vugt, M. (2004). Who Cares about the Environmental
Impact of Cars?: Those with an Eye toward the Future. Environment and Behavior, 36(2), 187–
206.
Marshall, Aarian. “Uber and Lyft Haven't Revolutionized the American City-Yet.” Wired, Conde Nast,
14
Oct. 2017, www.wired.com/story/uber-and-lyft-havent-revolutionized-cities/.
Rodier, Caroline Jane. "The Effects of Ride Hailing Services on Travel and Associated Greenhouse Gas
Emissions." (2018).
Santos, Georgina. “Sustainability and Shared Mobility Models.” Sustainability, vol. 10, no. 9,
2018, pp. 1–13., doi:10.3390/su10093194.
Schor, Juliet. “Debating the Sharing Economy.” Great Transition Initiative, Oct. 2014, pp. 1–13.
“Why Is Idling Harmful?” North Carolina Department of Environmental Quality,
deq.nc.gov/about/divisions/air-quality/motor-vehicles-air- quality/idle-reduction/why-
idling-harmful.