Embed Size (px)
Citation preview
ROMANIAN REVIEW OF GEOGRAPHICAL EDUCATION, Volume IV, Number 2, August 2015
ISSN 2285 – 939X ISSN – L 2285 – 939X
pp. 57-76
ASSESSING STUDENTS’ COMPETENCE IN DEVELOPING CHOROPLETH MAPS COMBINED WITH DIAGRAM MAPS
GABRIELA OSACI-COSTACHE University of Bucharest, Faculty of Geography, Bucharest, Romania,
E-mail: [email protected]; [email protected]
OCTAVIAN COCOŞ University of Bucharest, Faculty of Geography, Bucharest, Romania,
E-mail: [email protected]
ALINA COCOŞ “Mihai Viteazul” National College, Bucharest, Romania,
E-mail: [email protected]
(Received: July 2015; in revised form: August 2015)
ABSTRACT Choropleth maps combined with diagram maps are frequently used in geography. For this reason, based on the maps developed by students, the study aims at the following: identifying and analyzing the errors made by the students; establishing and analyzing the competence level of the students; identifying the causes that led to these errors; and finding the best solutions to improve both the educational process aiming at the formation of this kind of competences and the students’ results. The map assessment was accomplished during two academic years (2013-2014 and 2014-2015), in the aftermath of the activities meant to train the competence. We assessed 105 maps prepared by the students in Cartography (Faculty of Geography, University of Bucharest) based on an analytical evaluation grid, with dichotomous scale, comprising 15 criteria. This tool helped us identify the errors made by the students, as well as their competence level. By applying a questionnaire, we identified the source of the errors from the students’ perspective, while by comparing the errors and the competence levels at the end of the two academic years we were able to come up with potential solutions for the improvement of the teaching and learning process.
Keywords: choropleth map combined with structural diagrams, evaluation grid, evaluation criterion, competence level, bachelor level, digital cartography, Philcarto
DOI: http://doi.org/10.23741/RRGE220154

GABRIELA OSACI-COSTACHE, OCTAVIAN COCOŞ, ALINA COCOŞ
INTRODUCTION
The choropleth maps (or mosaic maps; Lavagna & Lucarno, 2007, p. 50) and the choropleth maps combined with diagram maps (superposed diagrams or charts) are frequently used in the thematic cartographic representations. This is the reason why the training of the competence to develop them in a digital environment begins in the first year of academic studies.
This paper aims at communicating the teaching experience of the authors concerning the assessment of students’ competence in developing digital choropleth maps combined with diagram maps.
During the practical activities attached to the discipline “Methods and techniques of cartographic representation”, which is taught in the first year of study to the students in Cartography (Faculty of Geography, University of Bucharest), we organized an activity meant to train the competence of developing choropleth maps combined with diagram maps. At the end of the activity, we evaluated the 105 cartographic products developed by the students along the two successive academic years, namely 2013-2014 and 2014-2015 (58 in 2013-2014 and 47 in 2014-2015).
The maps mirror the students’ competence level. Their assessment and analysis was accomplished with the purpose of (1) identifying and analyzing the errors made by the students in such cartographic representations; (2) establishing and analyzing the students’ competence level in developing choropleth maps combined with diagram maps; (3) identifying the causes that were responsible for the occurrence of errors; (4) identifying the solutions meant to improve both the teaching activities aiming at the training of this competence and the students’ results.
Competence evaluation was done based on an analytical assessment grid, with dichotomous scale, comprising criteria with associated descriptors (according to Dulamă, 2010, p. 86, pp. 105; 2011, pp. 106-107, pp. 120-122; Osaci-Costache et al., 2013a, 2013b, 2013c). The scores obtained by the students during the first year of study (2013-2014) allowed us to identify a number of causes that were responsible for the errors. At the same time, we found solutions for the improvement of the teaching and learning activities, which were applied during the following academic year (2014-2015), with the purpose of increasing the number of students with a superior level of competence (however, the activities meant to contribute to competence training will be addressed in a subsequent study). During both academic years, we turned both to the theoretical models presented in the specialized literature (Dulamă, 2013, p. 69) and to the examples of their implementation (Osaci-Costache et al., 2013a, 2013b, 2013c). Likewise, students were divided according to their competence levels (inferior, average and superior) according to the obtained scores.
58

ASSESSING STUDENTS’ COMPETENCE IN DEVELOPING CHOROPLETH MAPS COMBINED WITH DIAGRAM MAPS
MATERIALS AND METHOD
The subjects and the research content. All students participating in this study were taught by the same professor, but the analyzed population (the subject variable) showed differences regarding the initial formation (knowledge and competences acquired in high school) both in each academic year and after the two-year study period.
The activity aimed at training the competence was carried out three weeks after the academic year had begun, when all the students already knew how to digitize the maps using the Phildigit tool and how to make choropleth maps and diagram maps using the Philcarto software (http://philcarto.free.fr/). Students’ products were evaluated a week after the competence had been trained.
Although we analyzed all the final products (choropleth maps combined with diagram maps) accomplished by the 105 students who had attended the practical activities included in the curriculum (1 hour per week during the first semester of the first year of study, bachelor level), it is likely that the results cannot be generalized because of the small number of subjects, as it also happened with other similar studies (Cardoso Ferreira, 2012, Osaci-Costache et al. 2013a, 2013b, 2013c).
After assessing the maps, we also applied an anonymous questionnaire in order to learn the students’ opinions regarding the possible causes that led to their errors. The students gave their consent for the processing of their answers.
Procedure. During the two academic years, the students were involved in an activity aiming at training the competence to accomplish a choropleth map combined with a diagram map, which acted as an independent variable. This activity had several stages (Osaci-Costache et al., 2013b, pp. 202-204): (1) presentation of theoretical aspects; (2) the explanation of how to develop the respective cartographic representation; (3) the demonstration of the procedure by the teacher; (4) the practicing of the procedure by the students; (5) the completion and the presentation of the task; (6) the verification of competence training (the choropleth map combined with diagram map – the dependent variable). The last of these stages was the topic of this research.
The task consisted in creating a choropleth map combined with a structural diagram map referring to the density of population in Romania at county level, differentiated on rural and urban areas. Students were asked to use pie diagrams in order to show the proportion of rural and urban residents. The software used was Phildigit, Philcarto and Inkscape (http://inkscape.org/en/). At this stage, the students were provided with a verification list in order to be able to make the necessary corrections of the final outcome by themselves. The list, which also included the verification indicators and criteria, proved very useful for the training of other competences as well (Osaci-Costache et al., 2013a, p. 102).
59

GABRIELA OSACI-COSTACHE, OCTAVIAN COCOŞ, ALINA COCOŞ
4
The training of competence was verified by analyzing the students’ polychrome cartographic products printed on paper (not larger than A4 size). The accomplishment of this cartographic representation was a must for the yearly examination. At the same time, for developing the map, the students received maximum 2 points, which were included in the final mark obtained at the discipline “Methods and techniques of cartographic representation”.
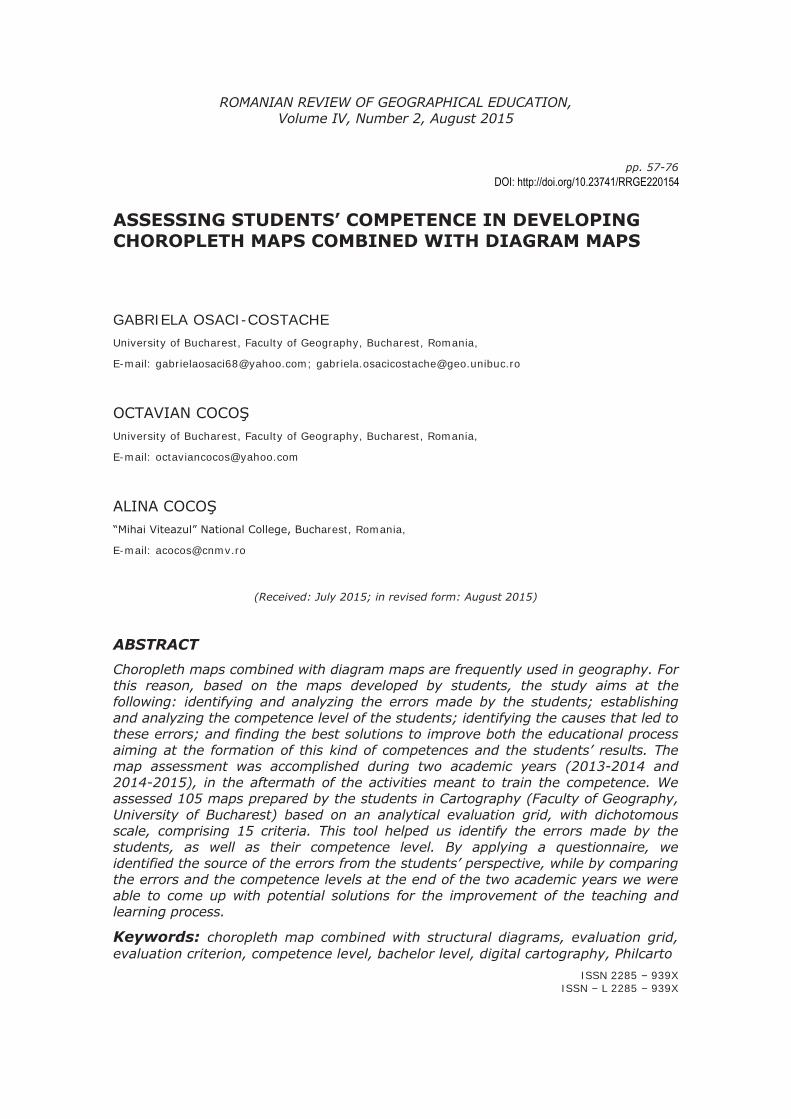
The advantage of using the analytical evaluation grids with dichotomous scale has been already verified (Osaci-Costache et al., 2013a, 2013b, 2013c). In order to assess the proposed task we designed a similar grid with 15 criteria (Table 1). As in the case of other previously used grids (Osaci-Costache et al., 2013a, 2013b, 2013c), each criterion was associated with several descriptors or indicators, which highlighted the essential features of such a cartographic representation.
Table 1. Analytical evaluation grid with dichotomous scale for choropleth maps combined with diagram maps
Criteria Abbreviation Descriptors/Indicators/Observable elements Score
Map title MT
The title shows the topic and the location.
The title should not include the representation type (Năstase & Osaci-Costache, 2001, p. 202, Osaci-Costache, 2008, p. 119; 2009, p. 120; Donnay, 2013): e.g. “The choropleth map of the density…”.
0.1
Source of statistical data
S The source of statistical data is compulsory. 0.1
Date when statistical information was recorded
D
If the date when the statistical information was recorded is not mentioned, the map is futile.
The data used for the choropleth map and those employed for the diagram map must refer to the same period of time.
0.3
Aesthetics A
The representation fits to the page and is aesthetic.
The blank spaces around the map elements are well balanced (Donnay, 2013; Salerno, 2014, pp. 21-23)
The colour boxes in the map legend are aligned both vertically and horizontally.
The figures in the map legend are aligned both vertically and horizontally.
The title is positioned according to cartographic rules.
The text of the legend is aligned.
0.3
60
ASSESSING STUDENTS’ COMPETENCE IN DEVELOPING CHOROPLETH MAPS COMBINED WITH DIAGRAM MAPS
Colour progression C
The colour progression uses soft, pastel colours, according to the type and size of the represented statistical data.
The colours of the diagram map are soft and pastel, in accordance with the element they describe.
The colours of the choropleth map and those of the diagram map are in harmony.
0.2
Map resolution MR The representation has a high resolution (at
least 300 dpi). 0.2
Place names and labelling
NW
All labels are spelled correctly.
The labels contain the diacritical marks specific for the Romanian language.
It is necessary to use sans serif characters (Arial/Helvetica/Verdana, etc.) (Donnay, 2013; Salerno, 2014, pp. 36-37), and not Times New Roman (serif).
All the elements must be written in the same way.
Capital letters should be used only for the title, even though this can also be written with lowercase letters (Donnay, 2013; Salerno, 2014, p. 107).
The size of the characters is proportional to the size of the representation and it indicates a clear visual hierarchy (Salerno, 2014, p. 115), being adapted to the type of element and to its importance for the map.
The colour of the character used is adapted to the element it refers to.
0.1
Philcarto licence PL
It is compulsory to mention “Made with Philcarto http://philcarto.free.fr” (by using the software the users agree to put this inscription on every map they make with Philcarto).
0.1
Outline of the administrative units
O
The outlines are precise and unobtrusive, separating properly the map and the represented information (Le Fur, 2007, p. 97).
The outlines belong only to the choropleth map, without being doubled by the lines of the diagram map.
0.1
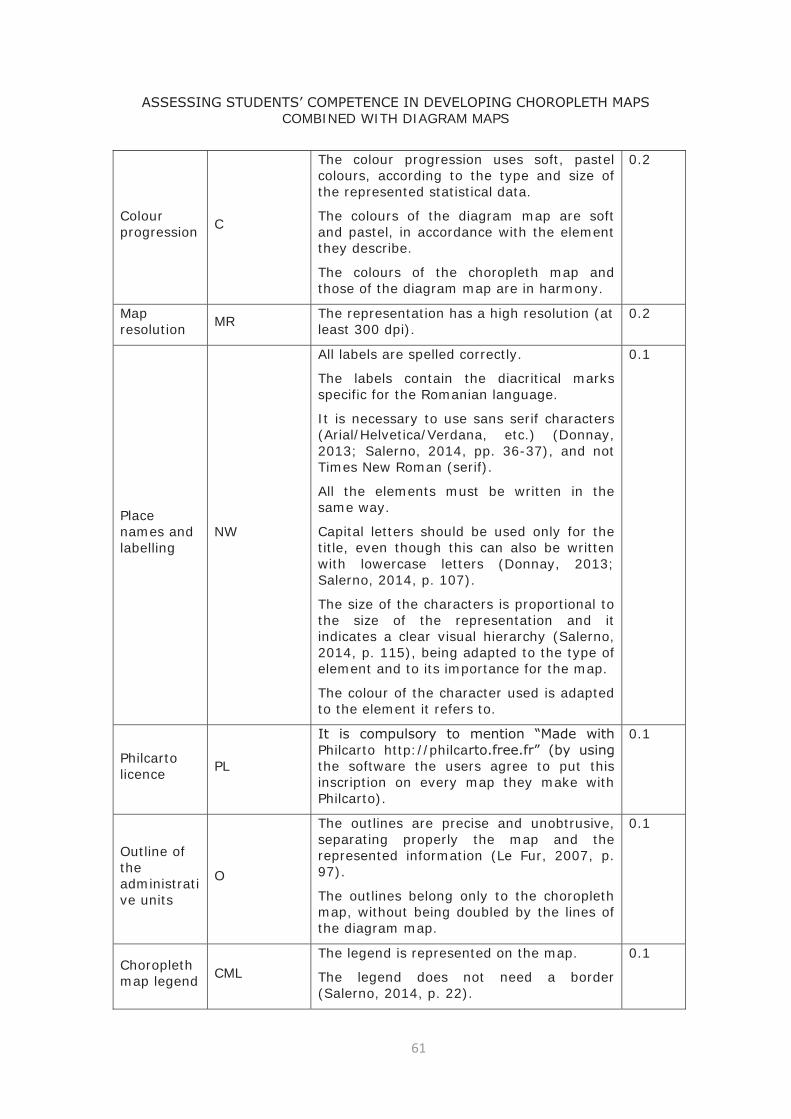
Choropleth map legend CML
The legend is represented on the map.
The legend does not need a border (Salerno, 2014, p. 22).
0.1
61
GABRIELA OSACI-COSTACHE, OCTAVIAN COCOŞ, ALINA COCOŞ
6
The legend is not scattered (Le Fur, 2007, p. 88).
There is no need to write “Legend” (Donnay, 2013), but to show the topic.
The legend is structured either ascending or descending.
The number of classes is optimum and renders well the geographical phenomenon.
The colours in the legend are identical with the ones used on the choropleth map and they allow the correct quantitative ranking of the statistical values.
The explanations are clear and correct.
Unit of measurement/
choropleth map
UMC
The units of measurement are mentioned. 0.1
Diagram map legend DML
The legend is represented on the map.
The legend does not need a border (Salerno, 2014, p. 22).
The legend is not scattered (Le Fur, 2007, p. 88).
There is no need to write “Legend” (Donnay, 2013), but to show the topic.
The legend is structured either ascending or descending.
The legend contains the symbols “greater than” and “less than” and in-between a few well-chosen values.
The symbols in the legend have exactly the same size as those used on the map.
The scale of symbols/diagrams is shown clearly.
The explanations are clear and correct.
0.1
Unit of measurement/diagram map
UMD
The unit of measurement for the diagram map is maintained.
0.1
Symbols used on diagram maps
SDM
Diagrams must be located at the centre of the administrative units.
Symbols must not be distorted (e.g. the circle should not become oval)
The diagram size complies with the
0.1
62

ASSESSING STUDENTS’ COMPETENCE IN DEVELOPING CHOROPLETH MAPS COMBINED WITH DIAGRAM MAPS
optimum graphical density (Le Fur, 2007, p. 95).
Scale bar on choropleth maps
Although the representative fraction is not compulsory for choropleth maps, the students were asked to add a scale bar to their representations. However, if the scale was missing the students were not downgraded.
-
Total 2 points
Deeming that the previous experience in evaluating the students’ cartographic representations and in centralizing the errors they make was useful (Osaci-Costache et al., 2013a, p. 103; 2013b, p. 205), we designed a table for each of the two investigated academic years (Table 2). In these tables, we marked with an “X” the criteria that had not been fulfilled. Failing to fulfil a criterion led to the loss of the entire score for the respective criterion. In the event that they met all the indicators for a criterion, students received the entire score, but if they failed to meet any of the indicators, they received no points at all. Consequently, we excluded partial scores.
Table 2. A section of the table including the centralized results of the evaluation
Scores for each criterion
MT S D A C MR NW PL O CML UMC DML UMD SDM Total
0.1 0.1 0.3 0.3 0.2 0.2 0.1 0.1 0.1 0.1 0.1 0.1 0.1 0.1 2.0
Student 1
X X X X 1.5
Student 2
X X X X X 1.2
Student 3
X 1.9
RESULTS AND DISCUSSION
1. Errors committed by the students in preparing choropleth maps combined with diagram maps
As shown previously, students’ maps were assessed based on uniform criteria, meant to make the evaluation process homogeneous and objective. The criteria (as well as the descriptors/indicators) were the same for the two years of study; therefore, the results can be compared. Because the number of students differed from year to year, we compared only the percentages and not the absolute values.
63

GABRIELA OSACI-COSTACHE, OCTAVIAN COCOŞ, ALINA COCOŞ
8
The analytical evaluation grid with dichotomous scale (Table 1) was very useful both for assessing the students’ cartographic products and for analyzing the types of errors and their occurrence frequency. Based on the frequency of the errors identified during the academic year 2013-2014, we improved the teaching and learning activities for the following year of study.
By analyzing the errors the students had committed during the academic year 2013-2014 (Figure 1) we were able to ascertain that the most frequent ones pertained to the aesthetics of the cartographic representation (14.19%), the lack or the wrong mentioning of the Philcarto licence (11.88%), and the lack of the unit of measurement for choropleth map (10.89%) and diagram map (also 10.89%). In the academic year 2014-2015 (Fig. 1), the most frequent errors were the low resolution of the representation (12.44%), the wrong spelling or the wrong location of place names and labels (10.95%) and the inappropriate colour progression (10.45%).
Fig. 1. Frequency of errors grouped on criteria (2013-2014 and 2014-2015)
Table 3. Examples of errors occurring on the students’ maps showing the population density and its structure in rural and urban areas at county level in Romania
Criteria Abbreviation Examples of errors
Map title MT
“Population choropleth map”
“Romania – population by sex in 2012”
“Choropleth map combined with diagram map for Romania”
“The choropleth map and diagram map for Romania’s population density (2011)”
Source of statistical data S
“Source of the map: National Institute of Statistics”
“Source of data: Philcarto”
The source of statistical data existed, but was
64

ASSESSING STUDENTS’ COMPETENCE IN DEVELOPING CHOROPLETH MAPS COMBINED WITH DIAGRAM MAPS
incomplete.
Date when statistical information was recorded
D
The date was not mentioned.
There were different years for density and for the structure of the population by rural and urban distribution.
Aesthetics A
There were many useless blank spaces on the map.
The figures in the legend were not aligned vertically and horizontally.
The map border was too thick.
Colour progression C
The colour progression of the choropleth map was in dissonance with the colours of the diagram map, which was unpleasant to the eye.
The colours of the classes belonging to the choropleth map did not comply with the principle of using more intense colours for the higher values.
The colours of the choropleth map were rather similar with those used on the diagram map.
The colours of the circular sectors of the pie diagrams were too similar.
Map resolution MR The representation had a low resolution and consequently the image was hazy.
Place names and labelling NW
Students used the Times New Roman typeface (or other serif type fonts).
The diacritical marks specific for the Romanian language were missing.
The font size for the title was too large or too small in comparison with the other elements on the map.
The font size for the legend (or source, etc.) was larger than that of the title.
The text of the legend was very small and difficult or impossible to read.
The legend was written with letters of various sizes.
Everything was written in red, green, etc.
Philcarto licence PL
The mention “Made with Philcarto, http://philcarto.free.fr” was either absent or incomplete (more often than not the web address was missing)
Outline of the administrative units
O Lines were too thick.
County borders were missing.
65

GABRIELA OSACI-COSTACHE, OCTAVIAN COCOŞ, ALINA COCOŞ
10
Choropleth map legend CML
Legend was missing.
The word “Legend” was written on the map.
The explanations in the legend were not aligned correctly, so one had difficulties in understanding to which class they referred to.
Explanations were incorrect.
The colours of the classes did not suggest the increasing or decreasing values.
Unit of measurement/
choropleth map UMC
The unit of measurement was not mentioned (inhabitants per square kilometre) or was wrong (for instance, inhabitants, %, etc.)
Diagram map legend DML
The word “Legend” was written on the map.
Legend was missing.
The significant values, like the minimum and the maximum, were not shown.
Unit of measurement/
diagram map UMD
The unit of measurement for the diagram map was missing.
Symbols used on diagram maps
SDM
Symbols were distorted (oval instead of circle).
Symbols were too large or too small and the map did not have the optimum graphical density.
Symbols were too similar.
The symbols in the legend (circles/semicircles) were larger or smaller in comparison with the ones used on the diagram map.
Figure 2 shows an example of a map containing errors stemming from the fact that the student who prepared it disregarded the following criteria: title (“The choropleth map and diagram map for Romania’s population density”), the source of statistical data, colour progression, resolution, place names and labelling, the borders of the administrative units, the legends of the choropleth map and diagram map, and the unit of measurement for the choropleth map.
66

ASSESSING STUDENTS’ COMPETENCE IN DEVELOPING CHOROPLETH MAPS COMBINED WITH DIAGRAM MAPS
Fig. 2. Example of cartographic representation containing errors
(the 2013-2014 academic year)
From a comparative perspective, some criteria had almost equal shares for both investigated academic years (legend of the choropleth map, symbols of the choropleth map, map title, and the borders of the administrative units), while others had conspicuous variations (Figure 3). Thus, one can see that during the academic year 2014-2015 the share of the errors referring to the eight criteria dropped as follows: aesthetics (from 14.19% to 7.96%), Philcarto licence (from 11.88% to 2.49%), the unit of measurement for the diagram map (from 10.89% to 5.97%), etc. Instead, six criteria recorded an increase of the frequency of errors during the second year of study (Figure 3): colour progression (from 0.33% to 10.45%), the diagram map legend (from 3.96% to 6.47%), etc.
67

GABRIELA OSACI-COSTACHE, OCTAVIAN COCOŞ, ALINA COCOŞ
12
Fig. 3. Comparative situation of the frequency of errors
(in each year’s total), by criteria, for the two academic years
The share of the students who made errors, by each criterion, ranged from 74.14% (for aesthetics) to 1.72% (for colour progression) in the 2013-2014 academic year and from 53.19% (for map resolution) to 10.64% (for Philcarto licence) in the academic year 2014-2015 (Figure 4).
The qualitative leap for the second year of study (2014-2015) was obvious for eight of the 14 criteria, the percentage of students who committed errors dropping with values varying from 51.42% (for Philcarto licence) to 4.07% (for the diagram map symbols and the borders of the administrative units), as shown in Figure 5. As far as the map resolution is concerned, the share of the students who committed errors increased very little (1.47%), while for other four criteria (the use of diacritical marks and sans serif characters, the diagram map legend, the source of statistical data and the date when statistical values were recorded) the increase was between 5.43% and 13.24%. In the academic year 2014-2015, the share of the students who failed to choose correctly the colour progression increased by 42.96%.
68

ASSESSING STUDENTS’ COMPETENCE IN DEVELOPING CHOROPLETH MAPS COMBINED WITH DIAGRAM MAPS
Fig. 4. Comparative situation of the share of students
who committed errors, by criteria, for the two academic years
2. Establishing and analyzing the competence level in developing choropleth maps combined with diagram maps
Like in the case of the evaluation criteria, the score attributed to each criterion remained unchanged for each of the two investigated years, in order that the competence level achieved can be compared. Besides, by using the evaluation grid (Table 1) we ensured an objective evaluation for both investigated periods.
In order to establish the competence level we turned to the percentage thresholds set previously (Osaci-Costache et al., 2013a, pp. 105-106; 2013b, p. 208), which suffered however minor alterations. Then, we applied to them the score of 2 points, as follows: incompetence level (less than 50% of the total score, i.e. 0-1 point); inferior competence level (50.1%-70% of the total score, i.e. 1.1-1.4 points); average competence level (70.01%-94% of the total score, i.e. 1.05-1.8 points); and superior competence level (above 95% of the total score, i.e. 1.9-2 points) (Figure 6).
69

GABRIELA OSACI-COSTACHE, OCTAVIAN COCOŞ, ALINA COCOŞ
14
Fig. 5. Change in the percentage of students who committed errors,
by criteria (the values of 2014-2015 against the ones recorded
in the previous academic year)
Fig. 6. The comparative situation of the competence levels in
the 2013-2014 and 2014-2015 academic years
In the 2013-2014 academic year, 48% of the students got a score lower or equal to 1 point, which meant an incompetence level, 39.66% were at the inferior competence level, 17.24% had an average competence level, while 8.62% reached the superior competence level (Figure 6).
In the next academic year (2014-2015), we recorded an almost equal distribution for the four competence categories (Figure 6), the highest share
70

ASSESSING STUDENTS’ COMPETENCE IN DEVELOPING CHOROPLETH MAPS COMBINED WITH DIAGRAM MAPS
(27.55%) referring to the highest competence level and the lowest one (21.28%) to the lowest.
The comparative situation illustrated in Figure 6 reveals that the results obtained in the second year were better, which certifies that the improvements of the teaching and learning process (which will be presented in a subsequent paper) were efficient, but not enough. The share of the students who lacked the competence dropped by 8.95%, while the percentage of the students having an inferior competence level decreased by 14.12%. Instead, the shares of the students having average and superior competence levels grew by 10.42% and 12.66%, respectively. In the second academic year, these two categories accounted for 48.94% of the students, in comparison with 25.86% in the first year.
3. The causes that were responsible for the occurrence of errors in developing choropleth maps combined with diagram maps
3.1. From the professor’s perspective
The experience of the authors of the present paper and the findings of other already published studies (Osaci-Costache et al. 2013a, 2013b, 2013c), suggest that the causes of the errors may be related either to the pre-university education curriculum (like for instance the lack of arts education during high school), or to the higher education one (insufficient time allocated to practical activities in Cartography), or even to the organization of training activities (too many students in a study group, which is counterproductive for a discipline that requires permanent assistance from the teacher). Besides, there are also causes pertaining to the students, which were identified by the academics with the occasion of previous studies. In this category, we may include the low proficiency in computer science, class absenteeism, and the fact that students attend the practical activities without bringing with them the required materials (Osaci-Costache et al., 2013a, 2013b, 2013c).
Besides the causes listed above, which were identified by observing the students’ behaviour and by analyzing the curriculum, we also identified some other causes, which were inferred from the analysis of the maps prepared by the students. In this category, we may include the following: students do not follow the steps taught by the professor, they fail to observe rules and requirements, and they do not use the evaluation grid (which explains why certain elements are missing from the maps and why cartographic rules are broken); students have a low aesthetic sense (mirrored by the colour progression or the map aesthetics); students have poor geographical knowledge (which is useful, for instance, in establishing the title of cartographic representations); students have poor knowledge of the specialized software and they do not practice enough at home (consequently, they do not know how to save a high resolution map, how to modify the text of the legend, how to align particular elements of the map, how to change colours, etc.).
71

GABRIELA OSACI-COSTACHE, OCTAVIAN COCOŞ, ALINA COCOŞ
16
3.2. From the students’ perspective
We deemed useful and interesting to have a feedback from the students and to learn their opinion about the causes that were responsible for the occurrence of errors. Thus, after the students completed the task and after we discussed with them the identified errors, we designed and applied an original test only to the students who made errors. For both study years, the test included only one question (“Why do you think your map contains errors?”). Because we suggested nine multiple-choice answers and used one open-ended item (Other causes. Enumerate!), the students’ answers do not make a total of 100% (Figure 7). As in the case of the errors and scores, we took into account the percentages and not the absolute values, because the number of students in the two academic years was different.
Fig. 7. Students’ vision about the causes that led
to the occurrence of errors on their maps
In the 2013-2014 academic year, the first three answer options were the following (Figure 7): I did not pay attention to details (37.39% of the students), there were too many of us in a study group and the professor could not allocate enough time to each of us (36.21%), I did not pay attention to professor’s explanations (34.48%).
In the 2014-2015 academic year, most of the students thought that their errors had the following causes (Figure 7): they did not pay attention to details (46.81%), they did not pay attention to professor’s explanations (34.04%) and they did not learn the theory (also 34.04%).
In order to explain the reasons that led to a percentage increase of the students who committed errors in the second year of study, despite the improvement of the teaching and learning process, it is useful to analyze the different opinions of the students at the end of the two investigated
72

ASSESSING STUDENTS’ COMPETENCE IN DEVELOPING CHOROPLETH MAPS COMBINED WITH DIAGRAM MAPS
years (Figure 8). Thus, one can see an increase of the share of the students who identified the following causes: I did not pay attention to details (by 8.88%), I do not like to develop maps (by 6.79%), I did not learn the theory (by 4.73%), and “other causes” (by 2.93%). Of the last category, we mention only a few answers: “I cannot figure out how to associate colours”, “I did not get the statistical data when I was asked to”, “I have difficulties in using the computer”, and “I did not work hard enough, leaving everything for the last moment”.
The disregard for details might be a habit acquired during the previous years of study. From the face-to-face discussions that we had with the students, we understood that they thought the details were unimportant (although their importance was clearly emphasized during the teaching process). Some said they had no patience with them, no time to observe them and even worst, they disregarded the self-evaluation list.
The percentage of those who declared in 2014-2015 that they did not like to develop maps (8.51%) was baffling, because at the beginning of the academic year students had answered a questionnaire saying that they had been fond of this activity. We may assume that during the pre-university studies these students developed only very few maps and consequently they were surprised and got tired by the hard work performed during the practical activities allocated to the discipline “Methods and techniques of cartographic representation”.
Failing to learn the theory is an important cause of the errors, the more so as the academic environment is exempt of the constraints used in high school education (control papers, verification works, etc.).
One can note that the share of students who were annoyed by the fact that study groups were too large dropped in the second year of study by 19.19% (Figure 8), given that the number of students decreased from an average of 24 to 16 people per study group. Likewise, the students who skipped classes were also on the decrease (from 25.85% to 19.15%).
The lack of time at home (invoked by fewer subjects during the second year) can be explained by the fact that students spent many hours on the internet, sometimes even more than 8 hours per day (Dulamă et al., 2015, pp. 57-58). At the same time, some of them already had a job.
Although on a decreasing trend, the lack of attention to the professor’s explanations had high shares in both investigated years. This was observed by other colleagues as well, who teach other disciplines, but the fact became obvious in other circumstances, too (when professors gave indications before an exam or before the students filled in a satisfaction questionnaire concerning the work performed by the professor).
73

GABRIELA OSACI-COSTACHE, OCTAVIAN COCOŞ, ALINA COCOŞ
18
Fig. 8. Percentage variation (for the 2014-2015 academic year
in comparison with the values of 2013-2014) of the causes
that led to the occurrence of errors on the maps
prepared by students (the students’ vision)
4. Solutions for improving the educational process and for increasing the students’ competence level
So far, with the occasion of other studies, we proposed a number of solutions that were within the reach of either professor or student. For instance, from the first category, we mention the following: students are required to take notes; the professor insists on those criteria that generate the highest number of errors; the evaluation grid is analyzed together with the students (Osaci-Costache et al., 2013a, 2013b, 2013c). From the second category, i.e. the solutions that are within the reach of students, we bring to attention the following: students should comply with the task, the rules and the necessary steps; students should learn the theoretical aspects before preparing the map; and students should make use of the self-evaluation list (Osaci-Costache et al., 2013a, 2013b, 2013c).
To the solutions mentioned above, we can add some more: the professor should encourage students to work more efficiently during the practical training activities; the professor should counsel students on how to manage their time properly at home; the professor should test periodically the students’ knowledge and skills, in order to make them learn permanently; the professor should insist on the details that make the difference between a correct and an incorrect map. However, there were other causes as well, the share of which increased in the second year of study, which were only partly under the professor’s control (“I do not like to develop maps” or the fact that students completed the maps in a hurry, shortly before being asked to submit them for evaluation).
74
ASSESSING STUDENTS’ COMPETENCE IN DEVELOPING CHOROPLETH MAPS COMBINED WITH DIAGRAM MAPS
CONCLUSIONS
As in the case of the training and assessment of other competences (Osaci-Costache et al., 2013a, 2013b), the identification of the errors, as well as the correct, uniform and objective evaluation of the students’ products (in the two academic years) was facilitated by the evaluation grid, which was designed by taking into account both the specialty literature and the professors’ competence for such types of cartographic representations. The evaluation grid was also useful to the students, as they were able to use it as a checklist. The evaluation allowed us to divide the students in four levels of competence: incompetence level, inferior competence level, average competence level, and superior competence level.
The professors found it useful to identify the errors in order to improve the teaching and learning process by insisting on the aspects that put students in difficulty. Consequently, at the end of the second year of study, the errors were fewer, while the students’ competence level increased.
By applying the questionnaire meant to reveal the causes that led to the occurrence of errors, we understood the difficulties from the students’ perspective and thus we were able to come up with remedial solutions.
References
Cardoso Ferreira, H. M. (2012). A apreciação estética na História da Cultura e das Artes e a construção de gráficos na Geografia – um estudo com alunos do Ensino Secundário, [Master thesis in History and Geography Teaching]. Braga, Minho University. Retrieved July 5, 2015, from http://repositorium.sdum.uminho.pt/bitstream/1822/24664/ 1/Hugo%20Miguel%20Ferreira%20Cardoso.pdf.
Donnay, J. P. (2013). Guide de rédaction des cartes thématiques. Méthodes et consignes, Liège: Unité de Géomatique de l’Université de Liège.
Dulamă, M. E. (2010). Fundamente despre competenţe. Teorie şi aplicaţii. Cluj-Napoca: Editura Presa Universitară Clujeană.
Dulamă, M. E. (2011). Despre competenţe. Cluj-Napoca: Editura Presa Universitară Clujeană.
Dulamă, M. E. (2013). Didactica didacticii geografiei. Bucureşti: Editura MATRIX ROM.
Dulamă, M. E., Magdaş, I., & Osaci-Costache, G. (2015). Study on geography students’ Internet use. Romanian Review of Geographical Education IV, 1, pp. 45-61.
http://inkscape.org/,Retrieved July 5, 2015.
http://philcarto.free.fr/, Retrieved July 5, 2015.
http://www.gimp.org/, Retrieved July 5, 2015.
75

GABRIELA OSACI-COSTACHE, OCTAVIAN COCOŞ, ALINA COCOŞ
20
Lavagna, E., & Lucarno, G. (2007). Geocartografia. Guida alla lettura delle carte geotopografiche. Bologna: Zanichelli.
Le Fur, A. (2007). Pratiques de la cartographie, 2e édition. Paris: Armand Colin.
Năstase, A., & Osaci-Costache, G. (2001). Topografie. Cartografie. Bucureşti: Editura Fundaţiei “România de Mâine”.
Osaci-Costache, G. (2008). Cartografie. Bucureşti: Editura Universitară.
Osaci-Costache, G. (2009). Curs de cartografie. Bucureşti: Editura Credis.
Osaci-Costache, G. (2011). Utilizarea programelor gratuite Phildigit și Philcarto în predarea cartografiei. Tendințe actuale în predarea și învățarea geografiei 10, Presa Universitară Clujeană, pp. 419-425.
Osaci-Costache, G., Dulamă, M. E., & Ilovan, O. R. (2013c). Geography University Students’ Competence to Elaborate Column Charts. A Case Study for Romania. Review of International Geographical Education Online 3(2), pp. 163-188. Retrieved July 5, 2015, from http://www.rigeo.org/vol3no2/RIGEO-V3-N2-4.pdf
Osaci-Costache, G., Dulamă, M. E., & Ilovan, O. R. (2013b). Forming and Assessing the Competence to Elaborate Topographic Profiles. Studia Universitas Babeş-Bolyai, Geographia 58(2), pp. 199-220.
Osaci-Costache, G., Dulamă, M. E., Alexandru, D. E., & Voitovici, M. R. (2013a). Forming and assessing the competence to elaborate tourist street plans. PedActa 3(2), pp. 97-114.
Salerno, G. (2014). Map design per il GIS. Guida alla realizzazione di cartografie professionali. Palermo: Dario Flaccovio Editore.
76