Embed Size (px)
Citation preview

Assessing the calibration differencesin the reflective solar bands of TerraMODIS and Landsat-7 enhancedthematic mapper plus
Amit AngalXiaoxiong XiongDennis HelderMorakot KaewmaneeLarry Leigh
Amit Angal, Xiaoxiong Xiong, Dennis Helder, Morakot Kaewmanee, Larry Leigh, “Assessing thecalibration differences in the reflective solar bands of Terra MODIS and Landsat-7 enhancedthematic mapper plus,” J. Appl. Remote Sens. 12(4), 044002 (2018),doi: 10.1117/1.JRS.12.044002.
Downloaded From: https://www.spiedigitallibrary.org/journals/Journal-of-Applied-Remote-Sensing on 08 Jul 2019Terms of Use: https://www.spiedigitallibrary.org/terms-of-use
Assessing the calibration differences in the reflectivesolar bands of Terra MODIS and Landsat-7
enhanced thematic mapper plus
Amit Angal,a,* Xiaoxiong Xiong,b Dennis Helder,c
Morakot Kaewmanee,c and Larry Leighc
aScience Systems and Applications Inc., Lanham, Maryland, United StatesbNASA GSFC, Sciences and Exploration Directorate, Greenbelt, Maryland, United States
cSouth Dakota State University, Image Processing Lab, Brookings, South Dakota, United States
Abstract. Long-term data records obtained from Earth observing sensors depend not only onthe calibration accuracy of individual sensors but also on the consistency across instruments andplatforms. Hence, sensor calibration intercomparison plays a vital role for a better understandingof various science products. The Moderate Resolution Imaging Spectroradiometer (MODIS)and enhanced thematic mapper plus (ETM+) on the Terra and Landsat 7 platforms have operatedsuccessfully since their launch, collecting measurements in the reflective solar and infrared partsof the spectrum. Terra MODIS has employed a reflectance-based calibration since beginning itsmission. In the case of ETM+, a radiance-based calibration was employed until recent years,when a reflectance-based calibration was introduced. Being in the AM constellation with lessthan 30 min difference in overpass times, near-simultaneous Earth scene measurements can beeffectively used to assess the calibration differences between the spectrally matching bands ofthese two instruments. The pseudoinvariant calibration sites (PICS) in the North African desertare widely used for on-orbit calibration and validation of satellite sensors. Four PICS from thisregion have been employed to assess the multitemporal reflectance differences. Correction forbidirectional reflectance, spectral response function mismatch, and impacts of atmosphericwater-vapor have been incorporated to provide an assessment of the long-term stability ofeach spectral band and reflectance differences amongst them. Results indicate that the spectralbands of both instruments show a long-term stability to within 2% from 2000 to 2017. Thetop-of-atmosphere reflectances between the two instruments postcorrection agree to within 4%.Also included in this paper is a detailed discussion of various parameters contributing to theuncertainties of this cross-calibration. The techniques presented in this paper can be furtherextended to perform similar intercomparison between Landsat 8 Operational Land Imager, AquaMODIS, and Suomi-NPP VIIRS. © 2018 Society of Photo-Optical Instrumentation Engineers (SPIE)[DOI: 10.1117/1.JRS.12.044002]
Keywords: Moderate Resolution Imaging Spectroradiometer; Terra; aqua; Landsat 7; ETM+;Libya 4; pseudoinvariant calibration sites.
Paper 180549 received Jun. 29, 2018; accepted for publication Oct. 17, 2018; published onlineNov. 2, 2018.
1 Introduction
Since their launch in 1999, Terra Moderate Resolution Imaging Spectroradiometer (MODIS) andLandsat 7 (L7) enhanced thematic mapper plus (ETM+) have been acquiring scientific measure-ments on a near-continuous basis. Both instruments were built by Raytheon, Santa BarbaraRemote Sensing (SBRS), Goleta, California. Preflight calibration of both instruments wasalso performed at SBRS using a 100-cm spherical integrating source (SIS 100).1,2 Duringthe preflight calibration of these instruments, SBRS determined SIS radiances for multiplelamp levels. Furthermore, Butler et al.3 led a radiometric measurement comparison of theSIS-100 used in these calibrations using transfer radiometers from different groups. The goal
*Address all correspondence to: Amit Angal, E-mail: [email protected]
1931-3195/2018/$25.00 © 2018 SPIE
Journal of Applied Remote Sensing 044002-1 Oct–Dec 2018 • Vol. 12(4)
Downloaded From: https://www.spiedigitallibrary.org/journals/Journal-of-Applied-Remote-Sensing on 08 Jul 2019Terms of Use: https://www.spiedigitallibrary.org/terms-of-use
of these measurements was to independently measure the radiance of SIS 100 and validate theassigned calibration uncertainties. Results showed that the SIS 100 radiances agreed with thetransfer radiometer measurements to within �3% in the visible/near-infrared (VNIR) region and�4% in the short-wave infrared (SWIR) region for wavelengths not affected by atmosphericabsorption.3
On-orbit, the Terra MODIS reflective solar bands (RSB) employ a reflectance-basedcalibration on the solar diffuser (SD) coupled with an SD stability monitor to track itsdegradation.4 Terra MODIS also performs regular lunar measurements via its space-viewport to track the sensor response change at an angle other than SD, therefore facilitating thecharacterization of the on-orbit changes in the response versus scan-angle (RVS).5 TerraMODIS specified calibration uncertainty requirements are 2% in reflectance and 5% in radiancefor the RSB at typical scene radiance levels and observations within�45-SED scan angle range.6
In the case of Terra MODIS, the SWIR bands have a serious thermal leak and electronic crosstalkeffect that was identified during preflight calibration and has continued on-orbit. Although acorrection algorithm has been formulated and implemented, noticeable effects are still observedin the level 1B (L1B) calibration product. With the exception of some short-wavelength oceancolor bands, most RSB continue to meet the calibration uncertainty specification of 2%.6,7
On-orbit, the L7 ETM+ RSB also employs a suite of on-board calibrators that include inter-nal calibrator lamps, the full aperture solar calibrator and a partial aperture solar calibrator.The calibration uncertainty specification for L7 ETM+ RSB is 5% in radiance at typical sceneradiance levels.2 Previously, the on-orbit calibration of L7 ETM+ was performed using a radi-ance-based calibration approach that relies on use of solar exoatmospheric irradiance values.After launch of the Landsat 8 (L8) Operational Land Imager (OLI), the on-orbit calibrationapproach for L7 ETM+ is based upon a NIST-traceable reflectance calibration (similar toTerra MODIS), with its calibration tied to OLI.8
As both instruments continue to operate well past their design lifetimes, the ability of the on-board calibrators to effectively monitor the two instruments’ change on-orbit has diminished,particularly at short wavelengths. This was further reaffirmed from the temporal trending of theat-sensor reflectance from pseudoinvariant calibration sites (PICS).9 In the case of Terra MODIS,the SD and lunar measurements provide insufficient information for an accurate on-orbit RVScharacterization, particularly at short wavelengths, therefore resulting in a long-term reflectancedrift as observed in the collection 5 level 1B (L1B) calibrated product. In the enhanced collection6 (C6) L1B algorithm, the on-board calibrators are supplemented by the response trending fromthree North African PICS (Libya 1, Libya 2, and Libya 4) to provide more sampling across thescan-angle and therefore facilitate a better RVS characterization.9 The results show an improvedlong-term stability of the top-of-atmosphere (ToA) reflectance trends for the Terra MODIS RSB,as reported by Doelling et al.10 and Angal et al.11 Similar to Terra MODIS, the L7 ETM+ long-term at-sensor reflectance over PICS is also monitored regularly and in 2012, a reflectance driftof up to 2.8% was observed in some RSB. As a result, the calibration gains for all ETM+ RSBwere updated based on a weighted average of four individual PICS (Libya 4, Sudan 1,Mauritania 2, and Arabia 1). The entire ETM+ measurement dataset was reprocessed usingthese PICS-based gains, and mitigation in the reflectance drift was confirmed.12
In recent years, Saharan PICS have been widely used for on-orbit calibration, validation, andcross-calibration of satellite sensors. Cosnefroy et al.13 performed the early work on the iden-tification and characterization of Saharan PICS. Using this work as a baseline, the process ofusing PICS has evolved and matured over the last several years with improved accuracies andreduced uncertainties. Well-calibrated instruments like Tera MODIS and ETM+ rely on the tem-poral stability of PICS to correct for long-term drifts and inadequacies in their on-orbit calibra-tion. Our previous work (Angal et al.14) evaluated the long-term reflectance stability for thespectrally matching bands of Terra MODIS and L7 ETM+ using the Libya 4 PICS. Long-term reflectance drifts, due to reasons discussed earlier, were observed at short wavelengthsfrom the single site (Libya 4) that was used. Since this work, the on-orbit calibration method-ologies for both instruments have significantly improved resulting in updated calibrationversions. Landsat 7 ETM+ adopted a reflectance-based calibration tied to Landsat 8 OLI, andTerra MODIS adopted an improved RVS characterization using a combination of on-board andEarth view measurements.
Angal et al.: Assessing the calibration differences in the reflective solar bands. . .
Journal of Applied Remote Sensing 044002-2 Oct–Dec 2018 • Vol. 12(4)
Downloaded From: https://www.spiedigitallibrary.org/journals/Journal-of-Applied-Remote-Sensing on 08 Jul 2019Terms of Use: https://www.spiedigitallibrary.org/terms-of-use

In this paper, the reflectance drifts for the spectrally matching RSB of these instruments,with the most recent calibration version (collection 6.1 for Terra MODIS and collection 1for L7 ETM+), over Libya 4 and three other PICS (Niger 1, Niger 2, and Libya 1) are evaluated.In comparison with the previous work, improved corrections for bidirectional reflectance dis-tribution function (BRDF) and characterization of atmospheric effects are presented in this paper.A semiempirical model (Roujean et al.15) is implemented to remove the effects for surface BRDFeffects. Overall, the reflectance drifts from the four sites at all wavelengths are less than 2% withsite-dependent uncertainties. This is an expected result for the Libya 4 and Libya 1 PICS thathave been used in the on-orbit calibration of the two instruments, and the results from Niger 1and Niger 2 further reaffirm the improvements.
For satellites flying in the same orbit, as is the case with L7 and Terra, near simultaneousviews of stable ground targets, such as PICS, facilitate a unique opportunity to evaluate theabsolute calibration differences between the two instruments. Only the same-day scenes(∼30-min overpass time difference) with BRDF-normalized reflectances are used in thisstudy. It is necessary to account for the differences between the relative spectral responses(RSR) for the spectrally matching bands. In this paper, this process is performed using hyper-spectral observations from Earth observing 1 (EO-1) Hyperion and radiative transfer simulationsusing MODTRAN.16,17 The effects for atmospheric water-vapor absorption are evaluated usingradiative transfer simulations and real-time measurements via the NCEP/NCAR database.18
These corrections are derived for each PICS considered in this study. The results from eachPICS indicate that the reflectance difference between Terra MODIS and Landsat 7 ETM+ spec-trally matching bands, after all the above-mentioned corrections, agrees to within 4% for mostbands. This trend is generally consistent with that observed during the round-robin preflightcalibration comparison performed by Butler et al.3 A vital aspect of any cross-sensor comparisonis a comprehensive uncertainty analysis and an in-depth assessment of the uncertainties from thePICS-based approach is discussed in this paper. Furthermore, the methodologies discussed inthis paper will be extended in the future to evaluate the on-orbit calibration agreement betweenL8 OLI and Aqua MODIS, and Visible Infrared Imaging Radiometer Suite (VIIRS) instrumenton Suomi NPP and NOAA-20 satellites.
2 Site and Sensor Overview
2.1 Site Overview
The PICS in the North African region are popularly used in on-orbit calibration and validationfor various satellite sensors in the reflective solar region. Following up on Cosnefroy et al.13
work, Lachérade et al.19 performed a comprehensive study of these sites using satellite obser-vations. As introduced earlier, out of the 20+ African PICS, four sites namely, Libya 1, Libya 4,Niger 1, and Niger 2 were chosen for this cross-calibration work. Figures 1(a)–1(d) show L7ETM+ images of these sites. The Infrared and Visible Optical Sensors Working Group from theCommittee of Earth Observing Satellites has recognized the importance of the desert sites forinstrument calibration and as a part of that work, Lachérade et al.19 also identified usable areas
Fig. 1 L7 ETM+ images for the chosen PICS. (a) Libya4 P181-R40, (a) Libya1 P181-R43,(a) Niger1 P189-R46, and (d) (a) Niger2 P188-R45.
Angal et al.: Assessing the calibration differences in the reflective solar bands. . .
Journal of Applied Remote Sensing 044002-3 Oct–Dec 2018 • Vol. 12(4)
Downloaded From: https://www.spiedigitallibrary.org/journals/Journal-of-Applied-Remote-Sensing on 08 Jul 2019Terms of Use: https://www.spiedigitallibrary.org/terms-of-use

(0.9 deg×0.9 deg) for these sites, as listed in Table 1. Each of these sites shows varyingcharacteristics in terms of surface reflectance, atmospheric variations, spatial and spectralhomogeneity, etc. However, it should be noted that, with a 30-min (or less) difference betweenthe overpass times of the two satellites, uncertainties due to atmospheric variations, spatial andspectral inhomogeneity should be minimized significantly. A detailed discussion of the uncer-tainties associated with this cross-calibration is also discussed in the latter sections.
2.2 Sensor Overview
The design and on-orbit performance of the ETM+ and MODIS instruments has been exten-sively documented by Xiong et al.20 and Markham et al.21 Some key details related to the spectraland spatial characteristics that are relevant to this work have been listed in Table 2. It is note-worthy that the ETM+ bands have a wider bandpass and a finer spatial resolution compared tothe corresponding spectrally matching bands of MODIS. The large uniform areas chosen fromthe PICS help reduce the uncertainties due to mismatches in the spatial resolutions during thecomputation of mean reflectance or radiance of the chosen region-of-interest (RoI). The mis-match in the spectral bandwidths between the two sensors is the primary source for the observeddifferences in the ToA reflectance between the two instruments. Hyperspectral measurements ofToA reflectance of the ground target have been previously used to account for this mismatch, andthe uncertainty associated with such corrections has also been well documented.22 In this work,the ToA reflectance measurements from EO-1 Hyperion are used to account for the spectralmismatch between ETM+ and Terra MODIS RSB. Launched in November 2000, in thesame orbit as Terra and L7, the EO-1 mission acquired successful observations of the Earthvia Hyperion and advanced land imager instruments. The EO-1 satellite was decommissionedin the early months of 2017 after several years of a gradual deorbiting. On-orbit calibrationperformance of the EO-1 Hyperion has been previously reported.23,24
Table 1 PICS RoI bounding box (in deg).
Site Min-lat Max-lat Min-lon Max-lon
Libya 4 28.45 28.65 23.29 23.49
Libya 1 24.40 24.60 13.20 13.40
Niger 1 19.75 19.95 9.9 10.10
Niger 2 21.00 21.20 10.50 10.70
Table 2 Summary of the spectral bandwidth (BW), center wavelength (CW), and spatialresolution.
Terra MODIS L7 ETM+
Band BW (μm) CW (μm)Spatial
resolution (m) Band BW (μm) CW (μm)Spatial
resolution (m)
1 0.62–0.67 0.64 250 3 0.63–0.69 0.66 30
2 0.84–0.87 0.85 250 4 0.77–0.90 0.83 30
3 0.45–0.47 0.46 500 1 0.45–0.51 0.47 30
4 0.54–0.56 0.55 500 2 0.52–0.60 0.56 30
6 1.62–1.65 1.62 500 5 1.55–1.75 1.65 30
7 2.10–2.15 2.11 500 7 2.09–2.35 2.20 30
Angal et al.: Assessing the calibration differences in the reflective solar bands. . .
Journal of Applied Remote Sensing 044002-4 Oct–Dec 2018 • Vol. 12(4)
Downloaded From: https://www.spiedigitallibrary.org/journals/Journal-of-Applied-Remote-Sensing on 08 Jul 2019Terms of Use: https://www.spiedigitallibrary.org/terms-of-use
3 Methodology
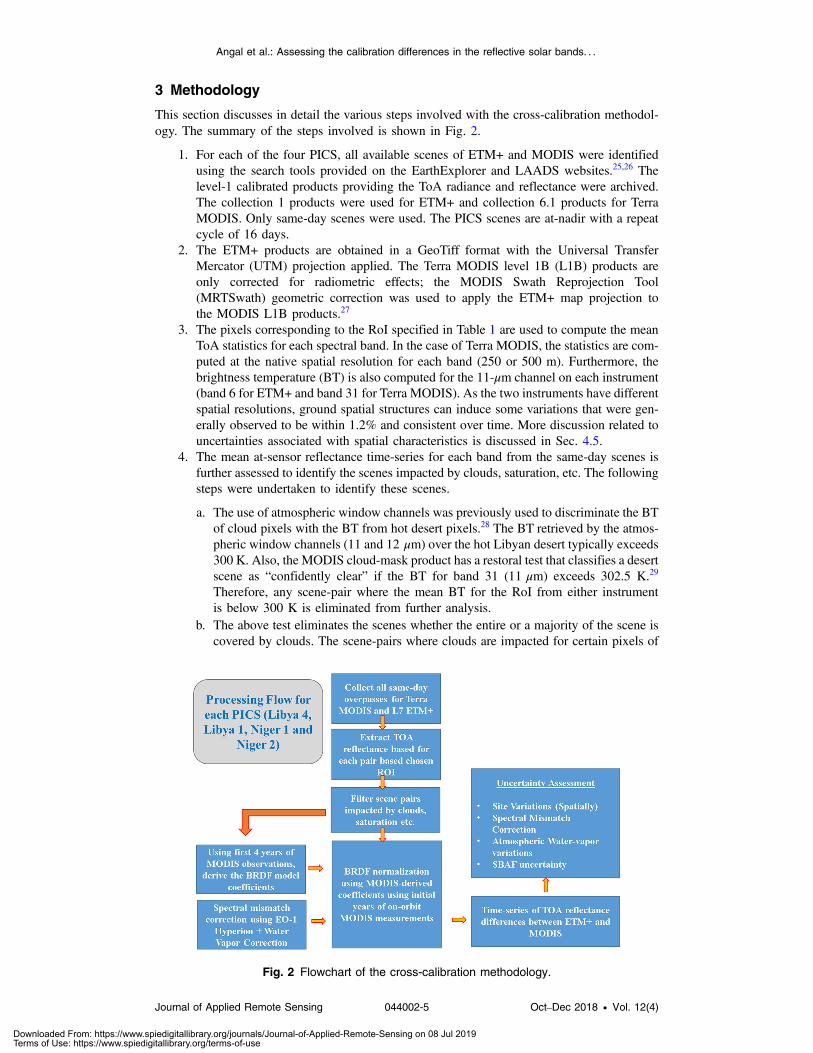
This section discusses in detail the various steps involved with the cross-calibration methodol-ogy. The summary of the steps involved is shown in Fig. 2.
1. For each of the four PICS, all available scenes of ETM+ and MODIS were identifiedusing the search tools provided on the EarthExplorer and LAADS websites.25,26 Thelevel-1 calibrated products providing the ToA radiance and reflectance were archived.The collection 1 products were used for ETM+ and collection 6.1 products for TerraMODIS. Only same-day scenes were used. The PICS scenes are at-nadir with a repeatcycle of 16 days.
2. The ETM+ products are obtained in a GeoTiff format with the Universal TransferMercator (UTM) projection applied. The Terra MODIS level 1B (L1B) products areonly corrected for radiometric effects; the MODIS Swath Reprojection Tool(MRTSwath) geometric correction was used to apply the ETM+ map projection tothe MODIS L1B products.27
3. The pixels corresponding to the RoI specified in Table 1 are used to compute the meanToA statistics for each spectral band. In the case of Terra MODIS, the statistics are com-puted at the native spatial resolution for each band (250 or 500 m). Furthermore, thebrightness temperature (BT) is also computed for the 11-μm channel on each instrument(band 6 for ETM+ and band 31 for Terra MODIS). As the two instruments have differentspatial resolutions, ground spatial structures can induce some variations that were gen-erally observed to be within 1.2% and consistent over time. More discussion related touncertainties associated with spatial characteristics is discussed in Sec. 4.5.
4. The mean at-sensor reflectance time-series for each band from the same-day scenes isfurther assessed to identify the scenes impacted by clouds, saturation, etc. The followingsteps were undertaken to identify these scenes.
a. The use of atmospheric window channels was previously used to discriminate the BTof cloud pixels with the BT from hot desert pixels.28 The BT retrieved by the atmos-pheric window channels (11 and 12 μm) over the hot Libyan desert typically exceeds300 K. Also, the MODIS cloud-mask product has a restoral test that classifies a desertscene as “confidently clear” if the BT for band 31 (11 μm) exceeds 302.5 K.29
Therefore, any scene-pair where the mean BT for the RoI from either instrumentis below 300 K is eliminated from further analysis.
b. The above test eliminates the scenes whether the entire or a majority of the scene iscovered by clouds. The scene-pairs where clouds are impacted for certain pixels of
Fig. 2 Flowchart of the cross-calibration methodology.
Angal et al.: Assessing the calibration differences in the reflective solar bands. . .
Journal of Applied Remote Sensing 044002-5 Oct–Dec 2018 • Vol. 12(4)
Downloaded From: https://www.spiedigitallibrary.org/journals/Journal-of-Applied-Remote-Sensing on 08 Jul 2019Terms of Use: https://www.spiedigitallibrary.org/terms-of-use

the RoI also need to be identified. In the case of Terra MODIS, the MODIS cloud-mask product, which provides pixel level classification for clouds, was employedto identify and retain scenes that have greater than 75% of the pixels flagged as“confidently clear.”
c. The scene-pairs where saturation in the instrument response while viewing the desertis observed in either instrument is also eliminated.
5. The filtered at-sensor reflectance time-series from Terra MODIS is used to derive theBRDF normalization coefficients on a per-band basis. Differences in directional obser-vations due to solar and sensor view geometries and overpass times induce surface andatmospheric BRDF impacts on the retrieved ToA reflectance. Due to the complexityassociated with a physical BRDF model, a simple kernel-driven model replying onthe weighted sum of the geometric and volumetric functions of the view and illuminationgeometry and an isotropic parameter was chosen to determine the modeled reflectance.13
All near-nadir observations of Terra MODIS RSB from the first 4 years were used toderive these BRDF normalization coefficients by minimizing the residual error usingan optimization algorithm. The per-band BRDF normalization coefficients from TerraMODIS are applied to the corresponding spectrally matching bands of ETM+ toretrieve the corresponding ETM+ time-series post-BRDF correction.
6. As introduced earlier, the mismatch due to differing RSRs between the two instrumentsis corrected using hyperspectral measurements from EO-1 Hyperion. The Level 1Gimages of EO-1 Hyperion for each PICS were archived and processed. Hyperion hasa very narrow swath (7 km) in comparison with MODIS and ETM+, so all pixels withinthe specified RoI were chosen to calculate the ToA reflectance across the 196 channelsfrom 0.4 to 2.2 μm. The EO-1 Hyperion data product provides an at-sensor radiance thatis converted to ToA reflectance using a solar irradiance spectra from Chukur.13 The der-ivation of spectral band adjustment factor (SBAF), as formulated by Chander et al.,22 toaccount for the RSR differences was calculated for every Hyperion scene. Consequently,a time-series of SBAF for each band-pair was obtained. Due to the varying orbit of theEO-1 satellite, same-day Hyperion scene pairs were not available. A lifetime average ofSBAF temporal trending is used to derive the correction for each scene-pair of MODISand ETM+. Also, an additional correction for the columnar atmospheric variations,specifically for L7 ETM+ bands 4 and 5, is accounted for via an additional correctiondiscussed in later sections.
4 Results
4.1 ToA Reflectance
Using the methodology described in the earlier section, the time-series of ToA reflectance isgenerated on a per-band basis for each of the four sites. Figure 3 shows the mean ToA reflectancetrending for the four sites for the spectrally matching bands around 0.64 μm. The error barsdenote the 1-sigma deviation of the ToA reflectance around the mean value. Figure 4 showsthe mean ToA reflectance trending for the spectrally matching bands centered at 0.86 μm.The data shown in Figs. 3 and 4 are all available overpasses from L7 ETM+ over the givensite and all available near-nadir overpasses for Terra MODIS. During the first decade ofL7 ETM+ operations, the data from the Niger sites were not collected as frequently as theLibyan sites, therefore leading to some temporal gaps in the data. In the case of TerraMODIS, the near-nadir collects are at a frequency of one every 16 days therefore leading toa more continuous time-series of collects. Figure 5 shows the lifetime mean ToA reflectanceplotted as a function of wavelength for all four sites. The solid lines denote the L7 ETM+ reflec-tance, and the dotted lines denote the Terra MODIS reflectance. Overall, the reflectance from theNiger 2 site is seen to be the lowest across all wavelengths. The major cause behind the deviationof the ToA reflectance ratio between L7 ETM+ and Terra MODIS shown in Fig. 5(b) is the RSRmismatch between the two instruments, especially at the longer wavelengths (beyond 0.8 μm).
Angal et al.: Assessing the calibration differences in the reflective solar bands. . .
Journal of Applied Remote Sensing 044002-6 Oct–Dec 2018 • Vol. 12(4)
Downloaded From: https://www.spiedigitallibrary.org/journals/Journal-of-Applied-Remote-Sensing on 08 Jul 2019Terms of Use: https://www.spiedigitallibrary.org/terms-of-use

The yearly oscillations in the ToA reflectance trends are predominantly caused due to the surfaceand atmospheric BRDF effects. Although impacting both instruments, it is more evident in theTerra MODIS trends due to a continuous time-series of reflectance trend. The BRDF normalizedreflectances are used to evaluate the long-term drifts in each of the spectral bands, and the resultsare presented in the next subsection.
4.2 Long-Term Drift
The BRDF coefficients derived from the first few years of Terra MODIS observations are used tonormalize the time-series reflectances for both instruments. Only the same-day scenes after
Fig. 3 ToA reflectance trending for the (a) 0.64 μm channels of Terra MODIS and (b) L7 ETM+:Libya 4 (red), Libya 1(blue), Niger 1 (green), and Niger 2 (black).
Fig. 4 ToA reflectance trending for the (a) 0.86 μm channels of Terra MODIS and (b) L7 ETM+.
Fig. 5 (a) Mean ToA reflectance versus wavelength, the solid lines denote L7 ETM+ reflectanceand the dotted lines denote the MODIS reflectance, and (b) ToA reflectance ratio.
Angal et al.: Assessing the calibration differences in the reflective solar bands. . .
Journal of Applied Remote Sensing 044002-7 Oct–Dec 2018 • Vol. 12(4)
Downloaded From: https://www.spiedigitallibrary.org/journals/Journal-of-Applied-Remote-Sensing on 08 Jul 2019Terms of Use: https://www.spiedigitallibrary.org/terms-of-use

filtering for clouds, saturation, etc. are retained for further processing. The derived coefficientsare site-specific as well as band-dependent. Figure 6 shows the Libya 4 measured ToA reflec-tances normalized by the BRDF model reflectances for Terra MODIS bands 1 and 2 with thespectrally matching ETM+ bands 3 and 4. The seasonal trend in the ToA reflectance trend asobserved in Figs. 3 and 4 is reduced from 7% to within 3% for Terra MODIS band 1. In the caseof Terra MODIS band 2 and ETM+ band 4, the improvement is not as pronounced due to thewater-vapor absorption feature in the ETM+ RSR. The BRDF normalized time-series is normal-ized to the mission beginning to estimate the long-term drift on a band-by-band basis. A simplelinear model is used to estimate the cumulative long-term reflectance drift from 2000 to 2017,and the standard error around the linear fit is also calculated. A similar technique is applied for allthe band pairs from each of the four sites and the long-term drift from each site is shown as afunction of wavelength in Fig. 7. With the exception of one case (ETM+ band 3 from Niger 1),
Fig. 6 BRDF normalized ToA reflectance for (a) ETM+ band 3 and MODIS band 1 and(b) ETM+ band 4 and MODIS band 2.
Fig. 7 Long-term drift for ETM+ (blue) andMODIS (red) from 2000 to 2017 for (a) Libya 4, (b) Libya1, (c) Niger 1, and (d) Niger 2
Angal et al.: Assessing the calibration differences in the reflective solar bands. . .
Journal of Applied Remote Sensing 044002-8 Oct–Dec 2018 • Vol. 12(4)
Downloaded From: https://www.spiedigitallibrary.org/journals/Journal-of-Applied-Remote-Sensing on 08 Jul 2019Terms of Use: https://www.spiedigitallibrary.org/terms-of-use

the long-term drift from all sites is within�2%. Larger standard error values are observed for theNiger sites in comparison with the Libyan sites. A major reason for this is the fewer number ofETM+ scenes (and hence a reduced number of scene-pairs) over the Niger 1 and Niger 2 sites.
4.3 SBAF Correction
As introduced earlier, hyperspectral measurements of the ground site were obtained using EO-1Hyperion. In contrast to the Terra MODIS and Landsat 7 ETM+ swaths, EO-1 Hyperion has anextremely small swath of 7 km and hence, it does not cover the entire RoI selected for each site.Consequently, a smaller RoI (within the larger RoI) was selected to derive the ToA reflectancefrom each Hyperion overpass. While over 400þ EO-1 Hyperion scenes were available overLibya 4 and Libya 1, less than 50 scenes were available over the Niger sites. Also, no Hyperionscenes over the Libyan or Niger sites were available before 2004. Figure 8(a) shows the lifetimeaverage ToA reflectance profile from all available EO-1 Hyperion scenes over each site. Thereflectance profile, at 10-nm spectral sampling, provides a convenient mechanism to accountfor the spectral mismatch between the two RSRs. Using this information and the RSRs forETM+ and MODIS, the SBAF is computed and is shown in Fig. 8(b). The trend of theSBAF curve is similar to the ETM+/MODIS reflectance ratio, as shown in Fig. 5(b). This furtherreaffirms the fact that a dominant source of the deviation in the ratios observed in Fig. 5(b) iscaused due to the spectral mismatch between the two instruments. The SBAF shown in Fig. 8(b)is applied to the BRDF normalized ToA reflectances to obtain the differences between the twoinstruments.
The chosen PICS are known to exhibit excellent radiometric, spatial, and spectral stability,and a stable long-term trending of the SBAF further reaffirms it.30 However, due to the differingorbits, an L7 ETM+ and Terra MODIS scene-pair is not necessarily coupled with an EO-1Hyperion overpass, therefore restricting the ability to characterize the localized scene conditions.This is especially critical for ETM+ band 4 and band 5 that have a water-vapor absorption featurein their RSR that is absent from the corresponding Terra MODIS bands 2 and 6.
In order to evaluate the impact of the water-vapor absorption feature on the estimate of RSRmismatch, a mid-latitude desert spectrum generated using MODTRAN was varied against differ-ent amounts of column atmospheric water-vapor to estimate the variation of SBAF, as shownin Fig. 9(a). Significant variation (up to 8%) is observed in the SBAF as a function of water-vapor for ETM+ band 4/Terra MODIS band 2 and ETM+ band 5/Terra MODIS band 6 pairs.Figure 9(b) shows the columnar atmospheric retrieved as a part of the SDSU Image ProcessingLab’s Atmospheric Modelling database. This database was developed to facilitate atmosphericcorrection of satellite imagery and houses three key inputs: aerosol, water-vapor, and ozone on aglobal scale. The water-vapor information is ingested from the NOAA NCEP and provides mea-surements on a time-scale of every 3 h over a given ground target (PICS in this case). For everyoverpass, the retrieved water-vapor from Fig. 9(b), along with the curve shown in Fig. 9(a), isused to compute an equivalent time-dependent correction factor that is used with the SBAF tocorrect the BRDF normalized reflectances.
Fig. 8 (a) Lifetime averaged ToA reflectance spectrum for the four sites from EO-1 Hyperion.(b) Lifetime average SBAF derived for the spectrally matching bands of ETM+ and MODIS.
Angal et al.: Assessing the calibration differences in the reflective solar bands. . .
Journal of Applied Remote Sensing 044002-9 Oct–Dec 2018 • Vol. 12(4)
Downloaded From: https://www.spiedigitallibrary.org/journals/Journal-of-Applied-Remote-Sensing on 08 Jul 2019Terms of Use: https://www.spiedigitallibrary.org/terms-of-use

4.4 Reflectance Differences
Using the SBAF that includes a time-dependent water-vapor correction, the BRDF normalizedreflectances are corrected and shown in Fig. 10. The BRDF normalized reflectances for Libya 4before SBAF and water vapor correction are plotted in pink and after SBAF and water vaporcorrection are plotted in purple. The deviation of these time-trends (post BRDF and SBAF
Fig. 9 (a) SBAF dependence on columnar atmospheric water-vapor as simulated usingMODTRAN and (b) columnar atmospheric water-vapor over Libya 4.18
Fig. 10 (a)–(f) L7 ETM+ and Terra MODIS reflectance differences for Libya 4 before and afterSBAF and water-vapor correction.
Angal et al.: Assessing the calibration differences in the reflective solar bands. . .
Journal of Applied Remote Sensing 044002-10 Oct–Dec 2018 • Vol. 12(4)
Downloaded From: https://www.spiedigitallibrary.org/journals/Journal-of-Applied-Remote-Sensing on 08 Jul 2019Terms of Use: https://www.spiedigitallibrary.org/terms-of-use

correction) from unity represents the reflectance differences between the two instruments.Similar corrections are also applied for the other three PICS. An overcorrection is seen forETM+ band 1 and MODIS band 3, where the reflectance ratio (∼1.03) is reduced (to around0.96) postcorrection. This overcorrection is caused due to the limitation of the Hyperion-basedSBAF correction and is discussed in further detail in the next section. ETM+ band 2 and MODISband 4 show an excellent agreement to within 0.3%. In the case of ETM+ band 3 and MODISband 1, the agreement is within 2%. The ETM+ band 4 and MODIS band 2 agree within 3% andthe SWIR bands show an excellent agreement to within 2%. In the case of ETM+ bands 4 and 5,the additional correction for water-vapor has been applied to these ratios and, as a result, reducedfluctuations are observed in the corrected (purple) trends in comparison with the uncorrected(pink) trends.
A lifetime average of the BRDF normalized and SBAF, water-vapor corrected reflectances,and its standard error is computed for each band-pair and every PICS. Figure 11 shows thesummary for all four sites. A large disagreement (of about 5%) is observed for the shortest wave-length band across all the four PICS. At other wavelengths, the agreement is generally within�2%. In comparison with the Libyan sites, a greater standard error is observed for the Niger 1and Niger 2 results.
4.5 Discussions
The disagreement between ETM+ band 1 and MODIS band 3, observed for all the PICS, isinvestigated further in this section. The coarsely sampled (10 nm) EO-1 Hyperion reflectancespectra are compared with the finely sampled spectra from ENVISAT scanning imaging absorp-tion spectrometer for atmospheric CARTOGRAPHY (SCIAMACHY) in Fig. 12(a). TheENVISAT SCIAMACHYmission (March 2002 to April 2012) produced high spectral resolution(0.2 to 1.5 nm) data over the wavelength range from 240 to 1700 nm and in select spectral bandsaround 2 and 2.4 μm.31 Doelling et al.32 demonstrated the use of SCIAMACHY to derive SBAFsbetween MODIS and other various GEO/LEO sensors and more recently, Scarino et al.33 haveincorporated SCIAMACHYas the primary source to derive the SBAFs via a web-based tool. Asshown in Fig. 12, the SCIAMACHY spectrum is very finely sampled, especially within the TerraMODIS spectral bandpass. Furthermore, the SBAF computed from the SCIAMACHY spectrum
Fig. 11. Summary of the reflectance differences between MODIS and ETM+ from four PICS:(a) Libya 4 (b) Libya 1 (c) Niger 1, and (d) Niger 2.
Angal et al.: Assessing the calibration differences in the reflective solar bands. . .
Journal of Applied Remote Sensing 044002-11 Oct–Dec 2018 • Vol. 12(4)
Downloaded From: https://www.spiedigitallibrary.org/journals/Journal-of-Applied-Remote-Sensing on 08 Jul 2019Terms of Use: https://www.spiedigitallibrary.org/terms-of-use

of Libya 4 from Fig. 12(a) results in a value of 1.019 instead of 1.064 (from Hyperion). TheBRDF normalized reflectances shown earlier were corrected using the SCIAMACHY-basedSBAF, and the results are shown in Fig. 12(b). The 4.23% overcorrection observed with theHyperion SBAF is essentially eliminated and the difference between the two sensors is observedto be within 0.5% with a standard error of 1.3%. This result confirms that the difference observedfor ETM+ band 1 and Terra MODIS band 3 was a result of the limitation of the EO-1 Hyperionspectrum. Ideally, a high-resolution spectrum such as produced by ENVISAT SCIAMACHYshould be used to compute the SBAF; however, all the SCIAMACHY data to produce suchinformation were not available for this work.
The RoIs selected for each of the PICS are based of the work done by Lachérade et al.19 Morerecently, Kaewmanee et al.34 have formulated and implemented a PICS normalization process tobring various PICS on the same scale based on a common reference. As part of this effort, theCNES RoIs were evaluated based on the ToA measurements from the well calibrated L8 OLI.Based on these measurements, a revised (optimal) RoI that has a 3% spatial, spectral, and tem-poral stability has been identified for each of these PICS. Figure 13 shows a comparison betweenthe baseline CNES ROI and optimal RoI chosen from the above work. Ideally, for stable radio-metric targets, such as PICS, variations in the RoI are expected to have minimal impacts on thederived results; however, if the optimal RoI produces an improved spatial, spectral, and temporalstability, an improvement in the results is generally expected. The cross-calibration processdescribed earlier was performed using the optimal RoIs and the results were compared withthose obtained from the baseline RoI. Figure 13 shows a comparison of cross-calibration resultsusing both RoIs for Niger 1.
4.6 Uncertainty Analysis
To address the uncertainty associated with this cross-calibration, it is convenient to divide theapproach into three parts: (1) the uncertainties associated with the individual PICS used in this
Fig. 12 (a) ToA reflectance profile comparison between SCIAMACHY and Hyperion and (b) itsimpact on the cross-calibration results.
Fig. 13 MODIS ETM+ reflectance difference using the CNES specified and the optimal RoI.
Angal et al.: Assessing the calibration differences in the reflective solar bands. . .
Journal of Applied Remote Sensing 044002-12 Oct–Dec 2018 • Vol. 12(4)
Downloaded From: https://www.spiedigitallibrary.org/journals/Journal-of-Applied-Remote-Sensing on 08 Jul 2019Terms of Use: https://www.spiedigitallibrary.org/terms-of-use

analysis; (2) the calibration uncertainty of the sensors; (3) and the uncertainty due to the spectralbandpass differences of the two sensors. The uncertainties due to the PICS that were used in thisstudy are fairly well understood. Previous analyses of these sites using 4 years of Landsat 8 datahave indicated that the overall temporal uncertainties were less than 2.3% for all spectral bandsand for all four sites.34 These characterizations include both the surface and atmosphere as acombined measure of the overall uncertainty of the site. For the Landsat 7 sensor, analyzedover a longer period of time, the overall uncertainties of these PICS were less than 2% forall the bands for both sensors, with the exception of Libya1 in the blue bands (ETM+ band1 and MODIS band 3) and Libya4 in the SWIR2 (band 7) bands, which exhibit, respectively,2.7% and 2.4%. The overall range of values is shown in the first entry of Table 3. As for TerraMODIS, the largest temporal uncertainties were for the Niger2 and Niger1 Blue band, and theNiger1 SWIR2 band, which were 2.9% and 2.1%, respectively. The total range of the uncer-tainties for MODIS is given in the second entry of Table 3. The overall calibration uncertainty forLandsat 7 is 5%.2 Similarly, Terra MODIS has a calibration uncertainty in the VNIR bands of 2%and in the SWIR bands of 3%.7 These data are also shown in Table 3. The uncertainty due tospectral differences between the two sensors was determined by an analysis of 14 years of hyper-spectral data obtained by Hyperion. By analyzing the standard deviation about the mean spectralvalues for each of the sites, it was found that uncertainties due to spectral difference ranged from0.1% to 1.8%, less than 1.05% for VNIR and ranging from 0.9% to 1.8% for SWIR bands. Thisinformation is also shown in Table 3. Combining these three sources of uncertainty together,with the reasonable assumption that they are uncorrelated, results in an overall range of uncer-tainty for the cross-calibration from 5.6% to 6.8% with the largest uncertainty occurring inthe SWIR 2 band due to large spectral bandpass differences between the sensors as well as thesignificant water absorption features that exist at these wavelengths. For completeness, theuncertainties are broken out by site and spectral band in Table 4, and so, the reader can ascertainrelative differences between the sites and wavelengths.
Table 3 Summary of cross-calibration Landsat7 and Terra MODIS uncertainty sources.
Uncertainty sources Uncertainty (%) Remarks
Landsat7 PICS temporal uncertainty 0.85%–2.70% All bands and all for four PICS
Terra MODIS PICS temporal uncertainty 0.74%–2.90% All bands and all for four PICS
Landsat 7 calibration uncertainty 5% All bands
Terra MODIS calibration uncertainty 2%–3% 2% for VNIR and 3% for SWIR bands
SBAF calculation uncertainty 0.1%–1.8% Within 1.05% for VNIR and 0.9% to1.8% SWIR bands
Total 5.6%–6.8% All bands and all for four PICS
Table 4 Landsat7 ETM+ and Terra MODIS cross-calibration total uncertainty analysis for all fourPICS.
Total uncertainties Libya1 Libya4 Niger1 Niger2
Blue 6.4% 5.6% 6.3% 6.3%
Green 5.8% 5.6% 5.8% 5.9%
Red 5.6% 5.6% 5.6% 5.7%
NIR 5.8% 5.9% 5.9% 6.0%
SWIR1 6.1% 6.1% 6.2% 6.1%
SWIR2 6.4% 6.7% 6.6% 6.8%
Angal et al.: Assessing the calibration differences in the reflective solar bands. . .
Journal of Applied Remote Sensing 044002-13 Oct–Dec 2018 • Vol. 12(4)
Downloaded From: https://www.spiedigitallibrary.org/journals/Journal-of-Applied-Remote-Sensing on 08 Jul 2019Terms of Use: https://www.spiedigitallibrary.org/terms-of-use

5 Conclusion
Using near-simultaneous scene-pairs from PICS is an effective way to perform sensor cross-calibration. In this work, L7 ETM+ and Terra MODIS instruments, that are independently cali-brated prelaunch and postlaunch, utilize PICS to perform a reflectance-based cross-calibration oftheir spectrally matching RSB. Utilizing the excellent temporal stability of PICS, long-term cal-ibration stability of each RSB of both instruments is evaluated independently. Our previous workdeveloped the initial methodology for this cross-calibration that has now been expanded to applyto a longer-time series from multiple ground sites, including an in-depth analysis of the asso-ciated uncertainties. The latest versions of calibrated data (collection 6.1 for MODIS and col-lection 1 for ETM+) are used in this work. Both instruments demonstrate an excellent temporalstability with the long-term drifts for all bands well within 2% over 18 years. As expected, site-to-site variations in the results are observed with the Libyan sites showing lower standard errorcompared to the Niger sites. To minimize the impacts of the short-term and long-variations asso-ciated with the site, only same-day scenes are chosen to evaluate the at-sensor reflectancedifferences between spectrally matching bands. Although the effects of site and atmosphereBRDF are minimal, a MODIS-based semiempirical model is used to derive the correction coef-ficients that are applied to the spectrally matching ETM+ bands. EO-1 Hyperion based SBAFcorrection and use of near real-time water-vapor information are employed to account for thespectral mismatch between the RSRs to get an agreement within�4% (from the Libyan sites) forall bands except for the short wavelength ETM+ band 1 and MODIS band 3. The difference atshort wavelengths is due to the limitation of the EO-1 Hyperion to provide sufficient spectralsampling at these wavelengths. The use of SCIAMACHY is used to confirm this. A detaileduncertainty characterization including the site variability and on-orbit behavior of the instru-ments has also been performed. The combined uncertainty budget for the cross-calibrationbetween ETM+ and MODIS RSB using the PICS ranges from 5.6% to 6.8%. The techniquesdeveloped here can be extended to assess near-simultaneous measurements from other EOsensors such as Aqua MODIS, L8 OLI, and SNPP VIIRS, which are follow-on missions toTerra MODIS and Landsat 7 ETM+.
Acknowledgments
The authors would like to thank Gyanesh Chander and Taeyoung Choi for their efforts during theinitial development of this collaborative effort. The authors would also like to thank Aisheng Wuand other members of the MODIS characterization support team that have supported this effortin some way or the other. The SCIAMACHY profile for Libya 4 was provided by BenScarino, SSAI.
References
1. W. Barnes, T. S. Pagano, and V. Salomonson, “Prelaunch characteristics of the moderateresolution imaging spectroradiometer (MODIS) on EOS-AM1,” IEEE Trans. Geosci.Remote Sens. 36(4), 1088–1100 (1998).
2. B. L. Markham et al., “Landsat-7 enhanced thematic mapper plus radiometric calibration,”Can. J. Remote Sens. 23(4), 318–332 (1997).
3. J. Butler et al., “Radiometric measurement comparison on the integrating sphere sourceused to calibrate the moderate resolution imaging spectroradiometer (MODIS) and theLandsat 7 enhanced thematic mapper plus (ETM+),” J. Res. Nat. Inst. Stand. Technol.108(3), 199–228 (2003).
4. X. Xiong et al., “MODIS on-orbit calibration and characterization,” Metrologia 40(1),S89–S92 (2003).
5. J. Sun et al., “MODIS reflective solar bands on-orbit lunar calibration,” IEEE Trans. Geosci.Remote Sens. 45(7), 2383–2393 (2007).
6. X. Xiong et al., “Terra and aqua MODIS calibration algorithms and uncertainty analysis,”Proc. SPIE 5978, 59780V (2005).
Angal et al.: Assessing the calibration differences in the reflective solar bands. . .
Journal of Applied Remote Sensing 044002-14 Oct–Dec 2018 • Vol. 12(4)
Downloaded From: https://www.spiedigitallibrary.org/journals/Journal-of-Applied-Remote-Sensing on 08 Jul 2019Terms of Use: https://www.spiedigitallibrary.org/terms-of-use

7. X. Xiong et al., “Updates of MODIS on-orbit calibration uncertainty assessments,” Proc.SPIE 10402, 104020M (2017).
8. E. Micijevic, Md. O. Haque, and N. Mishra, “Radiometric calibration updates to the Landsatcollection,” Proc. SPIE 9972, 99720D (2016).
9. J. Sun et al., “Time-dependent response versus scan angle for MODIS reflective solarbands,” IEEE Trans. Geosci. Remote Sens. 52(6), 3159–3174 (2014).
10. D. R. Doelling et al., “The radiometric stability and scaling of collection 6 terra- andaqua-MODIS VIS, NIR, and SWIR spectral bands,” IEEE Trans. Geosci. Remote Sens.53(8), 4520–4535 (2015).
11. A. Angal et al., “Impact of Terra MODIS collection 6 on long-term trending comparisonswith Landsat 7 ETM+ reflective solar bands,” Remote Sens. Lett. 4(9), 873–881 (2013).
12. J. A. Barsi et al., “Landsat-7 ETM+ radiometric calibration status,” Proc. SPIE 9972,99720C (2016).
13. H. Cosnefroy, M. Leroy, and X. Briottet, “Selection and characterization of Saharian andArabian desert sites for the calibration of optical satellite sensors,” Remote Sens. Environ.58(1), 101–114 (1996).
14. A. Angal et al., “Multitemporal cross-calibration of the Terra MODIS and Landsat 7 ETM+reflective solar bands,” IEEE Trans. Geosci. Remote Sens. 51(4), 1870–1882 (2013).
15. J. L. Roujean, M. J. Leroy, and P. Y. Deschamps, “A bidirectional reflectance model ofthe Earth’s surface for the correction of remote sensing data,” J. Geophys. Res. 97(D18),20455–20468 (1992).
16. J. Pearlman et al., “Hyperion, a space-based imaging spectrometer,” IEEE Trans. Geosci.Remote Sens. 41(6), 1160–1173 (2003).
17. A. Berk et al., “MODTRAN 5: a reformulated atmospheric band model with auxiliaryspecies and practical multiple scattering options: update,” Proc. SPIE 5806, 662–667(2005).
18. E. Kalnay et al., “The NCEP/NCAR 40-year reanalysis project,” Bull. Am. Meteor. Soc. 77,437–471 (1996).
19. S. Lachérade et al., “Cross-calibration over desert sites: description, methodology andoperational implementation,” IEEE Trans. Geosci. Remote Sens. 51(3), 1098–1113 (2013).
20. X. Xiong et al., “Multiyear on-orbit calibration and performance of terra MODIS reflectivesolar bands,” IEEE Trans. Geosci. Remote Sens. 45(4), 879–889 (2007).
21. B. L. Markham et al., “Landsat-7 ETM+: 12 years on-orbit reflective-band radiometricperformance,” IEEE Trans. Geosci. Remote Sens. 50(5), 2056–2062 (2012).
22. G. Chander et al., “Applications of spectral band adjustment factors (SBAF) for cross-calibration,” IEEE Trans. Geosci. Remote Sens. 51(3), 1267–1281 (2013).
23. P. K. E. Campbell et al., “EO-1 hyperion reflectance time series at calibration and validationsites: stability and sensitivity to seasonal dynamics,” IEEE J. Sel. Top. Appl. Earth Obs.Remote Sens. 6(2), 276–290 (2013).
24. J. McCorkel, K. Thome, and L. Ong, “Vicarious calibration of EO-1 hyperion,” IEEE J. Sel.Top. Appl. Earth Obs. Remote Sens. 6(2), 400–407 (2013).
25. https://earthexplorer.usgs.gov/.26. https://ladsweb.modaps.eosdis.nasa.gov/missions-and-measurements/.27. “MRT Swath user’s manual,” https://lpdaac.usgs.gov/sites/default/files/public/MRTSwath_
Users_Manual_2.2_Dec2010.pdf.28. A. Wu and Q. Zhong, “A method for determining the sensor degradation rates of NOAA
AVHRR channels 1 and 2,” J. Appl. Meteorol. 33(1), 118–122 (1994).29. S. A. Ackerman and R. Frey, “MODIS atmosphere L2 cloud mask product (35_L2),”NASA
MODIS Adaptive Processing System, Goddard Space Flight Center (2015).30. N. Mishra et al., “Absolute calibration of optical satellite sensors using Libya 4 pseudo
invariant calibration site,” Remote Sens. 6(2), 1327–1346 (2014).31. A. A. Kokahnovsky, M. Schreier, and W. VonHoyningen-Huene, “The comparison of
spectral top-of-atmosphere reflectances measured by AATSR MERIS and SCIAMACHYonboard ENVISAT,” IEEE Trans. Geosci. Remote Sens. 5(1), 53–56 (2008).
32. D. R. Doelling et al., “Spectral reflectance corrections for satellite intercalibrations usingSCIAMACHY data,” IEEE Geosci. Remote Sens. Lett. 9(1), 119–123 (2012).
Angal et al.: Assessing the calibration differences in the reflective solar bands. . .
Journal of Applied Remote Sensing 044002-15 Oct–Dec 2018 • Vol. 12(4)
Downloaded From: https://www.spiedigitallibrary.org/journals/Journal-of-Applied-Remote-Sensing on 08 Jul 2019Terms of Use: https://www.spiedigitallibrary.org/terms-of-use

33. B. R. Scarino et al., “Aweb-based tool for calculating spectral band difference adjustmentfactors derived from SCIAMACHY hyperspectral data,” IEEE Trans. Geosci. Remote Sens.54(5), 2529–2542 (2016).
34. M. Kaewmanee, H. Vuppula, and D. Helder, “Improved temporal resolution of pseudoinvariant calibration sites (PICS) through development of the PICS normalization process(PNP),” in Proc. of CALCON (2017).
Amit Angal received his MS degree in electrical engineering from South Dakota StateUniversity, Brookings, South Dakota, USA. Currently, he is a lead optical engineer and asupervisor with Science Systems and Applications, Inc., Lanham, Maryland, USA, where heis involved in the radiometric characterization and calibration of remote sensing instruments.He is primarily involved in the on-orbit calibration of the reflective solar bands of theModerate-Resolution Imaging Spectroradiometer (MODIS) instruments on board the terraand aqua spacecraft. He has also supported the CLARREO Mission Preformulation activitiesin the reflective solar spectrum. In addition, he supports the preflight calibration of the JPSS-2VIIRS instrument and is involved with the early on-orbit calibration and validation of the JPSS-1VIIRS instrument. His research interests include cross-calibration between Landsat and MODISinstruments.
Xiaoxiong Xiong received his BS degree in optical engineering from Beijing Institute ofTechnology, Beijing, China, and his PhD in physics from the University of Maryland,College Park, Maryland, USA. Before joining the NASA Goddard Space Flight Center(GSFC), Greenbelt, Maryland, USA, he was involved in optical instrumentation, nonlinear optics,laser and atomic spectroscopy, and resonance ionization mass spectrometry at universities, indus-try, and the National Institute of Standards and Technology. Currently, he is an optical physicistwith GSFC, where he is also serving as the Moderate Resolution Imaging Spectroradiometer(MODIS) project scientist and the technical lead for the MODIS Characterization SupportTeam and the VIIRS Calibration Support Team.
Dennis Helder has been involved with the characterization and calibration of spaceborne andairborne remote sensing imaging systems for over 30 years. Initial work focused on characteri-zation and removal of radiometric artifacts of the Landsat TM and MSS sensors. More recentwork has emphasized development of vicarious radiometric calibration approaches for a varietyof optical remote sensing systems as well as on-orbit point spread function estimation. He hasserved on several NASA and USGS EROS science teams, including Landsat 7, Landsat 8, andEO-1. Currently, he is an associate dean for Engineering Research and distinguished professor ofelectrical engineering at South Dakota State University and is also on detail to USGS EROS asdirector of the EROS CalVal Center of Excellence
Morakot Kaewmanee was involved with Thailand Earth Observation Satellite (Thaichote)managing data acquisition and production system and image quality control from 2008 to2011 (GISTDA-Geo-Informatics and Space Technology Development Agency). She came toSDSU as a visiting scientist in 2012. She has been employed as an imaging engineer I forthe Image Processing Lab since 2015. She has various research interests in utilizing PICSas a calibration source, developing algorithm to improve satellite trending analysis. She receivedher MS degree in spatial information system in engineering, Chulalongkorn University,Thailand, and her BS degree in land information (surveying), Royal Melbourne Institute ofTechnology, Australia.
Angal et al.: Assessing the calibration differences in the reflective solar bands. . .
Journal of Applied Remote Sensing 044002-16 Oct–Dec 2018 • Vol. 12(4)
Downloaded From: https://www.spiedigitallibrary.org/journals/Journal-of-Applied-Remote-Sensing on 08 Jul 2019Terms of Use: https://www.spiedigitallibrary.org/terms-of-use