Embed Size (px)
Citation preview
1616 P St. NW Washington, DC 20036 202-328-5000 www.rff.org
October 2014 RFF DP 14-36
Assessing the Design of Three Pilot Programs for Carbon Trading in China
Clayt on Munni ngs , R ichar d Mor genste rn ,
Zhongmin W ang, and Xu L iu
DIS
CU
SS
ION
PA
PE
R
© 2014 Resources for the Future. All rights reserved. No portion of this paper may be reproduced without
permission of the authors.
Discussion papers are research materials circulated by their authors for purposes of information and discussion.
They have not necessarily undergone formal peer review.
Assessing the Design of Three Pilot Programs for
Carbon Trading in China
Clayton Munnings, Richard Morgenstern, Zhongmin Wang, and Xu Liu
Abstract
China started seven carbon cap-and-trade pilot programs in order to inform the development of a
future national cap-and-trade market. This paper assesses the design of three of the longer-running cap-
and-trade pilot programs in Guangdong, Shanghai and Shenzhen. Based on extensive stakeholder
interviews and a detailed literature review we formulate a series of recommendations to improve the
design of these three pilots, including: strengthening the legal foundations for the cap-and-trade pilots,
incorporating achievement of goals established by the cap-and-trade pilots into the performance reviews
of participating government officials and executives of state-owned entities, further clarifying the cap-
setting process, increasing the transparency of the cap, reducing or eliminating within-compliance period
adjustments to enterprise-level allowance allocation, gradually moving away from free allocation toward
auctioning, reforming enforcement policy, and adopting a symmetric safety valve to manage prices. By
making these recommendations, we hope to shed light on ways that Chinese regulators might adapt cap
and trade, a fundamentally market-based tool, to China's economy that has many non-market features.
Key Words: emissions trading, carbon, China
JEL Classification Numbers: Q48, Q54, Q58
Contents
I. Introduction ......................................................................................................................... 1
II. Literature Review .............................................................................................................. 4
A. Ex-Ante Quantitative Analysis ...................................................................................... 4
B. Qualitative Analysis before Pilot Designs Were Known ............................................... 6
C. Qualitative Analysis of Pilots after Designs Were Known ............................................ 7
III. Pricing Carbon in China Brings New Challenges ......................................................... 8
A. Rapid Economic Growth ................................................................................................ 9
B. Heavily Regulated Electricity Sector ............................................................................. 9
C. Prominence of Energy Intensive and Trade-Exposed Industries ................................. 10
D. State-Owned Enterprises .............................................................................................. 10
E. Complementary Policies ............................................................................................... 11
F. Legal Status of Cap and Trade...................................................................................... 12
G. Administrative Status of Cap and Trade ...................................................................... 13
H. Monitoring, Reporting, and Verifying Carbon Emissions ........................................... 14
IV. Defining Success in China’s Carbon Trading Pilots ................................................... 14
V. Pilot C&T Systems in Guangdong, Shanghai, and Shenzhen ...................................... 15
A. Incentives for Compliance ........................................................................................... 15
B. Cap Setting ................................................................................................................... 16
C. Emissions Coverage ..................................................................................................... 18
D. Allowance Allocation .................................................................................................. 20
E. Provisions for Exits and Entrants ................................................................................. 27
F. Price Management Provisions ...................................................................................... 28
G. Provisions for Carbon Offsets ...................................................................................... 29
H. Provisions that Address Market Power ........................................................................ 29
I. Provisions that Address Linking.................................................................................... 29
VI. Progress Achieved by the Pilots .................................................................................... 29
VII. Discussion of Design Challenges Surrounding the Pilots .......................................... 32

A. Legal and Administrative Status of C&T .................................................................... 32
B. Cap Setting ................................................................................................................... 33
C. Determining the Duration of the Cap ........................................................................... 34
D. Treatment of Direct and Indirect Emissions ................................................................ 35
E. Free Allocation of Allowances ..................................................................................... 36
F. Allowance Allocation Formulas ................................................................................... 38
G. Non-Compliance Penalties ........................................................................................... 38
H. Opt-in and Voluntary Entities ...................................................................................... 38
I. Price Management Provisions ....................................................................................... 38
J. Provisions to Prevent Market Power ............................................................................. 39
K. Improving Liquidity ..................................................................................................... 39
L. Facilitating Formal Linkage ......................................................................................... 39
VIII. Future Research .......................................................................................................... 40
A. Ex-Ante Assessments ................................................................................................... 40
B. Ex-Post Assessments .................................................................................................... 42
IX. Conclusion ....................................................................................................................... 43
References .............................................................................................................................. 44
Resources for the Future Munnings et al.
1
Assessing the Design of Three Pilot Programs for
Carbon Trading in China
Clayton Munnings, Richard Morgenstern, Zhongmin Wang, and Xu Liu
I. Introduction
China’s explosive economic growth in recent decades has generated high levels of carbon
dioxide (CO2) emissions and local pollution, directly affecting human health. Since 2007, China
has ranked as the world’s largest CO2 emitter, and its air, water, and soil have become polluted to
alarming degrees. In response to these environmental issues, China is attempting to reign in its
rampant CO2 emissions growth with a variety of policies, including one promising but
challenging approach: cap and trade.
China’s State Council first announced plans to establish a cap-and-trade (C&T) system in
October 2010, before listing carbon trading as a central part of the country’s energy and climate
policy in its twelfth Five-Year Plan, which covers the period from 2011 to 2015 (Zhang et al.
2014).1 Following the State Council’s decision in November 2011 to “gradually promote the
establishment of a carbon emissions trading market” (State Council 2011), China’s central
planning agency, the National Development and Reform Commission (NDRC), selected five
cities (Beijing, Chongqing, Shanghai, Shenzhen, and Tianjin) as well as two provinces
(Guangdong and Hubei) to develop pilot C&T systems. Regulators authorized these pilots in an
effort to accumulate experience and inform the design of a national cap-and-trade system, slated
to come online between 2016 and 2020.
To date, all pilots have started operation. Table 1 summarizes the key features of each
pilot. Taken together, the pilots substantially expand the portion of global emissions covered by
carbon markets, bringing global coverage from less than 8 percent to more than 11 percent of the
Clayton Munnings is a research associate at Resources for the Future in Washington DC and can be reached at
[email protected] or 202-328-5177. Richard Morgenstern is a senior fellow, Zhongmin Wang is a fellow, and Xu
Liu is a research assistant at Resources for the Future in Washington, DC. We thank Energy Foundation China’s
Low-Carbon Development Program for supporting this research andDallas Burtraw, Lucas Bifera, Jeremy
Schreifels and Liu Shuang for their insights and comments on this research. All remaining errors are the
responsibility of the author.
1 The State Council is the chief administrative authority of China. It is chaired by the premier and includes the heads
of each governmental department and agency.

Resources for the Future Munnings et al.
2
world’s total carbon emissions (Zetterberg et al. 2014). Moreover, current allowance prices in
some pilots—Beijing and Guangdong, for example—are comparable or greater than those in
other markets.
Table 1. Key Features of China’s Cap-and-Trade Pilots
Pilot Start date
Emissions coverage
(million metric tons)a
Covered entitiesb
Allowance price
(USD, current)c
Beijing Nov 2013 50 ~490 9.28
Chongqing Jun 2014 125 242 4.92
Guangdong Dec 2013 408 211 9.31
Hubei Apr 2014 324 138 3.76
Shanghai Nov 2013 160 ~200 7.68
Shenzhen Jun 2013 33 ~635 8.96
Tianjin Dec 2013 160 197 3.79 a World Bank (2014); Chen and Reklev (2014) for Chongqing
b ICAP (2014); Zhang et al. (2014); Guangdong DRC (2014 b, c).
c Tanpaifang.com as of 30 July 2014
Given these accomplishments, it seems China is making strides in moving toward a more
market-oriented approach to mitigating carbon and building a foundation for a national program.
But progress in the pilots need to be interpreted within a Chinese context. Designs in the pilots
deviate from other C&T systems in important ways. In some instances, such deviations represent
a reasonable tailoring of a fundamentally market-based policy to a socialist market economy. In
other instances, deviations may adversely affect the performance of the system. Ultimately, an
accurate assessment of pilot design requires a thorough understanding of the unique challenges
China faces in pricing carbon.
In this paper, we assess the designs of three longer-running carbon trading pilots in
Guangdong, Shanghai, and Shenzhen, which arguably have the best chance at being replicated in
a possible national Chinese C&T system. Our present analysis contributes to the preexisting
literature in three distinct ways. In conducting an in-depth analysis of the three pilots, we draw
comparisons between the carbon dioxide pilots and the sulfur dioxide pilots conducted in China a
decade earlier. Further, we examine the similarities and differences between the Chinese pilots
and the subnational C&T systems in North America. Finally, we discuss and analyze several
design options related to the pilots: the legal foundations of carbon trading in China, cap setting
and updating, treatment of the electricity sector, allowance allocation, noncompliance penalties,
provisions for entrants and exits, provisions to prevent market power, and policies that promote
liquidity.
Resources for the Future Munnings et al.
3
In reviewing the C&T systems in Guangdong, Shanghai, and Shenzhen, we translated
and synthesized more than 50 publicly available documents originating from the State Council,
regional branches of the NDRC, local governments, and carbon trading exchanges. This
synthesis allowed us to understand the subtleties of each pilot’s design and served as a
foundation for meaningful suggestions for improving pilot design.
We then conducted extensive interviews with policymakers directly involved in pilot
design and experts familiar with the pilots. Many of these interviews took place in November
2013 and January 2014, when delegations of Chinese pilot policymakers visited Washington,
DC. Many others were conducted in March 2014, when three of the authors traveled to Beijing,
Shanghai, and Shenzhen to meet Chinese academics, policymakers, and experts involved in the
pilots. These interviews helped us understand the motivations for the pilot design features, some
of which deviate dramatically from other C&T systems.
Our main recommendations are as follows:
1. Strengthen the legal foundation for the C&T pilots.
2. Incorporate achievement of goals established by the pilot C&T systems in the
individual performance reviews of participating government officials and the
executives of participating state-owned entities (SOEs).
3. Further clarify the cap-setting process.
4. Increase transparency of the cap by publicizing business-as-usual emissions and the
emissions impact of complementary policies.
5. Reduce or eliminate adjustments in enterprise-level allowance allocations that occur
within a given compliance period, especially those that alter market-level allocations.
6. Develop a long-term strategy to move away from free allocation outside of the
electricity sector.
7. Improve monitoring of three variables in the electricity sector: electricity
consumption, grid emission factors, and the quantity of imported electricity and its
emissions factor. This will prevent overallocation and emissions leakage that result
from covering both direct and indirect emitters.
8. Reform enforcement policy so that regulated firms are fined on a per-ton basis instead
of per violation, with the fine being equal to a multiple of the average market price of
allowances for each ton of excess emissions.

Resources for the Future Munnings et al.
4
9. Adopt a symmetric safety valve to manage extreme price fluctuation.
The remainder of the paper is organized in the following manner. Section II presents a
literature review. Section III elaborates the unique challenges China faces in its efforts to price
carbon, which serves as a prerequisite for discussion and analysis of pilot designs. Section IV
considers alternative definitions of success for carbon pricing in China. Section V presents the
detailed designs of the three pilots we consider, while section VI provides an update on progress
achieved by the pilots, including recent price, transaction volume, and compliance data. Section
VII analyzes pilot designs and discusses options for improving them. Section VIII highlights
important and unanswered research questions. Section IX concludes.
II. Literature Review
This section reviews the literature that analyzes C&T systems in China, at both the
national and pilot levels. This literature broadly falls into three categories, which we elaborate on
below: (1) ex-ante quantitative analysis of carbon trading in China at the pilot and national
levels; (2) recommendations for carbon trading in China based off qualitative analysis before
pilot designs were well known; and, (3) analysis of actual pilot designs. We review these three
strands of literature in order below.2
A. Ex-Ante Quantitative Analysis
Studies that conducted ex-ante quantitative analysis of carbon trading in China generally
use computable general equilibrium models. In general, this strand of literature tends to focus on
the implications of establishing formal links between different hypothetical markets and
choosing different types of allowance allocation strategies, as opposed to directing efforts at
estimating precise overall macroeconomic costs. At least one exception, Hubler et al. (2014),
estimates the impacts of a national C&T system that achieves a 45 percent reduction in carbon
intensity by 2020 and covers 75 percent of the economy. The authors find a 1 percent decrease in
2 An additional strand of literature informs our study. This strand focuses on analyzing the sulfur dioxide trading
pilots implemented across China over the last decade. Papers in this strand focus on individual sulfur dioxide pilots
in Taiyuan (Morgenstern et al. 2004, 2006) and Jiangsu (Zhang et al. 2013); they suggest designs for a national
sulfur dioxide program (Jarvis and Xu 2006; Morgenstern et al. 2011); and more broadly, they review the collective
efforts to reduce sulfur dioxide through emissions trading in China (Chang and Wang 2010; Schreifels et al. 2012;
Hart and Ma 2014).
Resources for the Future Munnings et al.
5
economic welfare for 2020, as well as moderate impacts on the output of most sectors, with
greater impacts for the electricity and aluminum industries.
Three studies model formal links between different hypothetical carbon C&T systems.
First, Hubler et al. (2014) model a formal link between the European Union Emissions Trading
System (EU ETS) and a Chinese C&T system, estimating that a 300 million ton per year transfer
of allowances would bring small gains in GDP to China. The authors warn that the presence of
ambiguous terms-of-trade effects means that, theoretically, formal linking may slightly decrease
welfare. Next, Dai and Masui (2012) split a national C&T system into two geographic regions,
Jiangxi Province and the rest of China, and then estimate the impact of achieving a 45 percent
reduction in carbon intensity by 2020 with and without formal linkage between the regions. The
authors find that formal linkage would cut estimated GDP losses for Jiangxi Province by two-
thirds compared to a non-linked scenario. Finally, Liu et al. (2013) models a formal link between
the Guangdong and Hubei pilots, finding that linkage results in higher overall GDP and lower
overall emissions compared to a non-linked scenario. The authors argue that general equilibrium
considerations, especially terms-of-trade and tax interaction effects, importantly determine
economic and emissions outcomes. Taken together, these three studies emphasize the importance
of studying formal links with a general equilibrium approach and find modest benefits from
formal linkage.
Three other studies investigate the impact of different allowance allocation strategies on
the performance of a national C&T system for CO2 emissions. First, Tang and Wu (2013)
compare a mandatory emissions reduction target and a C&T system. The authors find that
establishing a C&T system improves economic efficiency and argue that permit allocation can be
adjusted to achieve inter-regional equity. Next, Yuan et al. (2012) model a national C&T system
with a small auction but mostly free allocation. The authors model two scenarios that achieve the
same level of emissions reduction. In one scenario, emissions intensity decreases proportionally
across each industry. In the other, emissions intensity decreases proportionally across each
region. Yuan et al. estimate that the first scenario results in substantial distributional impacts
across regions, while the second scenario avoids such impacts. Finally, Cong and Wei (2010)
construct an agent-based model and then estimate the impacts of a national C&T system
covering the power sector. The authors find that such a system increases the average electricity
price by 12 percent and that emissions-based allocation produces higher electricity and carbon
prices relative to an output-based emissions allocation scheme. Taken together, these three
studies illustrate the importance that scholars place on balancing the efficiency and equity
implications of allowance allocation choices.
Resources for the Future Munnings et al.
6
B. Qualitative Analysis before Pilot Designs Were Known
A second strand of literature makes recommendations for carbon trading in China on the
basis of qualitative analyses carried out before specific pilot designs were well known. In
general, these studies identify and describe barriers to using a market-based approach to mitigate
carbon in China, which has been described as a “socialist market economy” (Lo 2013). The
authors rely on economic theory and international experience, mostly from the EU ETS and
Australia’s carbon-pricing mechanism, to form recommendations for C&T design. Two main
categories of analysis exist in this strand of literature: studies that recommend designs for a C&T
system covering the electricity sector and those that recommend designs for a C&T system with
broader coverage.
Two major studies discuss a hypothetical C&T system for China’s electricity sector.
Jotzo (2013) first argues that electricity prices in China are largely fixed and likely will not
increase to reflect a carbon price. Given this context, the author then recommends pricing of
direct emissions, which result from electricity production, and indirect emissions, which result
from electricity consumption, and finally outlines a number of strategies to achieve this
recommendation. Baron et al. (2012) conduct economic analysis and draw off experiences from
the EU ETS and Australia’s carbon-pricing mechanism. The authors recommend that Chinese
regulators allow for a limited electricity price increase for generators that participate in carbon
trading. Further, based on an observation that a large number of small and inefficient coal plants
still operate in China, the authors recommend a complex but deliberate allowance allocation
strategy for the electricity sector. Under this strategy, the authors recommend that smaller plants
receive free allocations while new plants receive a number of free allowances well below their
likely emissions levels. According to the authors, such an arrangement would prompt smaller
plants to sell allowances to new plants and consequentially reduce emissions from small and
inefficient plants. Taken together, Jotzo (2013) and Baron et al. (2012) represent a first attempt at
reconciling China’s highly regulated electricity market with the use of a market-based
mechanism for controlling carbon pollution.
Several other studies make recommendations for a carbon-trading program in China that
covers a broader range of sectors. Cheng and Zhang (2011) and Li et al. (2012) endorse an
intensity-based cap rather than an absolute cap—although for slightly different reasons. The
former authors cite China’s low per capita GDP as a reason to support an intensity-based cap,
while the latter argue an intensity-based cap is better for GDP growth. Qi and Wang (2013)
contribute to the literature by carefully describing the sheer size of state-owned entities relative
Resources for the Future Munnings et al.
7
to competitive entities and emphasizing the potential for SOEs to exercise market power over
carbon markets in which they participate.
Two areas of consensus emerged in our review of this second strand of literature. First,
authors generally endorse the idea of starting off with more free allocation and gradually moving
toward more auctioning. Second, authors largely agree that China’s allowance price should be
controlled. The precise mechanism, though, is a subject of disagreement. Drawing off experience
from the EU ETS and Australia’s carbon-pricing mechanism, Jotzo (2013) recommends a range
of options, including price collars, variable permit supplies, or a fixed price that is later allowed
to float. In contrast, Qi and Wang (2013) recommend that the government act as a bank, buying
and selling allowances from polluters.
C. Qualitative Analysis of Pilots after Designs Were Known
A third strand of literature analyzes actual pilot design, with studies generally considering
either all pilots or one or two in particular. Research that falls into the former category either
uses a political economy lens or focuses more narrowly on describing common pilot designs
before making recommendations. Studies that fall into the latter category typically focus on the
design of the Guangdong, Shanghai, or Shenzhen pilot, with a handful of studies conducting
initial quantitative analysis.
Three studies analyze the pilots as a whole through a political economy lens. Lo (2013)
investigates the political economy of China’s decision to pursue carbon trading, arguing that the
outcome of these efforts will allow scholars to see whether a liberal market is necessary to
produce environmental benefits through carbon trading. Lo and Howes (2014) highlight the role
of China’s “socialist market economy” by questioning whether the pilots should truly be
considered market based, given a high degree of government involvement. And Kong and
Freeman (2013) conduct a series of interviews with Chinese stakeholders to identify three
weaknesses in pilot design: an inability for environmental goals to trump local economic goals;
incomparability that originates from a lack of consistent practices for monitoring, regulating, and
verifying carbon emissions; and incompatibility with important national institutions. These
weaknesses lead the authors to conclude that even a national C&T system “would be unlikely to
contribute more than other factors to carbon emissions reductions in China” (Kong and Freeman
2013, 210).
An additional two studies analyze the pilots as a whole from a market design perspective.
Zhang et al. (2014) provide a high-level overview of the designs for all seven pilots and make
Resources for the Future Munnings et al.
8
numerous recommendations for transitioning from the pilots to a national program, including
strengthening national laws surrounding carbon trading and penalties for failure to comply with
environmental laws. Quemin and Wang (2014) also provide a high-level overview of pilot
designs and provide initial recommendations for establishing formal links between pilots.
Two studies focus specifically on Shenzhen. Jiang et al. (2014) briefly report on major
design features of the Shenzhen pilot. Importantly, the authors describe a complex game theory
approach for allocating allowances and present the actual outcomes of that game in terms of the
number of allowances local regulators allocated to certain industrial subsectors. Chai (2013)
provides an early quantitative assessment of the Shenzhen pilot. The author finds that the pilot
risks overallocation, stemming from its provisions for estimating emissions from purchased
electricity and adjusting allowance allocations. Taken together, these studies highlight a number
of features in Shenzhen that are unique designs relative to other C&T systems.
The remaining studies focus on Shanghai, Guangdong, or both. Wu et al. (2014) briefly
describe major design features of the Shanghai pilot, such as precise estimates of the portion of
Shanghai’s total emissions covered by the C&T system. RAP (2013) provides a comprehensive
list of direct feedback to the initial designs published by regulators in Shanghai and Guangdong.
The authors use examples from California and the Regional Greenhouse Gas Initiative to
highlight alternative designs. Zhang (2013) conducts an initial analysis of the pilots and predicts
the Guangdong pilot might have to reduce the most emissions from its business-as-usual
scenario.
Taken together, these studies address various issues that may arise when designing a
market-based mechanism in an economy that still harbors many non-market features. While the
political economy studies seem relatively pessimistic about the chances that carbon trading will
make a large impact, the more narrow studies that address the design of pilots generally outline
pragmatic next steps to achieving a degree of operational success.
III. Pricing Carbon in China Brings New Challenges
Distinctive aspects of China’s economic, regulatory, and legal structures—as well as
China’s capacity to measure, report, and verify carbon emissions—present difficult challenges
that pilot regulators must overcome by crafting design features that depart from those of other
C&T programs. Understanding whether these pilot policies represent deftly tailored designs—or,
instead, indicate design deficiencies—requires a solid understanding of China’s political
economy. We therefore introduce the main features of China’s political economy that are
Resources for the Future Munnings et al.
9
relevant to carbon trading. These include China’s rapid economic growth and heavily regulated
electricity sector; the prominence of energy intensive and trade exposed (EITE) industries;
interactions between state-owned entities and competitive firms; carbon trading’s status relative
to complementary policies; and efforts to measure, report, and verify carbon emissions.
A. Rapid Economic Growth
China’s total GDP has increased on average 10 percent annually since 1978 (NBSPRC
2014) This sustained economic growth has made China’s economy the second largest in the
world and lifted more than 500 million people out of poverty.3 Economic growth is anticipated to
continue, albeit at a slower rate, with China’s GDP growing nearly in 2013 and expected to grow
at a similar rate in 2014 (NBSPRC 2014). Carbon emissions are expected to increase
accordingly.
Other carbon pricing programs exist in countries with GDP and carbon emission growth
rates that are lower than in China. Thus, pilot regulators might need to consider new policies—
for example, for setting caps and formulating provisions for price management—that might be
more appropriate in the context of China’s high growth rates.
B. Heavily Regulated Electricity Sector
China accounts for nearly half of global coal consumption, with coal accounting for two-
thirds of China’s total energy consumption in 2012 (NBSPRC 2013; US EIA 2014b). Pilot
regulators therefore must regulate coal power plants, and more generally the electricity sector, to
substantially reduce carbon emissions.
But the government heavily regulates both the price and dispatch of electricity in China.
As a result, pilot regulators cannot necessarily rely on the electricity market to communicate the
carbon price onto electricity consumers, as the electricity market automatically does in some
C&T programs. The government’s control of the electricity market therefore complicates pilot
regulators’ efforts to cover electricity generators and promote reductions in electricity demand.
3 http://www.worldbank.org/en/country/china/overview (accessed on 16 May 2014).
Resources for the Future Munnings et al.
10
C. Prominence of Energy Intensive and Trade-Exposed Industries
China produces more steel, cement, and aluminum than any other country. Moreover,
these three EITE industries constitute a large portion of China’s total energy consumption. While
bringing these industries under a cap might help China meet its economic restructuring
objectives, the economic and trade consequences of such action could be significant (Lo and
Wang 2013).
If pilot regulators include such industries under the cap, they may choose to carefully
craft allowance allocations that protect EITE industries’ overall competitiveness while
maintaining incentives to reduce emissions. While other C&T systems face similar issues, the
prominence of EITE industries in China’s overall economy may place particular pressure on
pilot regulators to not adversely impact production.4
D. State-Owned Enterprises
The Chinese carbon-trading pilots represent perhaps the first large-scale attempt to
include SOEs and private enterprises under a C&T system. Yet SOEs in China are fundamentally
different than private enterprises in many ways, and this mismatch complicates program design.
SOEs are typically very large compared to private firms. For example, ten SOEs own
nearly 60 percent of electricity generation assets, and two SOEs own virtually all electricity
distribution infrastructure (Baron et al. 2012). In addition, SOEs’ goals are not simply to pursue
profit maximization. Government mandates in the electricity sector, for example, require SOEs
to secure electricity supply for sustained and equitable economic and social development and to
remain financially sustainable (Baron et al. 2012). And unlike private firms, the government, not
the market, judges the performance of SOEs in fulfilling these mandates. For example,
governments appoint key SOE personnel and conduct performance assessments that determine
whether such SOE employees receive a promotion or demotion (Lo 2012; Qi and Wang 2013).
Another difference is that SOEs have better access to financing and advanced
technologies relative to private enterprises—which may effectively allow them to abate pollution
at comparatively lower costs (Qi and Wang 2013).
4 To the extent that regulators want to reduce reliance on EITE industries in general, or at least to move production
of such industries out of the eastern part of the country as a means of improving local air or water quality, adverse
impacts on these industries might not be an issue.
Resources for the Future Munnings et al.
11
Given these differences, pilot regulators face an interesting decision of whether to place
SOEs and private firms in the same carbon market and, if so, whether to treat them differently. If
pilot regulators choose to cover the branches of an SOE within their jurisdiction, it is still unclear
that they have the regulatory authority to punish SOEs for not complying with carbon trading
rules. Traditionally, a national commission authorized by the State Council holds these rights (Qi
and Wang 2013). Therefore, pilot regulators must work to reconcile any discrepancies and
ensure that they have the right to punish SOEs under their program.
A second issue is that large SOEs may be able to exercise considerable market power
over the carbon market—given their comparatively larger size, emissions, and (presumably)
allowance allocations (Qi and Wang 2013). If pilot regulators do choose to include SOEs and
private firms in the same market, a wide range of options exist for addressing market power in
emissions trading markets. For example, California’s Assembly Bill 32 program uses both
auction purchase and holding limits in an attempt to control market power (Schatzki and Stavins
2013). Moreover, a vein of academic literature employs economic theory to describe the origins
and behaviors of firms that use market power in emissions trading programs (Hahn 1984;
Malueg and Yates 2009; Montero 2009).
E. Complementary Policies
China employs a large number of non-trading policies to reduce carbon emissions that
may interact with a cap-and-trade program in complex ways. These policies include nationwide
and provincial goals to reduce conventional air pollutants, carbon intensity, energy intensity, and
coal consumption (MEP 2013; State Council 2013; Zhang 2014; Zhang et al. 2014). In addition,
more than 10,000 enterprises in China now face energy conservation targets imposed by the
national government (Lo and Wang 2013).
Such complementary policies have at least two impacts on C&T pilot programs. At the
firm level, a facility under a carbon-trading program may forego an opportunity to buy an
allowance because an additional ton of carbon emissions would put that facility out of
compliance with an energy conservation goal. At the market level, complementary policies that
reduce emissions at the same sources covered by the cap can lower demand for allowances and
therefore lower allowance prices. If, in aggregate, the complementary measures already achieve
the reductions that the cap intends to achieve, then the overall carbon market will be nonbinding
and allowance prices will drop to zero (Schatzki and Stavins 2012). Pilot regulators therefore
face a difficult but important task of ensuring that a cap binds in the presence of complementary
policies.
Resources for the Future Munnings et al.
12
In China, a C&T system must also generally compete with complementary policies in a
legal setting because complementary policies generally enjoy higher legal and administrative
status than C&T—issues we address more fully in subsequent sections below. Thus, in effect,
complementary policies can make the prospects of compliance with C&T less likely. Such
competition might occur if compliance with a C&T system would jeopardize compliance with a
complementary policy that carries stronger penalties for noncompliance.
F. Legal Status of Cap and Trade
Environmental law in China is hierarchal, with national laws superseding local laws in
most cases. The National People’s Congress holds the highest authority, followed by the State
Council and, finally, local laws and regulations promulgated by provincial legislatures and
governments (Deng 2012). While the State Council broadly authorized the C&T pilots, local
laws and regulations—the lowest level of Chinese law—underpin the entirety of each program’s
goals and design.
As a result, no national law has yet to explicitly enshrine goals relating to C&T for
carbon. The highest legal body that has explicitly addressed carbon is the State Council, which
broadly authorized the concept of C&T but did not enshrine any goals—for example, that pilots
must cap carbon emissions at a certain level of tons. The explicit mention of pilot C&T goals by
the State Council or National People’s Congress would likely make the pilots more politically
binding.5 Until then, the pilot regulators must operate largely in a politically uncertain
environment.
A related complication is that preexisting laws with greater legal strength may prevent
pilot regulators from creating well-designed C&T systems. This interaction is most easily
observed in the case of noncompliance penalties. China’s Environmental Protection Law,
enacted by the National People’s Congress, only authorizes a one-time fee for noncompliance
with environmental laws (NPC 1989). China’s Prevention and Control of Atmospheric Pollution
Law seems to limit the amount of any fee to RMB¥100,000 or roughly USD$16,000 (NPC
2000). Compared to the more common practice of penalizing non-compliance without limit and
on a per ton basis, the non-compliance penalties enshrined in these laws seem far too lax to
5 Schreifels et al. (2012) observe that the explicit inclusion of sulfur dioxide reduction goals in China’s 11
th Five-
Year Plan and remarks on the topic by China’s president marked two watershed moments in the effort to reduce
sulfur dioxide in China.
Resources for the Future Munnings et al.
13
ensure significant compliance within a carbon trading system—a conclusion also reached by
Hart and Ma (2014). Although no current national laws in China explicitly mention carbon, let
alone explicitly discuss fees for non-compliance with carbon rules, it seems that many scholars
generally interpret the maximum levels for non-compliance fees in the Environmental Protection
Law and the Prevention and Control of Atmospheric Pollution Law as applicable to carbon (Hart
and Ma 2014; Zhang et al. 2014). Pilot regulators therefore do not seem to have the legal
authority to impose strong non-compliance fees.
Two exceptions may grant pilots stronger legal authority to ensure compliance. First, the
National People’s Congress has recently adopted amendments to China’s Environmental
Protection Law that seemingly would allow a higher level of fee to be levied more than once on
enterprises not complying with environmental regulations (NPC 2014).6 These amendments take
effect in early 2015 and may prove valuable if pilot regulators can successfully convince
companies that the amended rules for penalties implicitly apply to carbon. Second, some local
jurisdictions have the authority to overrule aspects of national environmental law. Shenzhen has
this authority because it is a special economic zone. As a result, pilot regulators in that city may
have the authority to pass a local law that supersedes and improves the current shortcoming in
the relevant national laws.
G. Administrative Status of Cap and Trade
The administrative status of C&T in China is uncertain, for at least two reasons. First,
C&T’s success does not explicitly impact the careers of government officials and executives at
SOEs. By contrast, the failure of officials to achieve carbon or energy intensity targets can
impact whether that cadre of officials receives a promotion or demotion (NDRC 2014; Zhang et
al. 2014). Similarly, under the sulfur dioxide trading pilots, the NDRC and Ministry of
Environmental Protection (MEP) pegged the achievement of goals to the performance reviews of
SOE executives—a policy that improved the level of reductions (Schreifels et al. 2012). Pilot
regulators must therefore create a way to ensure that governments and SOEs comply with the
C&T systems.
A second problem is misalignment between the NDRC and Ministry of Environmental
Protection (MEP). The MEP typically has the authority to impose environmental fines in China.
6 A proposed amendment to the Prevention and Control of Atmospheric Pollution may make similar amendments
(State Council 2014; Zhang 2014).
Resources for the Future Munnings et al.
14
Yet the MEP is essentially absent from carbon pilot development. Instead, the NDRC leads pilot
development. Whether the agency can collect noncompliance fees and other fines associated
with the C&T program is an open question (Chang and Wang 2010).
H. Monitoring, Reporting, and Verifying Carbon Emissions
Each pilot is pursuing its own protocols for measuring, reporting, and verifying carbon
emissions, and this heterogeneity will likely prevent the accurate comparison of emissions levels
between pilot regions (Kong and Freeman 2013).
In addition, each protocol suffers from issues with data quality and quantity. For
example, bottom-up and top-down calculations of emissions are not always equal in the pilots,
and pilots lack complete historical emissions data (Liu and Nan 2012; Wang 2013a). Some of the
contributing factors for poor data quality in China are small penalties for obstruction of
inspection and falsification of data (Wang 2013), as well as vague and ineffective rules to fight
“statistical corruption” (Liu and Yang 2009). Beyond national level emissions data, regulators at
local levels have not collected data at the facility level for very long.
Designing pilots that are effective even in a sparse data environment is a challenge that
especially complicates cap setting and allowance allocation—two key pillars of any C&T
system.
IV. Defining Success in China’s Carbon Trading Pilots
Experts suggest that the success or failure of the pilots “will to a large extent determine
the future of carbon markets development in China” (Han et al. 2012, 34). Yet, given the
numerous barriers China’s political economy imposes on pilot regulators, the introduction of
pilot C&T systems that substantially reduce emissions will take time and should therefore be
viewed as a long-term effort. Along the way, though, shorter-term definitions of success may
help measure progress and inform the formulation of China’s national carbon market.
For example, in the short run, success might be defined as the mere introduction of a
carbon price. A successful carbon price might impact investment or innovation before
substantially reducing carbon emissions, providing potential markers of progress. Short-run
success might also be defined as the emergence of a carbon market, where participants
understand the rules and seek out trading opportunities at healthy volumes and prices.
From an even more pragmatic view, success might be defined as the improvement of
processes that measure, report, and verify carbon emissions. Currently, many enterprises lack the
Resources for the Future Munnings et al.
15
capacity to complete each of these steps. So by improving the quality and quantity of China’s
carbon emissions data, the pilots can contribute significantly to the success of future carbon
trading and climate policy in general.
Another important version of success might be for regulators to place heavier reliance on
carbon trading to reduce emissions. Currently, it seems that complementary measures may
achieve many, if not all, carbon reductions required by the pilot programs—although this
question has not been formally and extensively studied in any of the three regions we consider.
Moreover, a greater shift toward trading would likely bring improvements in the cost-
effectiveness of total reductions.
V. Pilot C&T Systems in Guangdong, Shanghai, and Shenzhen
In this section, we describe the design of three longer-running C&T pilots that we believe
are most likely to serve as models for a national program: Guangdong, Shanghai, and Shenzhen.
While the three pilots share some design features, they differ in important ways. They have
distinct incentives for compliance and strategies for cap setting and allowance allocation, for
example. They also cover different sectors, offer a range of provisions for entrants and exits, and
manage allowance price differently. In the sections that follow, we discuss each of these
differences, and we summarize our discussion in Table 2. Our observations are based on our
translation and synthesis of more than 50 publicly available documents that outline each pilot’s
design. We also draw on more than a dozen interviews with policymakers directly involved in
pilot design and experts who analyze the pilots.
A. Incentives for Compliance
Each pilot has its own strategies that attempt to enforce compliance under China’s weak
legal and administrative structure for carbon trading.
In Guangdong, regulators have designed a noncompliance penalty that fines a firm three
times the average allowance price for any positive difference between its carbon emissions and
retired allowances (Guangdong Government 2013). Guangdong regulators have included two
additional strategies to bolster the odds of compliance. First, regulators try to reward compliance
(in addition to punishing noncompliance) by granting priority for national low-carbon
development funding to firms in compliance with the carbon market. Second, regulators intend
to periodically publicize the compliance status of firms to create social pressure for compliance
(Guangdong Government 2014).
Resources for the Future Munnings et al.
16
In Shanghai, if a firm fails to retire sufficient allowances by the deadline, it faces a
penalty between ¥50,000 and ¥100,000 (Shanghai Government 2013a). For serious violations—
where a firm fails to rectify mistakes in monitoring emissions, verifying emissions, and
surrendering allowances within specified deadlines—Shanghai regulators may impose several
sanctions. First, they may record unlawful acts into the credit records of the firm, including those
of the individuals chiefly in charge. They also may publish unlawful acts on a government
website or through the media. More drastically, they may cancel that firm’s ability to access
special funds for energy conservation and emissions reductions for two years (Shanghai
Government 2013a).
In Shenzhen, a firm that fails to retire sufficient allowances must pay a noncompliance
fee equal to three times the average market price of allowances over the prior six months and
then make up the deficit through allowance purchases or forfeitures within a specified time. If
the firm fails again, the competent department can deduct its current year and then future years’
allowances from their registered account (Shenzhen Congress 2012; Shenzhen Exchange 2013;
Shenzhen Government 2014). Shenzhen’s situation, however, is quite different than
Guangdong’s or even Shanghai’s because the city is part of a special economic zone. Given this
designation, as mentioned previously, Shenzhen’s Congress can supersede some aspects of
national law, including the national limit on fees for environmental noncompliance. Because
Shenzhen’s Congress authorized its noncompliance penalty, the limit on the noncompliance fee
can (and does, by a large margin) exceed ¥100,000.
B. Cap Setting
To the extent that relatively high levels of GDP growth means greater uncertainty of
future GDP levels, China’s economic growth makes the choice of whether to choose an absolute
cap (denoted in tons of CO2) or an intensity cap (denoted in terms of CO2 per unit of GDP)
especially important. Under an absolute cap, uncertainty in GDP translates into uncertainty in
emissions intensity. Under an intensity cap, uncertainty in GDP translates into uncertainty
regarding overall emissions. If GDP ends up higher than expected, an absolute cap will involve
more abatement and therefore higher costs. The opposite is true if GDP ends up lower than
expected; in this case, an intensity cap requires less abatement and lower costs (Ellerman and
Sue Wing 2003). The ranking of absolute versus intensity caps varies by region and strongly
depends on the correlation between carbon emissions with GDP (Newell and Pizer 2008). Pilot
regulators must therefore weigh their preferences for certainty in emissions and costs when
choosing between an absolute and intensity cap.
Resources for the Future Munnings et al.
17
Each of the pilots seems to strategically link its cap to regional carbon-intensity goals,
which has more legal power and stronger enforceability than a separate C&T cap would (Liu and
Nan 2012). While possibly a clever political and legal strategy, such an arrangement complicates
cap setting. Specifically, pilots tend to self-impose a constraint that their systems must help
achieve a carbon intensity target, denoted in tons of carbon per unit of GDP. Choosing an
intensity-based cap represents the most straightforward way to address regulators’ need to
achieve a regional carbon-intensity target because the cap level could simply be set equal to the
regional carbon-intensity goal. Still, regulators might prefer an absolute cap for a variety of
reasons. Under an absolute cap, regulators must make an ex-ante projection of growth in GDP. If
their projections prove wrong, regulators must then adjust cap levels to achieve their regional
carbon-intensity targets. A pessimistic assumption—that is, if GDP turns out lower than
projected—forces regulators to take allowances out of the market to avoid breaching the regional
carbon-intensity goal, while an optimistic assumption leaves regulators with two choices: accept
over-compliance or issue additional allowances.
Each pilot addresses this self-imposed constraint differently by choosing unique designs
regarding the type of cap adopted, cap schedules and flexibility to adjust cap levels.
Guangdong regulators have announced a cap equal to 350 million tons for 2013 and set
aside an allowance reserve of roughly 17 million tons to correct an optimistic assumption on
growth in GDP if necessary (Guangdong DRC 2013c; Guangdong Government 2014).
Guangdong DRC increased the cap and the allowances reserve to 208 million tons and 38
million tons, respectively, for 2014 (Guangdong DRC 2014b).
In Shanghai, regulators have yet to announce an absolute cap. Instead, regulators have
initially allocated all allowances up front and at once for the 2013–2015 period. In other words,
each covered entity has received its allowance allocation for all three years and has allowances
with vintage years 2013, 2014, and 2015 (Shanghai Government 2012; Xinhua News Agency
2013).7 However, Shanghai regulators can issue additional allowances to certain covered
entities—or take them away—before the end of each compliance period, based on an individual
entity’s production compared to a benchmark (Shanghai DRC 2013a). If an entity produces
lower emissions than expected, allowances will presumably be taken away—and vice versa.
7 Regulators designed this unique approach as a way to promote price discovery through trading, in the absence of
future vintage-year allowance markets.
Resources for the Future Munnings et al.
18
While the sum of initially allocated allowances represents an absolute cap, if not a certain one,
the ability to adjust individual allowance allocations without limit has caused some observers to
describe the Shanghai cap as a hybrid (Schreifels 2014).
Shenzhen assigns carbon-intensity targets to individual covered entities and also issues an
overall cap on carbon intensity and absolute carbon emissions for the whole pilot period,
between 2013 and 2015. The absolute cap between 2013 and 2015 equals approximately 132
million tons, the sum of a 120 million allowance cap and a 12 million offset cap—corresponding
to an approximate cap of 44 million tons each year (Shenzhen Exchange 2013). Superimposed
on this cap are specific annual carbon-intensity targets, which equal 81.1 tons per ¥1 million,
75.4 tons per ¥1 million, and 70.7 tons per ¥1 million for 2013, 2014, and 2015 respectively
(Schreifels 2013). It is unclear whether both, one, or neither of the caps will be binding. In any
case, allowances are allocated up front and at once but can be adjusted upward, by no more than
10 percent, or downward, with no limit, in any one year.
C. Emissions Coverage
Compared to other C&T programs, each of the three pilots covers a high percentage of
total emissions. Also notably, each pilot covers important EITE industries. But aside from the
electricity sector, which is covered in all three pilots, emissions coverage and thresholds for
compliance vary substantially across programs.
The Guangdong pilot covers companies in the electricity, cement, steel, and
petrochemical industries that emitted more than 20,000 tons of carbon emissions (or had more
than 10,000 tons of coe energy consumption annually)—as well as companies in the commercial
sector (including hotels, restaurants, finance, business, and public institutions) emitting more
than 5,000 tons of carbon emissions annually (Guangdong DRC 2014b; Guangdong Government
2014). Taken together, the pilot currently covers 211 companies, mostly from the electricity,
cement, and petrochemical industries (Guangdong DRC 2014b). In the future, the pilot may
expand to cover industrial producers in the textile, non-ferrous metals, plastics, paper, and
ceramics sectors—although this expansion likely will not take place until after 2015 (Chen 2014;
Guangdong Government 2012a; Guangdong DRC 2014b). If and when these sectors join, the
pilot will include an estimated 827 industrial emitters, accounting for approximately 42 percent
of Guangdong’s carbon emissions (Jotzo 2013). In addition, there is some discussion of
expanding further to include the transportation sector.
Resources for the Future Munnings et al.
19
The Shanghai pilot currently covers the electricity, industrial, commercial, and
transportation sectors. Companies in the power and industrial sector that emitted more than
20,000 tons of carbon emissions in 2010 or 2011 are included, while companies in the
commercial and transportation sector that emitted more than 10,000 tons of carbon emissions in
2010 or 2011 are covered. Shanghai’s coverage of the industrial sector is quite comprehensive,
encompassing steel, petrochemical, chemical engineering, non-ferrous metals, building
materials, textile, paper, rubber, and chemical fiber. Transport through airlines, airports, and
ports also fall under the pilot’s coverage (Shanghai Government 2012). Taken together, the pilot
currently regulates 197 companies (Shanghai DRC 2012).
The Shenzhen pilot covers electricity, manufacturing, and water supply companies that
emit more than 3,000 tons of carbon emissions annually (Shenzhen Government 2014). The pilot
also covers certain large public buildings and state offices that exceed 100,000 square meters in
size (Shenzhen Government 2014). The comparatively low emissions thresholds were deemed
necessary in order to cover a substantial portion of Shenzhen’s carbon emissions, particularly
because Shenzhen has limited heavy industry. Regulators considered two aspects in determining
the initial list of industrial enterprises to be covered by the pilot: the company’s value added,
provided by the Municipal Bureau of Statistics, and the company’s energy consumption data.
These criteria resulted in an initial list of 635 companies and 197 large public buildings (ICAP
2014). The pilot may expand to cover more industrial companies, more large building buildings,
and bus and taxi companies (Shenzhen Exchange 2013).
Because the Chinese government heavily regulates both the price and dispatch of
electricity, the introduction of C&T to China’s electricity sector provides particularly unique
challenges. Elsewhere, C&T programs might require only electricity producers to retire
allowances for emissions, under the assumption that those producers will pass the cost of
allowances on to distributors and consumers in the form of higher electricity prices. RGGI in the
US Northeast relies on this approach, for example. Such an arrangement aligns the entire
economy under a single carbon price and therefore guarantees efficient abatement through
equalizing marginal costs, in theory. But this approach is not appropriate in the context of China.
The NDRC sets wholesale and retail electricity prices and adjusts them rather
infrequently (US EIA 2014a)—twice, in 2009 and 2011, in the last five years (NDRC 2009,
2011). Moreover, the price of coal, which is largely deregulated, has at times increased
dramatically. The interaction between these regulatory restrictions and market prices has at least
two implications for pilot designs. First, regulators would likely have to lobby the national
government to allow electricity prices to reflect costs associated with carbon prices or invent a
Resources for the Future Munnings et al.
20
way to communicate the carbon price to distributors and consumers. Failure to do so would risk
inefficient and unnecessarily costly abatement. It seems highly unlikely, however, that the
NDRC will allow electricity prices to reflect carbon costs, at least at this point in time. This is
true even in spite of recent policies established by the State Council that allow for electricity
producers to recoup a portion of their costs associated with increased coal prices under certain
scenarios (see Zhang 2014). Second, regulators will likely have to tailor pilot design to maintain
a reliable electricity supply while achieving emissions reductions because of a need to not repeat
historical power outages caused by high coal and low electricity prices (Baron et al. 2012).
The NDRC also regulates electricity dispatch in China, which can hamper the ability of
distributors to pass through carbon costs to consumers. Instead of basing dispatch on least cost,
local governments in China allocate roughly the same annual operation hours to each coal plant.
This strategy ignores a plant’s energy consumption and emissions factor, thereby unduly
favoring less efficient plants (Baron et al. 2012; Kahrl et al. 2011). Although some regions have
piloted “energy-efficient dispatch,” the resulting savings and likely emissions reductions seem
small, and substantial barriers hamper national adoption (Kahrl et al. 2013). Pilot regulators
again risk inefficient and unnecessarily costly abatement if generators cannot respond to carbon
prices. As is the case with essentially fixed electricity prices, regulators have a limited set of
options: lobby the NDRC to change its dispatch regulations or develop a mechanism that allows
distributors to react to carbon prices.
Facing these choices, each of the pilots requires that regulated entities retire an allowance
for emissions associated with electricity at both the points of production and consumption. In this
way, pilot regulators have developed a mechanism that communicates the carbon price to
consumers of electricity.
D. Allowance Allocation
Each pilot allocates virtually all allowances for free. In the case of the electricity sector,
this choice likely reflects a desire to keep electricity generators financially sustainable, given that
they cannot pass costs associated with carbon prices onto consumers. Similarly, freely allocating
allowances to the EITE sector might represent a preference to avoid disrupting production at
these sources. But pilots also allocate allowances freely to consumers of electricity, including
large buildings in some cases. This choice seems less justified than free allocation to the
electricity and EITE sectors because large buildings likely can pass costs through to consumers.
Resources for the Future Munnings et al.
21
In the cases of Guangdong and Shenzhen, a small fraction of allowances are auctioned
off rather than given away. Auctioning is a method of selling allowances to polluters. The main
consequence of switching from free allocation to an auction is to shift the burden of the carbon
market from consumers to producers. Neither approach is more efficient than the other—at least
in a competitive market. In such a context, the opportunity cost of a purchased allowance is the
same as one that is freely allocated.
While each pilot distributes all or nearly all allowances for free, the methods differ. These
distinct choices can have important distributional and efficiency consequences. Two main
methods exist for free allocation: grandfathering and output-based allocation. Under a
grandfathering approach, the regulator awards a regulated company allowance equal to a
historical benchmark, typically emissions levels or product output in some previous year. Such
an approach does not account for changes in a company’s output over time. Output-based
allocation, on the other hand, introduces an element of dynamism. In this case, a firm’s
allocation is updated over time to reflect a particular benchmark. For example, a firm’s output—
measured in industrial value-added or units of product—might be used to update the number of
allowances it receives. As is well known, however, firms that receive allowances based on
output-based allocations have an incentive to increase production and, correspondingly,
emissions.
i. Guangdong
Participants in Guangdong’s market will receive a substantial amount of free allocation
but are also required to purchase a small number of allowances at auction. For 2013, the
minimum ratio of freely allocated to auctioned permits for each firm is 97 to 3 (Guangdong DRC
2013c). This ratio is slated to increase to 90 to 10 in 2015 (Guangdong DRC 2013c). Auctions to
firms in the electricity sector raise more quickly, however. The minimum ratio of freely allocated
to auctioned permits for each firm in the electricity sector increased to 95 to 5 in 2014
(Guangdong DRC 2014b). Previously, auctions included a floor price of ¥60 per ton (Guangdong
DRC 2013c). However, regulators fixed the floor price for each quarterly auction at ¥25 per ton,
¥30 per ton, ¥35 per ton and ¥40 per ton, respectively (Guangdong DRC 2014b). Instead, the
Guangdong Development and Reform Commission (DRC) generally works in conjunction with
relevant governmental departments to set the reserve price, leaving the government discretion to
change future reserve prices (Guangdong Government 2014). The government plans to recycle
auction revenues to support low-carbon and energy-saving investments (Guangdong DRC
Resources for the Future Munnings et al.
22
2013a). It is expected that a significant portion of the auction revenue would go back to the
covered entities, with ongoing studies to identify exactly how this will occur (Chen 2014).
Each of the existing companies currently covered—including those from the electricity,
cement, steel, and petrochemical industries that exceed emissions thresholds—receives free
allowances for 2013 based upon a formula unique to their sector. For 2013, these formulas often
relied on a company’s historical average emissions or production from 2010 to 2012. For 2014,
these formulas relied on historical emissions or production from 2013. . Allowance are allocated
to this emissions or production data—as reported by that company—such that allocations are
tailored to firms’ individual circumstances (Guangdong DRC 2013b; Guangdong DRC 2014c).
Guangdong’s allowance allocation formulas follow a grandfathering, output-based updating, or
combined approach.
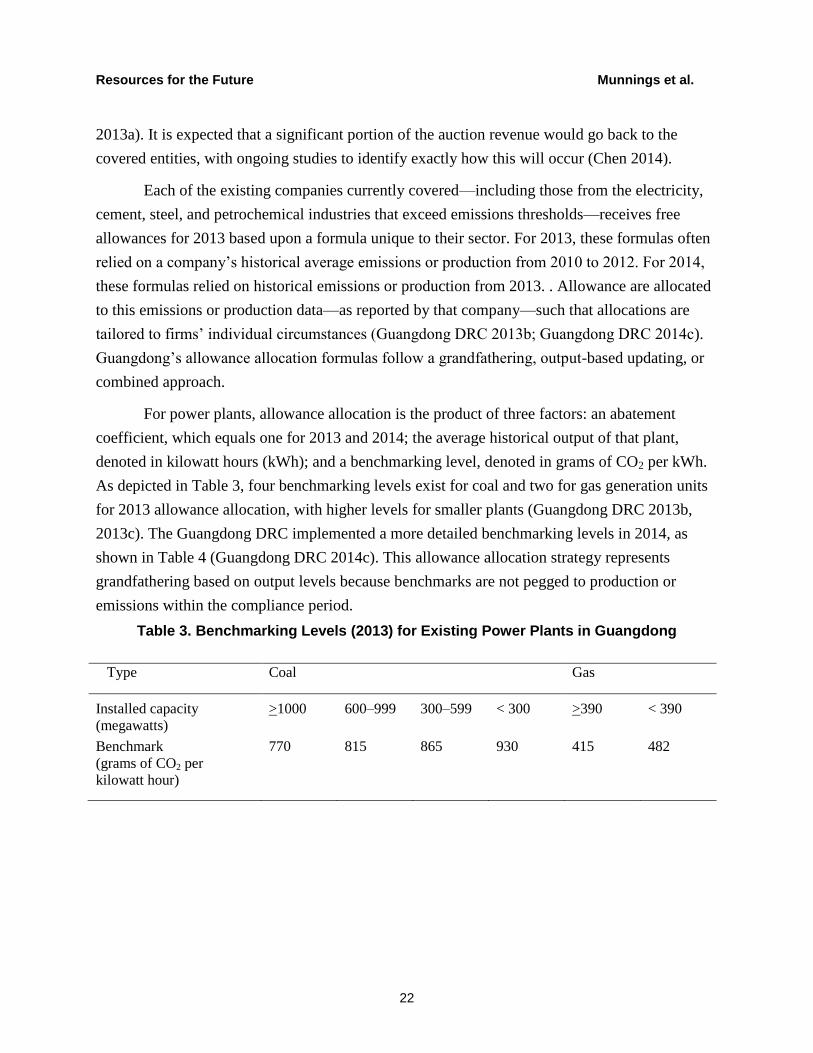
For power plants, allowance allocation is the product of three factors: an abatement
coefficient, which equals one for 2013 and 2014; the average historical output of that plant,
denoted in kilowatt hours (kWh); and a benchmarking level, denoted in grams of CO2 per kWh.
As depicted in Table 3, four benchmarking levels exist for coal and two for gas generation units
for 2013 allowance allocation, with higher levels for smaller plants (Guangdong DRC 2013b,
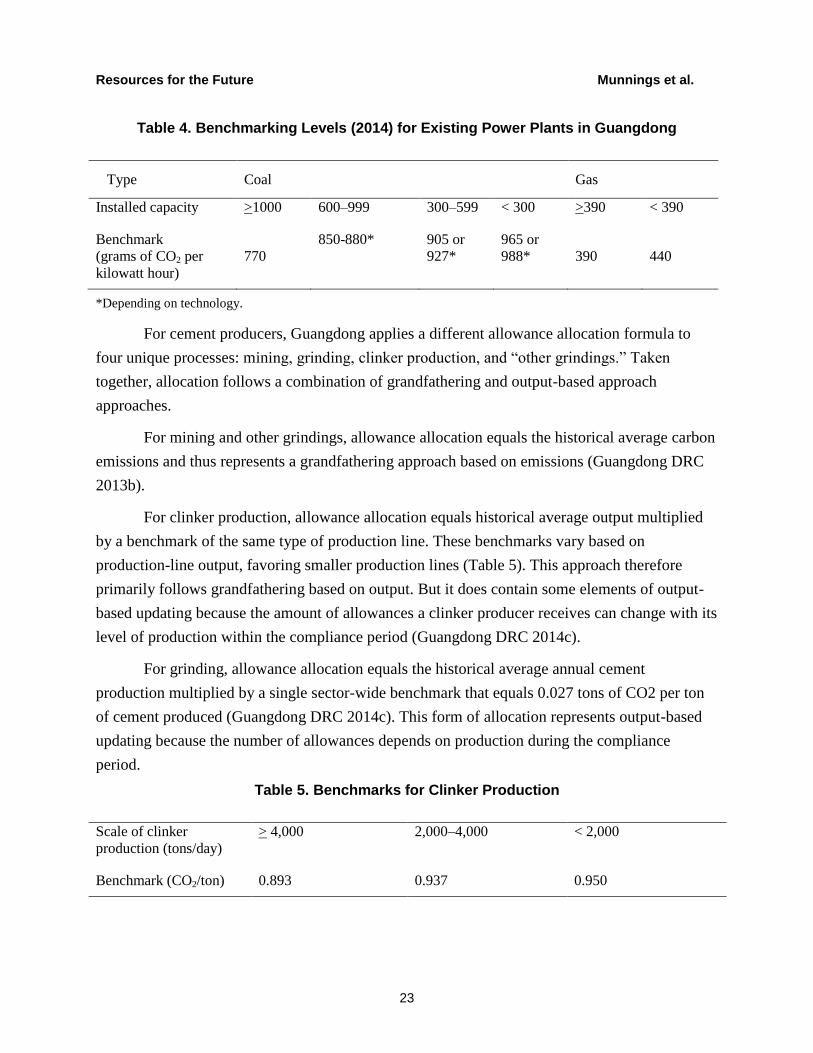
2013c). The Guangdong DRC implemented a more detailed benchmarking levels in 2014, as
shown in Table 4 (Guangdong DRC 2014c). This allowance allocation strategy represents
grandfathering based on output levels because benchmarks are not pegged to production or
emissions within the compliance period.
Table 3. Benchmarking Levels (2013) for Existing Power Plants in Guangdong
Type Coal Gas
Installed capacity
(megawatts)
>1000 600–999 300–599 < 300 >390 < 390
Benchmark
(grams of CO2 per
kilowatt hour)
770 815 865 930 415 482
Resources for the Future Munnings et al.
23
Table 4. Benchmarking Levels (2014) for Existing Power Plants in Guangdong
Type Coal Gas
Installed capacity
(megawatts)
>1000 600–999
300–599
< 300
>390 < 390
Benchmark
(grams of CO2 per
kilowatt hour)
770
850-880*
905 or
927*
965 or
988*
390 440
*Depending on technology.
For cement producers, Guangdong applies a different allowance allocation formula to
four unique processes: mining, grinding, clinker production, and “other grindings.” Taken
together, allocation follows a combination of grandfathering and output-based approach
approaches.
For mining and other grindings, allowance allocation equals the historical average carbon
emissions and thus represents a grandfathering approach based on emissions (Guangdong DRC
2013b).
For clinker production, allowance allocation equals historical average output multiplied
by a benchmark of the same type of production line. These benchmarks vary based on
production-line output, favoring smaller production lines (Table 5). This approach therefore
primarily follows grandfathering based on output. But it does contain some elements of output-
based updating because the amount of allowances a clinker producer receives can change with its
level of production within the compliance period (Guangdong DRC 2014c).
For grinding, allowance allocation equals the historical average annual cement
production multiplied by a single sector-wide benchmark that equals 0.027 tons of CO2 per ton
of cement produced (Guangdong DRC 2014c). This form of allocation represents output-based
updating because the number of allowances depends on production during the compliance
period.
Table 5. Benchmarks for Clinker Production
Scale of clinker
production (tons/day)
> 4,000 2,000–4,000 < 2,000
Benchmark (CO2/ton) 0.893 0.937 0.950
Resources for the Future Munnings et al.
24
For steel companies, allowance allocation differs based on whether the production uses a
long or short process. Total allocation for the long process equals the product of coke, limestone,
and steel production—each of which are multiplied by a benchmark and an abatement
coefficient. Benchmark levels vary by product. This type of allocation represents output-based
updating because allowances depend on production during the compliance period. Total
allocation for the short process equals the historical average annual carbon emissions multiplied
by the abatement coefficient, thus following a grandfathering approach (Guangdong DRC 2013b;
Guangdong DRC 2014c).
For petrochemical companies, allowance allocation equals annual average historical
carbon emissions multiplied by an abatement coefficient—and therefore represents
grandfathering based on emissions. The coefficient equals one for some companies except for
non-oil and non-ethylene petrochemical plants and oil/ethylene petrochemical plants whose
energy consumption exceeds the provincial average. In this case, the abatement coefficient
equals 0.99 for 2013 (Guangdong DRC 2013b) and 1 for 2014 (Guangdong DRC 2014c).
ii. Shanghai
Shanghai freely allocates all allowances for the 2013–2015 pilot phase. However, a
guidance document from the Shanghai government in 2012 recommends the timely introduction
of methods that require firms to pay, leaving room for possible auctioning later on.
Shanghai adopts two methods to allocate allowances for the pilot: grandfathering and
output-based allocation. The grandfathering method mainly applies to the industrial sector and
buildings associated with the commercial or rail sector, while the output-based updating method
applies to the electricity sector and buildings associated with airlines, airports, and ports
(Shanghai DRC 2013a).
For companies receiving free allocation via grandfathering, annual allowances for 2013–
2015 will be distributed at one time. For those using an output-based updating method, the
annual pre-allowances for 2013–2015 will be distributed all at once based on the average service
volume from 2009 to 2011. Before each year’s allowance surrender, the Shanghai DRC will
adjust the annual emissions allowances for each benchmarking enterprise based on its service
volume for that year, in order to rectify any gap between an enterprise’s pre-allocation and its
adjusted number of allowances. Such rectification can include distributing additional allowances
or retracting previously distributed allowances (Shanghai DRC 2013a).

Resources for the Future Munnings et al.
25
The process of adjusting allowance allocation will take place during March 15–31 of
each year (Shanghai DRC 2013b). This process essentially compares a regulated firm’s level of
pre-allocation with the number of allowances calculated by a benchmarking formula that
accounts for that firm’s annual output. Although the possibility of adjustment makes Shanghai’s
regulations more complex, regulators deemed these rules necessary. As mentioned earlier,
regulators hope that allocating allowances for the entire 2013–2015 period up front will increase
price discovery in the absence of a proper futures market for allowances. At the same time, they
want to maintain an output-based allocation method for certain industries, which can require
updating allowances each year based on the prior year’s output. The adjustment process therefore
represents a compromise.
Numerous covered enterprises will receive allowances based on a strategy of
grandfathering tied to emission levels. These covered enterprises generally fall into two
categories: industrial and buildings associated with the commercial or rail sectors. Allowance
allocation rules for these two categories are very similar. Both base allocation off of a firm’s
average annual emissions for the period of 2009–2011. Alternatively, if a firm’s carbon
emissions increased by more than 50 percent between those years, the allocation equals a firm’s
carbon emissions in 2011. New projects undertaken by industrial participants will receive free
allocation, and new projects undertaken by participants in the building sector will be completely
exempt (Shanghai DRC 2013a).
For covered enterprises in the electricity sector, the Shanghai DRC initially allocates
allowances based on historical electricity output, representing a grandfathering approach. It then
takes an output-based updating approach, recalculating the allowance allocation using equation 1
and adjusting for discrepancies by awarding additional allowances or taking away pre-
allowances.
Equation 1: Number of Allowances = Et * B * CF * A
Et is a power company’s annual integrated electricity output, based on power generation
and heat supplied and denoted in kilojoules.
B is a benchmarking level for power companies that varies across generating units,
depending on unit type and installed capacity and denoted in CO2 per kWh (Table 6). The
baseline levels vary between 2013 and 2015, favoring smaller power plants.
CF is a conversion factor that varies for coal and gas power plants, denoted in kilojoules
per kWh.
Resources for the Future Munnings et al.
26
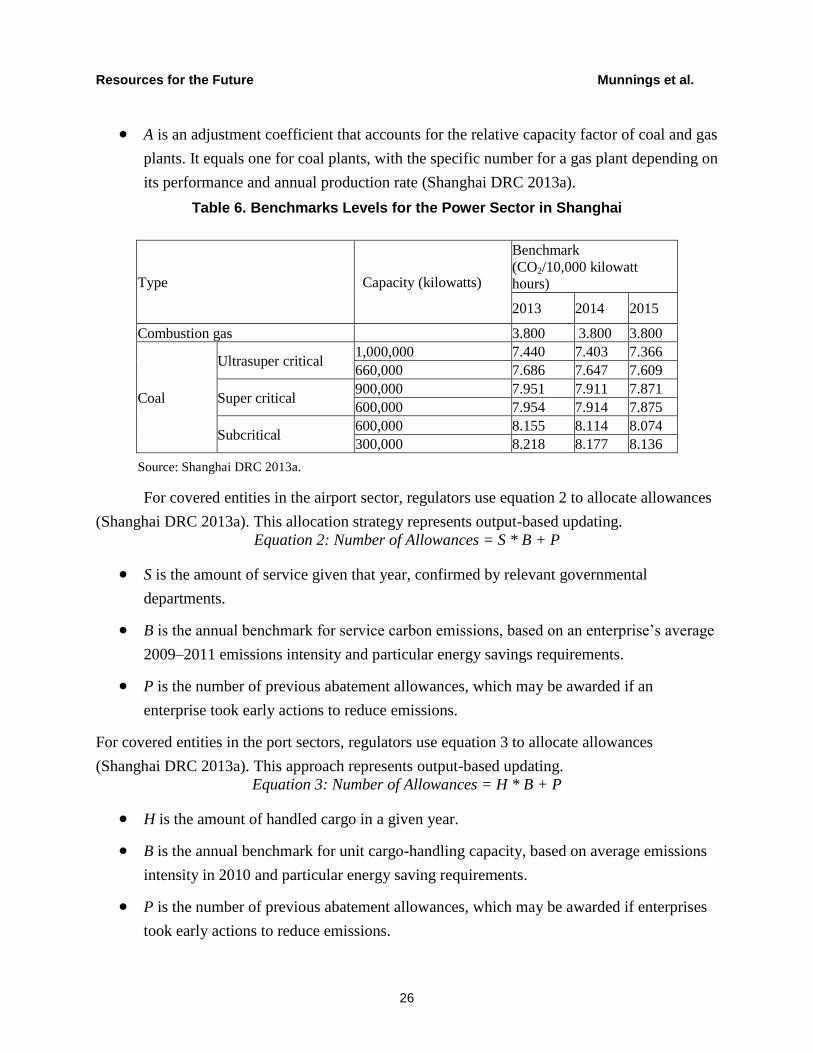
A is an adjustment coefficient that accounts for the relative capacity factor of coal and gas
plants. It equals one for coal plants, with the specific number for a gas plant depending on
its performance and annual production rate (Shanghai DRC 2013a).
Table 6. Benchmarks Levels for the Power Sector in Shanghai
Type Capacity (kilowatts)
Benchmark
(CO2/10,000 kilowatt
hours)
2013 2014 2015
Combustion gas 3.800 3.800 3.800
Coal
Ultrasuper critical 1,000,000 7.440 7.403 7.366
660,000 7.686 7.647 7.609
Super critical 900,000 7.951 7.911 7.871
600,000 7.954 7.914 7.875
Subcritical 600,000 8.155 8.114 8.074
300,000 8.218 8.177 8.136
Source: Shanghai DRC 2013a.
For covered entities in the airport sector, regulators use equation 2 to allocate allowances
(Shanghai DRC 2013a). This allocation strategy represents output-based updating.
Equation 2: Number of Allowances = S * B + P
S is the amount of service given that year, confirmed by relevant governmental
departments.
B is the annual benchmark for service carbon emissions, based on an enterprise’s average
2009–2011 emissions intensity and particular energy savings requirements.
P is the number of previous abatement allowances, which may be awarded if an
enterprise took early actions to reduce emissions.
For covered entities in the port sectors, regulators use equation 3 to allocate allowances
(Shanghai DRC 2013a). This approach represents output-based updating.
Equation 3: Number of Allowances = H * B + P
H is the amount of handled cargo in a given year.
B is the annual benchmark for unit cargo-handling capacity, based on average emissions
intensity in 2010 and particular energy saving requirements.
P is the number of previous abatement allowances, which may be awarded if enterprises
took early actions to reduce emissions.
Resources for the Future Munnings et al.
27
iii. Shenzhen
Regulators in Shenzhen can choose to auction as much as 3 percent of total allocation but
have yet to commit to doing so. Like Shanghai, Shenzhen pre-allocates allowances up front all at
once and may adjust allowances later. Regulators can award companies additional allowances or
buy back pre-allocated allowances based on companies’ actual emissions and production data
during the first quarter of each year. Any adjustments must be completed by May 31 of the year
following emissions. Regulated companies must fulfill obligations based on their adjusted
allowances, not their level of pre-allocated allowances (Shenzhen Exchange 2013).
The allocation method for the electricity and water sectors in Shenzhen is based on
benchmarks, but details remain scarce. For industrial firms, Shenzhen applies a game theory
approach to allocate the majority of allowances, citing serious information asymmetry for future
output in manufacturing. Under this approach, allowance allocation becomes a game between
firms instead of a game between firms and the government. The government announces a sector-
wide cap and sets historical and target carbon-intensity benchmarks for each sector. Then firms
submit emissions demand and projected output to compete with other firms for free allowances.
Under game rules, firms with higher historical intensity must achieve larger reductions, and
firms with low historical intensities or large intensity reductions will be encouraged. This game
is repeated, with each stage offering a firm the chance to accept or reject its proposed allocation
and exit the game. Such exits deduct from the total amount of allowance and therefore reduce the
cap for the next round, which will be played out by the remaining firms (Jiang et al. 2014).
E. Provisions for Exits and Entrants
Each pilot treats entrants and exits quite differently. In Guangdong, new projects
expected to emit more than 10,000 carbon emissions annually are covered and receive free
allowances from an estimated 20 million ton reserve8 when they purchase enough auctioned
allowances (Guangdong Government 2014). In addition, emitters that are not covered can
voluntarily apply to the pilot. Firms that exit the program must forfeit all allowances
(Guangdong Government 2014).
8 Guangdong reserves 38 million tons for market adjustments and new, expanded, or retrofitted projects. Decree 197
(Guangdong Government 2014) states that the current allocation for market adjustment equals 5 percent of the total
amount for regulated entities. For 2013, the total is 350 million tons, so the current allocation equals 17.5 million
tons. Subtracting 17.5 million tons from 38 million tons leaves us with an estimate for reserved allowances intended
for new, expanded, or retrofitted projects that equals 20.5 million tons.

Resources for the Future Munnings et al.
28
In Shanghai, only new projects from already-covered firms can enter the pilot, but new
projects in the commercial sector are exempted (Shanghai DRC 2013a). Firms that exit the
program only forfeit 50 percent of their future allowances (Shanghai Government 2013b).
In Shenzhen, new fixed asset investment projects are covered if they are expected to emit
at least 3,000 tons of CO2 annually (Shenzhen Government 2014).9 Two percent of the total
annual allowances are reserved for these new projects, which would receive pre-allocation upon
the start of production. Allocation would then be subject to adjustment based on actual
production (Shenzhen Government 2014). Freely allocated allowances come from a 2.4 million
allowance reserve (Shenzhen Exchange 2013). Firms can voluntarily join the program.
F. Price Management Provisions
Each of the pilots manages their allowance prices differently. In Guangdong, regulators
designated a price floor for auctioned allowances (Guangdong DRC 2013c). Moreover, an
exchange regulates allowance prices so that they cannot vary more than 10 percent in one day
(Guangzhou Exchange 2013).
In Shanghai, the only restriction on allowance prices is that they cannot vary more than
30 percent in one day (Shanghai Exchange 2013).
Shenzhen most thoroughly manages prices of the three pilots, guarding against extreme
highs or lows using a symmetric safety valve composed of two components. Regulators have
kept an allowance reserve that equals 2 percent of total allocation, amounting to 2.4 million
allowances for currently regulated companies, to protect against high prices. In the event that
regulators determine that prices are too high, they will issue these allowances for sale at a fixed
price. These allowances can be used only for compliance and cannot be traded on the market.
Regulators also can buy a number of allowances back from the market if they determine prices
are too low. The number of buyback allowances is limited to 10 percent of total allocation, or 12
million allowances for currently regulated companies. Funds for buybacks would come from
auction proceeds, fines and donations (Shenzhen Exchange 2013).
9 In a previous draft, the Shenzhen government (2013) stated that rules for new entrants would “involve an investment
exceeding ¥200 million.”
Resources for the Future Munnings et al.
29
G. Provisions for Carbon Offsets
Each pilot allows for the use of Chinese Certified Emissions Reductions (CCERs), which
are largely composed of carbon offsets from the Clean Development Mechanism that have been
repurposed for use in a Chinese context. Pilots do place restrictions on the use of CCERs,
however.
Companies in Guangdong cannot use CCERs to comply with more than 10 percent of
their annual emissions, and 70 percent of the CCERs a company uses must come from within the
province (Guangdong Government 2014).
In Shanghai, companies can use CCERs to satisfy up to 5 percent of their obligation in
any given year (Shanghai Government 2013a, 2013b).
In Shenzhen, companies can use CCERs for as much as 10 percent of their obligations,
and the government plans to issue geographic restrictions and limits on the type of offsets that
might be used (Shenzhen Exchange 2013).
Both Guangdong and Shanghai acknowledge that the NDRC will have to first issue
CCERs, with Shanghai explicitly mentioning that the national government must verify that each
CCER equals one ton of carbon emissions allowances (Shanghai DRC 2013a).
H. Provisions that Address Market Power
Two of the three pilots we consider, Shanghai and Guangdong, establish holding limits
that might help prevent market power.
I. Provisions that Address Linking
One of the pilots we consider, Guangdong, may consider interprovincial trading with
Hubei and other provinces (Han et al. 2012; Qian 2011). Indeed, the Guangdong pilot regulators
have called for further research on linking and set a goal of designing an interprovincial market
before 2020 (Guangdong Government 2012a; Guangdong Government 2012b).
VI. Progress Achieved by the Pilots
How have the pilots progressed thus far? In this section, we present data on allowance
prices, trading volumes, and compliance rates as of 1 August 2014. Figure 1 presents daily
average allowance prices over time for Guangdong (red), Shanghai (green), and Shenzhen (blue).
Figure 2 presents daily trading volumes over time.
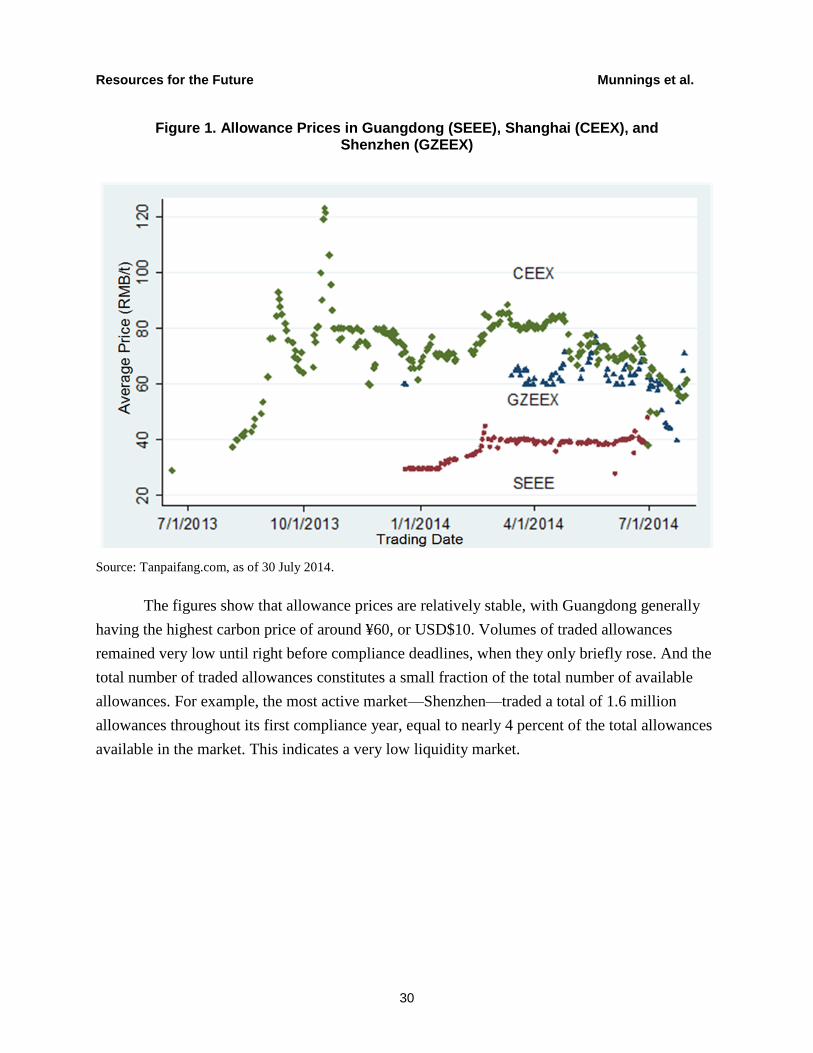
Resources for the Future Munnings et al.
30
Figure 1. Allowance Prices in Guangdong (SEEE), Shanghai (CEEX), and Shenzhen (GZEEX)
Source: Tanpaifang.com, as of 30 July 2014.
The figures show that allowance prices are relatively stable, with Guangdong generally
having the highest carbon price of around ¥60, or USD$10. Volumes of traded allowances
remained very low until right before compliance deadlines, when they only briefly rose. And the
total number of traded allowances constitutes a small fraction of the total number of available
allowances. For example, the most active market—Shenzhen—traded a total of 1.6 million
allowances throughout its first compliance year, equal to nearly 4 percent of the total allowances
available in the market. This indicates a very low liquidity market.
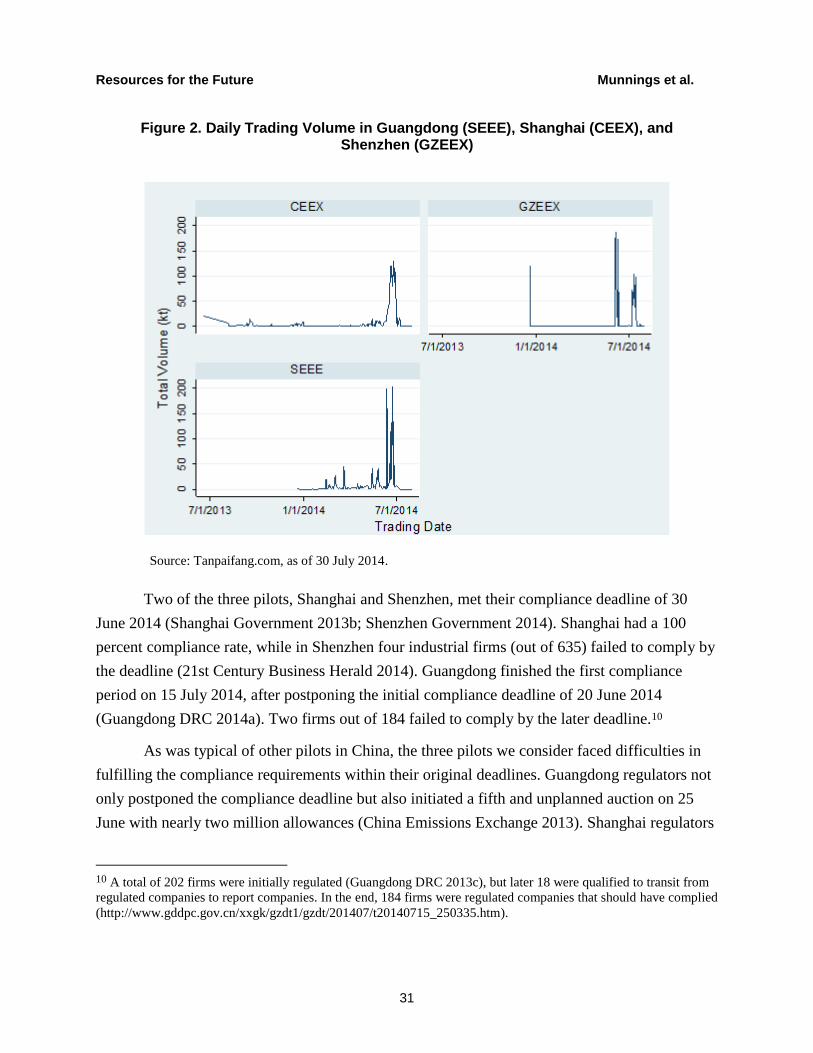
Resources for the Future Munnings et al.
31
Figure 2. Daily Trading Volume in Guangdong (SEEE), Shanghai (CEEX), and Shenzhen (GZEEX)
Source: Tanpaifang.com, as of 30 July 2014.
Two of the three pilots, Shanghai and Shenzhen, met their compliance deadline of 30
June 2014 (Shanghai Government 2013b; Shenzhen Government 2014). Shanghai had a 100
percent compliance rate, while in Shenzhen four industrial firms (out of 635) failed to comply by
the deadline (21st Century Business Herald 2014). Guangdong finished the first compliance
period on 15 July 2014, after postponing the initial compliance deadline of 20 June 2014
(Guangdong DRC 2014a). Two firms out of 184 failed to comply by the later deadline.10
As was typical of other pilots in China, the three pilots we consider faced difficulties in
fulfilling the compliance requirements within their original deadlines. Guangdong regulators not
only postponed the compliance deadline but also initiated a fifth and unplanned auction on 25
June with nearly two million allowances (China Emissions Exchange 2013). Shanghai regulators
10 A total of 202 firms were initially regulated (Guangdong DRC 2013c), but later 18 were qualified to transit from
regulated companies to report companies. In the end, 184 firms were regulated companies that should have complied
(http://www.gddpc.gov.cn/xxgk/gzdt1/gzdt/201407/t20140715_250335.htm).
Resources for the Future Munnings et al.
32
allocated more than 500,000 additional allowances for auction on 30 June, 7,220 tons of which
were bought by two firms (Shanghai DRC 2014; Shanghai Exchange 2014). And in Shenzhen,
regulators extended the transaction time during the period from June 23 to June 30 (Shenzhen
Exchange 2014a; Shenzhen Exchange 2014b).
Similar phenomenon exists in other pilots. Beijing pushed back its compliance deadline
from 15 to 27 June. Beijing DRC published a list of incompliant companies (257 in total) and
asked them to comply before June 27 without punishment. If they failed to comply, Beijing
would have tried to impose a penalty of 3 to 5 times of the average market price for each ton of
the CO2 exceeded.11 Tianjin postponed its deadline twice, from 31 May to 10 July and finally to
25 July. 12,13
VII. Discussion of Design Challenges Surrounding the Pilots
The carbon trading pilots in Guangdong, Shanghai, and Shenzhen face challenges at
every level of program design that we outlined in the previous section. In this section, we discuss
those challenges and provide suggestions for overcoming them.
A. Legal and Administrative Status of C&T
The difficulties faced in achieving compliance indicate that the pilots may not have
strong legal or administrative status. In many instances, local governments had to go through
significant effort to ensure full compliance with the program—sometimes at the expense of the
environmental integrity of the programs. A strong legal and administrative status serves as a
prerequisite for a successful C&T system.
Such an improvement would put the pilot C&T systems on equal legal footing with
complementary policies that these higher bodies of law have explicitly addressed, including
carbon intensity targets and energy intensity targets. This could avoid complications that arise
from pilot regulators’ attempts to orient their C&T programs to carbon intensity goals with
stronger legal status.
11 http://www.bjpc.gov.cn/tztg/201406/t7863548.htm
12 http://www.tjzfxxgk.gov.cn/tjep//ConInfoParticular.jsp?id=49132
13 http://www.tanpaifang.com/tanjiaoyisuo/2014/0710/35049.html
Resources for the Future Munnings et al.
33
One way to improve compliance is to incorporate performance under the pilot C&T
systems into the review of participating government officials and the executives of SOEs. The
National People’s Congress or the State Council could ensure this by passing a national law or
executive notice, respectively. Tying the achievement of environmental goals to the possibility of
promotion and demotion helped China achieve its sulfur dioxide reduction goals in the late 2000s
(Schreifels et al. 2012). Such an improvement would place C&T on equal administrative footing
with complementary policies such as carbon- and energy-intensity targets—which are already
incorporated into performance reviews.
B. Cap Setting
A thorough understanding of an absolute cap level requires estimating two variables:
business-as-usual emissions and the emissions impact of complementary policies. To our
knowledge, none of the three pilots have conducted the economic assessments required to
estimate either variable. Indeed, on a conceptual basis, it remains unclear how caps were chosen
at all—except that they may have been aggregated from individual entity’s allocations. Without
such analysis, regulators and the regulated firms cannot reliably predict whether cap levels will
be binding or convincingly project future allowance prices. As a result, regulated entities and the
public may not have faith in the legitimacy of the cap-setting process. Likewise, prospective
linking partners would likely view an opaque cap-setting process as a strong barrier to trading
because they could not easily predict the stringency of the cap or the direction and magnitude of
cash flows. Taken together, these negative impacts constitute one of the greatest challenges
facing successful carbon trading in China. We therefore suggest that pilot regulators improve the
clarity and transparency of their cap-setting process.
Other carbon trading programs have estimated business-as-usual emissions and the
emissions impact of complementary policies, providing a possible template for regulators in
China. In California, for example, regulators have gone through substantial effort to produce and
publicize their caps. Given this information, stakeholders can easily assess that the cap is
projected to be binding: they can observe a positive emissions reduction associated with the cap
while recognizing that C&T, overall, is only responsible for about one-fifth of the overall
emissions reductions California expects to achieve by 2020. At least from a conceptual point of
view, replicating California’s process should be straightforward for the pilots and could bring
substantial benefits.
Moreover, the degree of complementary policies in China is typically quite high for air
pollution policies—including climate policy. As an example, Zhang et al. (2013) find that four
Resources for the Future Munnings et al.
34
policies complementing a sulfur dioxide trading pilot in Jiangsu reduced over 90 percent of the
potential cost savings associated with emissions trading. We suggest that pilot regulators
calculate and publicize business-as-usual emissions and the emissions impact of complementary
policies.
C. Determining the Duration of the Cap
While striking a balance between certainty and flexibility is a challenge to C&T
regulators worldwide, to the best of our knowledge, only the Chinese pilots have single-year
schedules or within-period adjustment of caps. Without more certainty in these caps, a variety of
adverse outcomes may occur, ranging from stunted appetite for trading to a lack of long-term
price signals to shift away from carbon-intensive production. We outline a number of detailed
suggestions in this section that are specific to Shanghai and Shenzhen, as Guangdong does not
contain such provisions.
We suggest regulators in Shanghai consider the possibility of dropping within-period
adjustments to electricity companies, which is seemingly an important determinant of overall cap
levels. As described in previous sections, the level of these adjustments depends on a
benchmarking formula that accounts for actual output during the compliance period and can
result in allowances being awarded to, or taken away from, individual entities. The result is that
entities only know their final allocation in the last quarter or so of a compliance period—and
likely will not aggressively trade allowances until the last quarter of the compliance period. Such
compressed trading is observable in the first compliance year and hampers liquidity and price
discovery.
Dropping within-period adjustments may be difficult for Shanghai to undertake: given its
choice of a hybrid system that contains some elements of an absolute cap, it needs flexibility to
ensure that unexpected changes in GDP growth do not prevent it from complying with regional
carbon-intensity targets. As previously mentioned, tying Shanghai’s cap to a carbon-intensity
target may allow regulators to stand on firmer enforcement grounds when trying to ensure
compliance. This challenge would be greatly simplified by an explicit mandate—either a
national law from the National People’s Congress or an administrative notice from the State
Council—that the carbon pilots are on equal legal and enforcement footing as other nationally
mandated environmental policies, including carbon-intensity targets.
For similar reasons, we suggest that regulators in Shenzhen do away with the adjustment
process they have outlined for many of their regulated entities. However, for reasons in addition
Resources for the Future Munnings et al.
35
to those in Shanghai, Shenzhen regulators may find it difficult to drop such provisions. Shenzhen
has chosen largely intensity-based targets and need not worry as much about whether its pilot
complies with similar regional targets, but regulators may be reserving the right to adjust
allocations within period if firms have (intentionally or unintentionally) underreported or
overreported their carbon emissions.
In the event that regulators in Shanghai and Shenzhen choose to retain within-period
adjustments, we suggest they strive to design a policy that changes allowances at the market
level instead of the entity level. For allowance additions, the government could hold an auction.
For allowance buybacks, the government could hold a reverse auction, where firms submit bids
to voluntary retire allowances back toward the government. This would help eliminate
uncertainty over individual allocations (and thus not hamper an entity’s willingness to trade) and
could be achieved in a variety of ways.
D. Treatment of Direct and Indirect Emissions
All pilots require entities to retire an allowance for emissions associated with electricity
at both the points of production and consumption. As discussed earlier, electricity generators
likely will not be able to pass through the costs associated with carbon allowances to electricity
consumers. This constraint, under a scenario where entities only have to retire allowance for
electricity generation, would preclude a carbon price signal from reaching electricity
consumers—leaving unrealized opportunities to reduce emissions resulting from decreased
electricity consumed. Ultimately, this will result in an increase in allowance prices. The decision
to require retirements for emissions associated with electricity production and consumption
allows communication of the carbon price signal to consumers—bringing cheap reductions
online and helping to restore the overall efficiency of the program.
Several potential issues may hinder the effectiveness of this approach. To avoid
complications, including overallocation and emissions leakage, regulators might closely monitor
three variables by collecting specific data from the electricity grid. Two of these variables—
electricity consumption and the emissions factor assigned to electricity purchased by regulated
firms—are uncertain and subject to year-to-year variation that may lead to a miscalculation of
compliance responsibility. For example, Chai (2013) argues that the Shenzhen pilot is
overallocated and that one of the main causes is the use of a dated default emissions rate that is
higher than the actual default rate. Accurate and timely data on these two variables are critical.
Third, tracking the quantity of imported electricity and the emissions rate of those imports would
allow regulators to require entities to retire allowances for the carbon emissions associated with
Resources for the Future Munnings et al.
36
imports. Such a policy could significantly eliminate one issue facing the pilots: emissions
leakage. California’s program, for example, collects such data from electricity importers and
regulates carbon emissions from electricity imports.
We also note the importance of aligning incentives for self-generation with those from
purchasing electricity from the grid. Current rules lack clarity in terms of whether and how the
programs cover self-generation from regulated entities. If self-generation is not covered by the
program, this provides an incentive for regulated firms to switch from purchasing electricity to
self-generation—which may increase overall carbon emissions. If the emissions rate is not
accurately estimated, this may lead to unintended consequences.
One decision facing regulators is whether to allow trading of allowances between direct
and indirect sources. While we do not have any specific suggestions, we do advise considering
some important trade-offs. In principle, enabling such trade will reduce emissions at lowest total
cost. But allowing trade between the two sources would lead to one allowance price and
therefore may prohibit a deeper understanding of the abatement cost differences between direct
and indirect sources. On the other hand, the value of knowing the abatement costs of the two
sources may not be particularly high. Regulators may choose to sacrifice the efficiency gains
from a joint market for the information gained from a segmented market. In any case, including
an identifier that distinguishes between direct and indirect emissions in an allowance’s serial
number might prove useful—if regulators want to preserve the option of regulating these
allowances differently or collecting information about them.
E. Free Allocation of Allowances
Overall, we suggest that pilots develop a strategy to carefully and gradually move away
from free allocation in the long term. There are several potential advantages to increasing the
portion of auctioned allowances. For example, auctions can help avoid windfall profits and limit
dynamic incentives for firms to maintain emission levels that free allocation may promote.
Auctions also promote price discovery. Most importantly, perhaps, auctions allow regulators to
collect carbon revenue that might be used for a variety of purposes including reducing pre-
existing distortionary taxes on labor, capital or consumption, returning dividends to constituents,
reducing government deficits or subsidizing covered enterprises in EITE industries (Carbone et
al. 2013; Nielsen et al. 2013). Indeed, many existing C&T programs auction allowances and
invest the associated revenues in a multitude of ways (Burtraw and Sekar 2013). In China,
revenue neutral tax swaps may also decrease overall tax evasion and can therefore increase
economic welfare (Liu 2013).
Resources for the Future Munnings et al.
37
But minimizing free allocation has at least two potential downsides. First, free allocation
allows regulators to determine the distribution of costs associated with a C&T program and help
governments gain political acceptability for carbon pricing by creating tailored formulas and
categories for free allocation. As a result, decreasing free allocation may require regulators to
forfeit some amount of political capital. Second, regulators must pay heed to the ability of firms
to pass along carbon prices to consumers. Firms that can pass through costs can simply transfer a
majority of costs to their consumers, making an increase in auctions for these sectors desirable.
However, certain industries in China, including electricity and EITE industries, cannot as easily
pass along costs—so auctioning should be introduced more slowly.
We suggest allowing regulated electricity generators to pass through costs associated
with carbon allowances along to consumers. Such a change would likely require that the NDRC
allow electricity prices to increase because of carbon pricing, which would represent a
substantial change in current policy. We note that if such a policy change does occur there would
be no need to regulate both direct and indirect emissions, and regulators may have to start
auctioning allowances to electricity generators instead of freely allocating to avoid windfall
profits. If this change cannot occur, it may make sense to continue free allocation in the
electricity generation sector.
If the system of regulating direct and indirect emissions remains, the pilots should
consider eliminating free allocation for those purchases of electricity that can easily pass costs
along to consumers. In particular, we suspect that owners of buildings regulated by certain pilots
may be able to easily pass along costs and would therefore be able to earn windfall profits—
insofar as they believe allowances have an opportunity cost. Some sectors, however, have more
limited ability to pass through costs. These include EITE industries, such as steel, aluminum, and
cement, where prices are importantly determined by a global market—although likely to a lesser
extent than EITE industries located in other parts of the world. In these instances, we suggest
output-based updating until a credible international carbon pricing regime is established. This
form of allocation provides free allocation of emissions allowances to the most affected sectors.
If these free allowances, or rebates, are updated on the basis of recent output levels as prescribed,
for example, in the California system, firms would be able to maintain sales in the face of policy-
induced cost increases while sustaining incentives created by the emissions cap to reduce the
carbon intensity of production. Importantly, in California, the per-unit allowance allocation is not
be based on the firm’s emissions but on a sector-based intensity standard, thus creating
incentives for within-sector market shares to shift toward firms with low emissions intensity.
Resources for the Future Munnings et al.
38
F. Allowance Allocation Formulas
At some point, the process of earning acceptability through complex free allocation
formulas comes at the cost of simplicity. When firms cannot understand an overly complex
allocation approach, problems could occur. These issues may be avoided if regulators attempt to
simplify particularly complex allocation formulas—such as proposed allocations in Shanghai
that allocate to the industrial sector based on product-specific benchmarks. Greater simplicity
can be baked into complex allowance allocation formulas, which rely on enterprise-specific
factors as opposed to the industry-level criteria used in western cap-and-trade systems.
G. Non-Compliance Penalties
To ensure compliance, we suggest that lawmakers state in a national environmental law
that regulated firms should be fined on a per ton—instead of a per violation—basis. This fine
should be equal to a multiple of the average market price of allowances for each ton the firm
failed to retire an allowance for. Moreover, we suggest that this national environmental law
explicitly mention that such penalties apply to C&T systems for carbon.
H. Opt-in and Voluntary Entities
With the high number of new entrants potentially joining the pilots, care must be taken so
that their participation doesn’t increase overall carbon emissions. A conservative estimate of an
entrant’s historical emissions can help ensure that that entrant cannot receive free allowances by
manipulating its business-as-usual emissions. Where possible, the specific formula regulators use
could require new entrants to submit data before the carbon trading program started to avoid
moral hazard, which is a purposeful ramping of carbon emissions to receive a large number of
free allowances. At this stage, many of the rules surrounding opt-in and voluntarily regulated
entities remain unclear.
I. Price Management Provisions
Given the uncertainty regarding economic growth, the implementation of a symmetric
safety valve may guard against allowance prices that fall too low or rise too high (Burtraw et al.
2010; Fell and Morgenstern 2010). However, only the Shenzhen pilot has constructed a
symmetric safety valve—potentially leaving the other two pilots at risk of dramatic price swings.
Resources for the Future Munnings et al.
39
J. Provisions to Prevent Market Power
We suggest the pilot regulators investigate whether market power is present in the pilot
C&T systems. The issue of market power has to do with the amount of allowances allocated to
each firm just as much as the size distribution of emitting firms (Morgenstern et al. 2004). If
regulators detect market power issues, several options might be considered. First, SOEs and
competitive enterprises might trade allowances in a separate market. Second, regulators could
impose holding limits. Third, regulators could try to improve liquidity through increasing the
number of participants.
K. Improving Liquidity
Liquidity is currently quite low in the C&T pilots, for a number of possible reasons. One
explanation might be that complementary policies have negated the need for trading—having
already effectively achieved the emissions reduction imposed by the pilots (Zhang et al. 2013).
Another explanation might be that the regulated entities face some barrier that prevents them
from trading, including transaction costs that might stem from a lack of familiarity with trading.
Indeed, during the sulfur dioxide trading pilots, most trades required government intervention
(Chang and Wang 2010).
A healthy level of liquidity acts as a prerequisite to an allowance price that reflects
marginal abatement costs. While there are numerous potential definitions of what conditions
constitute a healthy liquidity level, authors have used bid-ask spreads and trading volumes to
investigate liquidity in renewable energy credit and C&T markets (Frino et al. 2009;
Schmalensee 2012). We recommend regulators try to identify the sources of low levels of
liquidity before trying to increase trading activity. Chinese regulators at the national and local
have expressed interest in formally linking the pilot programs (Wang 2013b), although such links
may not establish if a national program starts in 2016.
L. Facilitating Formal Linkage
Formal linkage ensures that reductions are achieved at the lowest overall costs—an
important economic goal. In order to prepare for the possibility of formal linkage, we
recommend that pilot regulators begin the process of aligning program designs—a process
known as linking by degrees—so that any linkage would not cause adverse consequences
(Burtraw et al. 2013). Linking by degrees can also capture political and administrative benefits in
the short term, even before two pilots would initiate a formal link (Burtraw et al. 2013). In this
way, linking by degrees can complement formal linkage by facilitating formal linkage in the
Resources for the Future Munnings et al.
40
long-term and capturing political and administrative benefits in the short term (Mansell and
Munnings 2013).
VIII. Future Research
We see two principal areas for further research on the pilot trading programs. First, we
view conducting further rigorous ex-ante research as crucial to ensure the success of local pilots.
Second, we view ex-post assessments of the carbon trading pilots as a necessary step for a
successful transition to a national carbon market. We elaborate on these future areas of research
below.
A. Ex-Ante Assessments
Further ex-ante research on methods for allowance allocation, provisions for price
management, and the impact of carbon trading pilots on carbon emissions and local economies
will help support the pilots as they evolve over time.
i. Allowance Allocation
Regarding allowance allocation, we hope that this initial report—and the work of other
researchers—will be expanded to more specific advice on improving allocation design in certain
pilots. How can regulators move away from within-in compliance period allowance adjustments,
for example, while maintaining a pilot’s ability to comply with regional carbon-intensity targets?
In addition, Shenzhen’s game theory approach to allowance allocation in a data sparse
environment seems promising but likely needs refinement. A carefully designed process for
transitioning to greater auctioning of allowances would likely aid regulators in all pilots.
Thorough qualitative, and possibly quantitative, analysis in these areas could substantially
improve allocation methodologies and, ultimately, the success of each pilot.
ii. Provisions for Price Management
The design of price management provisions likely will play a significant role in
allowance price levels and therefore be especially important for successful carbon trading pilots.
Given the heterogeneity of pilot approaches, researching the design of symmetric safety valves
for each pilot might be beneficial. Such research would identify optimal price floors, price
ceilings, and quantity of allowances to be kept in reserve. Well-designed symmetric safety valves
can build confidence in a healthy allowance price while providing a level of protection for the
local economy.
Resources for the Future Munnings et al.
41
iii. Potential for Linking
The extent of trading among the pilots also will affect allowance price levels. From an
efficiency point of view, the benefit of linking carbon markets is clear: achievement of overall
emissions reductions at least cost. There are numerous barriers to linking—distributional, legal,
and environmental in nature—that require alignment of certain design features across C&T
systems. A key piece of future research will be to assess which pilots are ready to link with one
another—and how some of these pilots may either link or transition into a national carbon
market.
iv. Modeling on Competitiveness and Leakage Impacts
Data constraints have importantly contributed to a dearth of rigorous and transparent
economic modeling conducted for the pilots. Nonetheless, ex-ante modeling will likely be
important for researchers to pursue and will become easier to conduct as regulators collect more
data on the carbon emissions and economic activity of regulated entities.
Anticipating and conducting ex-ante modeling of the emissions leakage and
competitiveness effects of a C&T system is central to demonstrating the effectiveness of the
policy at reducing total emissions—and to compensating adversely affected industries. Various
approaches have been adopted to estimate the extent and magnitude of adverse impacts of cap-
and-trade systems around the world. For example, standard ex-ante economic analysis—
buttressed by a number of international modeling studies from the United States, European
Union, and other nations—have estimated small but non-trivial output losses over both the short
and long time horizons for the sectors facing higher energy costs (Atkins et al. 2012; Böhringer
et al. 2010; Böhringer et al. 2012; Fischer and Fox 2007; Fischer and Fox 2010; Makato et al.
2012).
A key challenge for policymakers is to devise policies to limit the harm imposed on EITE
industries while maintaining the incentives for reducing energy intensity. The most effective
approach to reduce adverse competitiveness and leakage impacts is to ensure that other countries
or regions take comparable carbon pricing actions. Until more universal action occurs, however,
other options are available for addressing concerns in EITE industries.
The most commonly used option is to introduce rebates to firms tied to their output
levels. Such rebates are typically given in the form of free allowances. Important research
questions surround three factors: the breadth of eligibility for the rebates—i.e., the number of
industries that should be covered; the size of the initial rebates; and whether and how they should
be phased out over time. As a point of reference, it is noteworthy that some systems—for
Resources for the Future Munnings et al.
42
example, the European Union—have emphasized broad coverage of industries with relatively
small rebates. Other systems,—for example, the Waxman-Markey legislation passed by the US
House of Representatives but not ultimately enacted into law—would have covered fewer
industries with relatively larger rebates.
In California, the legislation establishing the state’s C&T system directs the
implementing agencies to minimize leakage to the extent feasible. To comply with this goal, the
state has developed a relatively simple, category-based methodology to identify those industries
most at risk of emissions leakage. The method is based on industry-level measures of emissions
intensity and trade share. These metrics provide a very useful point of departure. However, it is
widely recognized that more sophisticated metrics and tools will be needed to credibly detect any
policy-induced changes in output, employment, and import flows, and to measure any associated
emissions leakage.
Ex-ante modeling studies that estimate the competitiveness and leakage impacts of the
carbon pilots on regulated entities and assess the relative effectiveness of the suite of policies
available for remedying these impacts would likely contribute to the success of the pilots.
B. Ex-Post Assessments
Ultimately, an ex-post evaluation of the pilot programs likely would best inform China’s
transition to a national carbon price. Such an evaluation could include survey, empirical, and
qualitative methodologies (described next).
The execution of such an evaluation would be made much easier if regulators collect at
least two types of data. First, we suggest regulators collect data during a baseline, or prepolicy,
period. Experience with the US Acid Rain Program and the EU ETS has demonstrated the
importance of this step. Such data can inform the construction of a credible and well-
substantiated estimate of what would have happened in the absence of the policy. This
counterfactual benchmark is an essential component of any ex-post analysis—but particularly so
for more quantitative analysis.
Second, we suggest regulators collect data on the output and emissions of both regulated
and unregulated entities, within pilot regions and outside of pilot regions. Such data would allow
for thorough comparisons of the performance of regulated entities relative to unregulated
entities.
Resources for the Future Munnings et al.
43
i. Constructing a Survey
Surveys can play an important role in understanding how stakeholders have responded to
public policy. Several researchers have conducted surveys of regulated entities in the EU ETS in
an attempt to gauge understanding of the carbon market and the markets impact of innovation
and investment. Krupnick et al. (2013) provides an alternative, and equally valid approach, of
surveying large groups of stakeholders on their general views and specific concerns with shale
gas development in the United States—an approach that might be adapted for carbon trading.
Jotzo et al. (2013) undertook a similar, but less comprehensive, approach to ask a limited set of
questions regarding carbon trading in China. In a data sparse environment, and for research
questions that require a more qualitative approach, such surveys can play a useful role.
ii. Informing a National Program
A comprehensive report that details the lessons learned from all carbon trading pilots in
China will be a crucial step toward informing China’s national carbon market. Such a report
could compare approaches to national the existing local efforts, including which pilots have
excelled in which design areas. In addition, such a report can assess whether pilots are ready to
link to one another.
IX. Conclusion
The pilots in Guangdong, Shanghai and Shenzhen have made significant progress in
building a cap-and-trade market. Some aspects of pilot designs represent a deft tailoring of a
fundamentally market-based instrument to a socialist market economy. Yet potential design
deficiencies remain. We have made nine main recommendations in an attempt to strengthen the
programs, but a large number of unanswered research questions remain. Further analysis would
improve the prospects that the pilots operate successfully and the degree to which the pilots can
ultimately inform the design and operation of a national carbon price in China.
Resources for the Future Munnings et al.
44
References
21st Century Business Herald. 2014. Shanghai and Shenzhen Finished Compliance. 7 July.
Atkins, L., R. Garbaccio, M. Ho, E. Moore, and R.D. Morgenstern. 2012. Carbon Pricing with
Output Based Subsidies: Impact on U.S. Industries over Multiple Timeframes.
Discussion paper 12-27. Washington, DC: Resources for the Future.
Baron, R., A. Aasrud, J. Sinton, N. Campbell, K. Jiang, and X. Zhuang. 2012. Policy Options for
Low-Carbon Power Generation in China: Designing an Emissions Trading System for
China’s Electricity Sector. Insight Series 2012. Paris, France: International Energy
Agency.
Böhringer, C., J.C. Carbone and T.F. Rutherford. 2012. Unilateral Climate Policy Design:
Efficiency and Equity Implications of Alternative Instruments to Reduce Carbon
Leakage. Energy Economics 34 (Supplement 2): S208–S217.
Böhringer, C., A. Lange, and T.F. Rutherford. 2010. Optimal Emission Pricing in the Presence of
International Spillovers: Decomposing Leakage and Terms-of-Trade Motives. Working
paper 15899. Cambridge, MA: National Bureau of Economic Research.
Burtraw, D., K. Palmer, and D. Kahn. 2010. A Symmetric Safety Valve. Energy Policy 38(9):
4921–4932.
Burtraw, D., K. Palmer, C. Munnings, P. Weber, and M. Woerman. 2014. Linking by Degrees:
Incremental Alignment of Cap-and-Trade Markets. Discussion paper 13-04. Washington,
DC: Resources for the Future.
Burtaw, D. and S. Sekar. 2013. Two World Views on Carbon Revenues. Discussion Paper 13-32.
Washington, DC: Resources for the Future.
Carbone, J., C., Morgenstern, R., D., Williams III, R., C. and D. Burtraw. 2013. Deficit
Reduction and Carbon Taxes: Budgetary, Economic and Distributional Impacts. 2013.
Washington, DC: Resources for the Future.
Chai, H. 2013. A Sneak Peak at the Shenzhen ETS: Will the Pilot Risk Over-Allocation? New
York: Thomson Reuters.
Chang, Y. C., and N. Wang. 2010. Environmental Regulations and Emissions Trading in China.
Energy Policy 38: 3356–3364.
Chen, B. 2014. Personal communication with authors, 27 January.
Resources for the Future Munnings et al.
45
Chen, K., and S. Reklev. 2014. China’s Chongqing to Launch Market Trading on June 13. New
York: Thomson Reuters.
Cheng, C., and X. Zhang. 2011. A Study on the Construction of China’s Carbon Emissions
Trading System. Energy Procedia 4: 1037–43.
China Emissions Exchange. 2013. Annual Guangdong Province Carbon Emissions. 16 June.
Cong, R. G., and Y. M. Wei. 2010. Potential Impact of (CET) Carbon Emissions Trading on
China’s Power Sector: A Perspective from Different Allowance Allocation Options.
Energy 35: 3921–31.
Dai, H., and T. Masui. 2012. Assessing the Contribution of Carbon Emissions trading in China to
Carbon Intensity Reduction. Energy Science and Technology 4(1): 19–26.
Deng, H. 2012. China. In Climate Change Liability: Transnational Law and Practice, edited by
R. Lord, S. Goldberg, L. Rajamani, and J. Brunnée. New York: Cambridge University
Press.
Ellerman, D.A., and I. Sue Wing. 2003. Absolute Versus Intensity-Based Emission Caps.
Climate Policy 3(S2): S7–S20.
Fell, H., and R. D. Morgenstern. 2010. Alternative Approaches to Cost Containment in a Cap-
and-Trade System. Environmental and Resource Economics 47(2): 275–97.
Fischer, C., and A.K. Fox. 2007. Output-Based Allocation of Emissions Permits for Mitigating
Tax and Trade Interactions. Land Economics 83: 575–99.
Fischer, C., and A.K. Fox. 2010. On the Scope for Output-Based Rebating in Climate Policy:
When Revenue Recycling Isn’t Enough (or Isn’t Possible). Discussion paper 10–69.
Washington, DC: Resources for the Future.
Frino, A., Kruk, J. and A. Lepone. 2010. Liquidity and Transaction Costs in the European
Carbon Future Markets. Journal of Derivatives & Hedgefunds 16:100-115.
Guangdong DRC (Development and Reform Commission). 2013a. The Notice of Publishing
Initial Carbon Emissions Allowance Calculation Method and Results of Guangdong.
Published 6 December.
Guangdong DRC. 2013b. The Calculation of Guangdong Carbon Emission Allowances of 2013.
Published 6 December.
Resources for the Future Munnings et al.
46
Guangdong DRC. 2013c. Allocation and Working Plan of Guangdong Carbon Emissions
Allowance (Trial Implementation). Published 25 November.
Guangdong DRC. 2013d. List of Regulated Companies and New Project Companies. Published
25 November.
Guangdong DRC. 2014a. Detailed Implementation Rules on Carbon Emissions Allowances
Management (Trial). Published 20 March.
Guangdong DRC. 2014b. The Notice of Publishing the 2014 Allocation and Working Plan of
Guangdong Carbon Emissions Allowance. Published 18 August.
Guangdong DRC. 2014c. The Calculation of Guangdong Carbon Emission Allowances of 2014.
Published 18 August.
Guangzhou Exchange. 2013. Carbon Emissions Trading Rules. Guangzhou Carbon Emissions
Trading Exchange Center.
Guangdong Government. 2012a. Implementation Plan of the Guangdong Carbon Emissions
Trading Pilot. Published 7 September.
Guangdong Government. 2012b. Schedule of Key Tasks for Guangdong Emissions Trading Pilot
First Phase (2012–2015). Published 7 September.
Guangdong Government. 2013. Regulation on Carbon Emissions Management and Trading in
Guangdong Province (Draft for Examination as of August 4th). Published 4 July.
Guangdong Government. 2014. Experimenting Rules for Carbon Emissions Management in
Guangdong Decree 197. Published 15 January.
Hahn, R.W. 1984. Market Power and Transferable Property Rights. The Quarterly Journal of
Economics 99(4): 753–765.
Han, G., Olsson, M., Hallding, K. and D. Lunsford. 2012. China’s Carbon Emission Trading: An
Overview of Current Development. FORES study 2012. Stockholm, Sweden: Stockholm
Environment Institute.
Hart, C., and Z. Ma. 2014. China’s Regional Carbon Trading Experiments and the Development
of a National Market: Lessons from China’s SO2 Trading Programme. Energy and
Environment 25 (3&4): 577–92.
Resources for the Future Munnings et al.
47
Hubler, M., S. Voigt, and A. Loschel 2014. Designing an Emissions Trading Scheme for
China—An Up-to-Date Climate Policy Assessment. Energy Policy, available online in
March.
ICAP (International Carbon Action Partnership). 2014. Emissions Trading System Map.
Interactive Tool. Berlin, Germany: ICAP.
Jarvis, H., and W. Xu. 2006. Comparative Analysis of Air Pollution Trading in the United States
and China. Environmental Law Reporter 36(3): 10234.
Jiang, J. J., B. Ye, and X.M. Ma. 2014. The Construction of Shenzhen’s Carbon Emissions
Trading Scheme. Energy Policy, available online in March.
Jotzo, F. 2013. Emissions Trading in China: Principles, Design Options and Lessons from
International Practice. CCEP working paper 1303. Canberra, Australia: Crawford School
of Public Policy, The Australian University.
Jotzo, F., de Boer, J. and H. Kater. 2013. China Carbon Pricing Survey 2013, October. China
Carbon Forum.
Kahrl, F., J.H. Williams, and J. Hu. 2013. The Political Economics of Electricity Dispatch
Reform in China. Energy Policy 53: 361–369.
Kahrl, F., J. Williams, and D. Jianhua. 2011. Four Things You Should Know About China’s
Electricity System. China Environment Forum. Washington, DC: Woodrow Wilson
International Center for Scholars.
Kong, B., and C. Freeman. 2013. Making Sense of Carbon Market Development in China.
Carbon and Climate Law Review 3: 194–212.
Krupnick, A., Gordon, H., and S. Olmstead. 2013. “Pathways to Dialogue: What the Experts Say
about the Environmental Risks of Shale Gas Development.” Report. Washington, DC:
Resources for the Future.
Li, J.F., Y.X. Zhang, X. Wang, and S. F. Cai. 2012. Policy Implications for Carbon Trading
Market Establishment in China in the 12th
Five-Year Period. Advances in Climate
Change Research 3(3): 163–73.
Liu, A. A. 2013. Tax Evasion and Optimal Environmental Taxes. Journal of Environmental
Economics and Management 66:656-70.
Resources for the Future Munnings et al.
48
Liu, Y., S. Feng, S. Cai, Y. Zhang, X. Zhou, Y. Chen, and Z. Chen. 2013. Carbon Emissions
Trading System of China: A Linked Market vs Separated Markets. Frontiers of Earth
Science 7(4): 465–79.
Liu, S., and X. Nan. 2012. Data Gaps Hobble Carbon Trading. China Dialogue, 8 September.
Liu, J., and H. Yang. 2009. China Fights against Statistical Corruption. Science 325(5941): 675–
76. http://www.sciencemag.org/content/325/5941/675.
Lo, A.Y. 2012. Carbon Emissions Trading in China. Nature Climate Change 2: 765–766.
Lo, A.Y. 2013. Carbon Trading in a Socialist Market Economy: Can China Make a
Difference? Ecological Economics 87: 72–74.
Lo, A.Y., and M. Howes. 2014. Powered by the State or Finance? The Organization of China’s
Carbon Markets. Eurasian Geography and Economics 54(4): 386–408.
Lo, K., and M.Y. Wang. 2013. Energy Conservation in China’s Twelfth Five-Year Plan Period:
Continuation or Paradigm Shift? Renewable and Sustainable Energy Reviews 18: 499–
507.
Makato, S., T.H. Arimura, and R. Morgenstern. 2012. The Impacts on Japanese Industry of
Alternative Carbon Mitigation Policies. Discussion paper 12-17. Washington, DC:
Resources for the Future.
Malueg, D.A., and A.J. Yates. 2009. Bilateral Oligopoly, Private Information and Pollution
Permit Markets. Environmental and Resources Economics 43: 553–72.
MEP (Ministry of Environmental Protection of the People’s Republic of China). 2013. The State
Council Issues Action Plan on Prevention and Control of Air Pollution Introducing Ten
Measures to Improve Air Quality. Published on 12 September.
Montero, J.P. 2009. Market Power in Pollution Permits. The Energy Journal 30(S2): 115–42.
Morgenstern, R.D., P. Abeygunawardena, R. Anderson, R. Greenspan Bell, A. Krupnick, J.
Schreifels, C. Dong, W. Jinan, D. Cao, J. Wang, and S. Larsen. 2004. Emissions Trading
to Improve Air Quality in an Industrial City in the People’s Republic of China.
Discussion paper 04-16. Washington, DC: Resources for the Future.
Morgenstern, R.D., R. Anderson, R. Greenspan Bell, A.J. Krupnick, and X. Zhang. 2006.
Demonstrating Emissions Trading in Taiyuan, China. In The RFF Reader in
Environmental and Resource Policy, edited by W. Oates. Washington, DC: RFF Press.
Resources for the Future Munnings et al.
49
Morgenstern, R., et al. 2011. Design of the National Sulfur Dioxide Emissions Trading System
in the People’s Republic of China. Report TA 7191-PRC, Contract No. COSO/90-536.
Washington, DC: Resources for the Future, in cooperation with Chinese Research
Academy of Environmental Sciences and Tsinghau Solutions, Inc.
Mansell, A. and C. Munnings. 2013. The Linking Rainbow: Evaluating Different Approaches for
Joining Carbon Markets. Chapter 21 in Greenhouse Gas Market Report 2013. Geneva,
Switzerland: International Emissions Trading Association.
Nielsen, C., P., Ho, M. S., Wang, Y., Lei, Y, and J. Cao. 2013. An Integrated Assessment of the
Economic Costs and Environmental Benefits of Carbon Taxes in China. West Lafayette,
Indiana: Global Trade Analysis Project.
Newell, R., G. and W. A. Pizer. 2008. Indexed Regulation. Journal of Environmental Economics
and Management 56(3): 221-233.
NBSPRC (National Bureau of Statistics of the People’s Republic of China). 2013. China Energy
Statistical Yearbook 2013. Beijing, China.
NDRC (National Development and Reform Commission). 2009. Notice about Adjusting
Electricity Prices for the East China Power Grid.
NDRC. 2011. Notice About Adjusting Electricity Prices for the East China Power Grid.
NDRC. 2014. Responsibility Evaluation Method for Carbon Emissions per GDP Reduction
Goals.
NPC (National People’s Congress). 1989. Environmental Protection Law of the People’s
Republic of China.
NPC. 2000. Law of the People’s Republic of China on the Prevention and Control of
Atmospheric Pollution.
NPC. 2014. Environmental Protection Law of the People’s Republic of China.
Qi, S., and B. Wang. 2013. Fundamental Issues and Solutions in the Design of China’s ETS
Pilots: Allowance Allocation, Price Mechanism and State-Owned Key Enterprises.
Chinese Journal of Population Resources and Environment 11(1): 26–32.
Qian, W. 2011. Policy and Politics of a Carbon Market in China. Greenhouse Gas Market Report
2011: 22–25. Geneva, Switzerland: International Emissions Trading Association.
Resources for the Future Munnings et al.
50
Quemin, S., and W. Wang. 2014. Overview of Climate Change Policies and Development of
Emissions Trading in China. Les Cahiers de la Chaire Economie du Climat Information
and Debate Series. Paris, France.
RAP (Regulatory Assistance Project). 2013. Comments on Guangdong and Shanghai Draft
Emissions Trading Regulations. Montpelier, VT: RAP.
Schatzki, T., and R.N. Stavins. 2012. Implications of Policy Interactions for California’s Climate
Policy. Boston, MA: Analysis Group.
Schatzki, T., and R.N. Stavins. 2013. Three Lingering Design Issues Affecting Market
Performance in California’s GHG Cap-and-Trade Program. Boston, MA: Analysis
Group.
Schmalensee, R. Evaluating Policies to Increase Electricity Generation from Renewable Energy.
Review of Environmental Economics and Policy 6(1):45-64.
Schreifels, J.J., Y. Fu, and E.J. Wilson. 2012. Sulfur Dioxide Control in China: Policy Evolution
During the 10th
and 11th
Five-Year Plan and Lessons for the Future. Energy Policy 48:
779–89.
Schreifels, J. 2014. China’s Carbon Experiment: Piloting Emissions Trading Programs to
Control CO2. Presentation to Harvard School of Engineering and Applied Sciences. 15
January.
Shanghai DRC (Development and Reform Commission). 2012. List of Emissions Trading Pilot
Companies (First Batch). Published 29 November.
Shanghai DRC. 2013a. Allocation and Management Plan of Carbon Emissions Allowances in
Shanghai from 2013 to 2015. Published 22 November.
Shanghai DRC. 2013b. Temporary Rules for Management of Carbon Emission Allowance
Registry in Shanghai. Published 22 November.
Shanghai DRC. 2014. Notice on Non-free 2013 Carbon Allowances Allocation to Control during
the Compliance Period. Published 16 June 16.
Shanghai Exchange. 2013. Risk Control Management Plan of Carbon Emission Trading in
Shanghai. Shanghai Environment Exchange.
Shanghai Exchange. 2014. Auction Results for 2013 Non-free Allowance Allocation in
Shanghai. Shanghai Environment Exchange.
Resources for the Future Munnings et al.
51
Shanghai Government. 2012. Implementation Guidance of the Shanghai City Carbon Emissions
Trading Pilot. Published 3 July.
Shanghai Government. 2013a. Regulation on Carbon Emissions Trading in Shanghai City
(Draft). Published 12 July.
Shanghai Government. 2013b. Experimenting Rules for Carbon Emissions Management in
Shanghai. Shanghai City Government Decree 10. Published 18 November.
Shenzhen Congress. 2012. Provisions of Carbon Emissions Management of the Shenzhen
Special Economic Zone. Published 30 October.
Shenzhen Exchange. 2013. Shenzhen Emissions Trading Pilot. China Emissions Exchange in
Shenzhen.
Shenzhen Exchange. 2014a. Notice on Extending Transaction Time. China Emissions Exchange
in Shenzhen
Shenzhen Exchange. 2014b. Notice on Temporary Market Opening on Weekends. China
Emissions Exchange in Shenzhen.
Shenzhen Government. 2013. Temporary Rules for the Carbon Emissions Trading Management
in Shenzhen Economic Special Zone—Draft for public Review. Published 29 October.
Shenzhen Government. 2014. Temporary Rules for the Carbon Emissions Trading Management
in Shenzhen Economic Special Zone. Shenzhen Decree 262. Published 19 March.
State Council. 2011. Work Plan for Greenhouse Gas Emission Control During the 12th
Five-Year
Plan Period. Information Office of the State Council.
State Council. 2013. Air Pollution Prevention and Control Action Plan. Information Office of the
State Council.
State Council. 2014. Amendments on China’s Air Pollution Prevention and Control Law
(Consultative Draft). Published 9 September.
Tang, W., and L. Wu. 2013. Efficiency or Equity? Simulating the Carbon Emissions Permits
Trading Schemes in China Based on an Inter-Regional CGE Model. Paper 4090. West
Lafayette, IN: Global Trade Analysis Project.
US EIA (Energy Information Administration). 2014a. China Energy Overview.
http://www.eia.gov/countries/cab.cfm?fips=ch.
Resources for the Future Munnings et al.
52
US EIA. 2014b. China Produces and Consumes Almost as Much Coal as the Rest of the World
Combined. http://www.eia.gov/todayinenergy/detail.cfm?id=16271&src=email.
Wang, A.L. 2013b. The Search for Sustainable Legitimacy: Environmental Law and
Bureaucracy in China. Harvard Environmental Law Review 37: 365–440.
Wang, Q. 2013a. China Has the Capacity to Lead in Carbon Trading. Nature 493: 273.
World Bank. 2014. States and Trends of Carbon Pricing 2014. Washington, DC: World Bank.
Wu, L., H. Qian, and J. Li. 2014. Advancing the Experiment to Reality: Perspectives on
Shanghai Pilot Carbon Emissions Trading Scheme. Energy Policy. Available online in
May.
Xinhua News Agency. Shanghai Initiated Carbon Emissions Trading. 2013 Nov. 27,
http://news.xinhuanet.com/2013-11/27/c_118306208.htm.
Yuan, Y.N., M.J. Shi, N. Li, and S.L. Zhou. 2012. Intensity Allocation Criteria of Carbon
Emissions Permits and Regional Economic Development in China—Based on a 30-
Province/Autonomous Region Computable General Equilibrium Model. Advances in
Climate Change Research 3(3): 154–62.
Zetterberg, L., A. Marcu, and C. Munnings. 2014. Carbon Markets—Where Are We Heading?
Draft Working Paper. Swedish Environmental Research Institute: Stockholm, Sweden.
Zhang, B., Zhang, H., Liu, B. and J. Bi. 2013. “Policy Interactions and Underperforming
Emission Trading Markets in China”. Environmental Science and Technology 47: 7077-
84.
Zhang, D., V.J. Karplus, C. Cassisa, and X. Zhang. 2014. Emissions Trading in China: Progress
and Prospects. Energy Policy. Available online in April.
Zhang, L. 2013. China’s Pilot Carbon Trading Schemes: Assessment and Lessons from EU.
Masters Thesis. Norwegian School of Economics: Bergen Area, Norway.
Zhang, Y. 2014. New Version of Air Pollution Law Would Impose Heavier Fines. China Daily,
11 September.
Zhang, Z.X. 2014. Programs, Prices and Policies Towards Energy Conservation and
Environmental Quality in China. Nota Di Lavoro 60. Milan, Italy: Fondazione Eni Enrico
Mattei.