Embed Size (px)
Citation preview

Assessing the Economic Impacts of Assessing the Economic Impacts of Architectural DecisionsArchitectural Decisions
Carnegie Mellon University
Software Engineering Institute
© 2001 by Carnegie Mellon University
Rick [email protected]
Software Engineering Institute
Carnegie Mellon University

A Holistic Approach to Architecture Analysis and Design
Why do I use the word “holistic”?
Definition:
1. Emphasizing the importance of the whole
© 2001 by Carnegie Mellon University
1. Emphasizing the importance of the whole and the interdependence of its parts.
2. Concerned with wholes rather than analysis or separation into parts.

How is this Relevant?
We have been doing architectural analyses (using SAAM and ATAM) for years.
In the ATAM we analyze architectural tradeoffs: performance vs. modifiability vs. security vs. availability...
© 2001 by Carnegie Mellon University
vs. security vs. availability...
But the biggest tradeoffs always have to do with economics.
When we neglect economics we neglect the hardest part of the problem.

Investments
In any investment you should consider the:– Potential benefit
– Cost
– Risk/uncertainty
How do we quantify these when the
© 2001 by Carnegie Mellon University
How do we quantify these when the investment is software?
The CBAM (Cost Benefit Analysis Method) extends the ATAM framework to elicit and model costs, benefits, and uncertainty.

Context for the Work
Business Architecture
P
A
P
A
ATAM gives us this
© 2001 by Carnegie Mellon University
BusinessGoals
ArchitectureDecisions
A
S
M
$ Benefit $
$ Cost $
A
S
M
CBAM’s Goal: Elicit theseand maximize difference
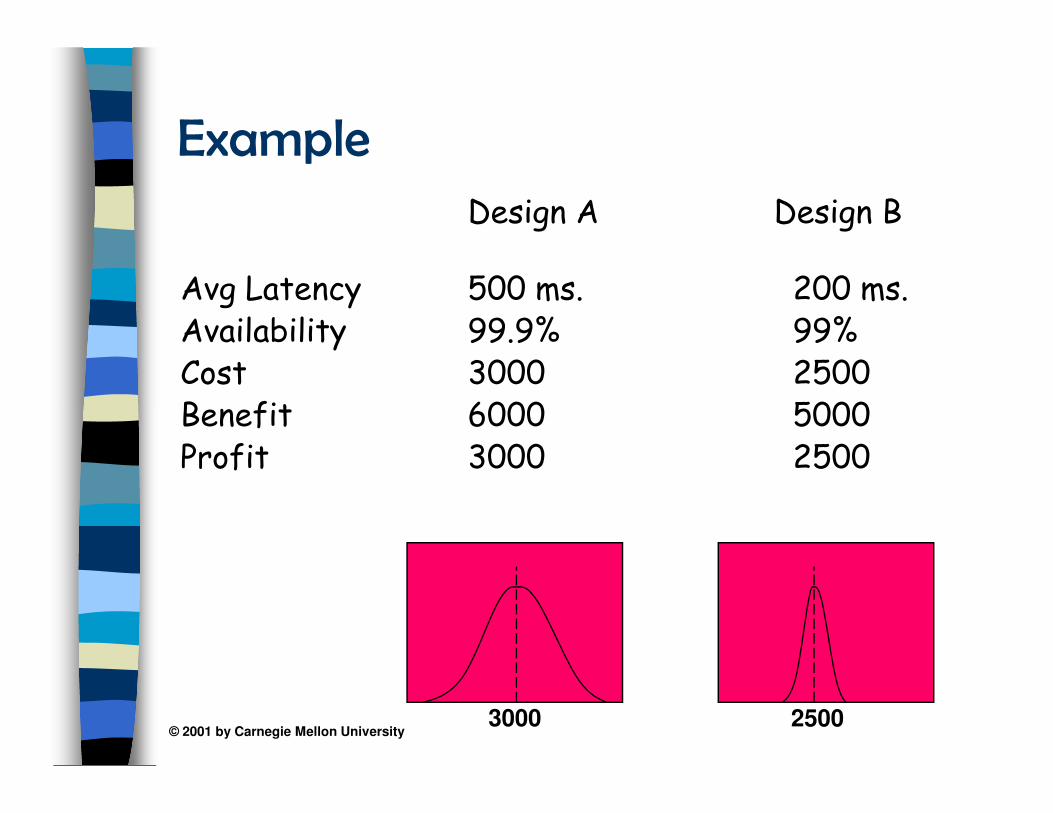
Example
Design A Design B
Avg Latency 500 ms. 200 ms.Availability 99.9% 99%Cost 3000 2500Benefit 6000 5000
© 2001 by Carnegie Mellon University
Benefit 6000 5000Profit 3000 2500
3000 2500

Ramifications of the Example
This example is, of course, over-simplified.However, even this simple example brings up complex issues:– What architectural decisions achieve these responses? What is their risk/uncertainty?
– How risk averse are you?
© 2001 by Carnegie Mellon University
– How risk averse are you?– How do you assess your level of uncertainty?– How do you compare the value of different system qualities?
– What are the personnel/schedule implications of the architectural decisions?

The CBAM
The aim of the CBAM (Cost Benefit Analysis Method) is:
To explicitly associate costs, benefits, and uncertainty with architectural decisions, as
© 2001 by Carnegie Mellon University
uncertainty with architectural decisions, as a means of optimizing the choice of such
decisions.

Dealing with Uncertainty
There are three functions that we must elicit when we do architecture-based economic modeling:– Architecture -> Quality Attribute
– Architecture -> Cost
© 2001 by Carnegie Mellon University
– Architecture -> Cost
– Quality Attribute -> Benefit
Each of these functions has uncertainty associated with it.
We must elicit and record this uncertainty.

Building Upon ATAM
When the CBAM commences, the ATAM must have the following information documented:
The system’s architecture-level design� The prioritized business goals of the system
© 2001 by Carnegie Mellon University
� The prioritized business goals of the system
� The technical and business constraints
� A ranking of the scenarios
� The identification of the technical architectural decisions that are sources of uncertainty/risk in the existing architecture

The Steps of the CBAM
Starting from this base, we then execute the steps of the CBAM (simplified):
1. Collate, Refine, and Prioritize Scenarios2. Assign Intra-Scenario Utility3. Develop Architectural Strategies and
Determine their Utility
© 2001 by Carnegie Mellon University
3. Develop Architectural Strategies and Determine their Utility
4. Calculate an Architectural Strategy’s Costs, Benefits, & Schedule Implications
5. Confirm with Intuition6. Make Decisions

The Phases of the CBAM
Typically making architectural decisions involves a significant amount of effort.
To attempt to optimize the use of our time in the CBAM, we split it into several phases:– Triage, where we quickly choose a set of
© 2001 by Carnegie Mellon University
– Triage, where we quickly choose a set of architectural decisions to consider.
– Detailed Examination, where we more carefully consider the costs, benefits, and interactions of a subset of the architectural decisions.

1. Collate, Refine, and Prioritize Scenarios(To make architecture investment decisions, we begin by asking what system scenarios are important for the business goals.)
Collate the scenarios elicited during the ATAM exercise.
© 2001 by Carnegie Mellon University
ATAM exercise.
Prioritize based on satisfying the business goals of the system and choose the top 1/3 for further study.

1. Collate, Refine, and Prioritize Scenarios
Example:
S22: After 24 hours of downtime, operations re-prioritizes workload to ensure tasks are worked off in priority order.
– S/R: System able to re-prioritize 1000 orders in 20 minutes by user class, data types, media type, destination or user (and work off backlog in accordance with these priorities).
© 2001 by Carnegie Mellon University
backlog in accordance with these priorities).
S25: Increase the workload up to and beyond max load. Do not degrade throughput & response time for registered users.
– S/R: Maintain 24 hour response time for high priority orders while supporting a 2-fold data volume over 90 days without operations intervention.
S28: Workload from one provider exceeds its rated input. System handles variations in data arrival from with max throughput and minimal operator intervention.
– S/R: Able to support 2X spike in data volume without operations intervention and work off in priority order.

1. Collate, Refine, and Prioritize ScenariosRefine the scenarios focusing on their stimulus/response measures.
Elicit the worst, current, desired and best quality attribute (QA) level for each scenario.
Example: for S22 Backlog Management;
© 2001 by Carnegie Mellon University
scenario.Example: for S22 Backlog Management; system can re-prioritize 1000 orders in:
Worst
Case
Current
Case
Desired
Case
Best
Case
120 min 40 min 20 min 10 min

1. Collate, Refine, and Prioritize ScenariosAllocate 100 votes to each stakeholder and have them vote on the scenarios.
Total the votes and choose the top 50% of the scenarios for further analysis.
Example:
© 2001 by Carnegie Mellon University
Example:Scenario # of Votes
22 34
25 18
18 12
36 12
19 10
4 8

2. Assign Intra-Scenario Utility
(How do we compare the various scenarios? We need a shared measure of goodness. We use “utility”.)
Determine the utility for each response level (worst case, current, desired, best case).
© 2001 by Carnegie Mellon University
(worst case, current, desired, best case).
Example (S22):
Worst
Case
Current
Case
Desired
Case
Best
Case
0 80 90 100
120 min 40 min 20 min 10 min

2. Assign Intra-Scenario Utility
Note that in this step we are converting from technical measures (latency, mean time to failure, # of requests served per minute, etc.) to generic measures of goodness.
© 2001 by Carnegie Mellon University
This key step supports holism.
Worst
Case
Current
Case
Desired
Case
Best
Case
0 80 90 100
120 min 40 min 20 min 10 min

3. Develop Architectural Strategies and Determine their UtilityDevelop ASs that address the chosen scenarios. Determine the response levels that result from implementing these ASs.
Call these the “expected” levels. We can interpolate their utility values.
© 2001 by Carnegie Mellon University
Arch Strategy
Worst
Case
Current
Case
Expected
Case
Desired
Case
Best
Case
RM80 120 40 32.5 20 10

3. Develop Architectural Strategies and Determine their UtilityWhat have we elicited and developed here? A response/utility curve!
Ub
de
Scenario 22
© 2001 by Carnegie Mellon University
Rw
d
ce
10 20 30 40 50 60 70 80 90 100 110 120

3. Develop Architectural Strategies and Determine their UtilityThese curves will be different for different scenarios.
Ub
d Scenario 28
© 2001 by Carnegie Mellon University
R
w
d
c
e
3 2 1

4. Calculate an Architectural Strategy’s Costs, Benefits, & Schedule Implications
Calculate the expected benefit of each architectural strategy ASi.
For each scenario where ASi is used:
– calculate the relative improvement in utility as
© 2001 by Carnegie Mellon University
– calculate the relative improvement in utility as the difference between the ‘current’ level and the ‘expected’ level.
– normalize this benefit amount using the votes collected in step 1
– sum these normalized values

4. Calculate an Architectural Strategy’s Costs, Benefits, & Schedule Implications
AS Scenario Benefit Votes Normalized Benefit
Total Benefit
RM80 22 7.5 34 255
RM80 25 8.0 18 208
© 2001 by Carnegie Mellon University
RM80 18 3.75 12 45 508
RM20 4 5.0 8 40
RM20 19 16.5 10 165 205
RM120 28 31.0 6 186 186
RM100 36 12.0 12 144 144

4. Calculate an Architectural Strategy’s Costs, Benefits, & Schedule Implications
Calculate the expected cost of implementing each architectural strategy ASi that results in the expected benefit.
Estimate the schedule implications of each AS in terms of person-months of effort
© 2001 by Carnegie Mellon University
Estimate the schedule implications of each ASi in terms of person-months of effort and/or elapsed time. – Note any contention for shared resources among these estimates (hardware, software, or personnel).

4. Calculate an Architectural Strategy’s Costs, Benefits, & Schedule Implications
Now we can calculate the return (ROI) on each AS investment, and its rank.
AS Benefit Cost Return Rank
© 2001 by Carnegie Mellon University
AS Benefit Cost Return Rank
RM80 508 120 4.83 2
RM20 205 40 5.12 1
RM120 186 85 2.19 3
RM100 144 110 1.31 4

5. Confirm With Intuition
Each of these steps involves stakeholder input, and hence subjectivity.
To ensure that the results are well-founded we examine the results, with respect to the business goals of the system.
© 2001 by Carnegie Mellon University
the business goals of the system.If the results conflict with intuition we need to determine if there are other issues that have not been considered while making these decisions.

5. Confirm With Intuition
An important aspect to consider is at this point is the uncertainty associated with the benefit and cost judgements.
We capture uncertainty as statistical measures of the variation in judgements
© 2001 by Carnegie Mellon University
measures of the variation in judgements among the stakeholders.

6. Make Decisions
The benefits and costs can now be plotted.
© 2001 by Carnegie Mellon University
Cost
Benefit

6. Make Decisions
The benefits and costs can now be plotted. We can also plot their associated uncertainty.
© 2001 by Carnegie Mellon University
Cost
Benefit

6. Make Decisions
Some ASs must be chosen. Remove these from consideration.
© 2001 by Carnegie Mellon University
Cost
Benefit

6. Make Decisions
Now consider the set of high benefit, low cost ASs.
© 2001 by Carnegie Mellon University
Cost
Benefit

6. Make Decisions
Some of these may be excluded because of resource or time-to-market conflicts.
© 2001 by Carnegie Mellon University
Cost
Benefit
xx

The Final Result
Choose a final set. Some decisions may be in/excluded because of dependencies.
© 2001 by Carnegie Mellon University
Cost
Benefit

The Final Result
After this exercise, we have determined a set of architectural strategies that address our highest priority scenarios.
These chosen strategies furthermore represent the optimal set of architectural investments.
© 2001 by Carnegie Mellon University
investments.
They are optimal based upon considerations of:– benefit– cost– schedule– uncertainty

Status
The CBAM v1 was developed in 2000. We are now developing and piloting CBAM v2. What has been presented here is a simplification of the steps of CBAM v2.
We are piloting the CBAM v2 with NASA’s EOSDIS project:
© 2001 by Carnegie Mellon University
We are piloting the CBAM v2 with NASA’s EOSDIS project:– 1.1 million lines of custom code– 12,000 modules – 50 COTS products

Status
The early results from our pilot are encouraging:– We have achieved considerable consensus from the stakeholders.
– We have provided a means for them to focus their attention and discussion.
© 2001 by Carnegie Mellon University
their attention and discussion.– They have dramatically reduced the size and complexity of their decision space.
– We have given them a disciplined technique for determining a set of architectural strategies to pursue that are within budget and schedule constraints.

Conclusions
The CBAM is a method for optimizing architecture investment decisions, considering cost, benefit, and uncertainty.
It augments the ATAM and starts where the ATAM leaves off: the ATAM allows one to analyze quality attributes; the CBAM adds
© 2001 by Carnegie Mellon University
ATAM leaves off: the ATAM allows one to analyze quality attributes; the CBAM adds costs and benefits as attributes to be “traded off”. This is holistic.
The CBAM helps stakeholders prioritize changes to an existing architecture, or consider strategies for a new architecture.

Challenges for the Future
Extracting/validating information: e.g. Delphi technique
Cost modeling that is “architecture aware”Incorporating portfolio theoryExplicitly dealing with uncertainty
© 2001 by Carnegie Mellon University
Explicitly dealing with uncertaintyCreating generic quality attribute/benefit characterizations
Balancing decision making considerations: time frame, risk aversion, personnel availability…

© 2001 by Carnegie Mellon University