Embed Size (px)
Citation preview

1
Assessing the Effects of Advanced Placement Policies
Lauren Linzmeier
May 2012
Mathematical Methods in the Social Sciences Northwestern University
Advisor: Professor Kirabo Jackson
Abstract This thesis investigates whether Advanced Placement policies achieve their goals of increasing AP enrollment and improving college outcomes. Using aggregate longitudinal data on AP exam taking, college enrollment, and college graduation rates from all 50 states, I find that very few types of AP policies work to increase AP exam taking or improve college outcomes. However, two of the most costly AP policies, financial incentives for exam performance and national AP incentive grants, do seem to increase AP exam taking. Several sources of bias in the college graduation rate data prevent me from drawing decisive conclusions regarding the effect of AP policies on college graduation rates, but I find little evidence to suggest that any AP policies work to increase college persistence.
Acknowledgements This thesis would not have been possible without the support of several outstanding faculty members. I would like to thank Professor Jackson for serving as my advisor and helping me through the conceptual and analytical portions of this project. Professor Canay provided invaluable econometric guidance, and Professor Witte sacrificed countless hours to help me see this thesis to its conclusion. I would also like to thank Professor Figlio for his guidance, inspiration, and mentoring throughout my time at Northwestern.

2
I. INTRODUCTION
Expanding access to advanced placement programs would provide more disadvantaged high school students the opportunity to take challenging courses so that they will enter college or the global marketplace ready to excel. — U.S. Secretary of Education Margaret Spellings, February 2006
Since its inception in 1955, the Advanced Placement (AP) program has captured the
attention of policymakers who believe exposing students to rigorous Advanced Placement
classes will increase high school achievement and college success. State education policies
since the 1980s have focused on expanding access to AP coursework, especially among
disadvantaged students, and improving AP course quality and exam performance. In the 1980s,
some states began mandating AP offerings, tied accountability incentives to AP participation
rates, and subsidized student test fees. More states followed suit in the 1990s and 2000s, and
President Bush in his 2006 State of the Union Address pledged to expand the Advanced
Placement program as a key component of his American Competitiveness Initiative.
Various state and national polices aim to increase participation in the Advanced
Placement program in the hopes that the program will prepare students for advanced coursework
and increase college success. While some of these policies require no additional funding, others
are quite expensive. In 2011, the United States Department of Education spent over $23 million
funding its Advanced Placement Test Fee Program, and yearly appropriations for the National
AP Incentive Program have ranged between $18 and $31 million. The high costs of some of
these policies and programs beg the question: which, if any, effectively increase participation on
the AP program? More importantly, do any of these policies work through the AP program to
better prepare students for college and increase college enrollment or graduation rates?
This thesis investigates whether cohorts of high school students in states subject to AP
policies increase their AP exam taking, perform better on AP exams, and ultimately have higher
3
college enrollment and graduation rates using a differences-in-differences approach. Using
aggregate data from 1994-2009, I find that having financial incentive programs funded either by
the state or national government increases AP exam taking and AP exam performance, indicating
that AP polices can successfully increase AP participation, but I find little evidence these AP
policies successfully increase college enrollment and graduation rates.
The paper proceeds as follows. The following section (II) reviews prior literature on the
effects of the AP program and AP policies on college outcomes. Section III provides some
background on the AP program and state and national AP policies. Section IV describes the data,
while section V presents the empirical approach and results. Section VI summarizes the key
findings and discusses their implications.
II. LITERATURE REVIEW
Due to the popularity of the AP program, many researchers have been interested in the
effects of AP participation on high school and college outcomes. Some literature links success in
the AP program with improved college outcomes. Even after controlling for high school rank,
SAT score, and pre-college criteria, students with advanced placement credit earn higher first
semester college grades than students without advanced placement credit (Keng & Dodd, 2008;
Hargrove, Godin, & Dodd, 2008; Scott, Tolson, & Lee 2010). Taking AP courses also increases
the likelihood that a student will graduate from a four-year college or university within six years
(McCauley, 2007; Hargrove, Godin, & Dodd 2008) and earn a graduate degree (Bleske-Rechek,
Lubinksi, & Benbow 2004).

4
However, a few researchers question the benefits of AP participation. Klopstein &
Thomas (2009) find that after controlling for a student’s non-AP curricular experience, AP
participation does not predict college grades or persistence. Geiser & Santelices (2004) find that
while satisfactory performance on AP exams predicts improved college outcomes, merely taking
an AP course has no effect on college performance. This is likely because students who do not
feel prepared to take the AP exam have not mastered the course material or significantly
improved their academic abilities in the course. Hallett & Venegas (2011) suggest that
expanding access to the AP program is not sufficient to improve college outcomes of
disadvantaged students if students do not perform well in the courses. Johnson (2004) argues
that allowing promising high school students to use Pell grants to take actual college courses
would be a more cost-effective way to increase college level opportunities for low-income
students than AP incentive policies.
Very few studies have looked at the effects of state Advanced Placement policies
directly. Of the two recent studies that have, each has adopted a different approach than this
analysis. Jackson (2010) uses high-school level data, urbanicity data, college enrollment data,
and a listing of schools participating in the Texas Advanced Placement Incentive Program by
year in order to evaluate the effects of the Texas Advanced Placement Incentive Program. He
finds that the program, which pays students and teachers for passing grades on AP exams, results
in more AP course and exam taking, increases SAT/ACT scores, and promotes college
matriculation. His more recent NBER working paper analyzes longer-term outcomes. In this
paper, Jackson (2010) finds that the incentive program increases college GPAs, increases college
persistence, and increases college graduation rates for black and Hispanic students.

5
By contrast, another study considers AP policies across all states. Jeong (2009) analyzes
microdata from the National Educational Longitudinal Study of 2002 to determine whether test
fee waivers or performance-based incentives increase AP participation and success. He
concludes that test fee subsidies successfully increase the probability that a student will take an
AP exam while performance-based incentives have little or no effect. This seems to conflict
with Jackson’s findings that performance-based incentives are quite effective. Because Jeong
(2009) only has data points from 2002, he is unable to control for state fixed effects, though he
does control for regional effects. Moreover, he only investigates the effect of fee waivers and
performance incentives on AP exam taking and performance in four popular AP subjects rather
than long-term college outcomes.
The analysis in this paper uses aggregate statistics on AP performance by state for 1994-
2009. Analysis of this panel data avoids some the problems Jeong (2009) encountered.
Dramatically different trends between neighboring states with similar policy profiles suggest that
state level fixed effects are necessary for valid identification, and this analysis controls for state
fixed effects. Moreover, this data set allows for an examination of more than just test fee waivers
and performance-based incentives. In fact, this analysis considers ten different types of
Advanced Placement policies. Finally, looking at data on college enrollment rates and college
graduation rates provides useful insight about the long-term effects of AP policies.
III. BACKGROUND
Description of the Advanced Placement Program
Educators widely praise the Advanced Placement (AP) program for giving students the
opportunity to take advanced coursework. The Advanced Placement program has become

6
increasingly popular over the past several decades and consists of 34 courses and corresponding
exams. The College Board, a not-for-profit organization, regulates the Advanced Placement
program by publishing course descriptions, approving audits from AP instructors, and creating
and scoring AP exams. Though it is possible for students to prepare for an AP exam on their
own, most students take an AP course at their local high school prior to taking the corresponding
exam in May. The College Board charges $87 for each exam but offers a partial test fee waiver
for low-income students.
Overview of State Policies1
In response to the perceived benefits of Advanced Placement, some states have
implemented a wide range of policies to support the program’s growth and encourage student
participation. These policies can be roughly divided between those that target schools and
districts and those that appeal to students directly. Policies targeting schools and districts include
mandating the offering of AP courses, financial exam performance-based incentives,
accountability incentives, offering funds for teacher training, mandating teacher training, and
policies to encourage collaboration between colleges and universities and K-12 districts. Policies
targeting students include AP exam fee subsidies and guaranteeing credit at state colleges for
qualifying AP scores.
The policies targeting districts and schools mandate the expansion of the AP program,
offer financial assistance, or create financial or accountability incentives. For instance,
Arkansas, Indiana, West Virginia, and South Carolina mandate that all high schools offer a
minimum number of AP courses in an effort to expand access to low-income and minority
1 Based on the Education Commission of the State’s State Notes Advanced Placement Report 2 See the Elementary and Secondary Education Act of 1965, as amended, Title I, Part G, Sec. 1704-05

7
students whose schools tend to offer fewer AP courses. Other states offer financial assistance for
AP development at low-income and small schools. This assistance usually consists of grants to
purchase textbooks and classroom materials. Additionally, some states offer rewards to schools
with high numbers of students who complete AP courses and/or receive at least a 3 on the exam.
Some states also hold schools accountable for their AP performance. Colorado and Michigan tie
AP offerings to accreditation while fifteen other states include AP participation as part of the
district, school, or state’s report cards and accountability ratings. Meanwhile, some states
require schools and districts to publish statistics on AP performance.
States have also enacted measures to improve the quality of the AP instruction. Eleven
states have adopted policies to encourage collaboration between higher education institutions and
K-12 schools in offering AP courses. Twenty-seven states make funds available for AP teachers
to attend summer institutes and other AP or pre-training programs while five states mandate that
AP teachers complete AP training.
The remaining policies appeal to students directly. In addition to the fee reduction the
College Board makes available to free and reduced price lunch students, states use additional
U.S. Department of Education funds to subsidize AP exams. In some states, these subsidies are
available to low-income students only while other states allow higher income students who are
taking multiple AP exams to benefit from the funds. Moreover, the amount of the subsidy varies
between states. Finally, some states guarantee college credit at in-state institutions to any student
who scores a three or higher on the AP exam for a subject.
Overview of National Policies
The national government has also implemented policies to support the expansion of the
Advanced Placement program. These policies generally involve grants to individual states. For
8
instance, Congress authorized the federal AP fee assistance program in the 1992 Higher
Education Act. However, the program was not funded until the 1998 fiscal year when thirty-two
states received federal monies. This program continued until 2007 when it was replaced by the
Advanced Placement Test Fee Program2 which awards grants to state agencies for the purpose of
reimbursing low-income students enrolled in AP courses who take AP exams. This program
granted awards starting in 2008 and appropriations have increased over time from $11,507,910
in 2008 to $23,343,981 in 2011. Meanwhile, the Advanced Placement Incentive Program
provides three year competitive grants to State educational agencies, local educational entities, or
national nonprofit educational entities to increase the participation of low-income students in the
AP program. Entities must use the grants to fund professional development for teachers, develop
curriculums, purchase books and supplies, or “develop, enhance, or expand” AP or pre-AP
courses. Preference is given to entities that demonstrate a “pervasive need for access to advance
placement programs,” “assure the availability of matching funds,” and “provides for the
involvement of businesses and community organizations.” This program has granted new awards
or continued awards every year since 2001 with yearly appropriations ranging between
$18,410,799 and $31,573,442.
Two Dimensions of Policy Variation: Content and Timing
This analysis exploits variation in the timing and content of Advanced Placement policies.
States without particular policies in particular years serve as controls. Among states who have
implemented AP policies, there is substantial variation in the timing of the policies and their
content. See Appendix A for a summary of variation in the timing and content of AP policies.
2 See the Elementary and Secondary Education Act of 1965, as amended, Title I, Part G, Sec. 1704-05

9
Coding State Policies
While there are subtle variations even among policies of a given type, drawing any
conclusions requires roughly categorizing AP policies. For the purposes of this analysis, I code a
policy as one of ten policy types: (1) equipment or instructional grants to establish AP courses,
(2) mandating AP course offerings, (3) accountability incentives, (4) subsidies for AP exam fees,
(5) mandating or funding teacher training and professional development, (6) mandating credit for
passing AP exam scores at in-state institutions, (7) collaboration between K-12 and higher
education institutions, and (8) financial incentives for AP exam performance. I code the two
national policies as (9) test fee reductions funded by the U.S. Department of Education or (10)
AP incentive grants. States in a particular year are coded as having a particular policy if the
policy was in effect during that exam year or if they received grant money under one of the two
national policies in that exam year.3 For example, if a particular policy began in 2001-2002, it is
coded as beginning in 2002 since we would expect the policy to have an effect on the 2002 AP
exam period in May, not during the AP exam period of the previous school year when the policy
was not in effect.
IV. DATA
This analysis uses four datasets in addition to the dates of implementation for various AP
policies. The first dataset consists of Advanced Placement data. This panel of data, constructed
from aggregate totals in publically available College Board state summary reports, gives the
number of students who took AP exams and the total number of AP exams taken for every year
3 Determining the date of implementation for these policies is sometimes quite difficult. The Education Commission of the States database on AP policies was used whenever possible. When the ECS sources provide no date, Lexus-Nexus or U.S. Department of Education data was used.

10
between 1994 and 2009, inclusive, by state. Note that these data cannot be used to determine
how many students took AP courses but did not take any AP exams. Consequently, this data can
only be used to investigate whether particular policies increased AP exam taking, not whether
they increased the number of students enrolling in Advanced Placement. However, given that
prior research finds that only students who opt to take the exam benefit from AP participation
(Geiser & Santelices 2004), this exam taking data is of the most interest.
The second dataset from the Common Core of Data and the National Center for Education
Statistics consists of educational statistics for state/year cohorts between 1994-2009. These data
give the number of 11th and 12th grade students, the number of black students in 12th grade, the
number of white students in 12th grade, the number of Hispanic students in 12th grade, average
expenditure per student, and number of students eligible for free lunch. I use these totals to
construct controls for each cohort and variables that give the number of AP students and AP
exams per 1,000 high school juniors and seniors for 1994-2009.
The third dataset provides information on AP exam performance. The National Center for
Higher Education Management Systems constructed a dataset from the College Board state
summary reports which gives the number of AP exams scores at 3 or above per 1,000 high
school juniors and seniors by state for 1998-2003. Since it may be that some AP policies
improve AP course quality (and thus increase the number of AP exams scored three or higher)
but do not increase the number of students choosing to take an AP exam, this dataset will capture
different effects than the first AP dataset.
Finally, a fourth dataset consists of three different college outcomes by state and year: the
enrollment rate, the three-year graduation rate for associate’s students, and the six-year

11
graduation rate from bachelor’s students.4 The enrollment rate for state X is defined as the
number of first-time freshman who graduated from high school in the past year in state X
enrolled anywhere in the U.S. This reflects the college going rate of graduating high school
seniors in a particular state and year. The three-year graduate rate of associate’s students is
defined as the percentage of first-time full-time associate degree-seeking students earning any
formal award (certificate or associates degree) within three year at a Title IV degree-granting
institutions between 1997 and 2009 inclusive. Thus, these data correspond to the 1994-2006
high school senior cohorts in each state, assuming that all the first-time associate’s degree
seeking students enrolled in the fall immediately after their high school graduation. The six-year
graduation rate of bachelor’s students is defined as the percentage of first-time full-time
bachelor’s degree-seeking students earning any formal award (certificate, associate, or bachelors
degree) within six years at a Title IV degree-granting institution between 1997 and 2009,
inclusive. Thus, these data correspond to 1991-2003 high school senior cohorts in each state,
assuming that all the first-time bachelor’s seeking students enrolled in the fall immediately after
their high school graduation.
In the analysis that follows, I attempt to estimate the effect of an AP policy on the
eventual college graduation rate of a cohort of high school seniors subject to that policy. To do
this, I look at the graduation rates of the college cohorts in the state and year the fall after that
senior cohort graduated. There are three obvious problems with this approach. First of all,
neither of these graduation rates account for transfers across institutions. If one state has a larger
percentage of students transferring than another, all else equal, this state will have a lower
graduation rate in this data. Moreover, this data may suffer from systematic reporting bias.
4 The National Center for Higher Education Management Systems compiled this data from the National Center for Education Statistics Integrated Postsecondary Education Data System Graduation Rate Survey.

12
Anywhere between 33% and 100% of the institutions in a particular state responded to the
IPEDS Graduation Rate Survey. It may be that institutions with the highest graduation rates are
those most likely to respond to the survey. In this case, the data may not accurately reflect actual
college graduation rates. Finally, using this graduation rate data to evaluate the effects of AP
policies on the eventual graduation rates of particular cohorts relies on two strong assumptions. It
assumes that seniors enroll immediately in the fall after their high school graduation and attend
an institution in the same state as which they attended high school. Obviously, many students
take a gap year between high school and college or choose an out of state institution. I include
estimates for the effect on graduation rates for illustrative purposes, but due to the problems
outlined above, these results should be interpreted cautiously.
Before presenting my empirical results, I discuss possible trending in my AP and college
outcomes data.
Trends in the National AP Data
Nationally, the number of students taking at least one AP course has increased
exponentially since 1973 when the College Board began reporting enrollment data. The number
of students who took at least one AP exam ranges from 53,902 in 1973 to 1,802,144 in 2010. The
total number of schools with students who took AP exams has also increased every year from
3,114 in 1973 to 16,699 in 2010. The number of AP exams scored 3 or higher per 1,000 high
school juniors and seniors has also increased every year between 1997 and 2007, the years for
which data is available.
Trends in National College Enrollment and Graduation Rate Data

13
College enrollment rates have been generally increasing over time as shown in figure 2.
In 1992, the college enrollment rate was 52%. The rate increased until 2000 and then slipped
slightly before increasing monotonically to 62.5% in 2008. Graduation rates have fluctuated over
time nationally, though they seem to be generally increasing as shown in figure 3. The 1992 and
1993 high school senior cohorts had the lowest graduation rates during the thirteen-year period
with 52% of the cohort earning a bachelor’s degree within six years. Very few states had any AP
policies during this period. Whether due to the expansion of the AP program or other factors,
graduation rates increased in the following period. They peaked at 56.4% for the 2000 cohort,
but declined for each of the three subsequent cohorts.
V. EMPIRICAL RESULTS
I. Effect of an AP Policy
The first part of this empirical analysis compares states with no Advanced Placement policies
to states that have at least one AP policy in order to determine whether Advanced Placement
policies successfully increase the number of students who participate in the AP program,
improve AP exam performance, and ultimately increase college going or college graduation
rates. A state is considered to have an AP policy in a given exam year if they have any of the
eight state AP policies or receive grant money under either national AP policy.
Before presenting the results of more rigorous regression analysis, I present a few illustrative
figures. Figure 1 examines the relationship between number of states with AP Policies and
number of AP students. First, I plot the number of students who took at least one AP test per

14
1,000 high school juniors and seniors for 1991-20035. Below this, I plot the number of states
with any AP policy in those years. While the number of states with AP policies fluctuates
somewhat, over the entire period, the number increases from 7 to 42. Meanwhile, the number of
AP students per 1,000 high school juniors and seniors increases monotonically. At first glance,
this figure suggests that AP policies may increase the number of students who take AP exams.
However, it is notable that the number of students who take AP exams does not decrease when
the number of states with AP policies decreases in 2001 and 2002. It could be that AP exam
taking is increasing over this period for reasons other than AP policies.
In figure 2, I plot the number of states with AP policies against the college enrollment rate. A
drop in the number of states with AP policies corresponds to a drop in the college enrollment rate
between 2000 and 2002, but in all other years in the 1992-2008 period, both are increasing
monotonically. This figure associates greater AP policy implementation with increases in the
college enrollment rate. Of course, rigorous regression analysis with some identifying
assumptions will be needed to test a casual claim.
In figure 3, I plot the number of states with AP policies against the college graduation rate
nationally. During the period 1991-2000, both the number of states with AP policies and the
college graduation rate is increasing. Then in 2001-2002, both drop. In 2003, the number of
states with AP policies increases again, but the college graduation rate continues to fall. Once
again, it is hard to draw a definitive conclusion regarding the relationship between the two
variables, but overall, both seem to be increasing during this time period.
Finally, I break down the data by state. For figure 4, I compute the change in the college
enrollment rate from 1996 to 2008 for each state as well as the number of years during the period
that each state had at least one AP policy in effect. For figure 5, I compute the change in the 5 I present the 1991-‐2003 time period so that this figure can be directly compared with figure 3.

15
college graduation rate from 1991 to 2003 for each state as well as the number of years during
the period that each state had at least one AP policy in effect. Figures 4 and 5 present
scatterplots of these relationships. If AP policies increase college enrollment or graduation rates,
there should be evidence of a positive correlation. Figure 4 shows a positive correlation, which is
consistent with the idea that AP policies increase college enrollment. By contrast, figure 5
shows no correlation; the best fit line is horizontal. This suggests that AP policies do not
increase college graduation rates.
Of course, these figures make no effort to control for differences between states with and
without AP policies along other dimensions. Perhaps states who pass AP policies tend to be
states with student populations more or less amiable to the AP program or states with student
populations more or less able to take AP exams and perform well. In order to control for
differences along other dimensions, I estimate two regression model specifications using OLS:
1 𝑦!" = 𝛽!𝑎𝑛𝑦𝐴𝑃𝑝𝑜𝑙𝑖𝑐𝑦!" + 𝛿!"𝐶𝑜𝑛𝑡𝑟𝑜𝑙𝑠 + 𝛼! + 𝜀!"
2 𝑦!" = 𝛽!𝑎𝑛𝑦𝐴𝑃𝑝𝑜𝑙𝑖𝑐𝑦!" + 𝛿!"𝐶𝑜𝑛𝑡𝑟𝑜𝑙𝑠 + 𝛾! + 𝛼! + 𝜀!"
The dependent variable is 𝑦!" denotes an AP outcome or college outcome for state s in year t.
The AP outcomes I investigate are APstudents, APexams, and exams3above. APstudents denotes
the number of students who took at least one AP exam per 1,000 high school juniors and seniors.
APexams denotes the total number of AP exams taken per 1,000 high school juniors and seniors.
Exam3above denotes the number AP exams scored 3 or above per 1,000 of high school juniors
and seniors. Additionally, I investigate several college outcomes: the percentage of graduating
high school seniors that enroll immediately in college the following fall (enrollrate), the
percentage of first-time associate’s degree-seeking students earning a degree within three years
(gradrate3year), and the percentage of first-time, full-time bachelor’s degree-seeking students
16
earning a degree within six years (gradrate6year). These models include one explanatory
variable: 𝑎𝑛𝑦𝐴𝑃𝑝𝑜𝑙𝑖𝑐𝑦!". This explanatory variable is equal to 1 if state s had any one of eight
state AP policies or received grants under either national AP policy in year t and 0 otherwise.6 In
all specifications, I include the following controls for the year/state cohort: percent black, percent
white, percent Hispanic, percent eligible for free lunch, and average educational expenditures per
student. In all these models, 𝜀!" is the idiosyncratic error for state s in year t.
In the first specification, I include year fixed effects (𝛼!) to control for factors affecting AP
or college outcomes across all states in a particular year. These fixed affects should capture the
general trending upward in the AP outcomes data as well as more complicated trends in the
college outcomes data. Then in the second specification, I also add state fixed effects (𝛾!) to
control for differences between states during the time period. There are several reasons to
include a state fixed effect. First of all, states have different high school student populations that
may vary by ability, initial willingness to participate in AP, and familiarity with the AP program.
States also have different teacher populations that may vary in their willingness to teach AP
courses, ability to teach AP courses, and enthusiasm for the AP program. This specification
assumes that all of the factors captured by the state fixed effect are roughly constant over the
time period of analysis.
Table 1 displays the estimates for these two regression models with six different dependent
variables: APstudents, APexams, exams3above, enrollrate, gradrate3year, and gradrate6year.
I code 𝑎𝑛𝑦𝐴𝑃𝑝𝑜𝑙𝑖𝑐𝑦!" as 1 if the policy was in effect when students the year t and state s cohort
6 A state is considered to have an state AP policy if it has any one of the following eight state AP policies: equipment or instructional grants to schools or districts, mandates for AP course offerings, accountability incentives, state AP test fee subsidies (independent of those funding by national test fee reduction grants from the U.S. Department of Education), mandating or providing funds for AP teacher training or professional development, financial incentives for AP exam performance, guaranteeing college credit at public in-‐state Institutions for passing AP exam scores, and collaboration between K-‐12 and higher education systems regarding the AP program.

17
were seniors. Then, I estimate outcomes for that year/state cohort of seniors. Table 1 shows that
point estimates for the effect of 𝑎𝑛𝑦𝐴𝑃𝑝𝑜𝑙𝑖𝑐𝑦 is positive for all three AP outcome variables in
specification 1, and 𝑎𝑛𝑦𝐴𝑃𝑝𝑜𝑙𝑖𝑐𝑦 has a significant effect for both APexams and exams3above.
There seems to be no effect on any college outcomes. Including state fixed effects generally
decreases the magnitude of the point estimates, but now the point estimates for APstudents and
APexams are positive and significant at the 5% level. The estimate for exams3above is positive
but insignificant. There is a surprisingly large and significant effect for the college enrollment
rate, but there is no significant effect for college graduation rates. These point estimates imply
that all else equal, states with at least one AP policy have 8.1 more AP students and 15.8 more
total AP exams per 1,000 high school juniors and seniors and college enrollment rates 2.5%
higher than states without.
In order to test the validity of these results, I run a falsification test. I estimate effects for
cohorts two years before the state’s first AP policy. (I replace 𝑎𝑛𝑦𝐴𝑃𝑝𝑜𝑙𝑖𝑐𝑦!" with
𝑎𝑛𝑦𝐴𝑃𝑝𝑜𝑙𝑖𝑐𝑦!"!! in my regression specifications.) Since this is two years before the real
treatment, I should detect no effects as long as there is no trending in the data that state and year
fixed effects fail to capture. The table below table 2 shows that the data passes this falsification
test. There are no significant effects on AP outcomes or college outcomes in either specification
(1) or (2).
Additionally, I probe the robustness of the finding that AP policies increase AP outcomes
and possibly college enrollment by dropping particular years from the regressions. The size and
significance of the resulting estimates are sensitive to what years are included, though the
estimates are always positive. For example, dropping data from 1994-1997 dramatically reduces
the size of the estimates and makes them insignificant. This is likely because one or two salient

18
AP policies drives the result that AP policies increases AP outcomes and enrollment, and this
particular policy was turning on or off in several states during this 1994-1997 period.7
Next, I move beyond a simple pre/post analysis to investigate the cumulative effects of these
policies. To specification 2, which already includes state and year fixed effects, I add four pre-
policy explanatory variables
(𝑎𝑛𝑦𝐴𝑃𝑝𝑜𝑙𝑖𝑐𝑦!"!! , 𝑎𝑛𝑦𝐴𝑃𝑝𝑜𝑙𝑖𝑐𝑦!"!! , 𝑎𝑛𝑦𝐴𝑃𝑝𝑜𝑙𝑖𝑐𝑦!"!! , 𝑎𝑛𝑦𝐴𝑃𝑝𝑜𝑙𝑖𝑐𝑦!"!!) as well 3 post-policy
explanatory variables (𝑎𝑛𝑦𝐴𝑃𝑝𝑜𝑙𝑖𝑐𝑦!"!! , 𝑎𝑛𝑦𝐴𝑃𝑝𝑜𝑙𝑖𝑐𝑦!"!! , 𝑎𝑛𝑦𝐴𝑃𝑝𝑜𝑙𝑖𝑐𝑦!"!!) to trace the number of
years before or after the state implemented its first AP policy. The base case is five or more
years before the policy. For example, the coefficient 21.9 on 𝑎𝑛𝑦𝐴𝑃𝑝𝑜𝑙𝑖𝑐𝑦!"!! in column (1) means
that a cohort of high school juniors and seniors subject to an AP policy in its third year had on
average 21.9 more AP students than five years before an AP policy, all else equal.
I plot the point estimates for effects on the number of AP students and the college enrollment
rate over time in a graph below table 2. Since none of the coefficients are significant, one should
be wary of drawing sharp conclusions from table 2 or the corresponding graph. However, the
positive and increasing point estimates for third and fourth year of the AP policy suggest that
states may see an increase in number of AP students and college enrollment rates a few years
after AP policy implementation. This is consistent with policy lags, which in the context of state
AP policies seem quite likely. This graph also shows that increases in college enrollment rates
generally correspond with increases in the number of AP students. This suggests some effect on
enrollment rates after several years of AP policies, but since the estimates are not significant,
these results do not provide strong evidence for such a relationship.
7 Later in the paper when I break down the results by particular AP policies, I find evidence that financial incentives and national AP incentive grants drive this result. Of the only five states that have ever implemented financial incentives, 3 began in the 1994-‐1997 time period (Arkansas (1995), Texas (1996), and Oklahoma (1997)). The other two began shortly after (Florida (1998) and Colorado (1999)).

19
II. Effects of Particular State AP Policies
Up until this point, I have lumped all AP policies into a single category. Of course, not all
policies are created equal. Some focus on expanding access to AP; some focus on increasing AP
exam taking, and the remaining policies focus on improving AP quality. For example, national
AP incentive grant recipients must use the funds to increase participation of low-income students
in the AP program, expanding access. Some states provide AP exam test fee waivers to
encourage AP students to take exams at the conclusion of their AP courses, hoping that this will
cause students to work harder to learn the material and earn college credit. Finally, states that
offer funds for teacher training and professional development strive to better equip AP
instructors to offer quality courses.
Various types of incentives may make some policies more effective than others. In the table
below, I list various aspects of AP policies and their corresponding goals. In the analysis that
follows, I attempt to evaluate how well each of the ten types of policies are at achieving the three
AP-related goals of (1) expanding access, (2) increasing AP exam taking, and (3) increase AP
exam performance. In addition, I assess how well each type of policy works to increase college
enrollment and graduation rates.

20
Goal Policies Targeting Schools and Teachers
Policies Targeting Students
Primary AP Outcome of
Interest Encourage
Participation Broadly/Expand
Access (1)
- Reward schools with higher AP enrollments - Include AP enrollment percentages as an accreditation factor - Equipment grants to schools - Require schools to publish AP enrollment statistics - Equipment grants to low-income schools - Mandate course offerings
- Offer weighted grades for AP courses - Offer distance learning and online AP courses - Require parental and student notification of AP offerings
APStudents
Increase AP Exam Taking
(2)
- Require schools to publish rates of exam taking in accountability reports
- Mandate that students take exams to earn course credit - Test fee waivers
APExams
Increase AP Exam Success
(3)
- Require schools to publish AP exam results in accountability reports - Provide funds for teacher training - Mandate teacher training - Financial incentives for teachers - Collaboration between K-12 and higher education
- Guarantee college credit for passing scores at state institutions - Make state scholarships dependent on AP exam performance
Exams3Above
In order to investigate the effects of particular AP policies, I estimate a model very similar to
the specification 2 from part I, except I replace 𝑎𝑛𝑦𝐴𝑃𝑝𝑜𝑙𝑖𝑐𝑦 with 8 variables for the eight types
of state AP policies and 2 variables for the two types of national AP policies. As before, I
include a state and year fixed effects, the model is as follows:
𝑦!" = 𝛽!𝑔𝑟𝑎𝑛𝑡𝑠!" + 𝛽!𝑚𝑎𝑛𝑑𝑎𝑡𝑒𝑜𝑓𝑓𝑒𝑟!" + 𝛽!𝑎𝑐𝑐𝑜𝑢𝑛𝑡𝑎𝑏𝑖𝑙𝑖𝑡𝑦!"+ 𝛽!𝑡𝑒𝑠𝑡𝑠𝑢𝑏𝑠𝑖𝑑𝑖𝑒𝑠!"
+ 𝛽!𝑡𝑒𝑎𝑐ℎ𝑡𝑟𝑎𝑖𝑛!" + 𝛽!𝑓𝑖𝑛𝑎𝑛𝑐𝑒𝑖𝑛𝑐!" + 𝛽!𝑚𝑖𝑛𝑐𝑟𝑒𝑑𝑖𝑡!" + 𝛽! 𝑘12!"
+ 𝛽! 𝑖𝑛𝑐𝑒𝑛𝑡𝑖𝑣𝑒𝑔𝑟𝑎𝑛𝑡!" + 𝛽!"𝑡𝑒𝑠𝑡𝑓𝑒𝑒𝑔𝑟𝑎𝑛𝑡!" + 𝛿!"𝐶𝑜𝑛𝑡𝑟𝑜𝑙𝑠 + 𝛾! + 𝛼! + 𝜀!"
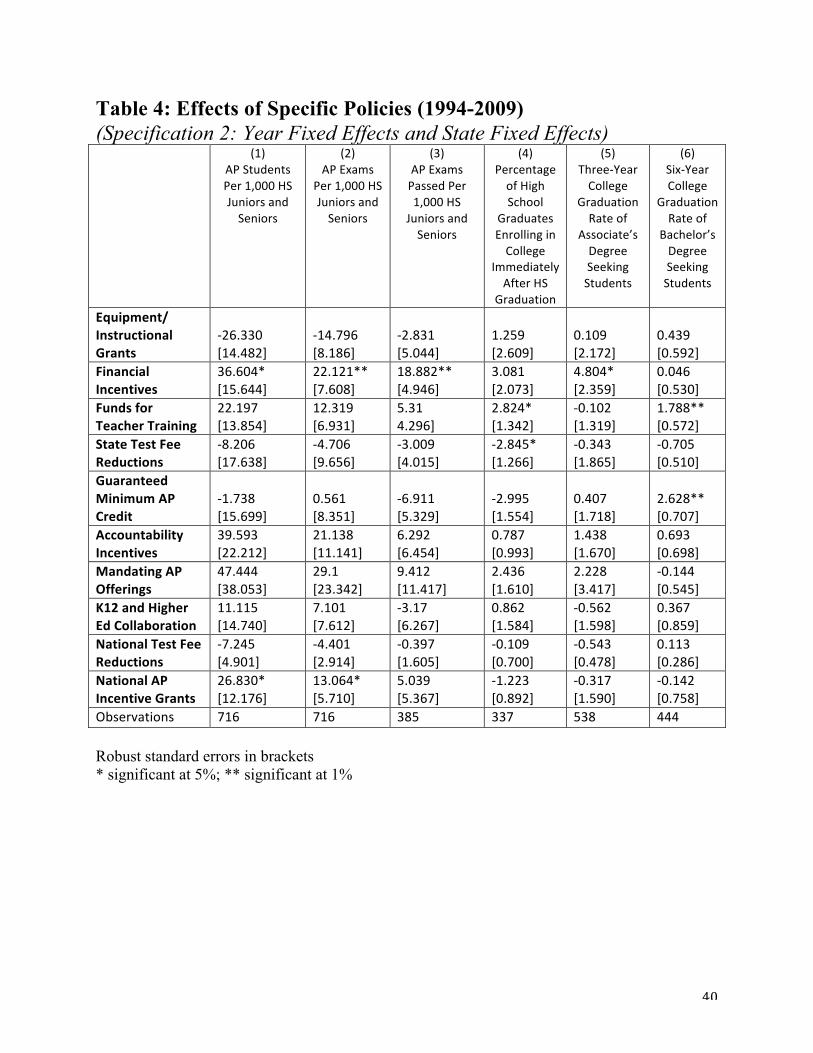
Table 4 presents OLS estimates of this model. Most policies seem to have no effect, while
some stand out as quite effective. Equipment/instructional grants, accountability incentives,
mandating AP offerings, collaboration between K12 schools and higher education, and national
test fee reductions have no significant effects on 𝐴𝑃𝑠𝑡𝑢𝑑𝑒𝑛𝑡𝑠 , 𝐴𝑃𝑒𝑥𝑎𝑚𝑠 , 𝐸𝑥𝑎𝑚𝑠3𝑎𝑏𝑜𝑣𝑒 ,
𝑒𝑛𝑟𝑜𝑙𝑙𝑟𝑎𝑡𝑒,𝑔𝑟𝑎𝑑𝑟𝑎𝑡𝑒3 𝑦𝑒𝑎𝑟, or 𝑔𝑟𝑎𝑑𝑟𝑎𝑡𝑒6𝑦𝑒𝑎𝑟. State test fee reductions have no effect on

21
AP outcomes or college graduation rates but have a negative and significant effect on the college
enrollment rate. This seems to be a statistical anomaly because the same effect does not persist
when I use data from a narrower time period or omit particular years from the dataset.
Financial incentives have a large and highly significant positive effect on 𝐴𝑃𝐸𝑥𝑎𝑚𝑠 and
𝐸𝑥𝑎𝑚𝑠3𝑎𝑏𝑜𝑣𝑒 . Meanwhile, the estimate for 𝐴𝑃𝑠𝑡𝑢𝑑𝑒𝑛𝑡𝑠 is relatively large, positive, and
marginally significant at the 10% level. There is a large, positive effect on the two-year
graduation rate that is marginally significant at 10% level. Financial incentives seem to have no
effects on the other two college outcomes. In results not shown here, I probed the robustness of
this result by re-running the regressions with some years omitted. Qualitatively similar results
emerged. Effects on the AP outcome variables were positive, large, and highly significant in all
regressions. The effect on the two-year graduation rate was always positive but its significance
varied. National AP incentive grants also seem to have a positive and significant effect on
𝐴𝑃𝑠𝑡𝑢𝑑𝑒𝑛𝑡𝑠 and 𝐴𝑃𝐸𝑥𝑎𝑚, though not college enrollment or graduation rates. The effect on
𝐸𝑥𝑎𝑚𝑠3𝑎𝑏𝑜𝑣𝑒 is positive but not significant. This finding was also robust to changing the time
period of consideration. Financial incentives and national AP incentive grants seem to be the
only two policies that effectively increase AP exam taking.
Funding or mandating teacher training has an unexpectedly large and highly significant
effect on college enrollment rates and six-year college graduation rates, but no effect on any of
the AP outcomes. Guaranteeing minimum college credit for passing AP scores also has a
positive and highly significant effect on the six-year college graduation rate but no effect on any
AP outcomes. These two findings are fairly robust to changing the exact years of data included
with the exception that minimum credit no longer has a significant effect if I use data from 1998-
2009 rather than 1994-2009.

22
To further test the robustness of these findings and to see if there are cumulative effects
of the seemingly effective policies, I run some additional regressions whose results appear in
tables 5 and 6. I code two new variables: 𝐴𝑃𝑒𝑓𝑓𝑒𝑐𝑡𝑖𝑣𝑒 and 𝑐𝑜𝑙𝑙𝑒𝑔𝑒𝑒𝑓𝑓𝑒𝑐𝑡𝑖𝑣𝑒. 𝐴𝑃𝑒𝑓𝑓𝑒𝑐𝑡𝑖𝑣𝑒
indicates whether a state had a policy that seems to affect AP outcomes while 𝑐𝑜𝑙𝑙𝑒𝑔𝑒𝑒𝑓𝑓𝑒𝑐𝑡𝑖𝑣𝑒
indicates whether a state had a policy that seems to affect college graduation rates. 𝐴𝑃𝑒𝑓𝑓𝑒𝑐𝑡𝑖𝑣𝑒
takes the value 1 in a given year if that state had financial incentives based on exam performance
or received a national AP incentive grant. 𝐶𝑜𝑙𝑙𝑒𝑔𝑒𝑒𝑓𝑓𝑒𝑐𝑡𝑖𝑣𝑒 takes the value 1 if in a given year
that state guarantees minimum credit for passing AP scores or funds AP teacher training. Then, I
code variables to trace the first four years of the policy. Finally, I regress each AP outcome and
college outcome on these 4 variables.
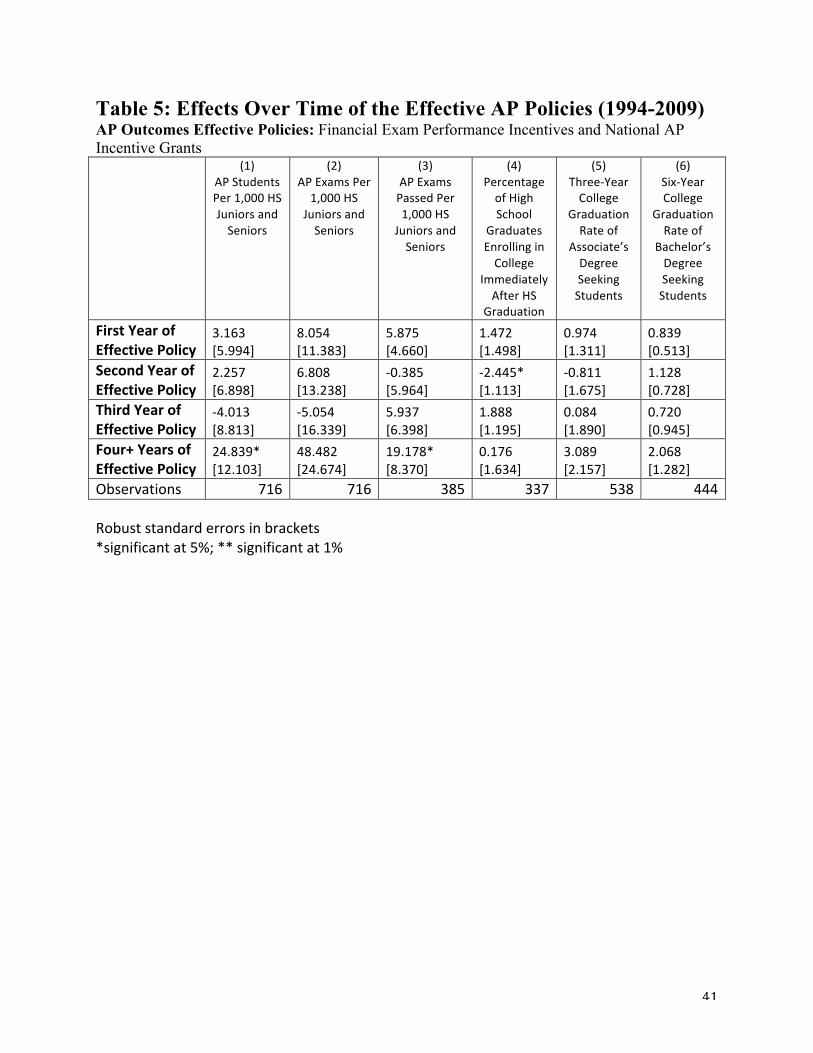
The results presented in table 5 indicate that the two policies that have a large, significant
effect on AP outcomes (financial incentives and national AP incentive grants) do not have a
large and significant effect on 𝐴𝑃𝑠𝑡𝑢𝑑𝑒𝑛𝑡𝑠 , 𝐴𝑃𝑒𝑥𝑎𝑚𝑠 , and 𝐸𝑥𝑎𝑚𝑠3𝑎𝑏𝑜𝑣𝑒 immediately.
Rather, it takes several years to detect their effects. Large, significant treatment effects appear
four or more years after the state began implementing one of these policies. The effects on
𝐴𝑃𝑠𝑡𝑢𝑑𝑒𝑛𝑡𝑠 and 𝐸𝑥𝑎𝑚𝑠3𝑎𝑏𝑜𝑣𝑒 are large in magnitude and significant at the 5% level. The
effect for 𝐴𝑃𝑒𝑥𝑎𝑚𝑠 is also quite large, but it is only marginally significant at the 10% level. The
point estimates imply that states with financial incentive programs or that receive and use a
national AP incentive grant experience an increase 2.5% increase in the number of students
taking AP exams, a 4.8% increase in the number of exams taken, and a 2% increase in the
number of AP exams passed if the program has been in place for four or more years. Notably,
there are no cumulative effects for any of the college outcomes, which suggests that while these

23
policies may successfully encourage AP participating and exam taking, they may not increase
college preparation or encourage college going.
Table 6 presents similar results for the two policies that appeared to increase college
outcomes, though not AP outcomes, in table 4. The estimates suggest that funding teacher
training or guaranteeing credit for passing AP scores leads to a large increase in six-year college
graduation rates immediately, and the magnitude of the effects increases over time. However,
there are several reasons to be skeptical about these results. First, the effects seem implausibly
large, ranging from 1.5% to 3.1%. It is hard to believe that training a few AP teachers or simply
guaranteeing AP credit at in-state colleges would have such a dramatic effect on the six-year
college graduation rate. Secondly, they are accompanied by no increases in any of the AP
outcomes or other college outcomes.
In the section that follows, I discuss whether these and the other empirical findings are
plausible in light of the design of particular AP policies. On the whole, implementation and the
strength of incentives can account for the empirical results in table 4. It is not surprising that
many AP policies fail to increase AP outcomes or college graduation rates because most policies
offer few strong incentives for students, schools, or districts to change their behavior. For
example, it is not surprising that accountability incentives seem to have no effect on AP
outcomes or college graduation rates. Most states with AP accountability policies require
districts or schools to report AP enrollment numbers, AP exam pass rates, and the number of AP
courses offered. Of the 19 states with some form of accountability incentives, only three (West
Virginia, Oklahoma, and Kentucky) consider AP performance in a school’s academic
performance index or rating. While schools and districts in the remaining 16 states may want to

24
improve their AP statistics, the lack of obvious sanctions or rewards probably fails to create
incentives to encourage more AP exam taking.
Collaboration between K-12 and higher education institutions may not be efficacious
because most of this legislation offers vague promises but little specific action. For example,
according to Florida’s legislation, “the levels of postsecondary education shall collaborate in
further developing and providing articulated programs in which students can proceed toward
their educational objectives as rapidly as their circumstances permit.” However, how the levels
of education will collaborate remains unspecified. Similarly, Kentucky’s 2002 legislation directs
the state board to identify "resources at the secondary and postsecondary levels that can be
directed toward advanced placement or dual enrollment instruction,” but the legislation lacks an
explanation of how these resources will be used. Given the vague nature and limited scope of K-
12 collaboration legislation, it is unsurprising that these policies have little or no effect on AP
exam taking.
Most equipment and instructional grant policies, though well intentioned, are not
adequately funded or comprehensive enough to generate significant increases in AP offerings
and consequently AP enrollment or AP exam taking. Policies in most states offer a few hundred
dollars for instructional materials, but much more support is needed to establish an effective AP
program. In the absence of well-trained teachers and a school culture that promotes the AP
program, this money will not go very far towards increasing AP enrollment and AP exam taking.
At first glance, it may seem odd that mandating AP offerings does not increase the
number of AP students or number of AP exams taken, especially since this policy has the
primary goal of increasing access to AP. However, expanding AP course offerings at schools
that would not otherwise offer AP courses may fail to increase AP exam taking because the

25
courses may be of such low quality that students decide they are not prepared to take the AP
exam at the conclusion of the course. This is especially likely at lower quality schools with less
prepared teachers and students who do not perceive great value in the AP program.
A somewhat more puzzling result in table 4 concerns AP exam fee waivers for free and
reduced price lunch students funded by the U.S Department of Education and state exam fee
subsidies. Since these policies have the primary goal of increasing AP exam taking by decreasing
the cost of taking exams, it is surprising that they do not have a significant effect. However, the
fact that AP exam fee waivers took effect in more than half of all states in the same year and was
expanded almost every state by 2003 may explain why there is not enough variation to detect
strong effects in the data. State exam fee subsidies differ from reductions funded by the U.S.
Department of Education in that they began prior to the national program and included higher
income students. The demand for AP exams among high-income students may be relatively price
inelastic, which would explain why these policies do not increase the number of AP students or
AP exams taken.
While eight of the policies have little to no effect on AP outcomes, two stand out as quite
effective. Financial incentives and national AP incentive grants have large effects on the number
of AP students, AP exams taken, and AP exams passed. Given that state financial incentives
programs and national AP incentive grants focus both on expanding AP access and increasing
test taking and performance, this is what one would expect. Financial incentives for exam
performance have strong effects on the number of AP students, exam taking, and exam
performance. This is what would we expect based on the design of these policies in the five
states that implemented them. Texas, Arkansas, and Florida offer cash bonuses to teachers for
each student who earns a 3 or higher. Texas, Oklahoma, Florida, and Colorado also offer cash
26
bonuses (generally $100 or more per student) to schools for each student who earns a 3 or higher.
Texas gives large cash bonuses to students who pass the exam. Under these policies, teachers
and schools have strong incentives to offer high quality AP courses that will enable students to
pass the AP exams, and in Texas, students themselves have an incentive to work hard to learn
course material so that they can perform well on the AP exam. Anecdotal data from these
schools also suggests that these policies changed the school culture.8 Guidance counselors were
more likely to recommend AP courses to able students. This practice may have addressed some
students’ suboptimal decision making. Finally, most of these incentive programs concentrated
their efforts in disadvantaged schools with students who were previously unaware of supposed
financial and academic benefits of the AP program.
National AP incentive grants have also been incredibly successful in achieving the goal
of increasing AP access and AP success. Point estimates from table 4 imply that a having a
national AP incentive grant increases the number of students taking at least one AP exam in that
year by 26 students and the number of exams taken by 13 per 1,000 high school juniors and
seniors. The 2% change in AP students and 1.3% change in AP exams are fairly large immediate
effects, but as table 5 suggests, these effect likely increases over time. There is also a smaller
and slightly less significant effect on 𝐸𝑥𝑎𝑚𝑠3𝑎𝑏𝑜𝑣𝑒, indicating that new students are not only
taking AP exams, but many are also passing. All these results support the claim that certain
policies at the state and national level can effectively encourage AP participation.
Of course, regression results suggest that only two policies effectively increase college
outcomes. Oddly, this effect does not seem to work through an AP channel since these two
policies (teacher training and guaranteeing minimum AP credit) do not increase AP outcomes.
It is quite plausible that these two policies would not have an effect on AP outcomes. Most AP 8 See Jackson (2012)

27
teacher training policies fund travel and enrollment expenses for AP summer institutes or AP
workshops. These events last only a few days, so they may not provide enough training to
dramatically change AP course quality. If course quality does not change much, there will be no
change in the number of AP students, AP exams taken, or AP exam pass rates. Meanwhile, we
would expect college graduation rates to remain unchanged.
Similarly, guaranteeing credit for passing scores on AP exams at colleges and universities
within the states creates no new incentives for students. With the exception of the most elite
private colleges and universities, virtually every college and university grants credit for passing
scores on all AP exams. Thus, it is not surprising that mandating minimum credit has no effect
on AP exam taking. Most states passed these policies not to change the status quo with regards to
AP, but because they wanted to guarantee credit for more contested forms of “college-level”
work like online coursework, dual-credit classes, technical programs, and other forms of credit
by examination; the Advanced Placement program was simply listed along with other programs
in the formal declaration of the guaranteed credit policies numerous states adopted.
While I cannot definitely say why teacher training and guaranteeing minimum credit
appear to increase the six-year graduation rate, there are several plausible econometric
explanations. First of all, looking at educational policies that tended to coincide with the
introduction of guaranteeing minimum AP credit may explain the weird result. As discussed in
the previous paragraph, most minimum credit policies were included in legislation that addressed
other contested forms of credit. If these accompanying policy changes increased college
graduation rates, estimates in my regressions will be biased upwards, perhaps so much so that
they are positive and significant.

28
It is also possible that states without teacher training and minimum credit policies had
many transfer students or students who chose colleges out of state. Since transfers are dropped
from the graduation rate data, states with many students transferring will have artificially low
graduation rates. If states with teacher training and minimum credit policies are especially
proactive states better able to retain students, estimates of the effects of these policies will be
biased upwards. In addition, the college graduation rates are distorted because they do not
account for students that attended high school in one state and attended college in another. If
even a small percentage of students choose out of state colleges and universities, these data
cannot be used reliably to estimate the effects of AP policies on college graduation rates. Finally,
the graduation rate data rely on accurate reporting from all colleges and universities in the state.
However, rates of reporting vary dramatically between states, so there may be systematic
reporting bias. For example, in some states, all institutions report their graduation rates. In
others, only 33% report, so in these under-reporting states, perhaps only the institutions with the
highest graduation rates report. This would inflate the graduation rates for these states and lead to
biased estimates as long as which states have inflated rates is correlated with the adoption of AP
policies. Unfortunately, it is nearly impossible to determine which, if any, of these econometric
issues is responsible for implausible estimates. Better graduation rate data or an improved
source of identifying variation is needed to accurately evaluate the effect of AP policies on
college graduation rates. Future research will certainly improve on the approach adopted in this
analysis and hopefully offer more conclusive answers. Analysis of panel micro-data that tracks
individual students might be best suited to this task.

29
VI. CONCLUSIONS
This analysis has attempted to evaluate the effectiveness of various state and national
Advanced Placement policies. Using aggregate panel data, I find that some AP policies
effectively increase the number of students taking AP exams, the number of AP exams taken,
and the number of exams passed. Financial incentives based on exam performance and the
national AP incentive grant program have large, significant effects on AP exam taking.
According to my results, the eight remaining policies (accountability incentives, guaranteeing
minimum credit, K-12/higher education collaboration, national exam fee waivers, state test fee
subsidies, mandating AP offerings, equipment and instructional grants, and funds for teacher
training) have little to no effect on AP outcomes.
Though the results of this analysis should be interpreted cautiously, they can inform the
design of AP policies. There is strong evidence that individual cash incentives, either at the
school, teacher, or student level can work to encourage AP participation and improve AP
performance. These cash incentives can increase school, teacher, and student effort, improving
course quality and learning. Changing the school culture and providing students with more
information about the potential benefits of AP may also influence student decision making.
Similarly, several key aspects of the national AP incentive program likely make it more
successful than other policies with the same goals. Because grants recipients must demonstrate a
“pervasive need for access to advance placement programs,” only schools and districts that
would otherwise not offer AP but truly desire to offer the program receive funding. Moreover,
grant recipients must “assure the availability of matching funds” and “provide for the
involvement of businesses and community organizations.” This emphasis on partnership with
other organizations guarantees multiple stakeholders to hold schools accountable for their use of

30
the funds. Although the most of the funding is ultimately used for instructional materials or
teacher training, these two elements of the national AP incentive grant program probably make it
more successful than funding for teacher training and instructional materials provided by states
individually.
While these two policies are the most effective, they are also the most costly. In the 2010-
2011 school year alone, the U.S Department of Education spent over $23 million on the
Advanced Placement Incentive Grant program, and AP exam performance incentives programs
are quite costly at the state level. More reliable estimates of longer-term effects on college
outcomes would go a long way towards making a cost-benefit analysis possible. Only after
additional studies establish whether the social benefits of these programs outweigh the costs will
policymakers know whether these programs are truly beneficial.

31
REFERENCES
Bleske-Rechek, A., Lubinksi, D. & Benbow, C.P. (2004). Meeting the
Educational Needs of Special Populations: Advanced Placement's Role in
Developing Exceptional Human Capital. Psychological Science, 15(4), 217-224.
CollegeBoard. (2010). Exam Scores: Summary Reports. Retrieved from
http://www.collegeboard.com/student/testing/ap/exgrd_sum/2010.html Dounay, J. (2011). Recent Policies/Activites: High School—Advanced Placement.
Education Commission of the States. Retrieved from
http://www.ecs.org/ecs/ecscat.nsf/WebTopicView?OpenView&count=-
1&RestrictToCategory=High+School--Advanced+Placement
Dounay, J. (2011). Recent Policies/Activites: High School—Advanced Placement.
Education Commission of the States. Retrieved from
http://www.ecs.org/ecs/ecscat.nsf/WebTopicView?OpenView&count=-
1&RestrictToCategory=High+School--Advanced+Placement
Dounay, J. (2000). Advanced Placement Courses and Examinations—State Level
Policies. Education Commission of the States. Retrieved from
http://www.ecs.org/clearinghouse/15/04/1504.htm
Hargrove, L., Godin, D., & Dodd, B. (2008). College Outcome
Comparisons by AP and Non-AP High School Experiences. CollegeBoard
Research Report No. 2008-3.
http://professionals.collegeboard.com/profdownload/pdf/08-
1574_CollegeOutcomes.pdf
Geiser, S., & Santelices, V. (2004). The role of Advanced Placement and honors courses
in college admissions (Research & Occasional Paper Series: CSHE.4.04).
Berkeley: University of California.
Hallett, R, E,. & Venegas, K. M. (2011). Is Increased Access Enough? Advanced
Placement Courses, Quality, and Success in Low-Income Urban Schools. Journal
for the Education of the Gifted, 34(3), 468-487.
Jackson, Kirabo C. (2010). A Little Now for a Lot Later: A Look at a Texas Advanced
Placement Incentive Program. The Journal of Human Resources. 45(3), 591.
Jackson, Kirabo C. (2010). Effects of an Incentive-Based High School Intervention on

32
College Outcomes. National Bureau for Economic Research Working Paper
15722. http://www.nber.org/papers/w15722
Jeong, D.W. (2009). Student Participation and Performance on Advanced
Placement Exams: Do State-Sponsored Incentives Make a
Difference? Educational Evaluation and Policy Analysis. 31(4), 346-366.
Johnson, Kirk. (2004). Expanding opportunity for Low-Income High School Students:
Pell Grants vs. Advanced Placement Classes. The Heritage Foundation.
Keng, L. & Dodd, B. G. (2008). A comparison of college performances of AP® and
non-AP student groups in 10 subject areas (College Board research report no.
2008-7). New York, NY: The College Board.
Klopfenstein, K., & Thomas, M. K. (2009). The link between advanced placement
experience and early college success. Southern Economic Journal, 75(3), 873-
891.
McCauley, David. (2007) The Impact of Advanced Placement and Dual Enrollment
Programs on College Graduation. Applied Research Projects, Texas State
University-San Marcos. Paper 206.
http://ecommons.txstate.edu/arp/206
Scott, P., Tolson, H., & Yi-Hsuan, L. (2010). Assessment of Advanced
Placement Participation and University Academic Success in the First Semester:
Controlling for Selected High School Academic Abilities. Journal of College
Admission, (208), 26-30.
-----. (2010). Number of Eleventh and Twelve Grade Students by State, Number of
Black, White, and Hispanic Students, Number of Free Price Lunch Students,
Average Expenditure Per Student. Common Core of Data. National Center for
Education Statistics.
-----. (2010). Number of AP Exam Scores at 3 or Above Per 1,000 High School Juniors
and Seniors: Advanced Placement Data 1997-2003, 2005, and 2007.
National Center for Higher Education Management Systems.
-----. (2009). College-Going Rates of High School Graduates – Directly from High
School. National Center for Higher Education Management Systems.
-----. (2009). Progress and Completion: Graduation Rates Data 1997-2009. National

33
Center for Higher Education Management Systems.
-----. (2011). State Notes: Advanced Placement. Education Commission of the States.
Retrieved November 1, 2011 from http://mb2.ecs.org/reports/Report.aspx?id=922
-----. (2011). U.S. Department of Education, Office of Academic Improvement and
Teacher Quality Programs: Advanced Placement Incentive Program Grants.
Retrieved November 1, 2011 from http://www2.ed.gov/programs/apincent/index.html
-----. (2011). U.S. Department of Education, Office of Academic Improvement and
Teacher Quality Programs: Advanced Placement Test Fee Program.

34
FIGURES AND TABLES:
0 5 10 15 20 25 30 35 40 45 50
0
20
40
60
80
100
120
140
160
180
1991 1993 1995 1997 1999 2001 2003
Figure 1: Relationship between Number of States with AP Policies and Number of AP
Students
Number of Students Per 1,000 HS Juniors and Seniors that Took at Least One AP Exam
Number of States with AP Policies
52 53 54 55 56 57 58 59 60 61 62 63
0
10
20
30
40
50
60
1990 1995 2000 2005 2010
Figure 2: Relationship Between Number of States with AP Policies and the College
Enrollment Rate
Number of States with At Least One AP Policy
College Enrollment Rate

35
0 5 10 15 20 25 30 35 40 45 50
51.5 52
52.5 53
53.5 54
54.5 55
55.5 56
56.5 57
1991 1993 1995 1997 1999 2001 2003 Cohort Year
Figure 3: Relationship Between Number of States with AP Policies and the National Six-‐
Year Graduation Rate
Graduation Rate (Percent)
Number of States with AP Policies
-‐15
-‐10
-‐5
0
5
10
15
20
25
0 2 4 6 8 10 12 14 16
Change in the College Enrollment Rate
Years with an AP Policy
Figure 4: Change in Six-‐Year Graduation Rate vs. Years with AP Policies (1996-‐2008)

36
-‐8
-‐6
-‐4
-‐2
0
2
4
6
8
10
12
14
0 1 2 3 4 5 6 7 8 9 10 11 12 13
Figure 5: Change in Six-‐Year Graduation Rate vs. Years with AP Policies (1991-‐2003)

37
Table 1: Effect of Any AP Policy on AP and College Outcomes (1994-2009)
Falsification Test (1994-2009)
Specification (Row 1): Year Fixed Effects Only Specification (Row 2): Year Fixed Effects and State Fixed Effects Robust standard errors in brackets * significant at 5%; ** significant at 1%
Specification:
(1) AP Students Per 1,000 HS Juniors and Seniors
(2) AP Exams Per 1,000 HS
Juniors and Seniors
(3) AP Exams Passed Per 1,000 HS
Juniors and Seniors
(4) Percentage of High School Graduates Enrolling in College
Immediately After HS
Graduation
(5) Three-‐Year College
Graduation Rate of
Associate’s Degree Seeking
Students
(6) Six-‐Year College
Graduation Rate of Bachelor’s Degree Seeking Students
(1) Any AP Policy 16.054 [8.240]
29.882* [13.751]
0.830** [0.286]
0.827 [1.852]
-‐1.574 [1.692]
0.528 [1.302]
(2) Any AP Policy 8.092*
[3.862] 15.781* [7.223]
3.683 [2.230]
2.487** [0.880]
0.130 [0.858]
0.026 [0.321]
Observations 716 716 385 337 538 444
Specification:
(1) AP Students Per 1,000 HS Juniors and Seniors
(2) AP Exams Per 1,000 HS
Juniors and Seniors
(3) AP Exams Passed Per 1,000 HS
Juniors and Seniors
(4) Percentage of High School Graduates Enrolling in College
Immediately After HS
Graduation
(5) Three-‐Year College
Graduation Rate of
Associate’s Degree Seeking
Students
(6) Six-‐Year College
Graduation Rate of Bachelor’s Degree Seeking Students
(1) Two Years Before Any AP
Policy
-‐4.330 [4.235]
-‐8.818 [7.338]
-‐4.033 [7.717]
-‐0.348 [1.468]
-‐1.506 [1.625]
-‐1.053 [0.776]
(2) Two Years Before Any AP
Policy
-‐3.032 [2.438]
-‐5.660 [4.592]
-‐4.845 [4.886]
0.571 [0.974]
-‐0.847 [15.682]
-‐0.128 [0.497]
Observations 716 716 385 337 538 444

38
Table 2: Effect of Any AP Policy on AP and College Outcomes Over Time (1994-2009) (Specification 2: Year Fixed Effects and State Fixed Effects)
(1) AP Students Per 1,000 HS Juniors and Seniors
(2) AP Exams Per
1,000 HS Juniors and Seniors
(3) Percentage of High School
Graduates Enrolling in College
Immediately After HS
Graduation
(4) Three-‐Year College
Graduation Rate of
Associate’s Degree Seeking Students
(5) Six-‐Year College Graduation Rate of Bachelor’s
Degree Seeking Students
Four Years Before Any AP Policy
-‐1.634 [14.160]
-‐1.469 [7.813]
2.367 [1.655]
-‐6.902 [4.665]
0.889 [1.020]
Three Years Before
Any AP Policy 1.984
[16.129] -‐0.200 [8.792]
-‐1.518 [1.894]
-‐8.854 [4.663]
-‐0.244 1.134]
Two Years Before Any AP Policy
5.012 [18.592]
1.32 [10.214]
2.282 [1.925]
-‐8.065 [4.841]
-‐0.026 [1.213]
One Year Before Any AP Policy
8.197 [21.440]
2.766 11.777]
-‐0.956 [2.236]
-‐8.037 [5.304]
-‐0.021 [1.286]
First Year with An AP Policy
13.87 [22.952]
6.019 [12.442]
2.777 [2.354]
-‐6.972 [5.755]
-‐0.283 [1.266]
Second Year with An AP Policy
10.966 [26.368]
4.301 [14.341]
2.472 [2.473]
-‐7.862 [5.146]
-‐0.550 [1.245]
Third Year with An AP Policy
21.883 [27.078]
9.395 [14.791]
0.988 [2.907]
-‐7.421 [5.379]
-‐0.207 [1.265]
Four+ Years with An AP Policy
45.931 [30.697]
21.919 [16.471]
3.749 [2.777]
-‐6.322 [5.540]
0.438 [1.331]
Observations 716 716 337 538 444 Robust standard errors in brackets * significant at 5%; ** significant at 1%

39
-‐10
0
10
20
30
40
50
-‐2
-‐1
0
1
2
3
4
5 Four Years Before any AP Policy
Three Years Before any AP Policy
Two Years Before any AP Policy
One Year Before any AP Policy
First Year with an AP Policy
Second Year with an AP Policy
Third Year with an AP Policy
Four+ Years with an AP Policy
Increase in AP Students relative to
5 Years Before Any AP Policy
Increase in College Enrollment Rate
Relative to 5 Years Before Any AP Policy
Graph of Table 2: Effect of Any AP Policy on Number of AP Students and College Enrollment
for Seniors
Percentage of High School Graduates Enrolling Immediately in College
Number of AP Students Per 1,000 HS Juniors and Seniors
40
Table 4: Effects of Specific Policies (1994-2009) (Specification 2: Year Fixed Effects and State Fixed Effects) (1)
AP Students Per 1,000 HS Juniors and Seniors
(2) AP Exams
Per 1,000 HS Juniors and Seniors
(3) AP Exams Passed Per 1,000 HS
Juniors and Seniors
(4) Percentage of High School
Graduates Enrolling in College
Immediately After HS
Graduation
(5) Three-‐Year College
Graduation Rate of
Associate’s Degree Seeking Students
(6) Six-‐Year College
Graduation Rate of
Bachelor’s Degree Seeking Students
Equipment/ Instructional Grants
-‐26.330 [14.482]
-‐14.796 [8.186]
-‐2.831 [5.044]
1.259 [2.609]
0.109 [2.172]
0.439 [0.592]
Financial Incentives
36.604* [15.644]
22.121** [7.608]
18.882** [4.946]
3.081 [2.073]
4.804* [2.359]
0.046 [0.530]
Funds for Teacher Training
22.197 [13.854]
12.319 [6.931]
5.31 4.296]
2.824* [1.342]
-‐0.102 [1.319]
1.788** [0.572]
State Test Fee Reductions
-‐8.206 [17.638]
-‐4.706 [9.656]
-‐3.009 [4.015]
-‐2.845* [1.266]
-‐0.343 [1.865]
-‐0.705 [0.510]
Guaranteed Minimum AP Credit
-‐1.738 [15.699]
0.561 [8.351]
-‐6.911 [5.329]
-‐2.995 [1.554]
0.407 [1.718]
2.628** [0.707]
Accountability Incentives
39.593 [22.212]
21.138 [11.141]
6.292 [6.454]
0.787 [0.993]
1.438 [1.670]
0.693 [0.698]
Mandating AP Offerings
47.444 [38.053]
29.1 [23.342]
9.412 [11.417]
2.436 [1.610]
2.228 [3.417]
-‐0.144 [0.545]
K12 and Higher Ed Collaboration
11.115 [14.740]
7.101 [7.612]
-‐3.17 [6.267]
0.862 [1.584]
-‐0.562 [1.598]
0.367 [0.859]
National Test Fee Reductions
-‐7.245 [4.901]
-‐4.401 [2.914]
-‐0.397 [1.605]
-‐0.109 [0.700]
-‐0.543 [0.478]
0.113 [0.286]
National AP Incentive Grants
26.830* [12.176]
13.064* [5.710]
5.039 [5.367]
-‐1.223 [0.892]
-‐0.317 [1.590]
-‐0.142 [0.758]
Observations 716 716 385 337 538 444 Robust standard errors in brackets * significant at 5%; ** significant at 1%
41
Table 5: Effects Over Time of the Effective AP Policies (1994-2009) AP Outcomes Effective Policies: Financial Exam Performance Incentives and National AP Incentive Grants (1)
AP Students Per 1,000 HS Juniors and Seniors
(2) AP Exams Per 1,000 HS
Juniors and Seniors
(3) AP Exams Passed Per 1,000 HS
Juniors and Seniors
(4) Percentage of High School
Graduates Enrolling in College
Immediately After HS
Graduation
(5) Three-‐Year College
Graduation Rate of
Associate’s Degree Seeking Students
(6) Six-‐Year College
Graduation Rate of
Bachelor’s Degree Seeking Students
First Year of Effective Policy
3.163 [5.994]
8.054 [11.383]
5.875 [4.660]
1.472 [1.498]
0.974 [1.311]
0.839 [0.513]
Second Year of Effective Policy
2.257 [6.898]
6.808 [13.238]
-‐0.385 [5.964]
-‐2.445* [1.113]
-‐0.811 [1.675]
1.128 [0.728]
Third Year of Effective Policy
-‐4.013 [8.813]
-‐5.054 [16.339]
5.937 [6.398]
1.888 [1.195]
0.084 [1.890]
0.720 [0.945]
Four+ Years of Effective Policy
24.839* [12.103]
48.482 [24.674]
19.178* [8.370]
0.176 [1.634]
3.089 [2.157]
2.068 [1.282]
Observations 716 716 385 337 538 444 Robust standard errors in brackets *significant at 5%; ** significant at 1%

42
Table 6: Effects Over Time of the Effective AP Policies (1994-2009) College Outcomes Effective Policies: Funds for Teacher Training and Guaranteeing Minimum AP Credit (1)
AP Students Per 1,000 HS Juniors and Seniors
(2) AP Exams Per 1,000 HS
Juniors and Seniors
(3) AP Exams Passed Per 1,000 HS
Juniors and Seniors
(4) Percentage of High School
Graduates Enrolling in College
Immediately After HS
Graduation
(5) Three-‐Year College
Graduation Rate of
Associate’s Degree Seeking Students
(6) Six-‐Year College
Graduation Rate of
Bachelor’s Degree Seeking Students
First Year of Effective Policy
0.349 [6.069]
1.397 [11.376]
1.964 [3.674]
2.127 [2.098]
0.309 [1.335]
1.455** [0.486]
Second Year of Effective Policy
-‐0.698 [7.119]
-‐1.658 [13.825]
4.749 [4.583]
1.172 [1.654]
0.034 [1.541]
1.883** [0.878]
Third Year of Effective Policy
6.666 [7.820]
10.328 [14.882]
7.011 [5.753]
2.158 [1.315]
0.886 [2.252]
2.768** [0.594]
Four+ Years of Effective Policy
13.221 [8.137]
21.727 [16.181]
6.140 [7.509]
1.909 [1.696]
0.131 [2.386]
3.136** [0.896]
Observations 716 716 385 337 538 444 Robust standard errors in brackets *significant at 5%; ** significant at 1%

43
Appendix A: State Policies and Timing
Table A1: Year of First AP Policy by State State Year of First AP Policy South Carolina 1987 Missouri 1987 Utah 1988 West Virginia 1989 California 1990 Indiana 1990 Iowa 1991 Wisconsin 1993 Arkansas 1995 Montana 1995 New Jersey 1995 Massachusetts 1996 Michigan 1996 Texas 1996 Georgia 1997 Oklahoma 1997 Colorado 1998 Ohio 1998 Louisiana 1998 Virginia 1998 Kentucky 1998 South Dakota 1998 Washington 1998 Delaware 1998 Oregon 1998 Alabama 1998 Mississippi 1998 New Mexico 1998 Tennessee 1998 Hawaii 1998 New York 1998 Pennslyvania 1998 Rhode Island 1998 Florida 1999 Minnesota 1999 Connecticut 1999

44
Maryland 1999 Illinois 1999 Maine 1999 North Carolina 1999 Nevada 2000 New Hampshire 2000 Vermont 2000 Alaska 2000 Kansas 2000 Nebraska 2000 Wyoming 2000 North Dakota 2001 Arizona 2003 Idaho 2003
Table A2: Variation in Timing of State Advanced Placement Policies
Policy State and Year9 Equipment or Instructional Grants to
Schools or Districts Missouri (1986) Indiana (1990)
West Virginia (1991)10 Arkansas (1995) Oklahoma (1997)
South Carolina (1999) Utah (1999)
Minnesota (2000) Massachusetts (2000) Alabama (2006) Wisconsin (2006) New Mexico (2007)
Mandating Course Offerings South Carolina (1984)11 West Virginia (1991) Indiana (1994)12 Ohio (1998)13
Arkansas (2005)14 Mississippi (2006-‐2009)15
Tennessee (2008) Accountability Incentives
1. Must report number or percentage of
Missouri (1986): 1, 2 Wisconsin (1993): 1 New Jersey (1995): 1
9 Year in parentheses is the year the policy takes effect; unless otherwise noted, the policy continues to the present. 10 Schools in Wyoming receive extra funding for each pupil enrolled in an Advanced Placement course. 11 Each district must provide at least one AP course if there is an adequate number of talented students. 12 Each district must offer at least 2 AP courses. 13 Each educational center in Ohio must develop a plan to guarantee AP offerings. 14 All districts in the state must offer AP courses. 15 All schools must offer at least one AP course in each subject area.
45
students enrolled in AP 2. Must report number of courses offered 3. Must report the number or percentage of
students who take AP exams 4. Must report AP exam performance 5. Accreditation and school grades depend on
1-‐4
Michigan (1996): 1, 2, 3, 4 Oklahoma (1997): 1, 5 Colorado (1998): 1, 5 Louisiana (1999): 1 Utah (2001): 3, 4
Kentucky (2001): 1, 2, 3, 4, 5 Texas (2001): 1, 4, 5 California (2002): 2 Virginia (2003: 1, 3 Maryland (2004): 1
Arkansas (2006): 1, 3, 4 Ohio (2006): 1
West Virginia (2007): 4, 5 Subsidizing AP Test Fees
(State Test Fee Reductions or Reductions funded by the U.S. Department of Education
Test Fee Reduction Grants)
South Carolina (1984) Indiana (1990) Missouri (1994) Arkansas (1995)
Massachusetts (1996) Texas (1996) Georgia (1997)
Connecticut (1997) Oklahoma (1997) Alabama (1998) California (1998) Colorado (1998) Delaware (1998) Florida (1998) Hawaii (1998) Iowa (1998)
Kentucky (1998) Louisiana (1998) Michigan (1998) Mississippi (1998) New Mexico (1998) New York (1998) Ohio (1998) Oregon (1998)
Pennsylvania (1998) Rhode Island (1998) South Dakota (1998) Tennessee (1998) Utah (1998)
Virginia (1998) Washington (1998) West Virginia (1998) North Carolina (1999)
Illinois (1999) Maryland (1999) Minnesota (1999) Montana (1999) Wisconsin (1999) Nebraska (2000) Nevada (2000)
New Jersey (2000) Vermont (2000)

46
Alaska (2000) New Hampshire (2001) North Dakota (2001)
Maine (2002) Kansas (2003) Arizona (2003) Idaho (2003)
Wyoming (2008) Mandating or Providing Funds for Teacher Training and Professional
Development
West Virginia (1989) Indiana (1990) Iowa (1991)
Arkansas (1995) Missouri (1996) Texas (1996)
Oklahoma (1997) Minnesota (1999) California (2000) Kentucky (2002)
South Dakota (2002) Montana (2003)
Washington (2003) Utah (2003)
Connecticut (2004) Florida (2004) Nevada (2004)
South Carolina (2004) Arizona (2005) Delaware (2005) Illinois (2005) Maine (2005) Virginia (2005) Alabama (2006) Georgia (2006)
Massachusetts (2006) Wisconsin (2006) New Mexico (2007)
Mississippi (2007-‐2009) Oregon (2009)
Guaranteeing College Credit at Public In-‐State Institutions for Passing AP
Exam scores
Indiana (1990) Arkansas (2000) Kentucky (2003) Utah (2004) Florida (2004) Oregon (2005)
West Virginia (2005) North Dakota (2007)
Ohio (2008)
Collaboration between K-‐12 and Higher Education Systems for AP
Utah (1988) California (1990)
West Virginia (1990) Montana (1995) Arkansas (1997) Florida (2000) Kentucky (2002)

47
Indiana (2005) Minnesota (2007)
Financial Incentives Based on AP Exam Performance
Arkansas (1995)16 Texas (1996)
Oklahoma (1997) Florida (1998)17 Colorado (1999)18
16 Schools receive $50 for each student who earns a 3 or higher on the AP exam. 17 Districts receive additional funding for each student who earns a 3 or higher on the AP exam. 18 The best performing schools in the state (based on the percentage of students passing exams and percentage of students who successfully complete an AP) receive financial awards.