Embed Size (px)
Citation preview
31SUMMER 2012, VOL. 27, NO. 2
I. Introduction
In the introductory philosophy class at Carnegie Mel-lon University, as at any school, one of the major learning goals is for the students the students to develop general critical thinking skills. There is, of course, a long history of interest in teaching students to “think critically” but it’s not always clear in what this ability consists. In addition, even though there are a few generally accepted measures (e.g. the California Critical Thinking Skills Test, and the Watson-Glaser Critical Thinking Appraisal, but see also Fawkes et al., 2003, Paul et al., 1990, and Halpern, 1989), there is surprisingly little research on the sophistication of students’ critical thinking skills, or on the most effective methods for improving students’ critical thinking skills. The research that has been done shows that the popula-tion of US college students in general has very poor skills (Perkins et al., 1983; Kuhn, 1991; Means & Voss, 1996), and that very few college courses that advertise that they improve students’ skills actually do (Annis & Annis 1979; Arum & Roska, 2011; Pascarella, 1989; Stenning et al., 1995).
Most college teachers can agree, however, that one aspect of critical thinking is the ability to analyze, un-derstand, and evaluate an argument. We are interested in whether the students in our introductory philosophy course actually are improving their abilities on these tasks. In addition, we are particularly interested in the efficacy of alternative teaching methods to increase critical thinking performance.
One candidate alternative teaching method is instruc-tion in the use of argument diagrams as an aid to argument analysis and comprehension. If we think of an argument
the way that philosophers and logicians do — as a series of statements in which one is the conclusion, and the others are premises supporting this conclusion — then an argument diagram is a visual representation of these statements and the inferential connections between them. For example, consider the following argument:
I think everyone would agree that life is worth protecting, and that the environment sustains all of us. It stands to reason, then, that we need to protect the environment. One particular threat to the environment is the emission of greenhouse gasses. This is because greenhouse gasses trap the energy of the sun, causing the warming of the planet, and the warming of the planet could have catastrophic effects on the environment. So, we just can’t avoid the conclusion that we need to reduce greenhouse gas emissions.
The reasons the author gives for believing this con-clusion are the two premises: the fact that greenhouse gasses threaten the environment and the fact that we need to protect the environment. And the author gives further reasons for each of these premises. The way that all of these premises are inferentially connected to each other and the conclusion is what we call the structure of the argument.
Traditionally, philosophers represent arguments as a list of premises with the conclusion at the bottom. It is useful to represent the argument in a simpler form not only because the text contains many more sentences than just the propositions that are part of the argument, but also, proceeding necessarily linearly, the prose obscures the inferential structure of the argument. Thus anyone
Assessing the Efficacy of Argument Diagramming to Teach Critical Thinking Skills in Introduction to Philosophy
Maralee HarrellDepartment of Philosophy, Carnegie Mellon University
AbstractAfter determining one set of skills that we hoped our students were learning in the introductory philosophy class at Carnegie Mellon University, we performed an experiment twice over the course of two semesters to test whether they were actually learning these skills. In addition, there were four different lectures of this course in the first semester, and five in the second; in each semester students in some lectures were taught the material using argument diagrams as a tool to aid understanding and critical evaluation, while the other students were taught using more traditional methods. In each lecture, the students were given a pre-test at the beginning of the semester, and a structurally identical post-test at the end. We determined that the students did develop the skills in which we were interested over the course of the semester. We also determined that the students who were taught argument diagramming gained significantly more than the students who were not. We conclude that learning how to construct argument diagrams significantly improves a student’s ability to analyze arguments.
Key Words: argument diagramming, argument mapping, critical thinking, graphicOrganizers, philosophy, reasoning, argument analysis

32 INQUIRY: CRITICAL THINKING ACROSS THE DISCIPLINES
who wishes to understand and evaluate the argument may reasonably be confused.
However, representing the argument as a list can obscure this structure because there is no indication of how the premises work together to support the conclusion:
P1: Greenhouse gasses trap the energy of the sun.
P2: Greenhouse gasses cause the warming of the planet.
P3: The warming of the planet could have catastrophic effects on the environment.
P4: Greenhouse gasses threatened the environment.
P5: The environment sustains all life.P6: Life is worth protecting.
P7: We need to protect the environment.
C: We need to reduce greenhouse gas emissions.
The argument can be represented more fruitfully, I believe, by an argument diagram. For the diagram, the claims are put into boxes and the inferential connections are represented (see Figure 1).
If, instead of representing the argument as a list, we vi-sually represent the connections between these statements, it is immediately clear how the argument is supposed to work and where we may critique or applaud it.
II. The Study
Recent research on argument visualization, particu-larly using computer-supported argument visualization software, has shown that the use of software programs spe-cifically designed to help students construct argument dia-grams can significantly improve students’ critical thinking abilities over the course of a semester-long college-level
course (Kirschner et al., 2003; Twardy, 2004; van Gelder, 2001, 2003). One important result of some of these recent studies is that students who take a reasoning course, but are not taught argument diagramming do not significantly improve their critical thinking skills over the semester, while students who are taught argument diagramming do significantly improve (e.g., van Gelder, 2001).
However, one of the drawbacks of these studies on argument diagramming is that they have used either the California Critical Thinking Skills Test (CCTST) (e.g., Twardy, 2004; van Gelder, 2001, 2003) or the Watson-Glaser Critical Thinking Appraisal (WGCTA) (e.g., van Gelder, 2000), which are both multiple-choice tests to measure the outcomes. For example, van Gelder (2000) compared students in an undergraduate reasoning class who were taught argument diagramming to those who took the same class but were not taught argument diagramming, but the pre- and post-tests were both the multiple choice CCTST. He did administer an argument analysis essay test to the students who were taught argument diagramming, but did not administer that test to the students who were not taught argument diagramming.
In contrast, we were interested, not in our students gaining generic reasoning skills, but rather in our students gaining the specific ability to analyze an argument. Our stu-
dents, moreover, would not be required to use any par-ticular argument diagram-ming software (or any at all). At the time of the study, there were no investigations of the efficacy of argument diagramming without the aid of a computer program. Thus, we wanted to conduct a study that both compared students who were taught argument diagramming to those who were not taught argument diagramming and that used a pre-/post-test with an essay format.
First HypothesisOur first hypothesis is that students in both groups
would improve their critical thinking skills over the course of a semester. This hypothesis implies in particular that our students should perform better on argument analysis tasks at the end of the semester than at the beginning.
Second HypothesisOur second hypothesis is that students who learn
argument diagramming will improve their critical think-ing skills more than students who do not. In particular, we believe that it is the ability to construct argument diagrams, rather than working with a software or online
Figure 1A Diagram Representing an Argument for
Reducing Greenhouse Gas Emissions.

33SUMMER 2012, VOL. 27, NO. 2
program, that is the crucial factor in the improvement of students’ critical thinking skills. This hypothesis implies that students who are taught argument diagramming, but who do not use a special software program, should perform better on argument analysis tasks than students who were not taught diagramming.
At Carnegie Mellon University, we typically teach several sections of the Introduction to Philosophy course each semester, with a different instructor and teaching as-sistant for each section. There are lectures by the instructor on Mondays and Wednesdays, and recitation sections led by the teaching assistant on Fridays. While the general cur-riculum of the course is set, each instructor is given a great deal of freedom in executing this curriculum. For example, it is always a topics-based course in which epistemology, metaphysics, and ethics are introduced with both histori-cal and contemporary primary-source readings. It is up to the instructor, however, to choose a text, the order of the topics, and the assignments. The students who take this course are a mix of all classes and all majors from each of the seven colleges across the University.
This study tests the first hypothesis by comparing the pre-test and post-test scores of students in sections of our introductory course in each of two semesters. The study tests the second hypothesis by comparing the pre-test and post-test scores of students in our introductory course in both semesters who were taught how to use argument diagrams to the scores of those students in the course who were not taught this skill.
Teaching Argument AnalysisFor the instructors who were not teaching argument
diagramming, there was no set curriculum for teaching argument analysis. Generally, at the beginning of the se-mester, the instructors took advantage of the chapters in their textbooks that cover logic and reasoning to introduce the vocabulary of argument analysis and evaluation.
In class, instructors most often represented arguments on the chalkboard or overhead slides in a list format, as we saw above. In addition, regular assignments were given in which the students were asked to read primary sources (e.g., Plato, Descartes, Rawls), and paraphrase the argu-ments given. This paraphrasing involved re-writing, in the student’s own words, the main claims of the argument and identifying premises and conclusions. These assignments were graded by the teaching assistants, who gave feedback to the students
Teaching Argument DiagrammingIn the classes in which argument diagramming was
taught, a standard curriculum skeleton was used. At the beginning of the semester (within the first two weeks), the students had two consecutive lectures on argument diagramming. In these lectures, the students were first introduced to logical vocabulary (statement, argument, premise, conclusion, etc.). Then they were introduced to
methods for extracting statements (claims) from text, and determining which claims are premises and which are conclusions. In addition, the students were introduced to different types of arguments (linked, convergent, and chain), as well as methods to determine the type of argu-ment found in a text. Finally, the students were shown how to represent these statements and types of arguments visually using boxes and arrows. The boxes contain the statements, which the arrows indicate the inferential links between the boxes. (Cf. Figure 1.)
For each lecture class, the students were assigned primary sources to read that would then be discussed in class. In the classroom, the instructors used overhead slides or argument diagramming software to work with the students on representing the arguments they read. In addition, argument diagrams were used to evaluate theses arguments as well as, often, trying to improve them.
Weekly, low-stakes homework assignments with argument diagramming tasks followed the two days of instruction on argument diagramming. The assignments immediately following the training contained many exer-cises with short arguments of three or four sentences each. The assignments gradually used more and more complex texts, until, by the middle of the semester, students were diagramming the primary source philosophical texts dis-cussed in class.
The assignments were graded by the teaching assis-tants, who gave feedback on individual assignments, and posted plausible answers online. In addition, a portion of each Friday’s recitation section was devoted to discussing problems students had with the homework. The issues students raised were most often ones of interpretation, which naturally led to discussion about the week’s topics and the quality of the arguments.
MethodParticipants
In the study there were 139 students (46 women, 93 men) in each of the four sections in the Spring of 2004 (Semester A), and 130 students (36 women, 94 men) in each of the five sections in the Fall of 2004 (Semester B) of introductory philosophy (“Introduction to Philosophy”) at Carnegie Mellon University. Over the course of a se-mester, each section had a different instructor and teaching assistant, and the students chose their section. Over both semesters there were six instructors, and three of those six (Lecturer 1, Lecturer 2 and Lecturer 4) taught a sec-tion in both semesters studied. During each semester, the students in some of the sections (Section 1 in Semester A, and Sections 1, 4 and 5 in Semester B) were taught the use of argument diagrams to analyze the arguments in the course reading, while the students in the other lectures were taught more traditional methods of analyzing arguments. The distribution of instructors, students, men and women is given in Table 1.
34 INQUIRY: CRITICAL THINKING ACROSS THE DISCIPLINES
ProcedureAll of the sections of Introduction to Philosophy were
Monday/Wednesday/Friday classes. In Semester A, the pre-test was given to all students during the second day of class (i.e., Wednesday of the first week). The students in Sections 1 and 4 were given the post-test as one part of their final exam (during exam week). The students in Sections 2 and 3 were given the post-test on the last day of classes (i.e., the Friday before exam week). In Semester B, the pre-test was given to all students during the third day of class (i.e., Friday of the first week), and the post-test on the last day of classes.
Results Test Coding
Pre-tests and post-tests were paired by student, and single-test students were excluded from the sample. There were 139 pairs of tests for Semester A and 130 pairs for Semester B. Tests which did not have pairs were used for coder-calibration, prior to each session of coding. The tests were coded during two separate sessions, using two different sets of coders: one session and set of coders for the Semester A tests, and one for Semester B. Each coder independently coded all pairs of tests in his or her group (278 total tests in Semester A, and 260 total tests in Se-mester B). Each pre-/post-test pair was assigned a unique ID, and the original tests were photocopied (twice, one for each coder) with the identifying information replaced by the ID. Prior to each coding session, we had an initial grader-calibration session in which the author and the two coders coded several of the unpaired tests, discussed our codes, and came to a consensus about each code. After this, each coder was given the two keys (one for the pre-test and one for the post-test) and the order in which the tests were graded was random and different for each coder.
The codes assigned to each question (or part of a question, except for part (d)) were binary: a code of 1 for a correct answer, and a code of 0 for an incorrect answer. Part (e) of each question was assigned a code of “correct” if the student gave as reasons claims about support of premises for the conclusion and/or truth of the premises and conclusion. For part (d) of each question, answers were coded according to the type of representation used: (i) argument diagram, (ii) list, (iii) translated into logical symbols like a proof, Venn diagram, or concept map, (iv) schematic like: P1 + P2/Conclusion (C), (v) other or blank. In the analysis below, this is represented by the variable RepresentationType.
To determine inter-coder reliability, the Percentage Agreement (PA) as well as Cohen’s Kappa (κ) and Krip-pendorff’s Alpha (α) was calculated for each test (given in Table 2).
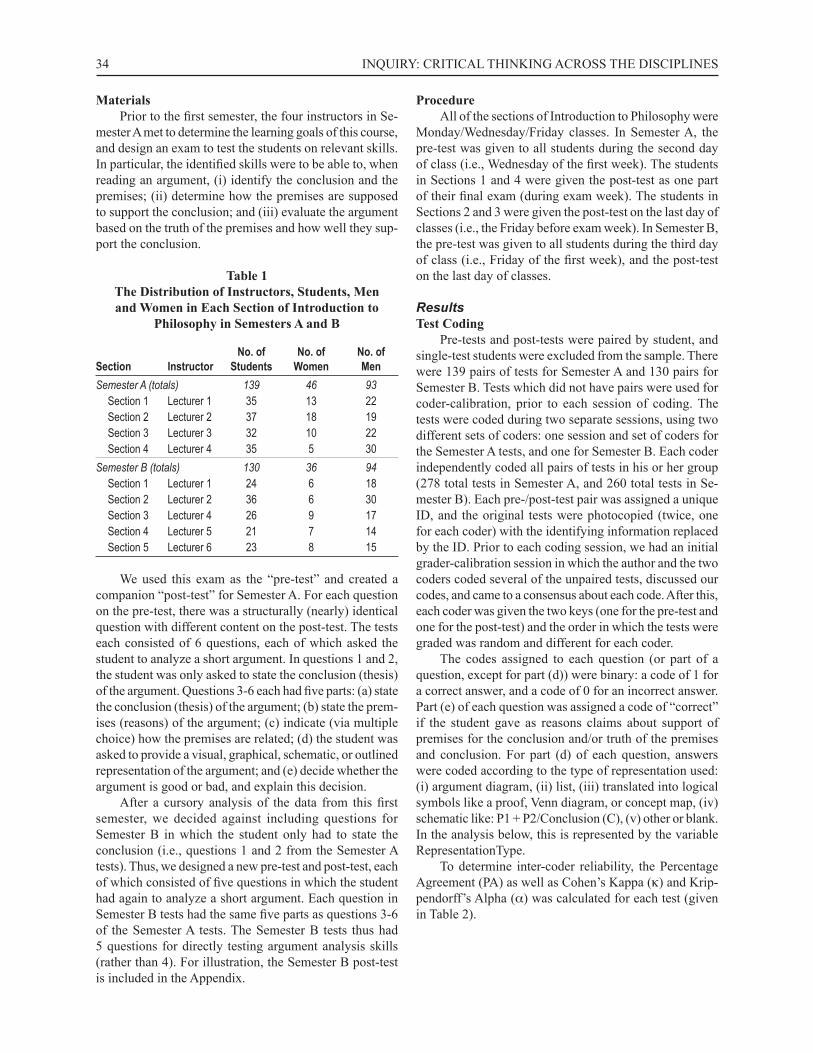
MaterialsPrior to the first semester, the four instructors in Se-
mester A met to determine the learning goals of this course, and design an exam to test the students on relevant skills. In particular, the identified skills were to be able to, when reading an argument, (i) identify the conclusion and the premises; (ii) determine how the premises are supposed to support the conclusion; and (iii) evaluate the argument based on the truth of the premises and how well they sup-port the conclusion.
Table 1The Distribution of Instructors, Students, Men and Women in Each Section of Introduction to
Philosophy in Semesters A and B
No. of No. of No. ofSection Instructor Students Women MenSemester A (totals) 139 46 93 Section 1 Lecturer 1 35 13 22 Section 2 Lecturer 2 37 18 19 Section 3 Lecturer 3 32 10 22 Section 4 Lecturer 4 35 5 30Semester B (totals) 130 36 94 Section 1 Lecturer 1 24 6 18 Section 2 Lecturer 2 36 6 30 Section 3 Lecturer 4 26 9 17 Section 4 Lecturer 5 21 7 14 Section 5 Lecturer 6 23 8 15
We used this exam as the “pre-test” and created a companion “post-test” for Semester A. For each question on the pre-test, there was a structurally (nearly) identical question with different content on the post-test. The tests each consisted of 6 questions, each of which asked the student to analyze a short argument. In questions 1 and 2, the student was only asked to state the conclusion (thesis) of the argument. Questions 3-6 each had five parts: (a) state the conclusion (thesis) of the argument; (b) state the prem-ises (reasons) of the argument; (c) indicate (via multiple choice) how the premises are related; (d) the student was asked to provide a visual, graphical, schematic, or outlined representation of the argument; and (e) decide whether the argument is good or bad, and explain this decision.
After a cursory analysis of the data from this first semester, we decided against including questions for Semester B in which the student only had to state the conclusion (i.e., questions 1 and 2 from the Semester A tests). Thus, we designed a new pre-test and post-test, each of which consisted of five questions in which the student had again to analyze a short argument. Each question in Semester B tests had the same five parts as questions 3-6 of the Semester A tests. The Semester B tests thus had 5 questions for directly testing argument analysis skills (rather than 4). For illustration, the Semester B post-test is included in the Appendix.
35SUMMER 2012, VOL. 27, NO. 2
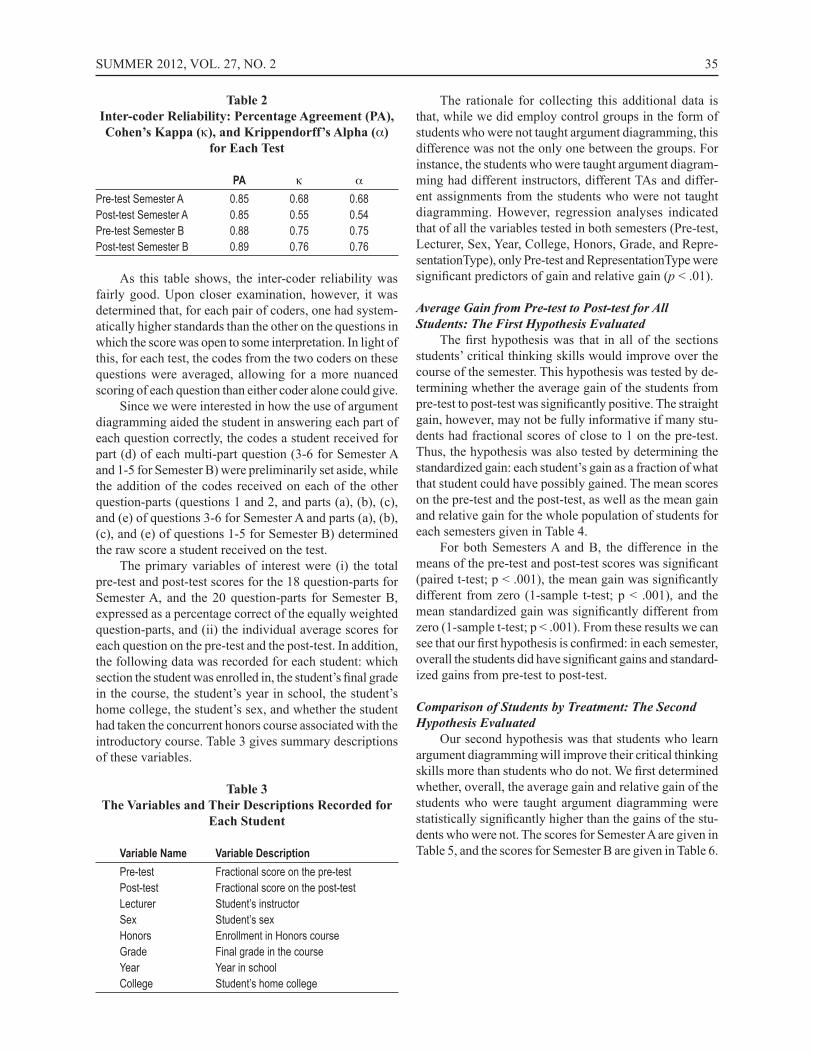
Table 2Inter-coder Reliability: Percentage Agreement (PA), Cohen’s Kappa (κ), and Krippendorff’s Alpha (α)
for Each Test
PA κ α
Pre-test Semester A 0.85 0.68 0.68Post-test Semester A 0.85 0.55 0.54Pre-test Semester B 0.88 0.75 0.75Post-test Semester B 0.89 0.76 0.76
As this table shows, the inter-coder reliability was fairly good. Upon closer examination, however, it was determined that, for each pair of coders, one had system-atically higher standards than the other on the questions in which the score was open to some interpretation. In light of this, for each test, the codes from the two coders on these questions were averaged, allowing for a more nuanced scoring of each question than either coder alone could give.
Since we were interested in how the use of argument diagramming aided the student in answering each part of each question correctly, the codes a student received for part (d) of each multi-part question (3-6 for Semester A and 1-5 for Semester B) were preliminarily set aside, while the addition of the codes received on each of the other question-parts (questions 1 and 2, and parts (a), (b), (c), and (e) of questions 3-6 for Semester A and parts (a), (b), (c), and (e) of questions 1-5 for Semester B) determined the raw score a student received on the test.
The primary variables of interest were (i) the total pre-test and post-test scores for the 18 question-parts for Semester A, and the 20 question-parts for Semester B, expressed as a percentage correct of the equally weighted question-parts, and (ii) the individual average scores for each question on the pre-test and the post-test. In addition, the following data was recorded for each student: which section the student was enrolled in, the student’s final grade in the course, the student’s year in school, the student’s home college, the student’s sex, and whether the student had taken the concurrent honors course associated with the introductory course. Table 3 gives summary descriptions of these variables.
Table 3The Variables and Their Descriptions Recorded for
Each Student
Variable Name Variable DescriptionPre-test Fractional score on the pre-testPost-test Fractional score on the post-testLecturer Student’s instructorSex Student’s sexHonors Enrollment in Honors courseGrade Final grade in the courseYear Year in schoolCollege Student’s home college
The rationale for collecting this additional data is that, while we did employ control groups in the form of students who were not taught argument diagramming, this difference was not the only one between the groups. For instance, the students who were taught argument diagram-ming had different instructors, different TAs and differ-ent assignments from the students who were not taught diagramming. However, regression analyses indicated that of all the variables tested in both semesters (Pre-test, Lecturer, Sex, Year, College, Honors, Grade, and Repre-sentationType), only Pre-test and RepresentationType were significant predictors of gain and relative gain (p < .01).
Average Gain from Pre-test to Post-test for All Students: The First Hypothesis Evaluated
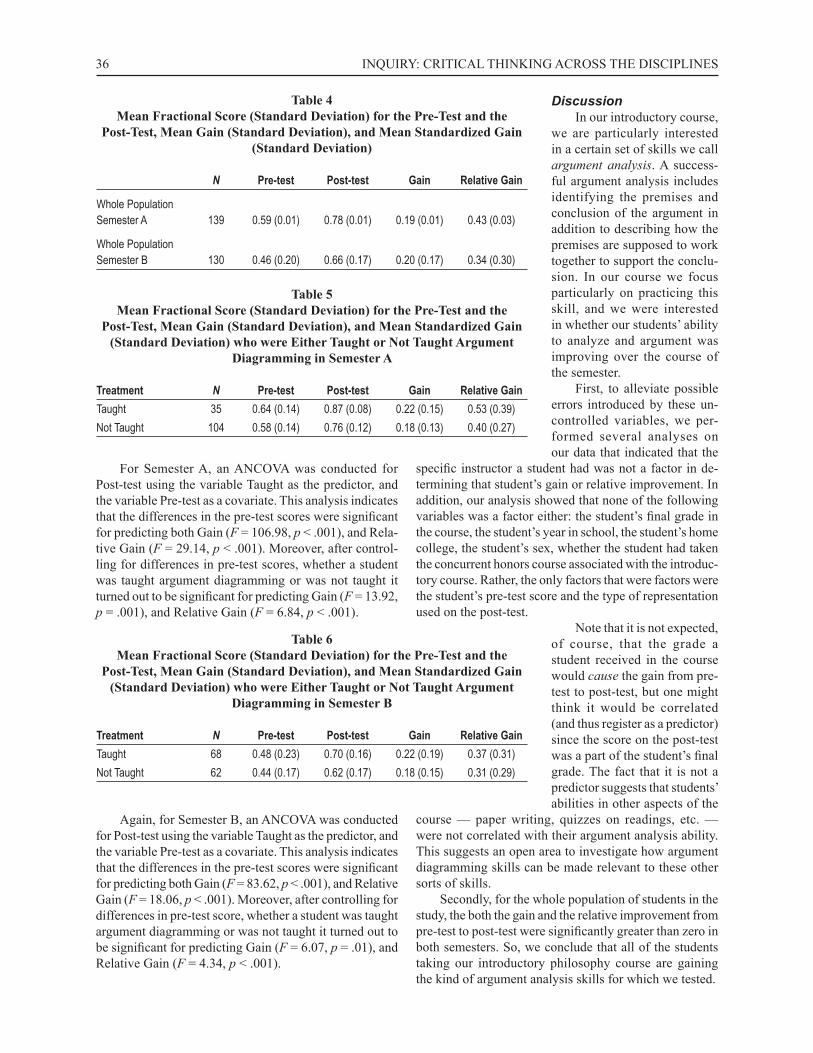
The first hypothesis was that in all of the sections students’ critical thinking skills would improve over the course of the semester. This hypothesis was tested by de-termining whether the average gain of the students from pre-test to post-test was significantly positive. The straight gain, however, may not be fully informative if many stu-dents had fractional scores of close to 1 on the pre-test. Thus, the hypothesis was also tested by determining the standardized gain: each student’s gain as a fraction of what that student could have possibly gained. The mean scores on the pre-test and the post-test, as well as the mean gain and relative gain for the whole population of students for each semesters given in Table 4.
For both Semesters A and B, the difference in the means of the pre-test and post-test scores was significant (paired t-test; p < .001), the mean gain was significantly different from zero (1-sample t-test; p < .001), and the mean standardized gain was significantly different from zero (1-sample t-test; p < .001). From these results we can see that our first hypothesis is confirmed: in each semester, overall the students did have significant gains and standard-ized gains from pre-test to post-test.
Comparison of Students by Treatment: The Second Hypothesis Evaluated
Our second hypothesis was that students who learn argument diagramming will improve their critical thinking skills more than students who do not. We first determined whether, overall, the average gain and relative gain of the students who were taught argument diagramming were statistically significantly higher than the gains of the stu-dents who were not. The scores for Semester A are given in Table 5, and the scores for Semester B are given in Table 6.
36 INQUIRY: CRITICAL THINKING ACROSS THE DISCIPLINES
For Semester A, an ANCOVA was conducted for Post-test using the variable Taught as the predictor, and the variable Pre-test as a covariate. This analysis indicates that the differences in the pre-test scores were significant for predicting both Gain (F = 106.98, p < .001), and Rela-tive Gain (F = 29.14, p < .001). Moreover, after control-ling for differences in pre-test scores, whether a student was taught argument diagramming or was not taught it turned out to be significant for predicting Gain (F = 13.92, p = .001), and Relative Gain (F = 6.84, p < .001).
Again, for Semester B, an ANCOVA was conducted for Post-test using the variable Taught as the predictor, and the variable Pre-test as a covariate. This analysis indicates that the differences in the pre-test scores were significant for predicting both Gain (F = 83.62, p < .001), and Relative Gain (F = 18.06, p < .001). Moreover, after controlling for differences in pre-test score, whether a student was taught argument diagramming or was not taught it turned out to be significant for predicting Gain (F = 6.07, p = .01), and Relative Gain (F = 4.34, p < .001).
DiscussionIn our introductory course,
we are particularly interested in a certain set of skills we call argument analysis. A success-ful argument analysis includes identifying the premises and conclusion of the argument in addition to describing how the premises are supposed to work together to support the conclu-sion. In our course we focus particularly on practicing this skill, and we were interested in whether our students’ ability to analyze and argument was improving over the course of the semester.
First, to alleviate possible errors introduced by these un-controlled variables, we per-formed several analyses on our data that indicated that the
specific instructor a student had was not a factor in de-termining that student’s gain or relative improvement. In addition, our analysis showed that none of the following variables was a factor either: the student’s final grade in the course, the student’s year in school, the student’s home college, the student’s sex, whether the student had taken the concurrent honors course associated with the introduc-tory course. Rather, the only factors that were factors were the student’s pre-test score and the type of representation used on the post-test.
Note that it is not expected, of course, that the grade a student received in the course would cause the gain from pre-test to post-test, but one might think it would be correlated (and thus register as a predictor) since the score on the post-test was a part of the student’s final grade. The fact that it is not a predictor suggests that students’ abilities in other aspects of the
course — paper writing, quizzes on readings, etc. — were not correlated with their argument analysis ability. This suggests an open area to investigate how argument diagramming skills can be made relevant to these other sorts of skills.
Secondly, for the whole population of students in the study, the both the gain and the relative improvement from pre-test to post-test were significantly greater than zero in both semesters. So, we conclude that all of the students taking our introductory philosophy course are gaining the kind of argument analysis skills for which we tested.
Table 4Mean Fractional Score (Standard Deviation) for the Pre-Test and the
Post-Test, Mean Gain (Standard Deviation), and Mean Standardized Gain (Standard Deviation)
N Pre-test Post-test Gain Relative Gain
Whole PopulationSemester A 139 0.59 (0.01) 0.78 (0.01) 0.19 (0.01) 0.43 (0.03)
Whole PopulationSemester B 130 0.46 (0.20) 0.66 (0.17) 0.20 (0.17) 0.34 (0.30)
Table 5Mean Fractional Score (Standard Deviation) for the Pre-Test and the
Post-Test, Mean Gain (Standard Deviation), and Mean Standardized Gain (Standard Deviation) who were Either Taught or Not Taught Argument
Diagramming in Semester A
Treatment N Pre-test Post-test Gain Relative GainTaught 35 0.64 (0.14) 0.87 (0.08) 0.22 (0.15) 0.53 (0.39)Not Taught 104 0.58 (0.14) 0.76 (0.12) 0.18 (0.13) 0.40 (0.27)
Table 6Mean Fractional Score (Standard Deviation) for the Pre-Test and the
Post-Test, Mean Gain (Standard Deviation), and Mean Standardized Gain (Standard Deviation) who were Either Taught or Not Taught Argument
Diagramming in Semester B
Treatment N Pre-test Post-test Gain Relative GainTaught 68 0.48 (0.23) 0.70 (0.16) 0.22 (0.19) 0.37 (0.31)Not Taught 62 0.44 (0.17) 0.62 (0.17) 0.18 (0.15) 0.31 (0.29)

37SUMMER 2012, VOL. 27, NO. 2
This is reassuring because there has not been substan-tial evidence that philosophy courses generally improve critical thinking skills. This lack of evidence could be due to many factors. Of course, it may be the case that the philosophy courses that have been tested do not actually improve critical thinking skills. But, we think it is more likely due to way that the students are tested in these stud-ies. There are well known criticisms of both the CCTST and the WGCTA (e.g., Fawkes et al., 2003; Paul et al., 1990; and Halpern, 1989), for being multiple-choice and/or not adequately addressing the kind of skills in which we are truly interested.
Third, both the gain and the relative gain from the pre-test to post-test of the students who were taught ar-gument diagramming were significantly higher than the gain and relative gain of the students who were taught argument analysis using more traditional methods. Thus, we conclude that the students who were taught argument diagramming improved their argument analysis skills more, over the course of the semester, than the students who were not.
This result is important not least because there have been no studies on the efficacy of argument diagram-ming using both a treatment and a control population and a written test specifically targeting argument analysis skills. Our “homemade” test may not have the portability of test like the CCTST or the WGCTA (so that multiple institutions can be compared), but it does test for the abilities that all of our instructors agree our students should be gaining.
Finally, it seems that the access to a computer program that aids in the construction of an argument diagram (e.g. Reason!Able, Rationale, Argutect, Inspiration) may not be nearly as important as the basic understanding of argument diagramming itself. The students who learned explicitly in class how to construct argument diagrams saw examples of argument diagrams in class that were done by hand by the instructor, and they constructed argument diagrams by hand for homework assignments. While it may the case that access to specific computer software may enhance the ability to create argument diagrams, the results here clearly show that such access is not necessary for improving some basic critical thinking skills.
III. Future Work
This study raises as many questions as it answers. For example, the arguments we used in testing our students were relatively short, so that we could have multiple ques-tions on a 50-minute test. We would like to know what the effect of knowing how to construct an argument diagram would be on a student’s ability to analyze longer and more complex arguments. We suspect that the longer and more complex the argument, the more argument diagramming would help. We are conducting a study now to address this question.
It also seems to be the case that it is difficult for stu-dents to reason well about arguments where they have a passionate belief in the truth or falsity of the conclusion for whatever reason. We would like to know whether the abil-ity to construct argument diagrams aids reasoning about these kinds of arguments, and whether the effect is more or less dramatic than the aid this ability offers to reasoning about topics when there is less emotional investment in the truth of the conclusion.
In our philosophy classes at Carnegie Mellon Univer-sity, we use argument diagramming not only to analyze the arguments of the philosophers we study, but also to aid the students with writing their own essays. We believe that, for the same reasons that constructing these diagrams helps students visually represent and thus understand better the structure of arguments they read, this would help the students understand, evaluate, and modify the structure of the arguments in their own essays better. We would like to know whether the ability to construct arguments actually does aid students’ essay writing in these ways.
We also use argument diagramming for peer review. Students are paired, and they exchange rough drafts of their papers. Rather than generically commenting on the partner’s paper (which has not had much success), the student must try to diagram their partner’s argument. If the student cannot complete the diagram, or creates a diagram different from the one the partner intended, the pairs can have a fruitful discussion about how to improve the paper. We have some anecdotal evidence that this has helped both the peer review process and improved individual student-teacher discussions about the student’s rough drafts. We would like to know if these anecdotes are representative of students’ and teachers’ experiences generally.
Lastly, unlike the relatively solitary activities in which students engage in our philosophy courses — like doing homework and writing essays — there are many venues in and out of the classroom in which students may engage in the analysis and evaluation of arguments in a group setting. These may include anything from classroom discussion of a particular author or topic, to group deliberations about for whom to vote or what public policy to implement. In any of these situations it seems as though it would be advantageous for all members of the group to be able to visually represent the structure of the arguments being considered. We have done some preliminary work in this area, and our findings have been that structured collabora-tion in pairs working with computer-supported argument diagramming software significantly increases the quality of student discussion and critical argumentation in contrast to student working alone with the software (Scheuer et al., 2011). More investigation, however, would determine more precisely the situations in which argument diagram-ming is useful.

38 INQUIRY: CRITICAL THINKING ACROSS THE DISCIPLINES
References
Annis, D., & Annis, L. (1979). Does philosophy improve critical thinking? Teaching Philosophy, 3, 145-152.
Arum, R., & Roska, J. (2011). Academically adrift: Limited learning on college campuses. Chicago: University of Chicago Press.
Fawkes, D., Adajian, T., Flage, D., Hoeltzel, S., Knorpp, B., O’Meara, B., & Weber, D. (2003). Examining the exam: A critical look at the Watson-Glaser Critical Thinking Appraisal Exam. Inquiry: Critical Thinking Across the Disciplines, 21(3), 31-46.
van Gelder, T. J. (2000) Learning to reason: A Reason!-Able approach. In C. Davis, T. J. van Gelder, & R. Wales ed., Cognitive science in Australia, 2000: Pro-ceedings of the fifth Australasian Cognitive Science Society Conference.
van Gelder, T. (2001). How to improve critical thinking using educational technology. In G. Kennedy, M. Keppell, C. McNaught, & T. Petrovic (Eds.), Meet-ing at the crossroads: Proceedings of the 18th annual conference of the Australian Society for Computers in Learning in Tertiary Education (pp. 539-548). Melbourne, Australia: Biomedical Multimedia Uni, The University of Melbourne.
van Gelder, T. (2003). Enhancing deliberation through computer supported visualization. In P. A. Kirschner, S. J. B. Shum, & C. S. Carr (Eds.), Visualizing ar-gumentation: Software tools for collaborative and educational sense-making (pp. 97-115). New York: Springer.
Halpern, D. F. (1989). Thought and knowledge: An intro-duction to critical thinking. Hillsdale, NJ: L. Erlbaum Associates.
Kirschner, P. A., Shum, S. J. B., & Carr, C. S. (Eds.). (2003). Visualizing argumentation: Software tools for collaborative and educational sense-making. New York: Springer.
Kuhn, D. (1991). The skills of argument. Cambridge: Cambridge University Press.
Means, M. L., & Voss, J. F. (1996). Who reasons well? Two studies of informal reasoning among children of different grade, ability, and knowledge levels. Cogni-tion and Instruction, 14, 139-178.
Pascarella, E. (1989). The development of critical thinking: Does college make a difference? Journal of College Student Development, 30, 19-26.
Paul, R., Binker., A., Jensen, K., & Kreklau, H. (1990). Critical thinking handbook: A guide for remodeling lesson plans in language arts, social studies and science. Rohnert Park, CA: Foundation for Critical Thinking.
Perkins, D. N., Allen, R., & Hafner, J. (1983). Difficulties in everyday reasoning. In W. Maxwell, & J. Bruner (Eds.), Thinking: The expanding frontier (pp. 177-189). Philadelphia: The Franklin Institute Press.
Scheuer, O., McLaren, B., Harrell, M., & Weinberger, A. (2001). Will structuring the collaboration of students improve their argumentation? In G. Biswas, S. Bull, J. Kay, & A. Mitrovic (Eds.), Lecture notes in computer science: Artificial intelligence in education – 15th international conference. Berlin: Springer-Verlag, 6738: 544-546.
Stenning, K., Cox, R., & Oberlander, J. (1995). Contrasting the cognitive effects of graphical and sentential logic teaching: Reasoning, representation and individual differences. Language and Cognitive Processes, 10, 333-354.
Twardy, C.R. (2004) Argument maps improve critical thinking. Teaching Philosophy, 27, 95-116.
Author Information
Maralee Harrell, Ph.D. is an Associate Teaching Professor of Philosophy at Carnegie Mellon University. She teaches courses in introductory philosophy, critical thinking, philosophy of physics, epistemology, history and philosophy of science, empiricism and rationalism, and philosophy pedagogy. Correspondence should be ad-dressed to Maralee Harrell, Carnegie Mellon University, Department of Philosophy, 135 Baker Hall, Pittsburgh, PA, 15213, or [email protected].
39SUMMER 2012, VOL. 27, NO. 2
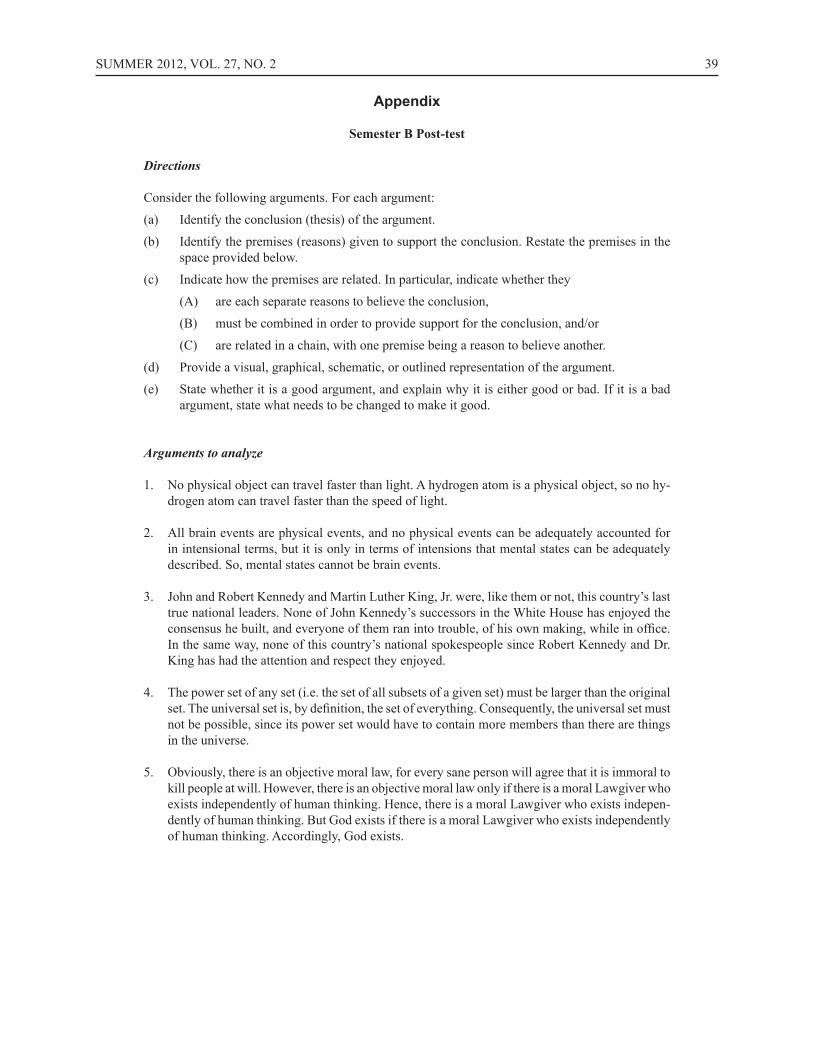
Appendix
Semester B Post-test
Directions
Consider the following arguments. For each argument:
(a) Identify the conclusion (thesis) of the argument.
(b) Identify the premises (reasons) given to support the conclusion. Restate the premises in the space provided below.
(c) Indicate how the premises are related. In particular, indicate whether they
(A) are each separate reasons to believe the conclusion,
(B) must be combined in order to provide support for the conclusion, and/or
(C) are related in a chain, with one premise being a reason to believe another.
(d) Provide a visual, graphical, schematic, or outlined representation of the argument.
(e) State whether it is a good argument, and explain why it is either good or bad. If it is a bad argument, state what needs to be changed to make it good.
Arguments to analyze
1. No physical object can travel faster than light. A hydrogen atom is a physical object, so no hy-drogen atom can travel faster than the speed of light.
2. All brain events are physical events, and no physical events can be adequately accounted for in intensional terms, but it is only in terms of intensions that mental states can be adequately described. So, mental states cannot be brain events.
3. John and Robert Kennedy and Martin Luther King, Jr. were, like them or not, this country’s last true national leaders. None of John Kennedy’s successors in the White House has enjoyed the consensus he built, and everyone of them ran into trouble, of his own making, while in office. In the same way, none of this country’s national spokespeople since Robert Kennedy and Dr. King has had the attention and respect they enjoyed.
4. The power set of any set (i.e. the set of all subsets of a given set) must be larger than the original set. The universal set is, by definition, the set of everything. Consequently, the universal set must not be possible, since its power set would have to contain more members than there are things in the universe.
5. Obviously, there is an objective moral law, for every sane person will agree that it is immoral to kill people at will. However, there is an objective moral law only if there is a moral Lawgiver who exists independently of human thinking. Hence, there is a moral Lawgiver who exists indepen-dently of human thinking. But God exists if there is a moral Lawgiver who exists independently of human thinking. Accordingly, God exists.