Embed Size (px)
Citation preview

University of South Carolina University of South Carolina
Scholar Commons Scholar Commons
Senior Theses Honors College
Spring 2020
Assessing the Feasibility, Costs, and Benefits of Transitioning Part Assessing the Feasibility, Costs, and Benefits of Transitioning Part
of the University of South Carolina Shuttle Fleet to an Alternative of the University of South Carolina Shuttle Fleet to an Alternative
Fuel Source and Promoting Anti-idling Strategies Fuel Source and Promoting Anti-idling Strategies
Eva L. James University of South Carolina - Columbia, [email protected]
Follow this and additional works at: https://scholarcommons.sc.edu/senior_theses
Part of the Environmental Health and Protection Commons, Environmental Indicators and Impact
Assessment Commons, Natural Resource Economics Commons, Oil, Gas, and Energy Commons, and the
Sustainability Commons
Recommended Citation Recommended Citation James, Eva L., "Assessing the Feasibility, Costs, and Benefits of Transitioning Part of the University of South Carolina Shuttle Fleet to an Alternative Fuel Source and Promoting Anti-idling Strategies" (2020). Senior Theses. 377. https://scholarcommons.sc.edu/senior_theses/377
This Thesis is brought to you by the Honors College at Scholar Commons. It has been accepted for inclusion in Senior Theses by an authorized administrator of Scholar Commons. For more information, please contact [email protected].

ASSESSING THE FEASIBILITY, COSTS, AND BENEFITS OF TRANSITIONING PART OF THE UNIVERSITY OF SOUTH CAROLINA SHUTTLE FLEET TO AN ALTERNATIVE FUEL
SOURCE AND PROMOTING ANTI-IDLING STRATEGIES
By
Eva James
Submitted in Partial Fulfillment of the Requirements for
Graduation with Honors from the South Carolina Honors College
May, 2020
Approved:
April Hiscox Director of Thesis
Ben Kessler Second Reader
Steve Lynn, Dean
For South Carolina Honors College

Eva James 2
Table of Contents
Thesis Summary 3
Introduction 4
Literature Review 7
Introduction 7
1. Feasibility, Economic Analysis, & Barriers of AFV, CNG, and Propane Adoption 9
2. Health Benefits, Environmental Benefits, and the Importance of the Public
Perception of AFVs 20
3. Anti-Idling Emission Reduction Benefits and Technologies 26
Methodology 30
Argument 37
Key Finding and Supporting Evidence #1 37
Key Finding and Supporting Evidence #2 50
Key Finding and Supporting Evidence #3 54
Conclusion 58
References 61

Eva James 3
Thesis Summary
The current University of South Carolina shuttle fleet is made up of eleven (11) light duty
shuttles and thirteen (13) heavy duty school buses, all of which rely on gasoline and diesel fuel
sources. This study intends to assess the environmental, health, and economic tradeoffs of
switching part of the existing University shuttle fleet to an alternative fuel source: compressed
natural gas (CNG) or propane (LPG). This study also includes detailed, fleet specific idling-cost
calculations to encourage the adoption of recommended anti-idling strategies. Following an
exhaustive analysis of the available literature that addresses the feasibility of a partial CNG or
propane fuel transition for the UofSC bus fleet, pragmatic and technical research approaches
were employed to dissect the issue at hand. Using data points from a Simple Payback analysis
and On-Road Fleet Footprint analysis, both derived from the Department of Energy's Alternative
Fuel Life-Cycle Environmental and Economic Transportation (AFLEET), this research assessed
the costs and benefits of switching six (6) of the University’s conventional school buses to a
CNG or propane fuel source. The study finds that a partial switch to either alternative fuel
source, CNG or propane, is environmentally and economically feasible if a form of federal or
state funding assistance is available. The experiences of nine universities who have already made
switches to the aforementioned alternative fuel sources are included to assuage alternative fuel
school bus acquisition fears, and to provide rough transition templates by which UofSC could
abide. AFLEET is employed once more to run an Idle Reduction assessment using the current,
2019 University fleet data. Outputs show the annual costs and externality costs of idling for the
light- and heavy-duty portions of the current fleet and reveal the environmental impacts of idling
as well. As a result, Department of Energy supported recommendations to curb idling-practices
are presented in an effort to encourage community driven anti-idling campaigns.

Eva James 4
Introduction In 2018, 28% of total US energy consumption was for transporting goods and persons,
encompassing everyday commutes, interstate traffic, freight trips, and university shuttle and bus
transit services (EIA - Use of Energy Explained, n.d.). Of the national energy used for
transportation fuel, conventional petroleum fuels reigned supreme. The use of gasoline and
distillates (which consist mostly of diesel) made up over two thirds of the US transportation
energy fuels and sources in 2018 (EIA - Use of Energy Explained, n.d.). These conventional fuel
types, diesel and gasoline, come from petroleum-based fossil fuels; they cannot be reused are
inherently unsustainable. Furthermore, gasoline and diesel vehicle emissions are primary sources
of harmful nitrogen oxide (NOx) air pollution and greenhouse gases (GHGs) which cause air
pollution. On its own, NOx includes a highly reactive gases, like NO2, that can lead to
respiratory irritation, lung diseases, and even hospitalization. NOx also reacts with other
chemicals in the air to form both particulate matter and ground level ozone, other chemical
compounds and gases that are detrimental to human health (US EPA, 2015).
Recent oil crises, military conflicts in the Middle East, climate change, health risks, and
patriotic pushes for energy independence have spurred interest in reducing our reliance on these
orthodox, dirty sources of energy. Money and interest have poured into the development and use
of alternative fuels for transportation purposes. An alternative fuel vehicle (AFV) runs on an
energy source that is an alternative from diesel or gasoline, yields energy security benefits, and
offers concrete environmental benefits (US Department of Energy, n.d.). Alternative fuels have
become more and more widely used across the nation, fueling everything from personal pickup
trucks and city transit services, to school buses, and even trains. With proper federal funding
opportunities, shifting from the use of a conventional fuel to an alternative fuel source can

Eva James 5
positively impact energy security and the environment, making the switch even more attractive
to reduce pollution and combat foreign energy dependence (Burnham, 2020, p. 15).
Reducing active emissions from conventional fuel sources is not the only way to combat
the air pollution threat posed by the transportation sector though, as running vehicles generate
deleterious emissions while they are idling as well. In fact, more than 10 seconds of idling can
use more fuel than is required to simply park and restart the engine for most vehicles (SCDHEC,
n.d.). Reducing diesel and gasoline engine idling has proven to result in cost savings, less
pollution, and reduced noise (US Department of Energy, n.d.). Some states have even
implemented anti-idling legislation and incentives to combat the wasted conventional fuel and
increased engine wear that occurs as a result of idling practices.
To relate these important issues of public health, air quality, and cost savings to the
University of South Carolina (UofSC), this study turns its focus to the University’s campus
shuttle fleet. When strolling past the end of UofSC’s iconic horseshoe or heading down to
Williams Brice Stadium to catch the Gamecock football team in action, community members are
met with similar scenes: lines of diesel and gasoline shuttles and buses idling along the curb,
assaulting pedestrians and other drivers with their noxious fumes. The present UofSC shuttle
fleet is made up of eleven (11) light commercial trucks (shuttles) and thirteen (13) school buses,
ranging from brand new to 19 years old. All aforementioned vehicles run on diesel or gasoline,
refueling from private tanks that the University owns and maintains.
Other university shuttle systems across the nation have made the switch to alternative
fuel sources—namely compressed natural gas (CNG) and liquefied petroleum gas (propane).
UofSC has numerous sustainability policies, reports, and initiatives in place. The goal of this
thesis is to show the feasibility of converting a portion of the shuttle fleet to an alternative fuel

Eva James 6
source. UofSC is no stranger to the use of alternative fuel sources. The University used to have
propane fueled police vehicles and an operational propane station on campus. Showing that the
idea to reintroduce alternative fuels has been thoroughly considered can be an easy way to show
current faculty, staff, students, university benefactors, and future Gamecocks that UofSC is
innovative in its approaches to promoting environmental initiatives. Buses have quick turnover
rates, high visibility across campus, and federal incentives exist that can aid the transition to
CNG or propane; therefore, assessing the shuttle system is an opportune way to better UofSC.
The intent of this thesis is to assess feasibility of switching part of the UofSC shuttle service to
an alternative fuel source, CNG or propane, and to present anti-idling benefits and remedies that
can be implemented in the short-term in an effort to lower the University’s harmful NOx
emissions and to promote a more sustainable Carolina.
The following is a comprehensive study analyzing the feasibility, costs, and benefits of
switching some of, or all of UofSC’s current shuttle fleet to CNG or propane. This examination
is followed by a compilation of the costs of idling alongside anti-idling strategies presented to
curb the harmful impact of unnecessary UofSC diesel and gasoline emissions in the short term.
Research methods include the use of Argonne National Lab’s (ANL) Alternative Fuel Life-Cycle
Environmental and Economic Transportation (AFLEET) Tool. This Department of Energy
(DOE) tool is utilized to run three analyses with current shuttle data inputs provided by UofSC: a
Simple Payback, an On-Road Fleet Footprint, and an Idle Reduction analysis.
Furthermore, I present a thorough assessment of nine comparable university shuttle
systems from across the US that have converted to CNG or propane; highlighting their successes,
challenges, and recommendations in hopes that UofSC can review these case studies to support
or encourage their own alternative fuel transition.

Eva James 7
Literature Review
Introduction
The existing body of research on the costs and benefits of AFV adoption is typically split
into two categories: one part analyzing the economic costs and benefits and barriers, the other
looking at the human and environmental impacts. This literature review looks at both of these
types of sources, pulling from scientific articles, government reports, and magazines to put
together an exhaustive analysis of the available research that will help this study address the
feasibility of a CNG or propane fuel type transition for the UofSC bus fleet. The following
collection of articles and reports include two that date back to 1997 and 2001, but most sources
pulled for this review are more contemporary. The literature involves a combination of transit
bus, school bus, and general vehicle research, all of which can be applied in some form to
addressing the hypothetical UofSC bus fleet transition.
Some common themes seen throughout the reviewed research include the need for steady
federal assistance to incentivize AFV adoption, the value of lifecycle cost (LCC) analyses, and
the chicken-and-the-egg-dilemma. The latter is a moniker for the larger problem that drivers and
fleet managers will not find AFVs attractive without ready access to fuel, parts, and repair
services, but energy producers, automakers, and governments will not invest in AFV technology
and infrastructure without the prospect of a large market (Struben & Sterman, 2008, p. 1072).
Proactive economic policies that include capital cost, infrastructure, consumer, automaker, and
fuel provider subsidies (Struben & Sterman, 2008, p. 1072), as well as preferential tax rates (Dyr
et al., 2019, p. 1145) are some of the many solutions researchers propose to resolve the shortage
of funding incentives and make CNG and propane bus AFVs a viable market option.

Eva James 8
Researchers are in agreeance that committing public funds to finance extra investments
for the purchase of CNG buses is deemed suitable proportional to the achieved social benefits
(Dyr et al., 2019, p. 1142). One researcher also called upon governments to promote corporate
social responsibility in supporting eco-friendly innovations like AFV buses. Other commonly
referenced barriers for AFV buses included the high investment costs for vehicles and
infrastructure, insufficient filling station infrastructure, increases in vehicle mass, as well as
immature technologies and general uncertainties surrounding the transition process.
This review found that the most prominent economic factor influencing the switch to
CNG buses was the price difference between natural gas and conventional fuels such as gasoline
and diesel. Propane buses have slightly lower capital and infrastructure investment costs than
CNG buses, and the vehicles require less oil by volume than diesel contemporaries (Thompson,
2019, p. 32). There is also general agreeance in CNG and propane AFV’s ability to combat
energy dependence, air quality issues, and climate change as healthier and more sustainable bus
fuel options. Other notable positive environmental and health factors included the production of
significantly fewer toxic substances and greenhouse gases, particularly CO₂, in CNG vehicles
compared to diesel (Dyr et al., 2019, p. 1135). Propane vehicles reduce the emission of NOx—
oxides of nitrogen that are highly reactive gases composed of nitrogen and oxygen. They form
when hydrocarbon fuels are burned at high temperatures and are one of the biggest challenges to
air quality in the United States (Ryskamp, 2019, p. 4).
The last section of this review is dedicated to a small body of research uncovered on anti-
idling results and technology. The two sources show that driving style and habits have an impact
on fuel consumption and emissions, both of which can have deleterious effects on bus riders and
bystanders. The research recommends that drivers reduce excessive idling time and minimize

Eva James 9
aggressive driving behaviors, such as rapid acceleration and braking in order to help with fuel
consumption (Pace et al., 2007, p. 2086). It also points to anti-idling campaigns having a tangible
effect on the amount of traffic aerosols present in and around school campuses (Ryan et al.,
2013, p. 586).
While there have been many research efforts on AFVs and anti-idling campaigns in the
past two decades, there are noticeable gaps in the literature body that this thesis hopes to remedy
for the purposes of a fleet recommendation for UofSC. Few studies have focused solely on CNG
buses, and even fewer still, on propane buses. Most propane research was inherently bias as well,
as it was funded by/initiated by a candid proponent of propane - The Propane Education and
Research Council (PERC). Only one report was found that directly compared the two common
alternative bus fuel sources. No sources were found that analyzed a CNG or propane collegiate
bus fleet. A combination of transit bus and school buses studies were used instead university
fleets makes up a unique niche that has not been adequately researched yet. Many sources
acknowledge the capital, infrastructure, and maintenance costs that exist with either CNG or
propane fuel switch option, but not specifically how fleets can overcome these barriers by
utilizing available federal and local resources. Furthermore, one last hole in the available
literature is that most anti-idling campaigns target young, grade school aged populations,
omitting college age students and persons who are exposed to similar levels of harmful diesel
emissions from campus bus fleets.
1. Feasibility, Economic Analysis, & Barriers of AFV, CNG, and Propane Adoption
The existing barriers to AFV adoption are often included in preliminary CNG, propane,
or other AFV transitions, and rightly so. Studies dating back as early as 1997 have looked into

Eva James 10
overarching challenges that widespread AFV implementation faces, with economic reasons most
often at the forefront. Obstacles can be placed into three broad categories: insufficient federal
funding, high capital costs, and the chicken-and-the-egg dilemma. Studies have consistently
referenced each of these issues over time, and some sources have synthesized solutions. This
section is broken down into sources that cover general AFV research, CNG-specific research,
and finally propane-specific research
AFVs in General
The landmark piece by Hackney and de Neufville, “Life cycle model of alternative fuel
vehicles: emissions, energy, and cost trade-offs.” The study set the stage for measuring and
documenting AFV performances, policy implications, and impact on the economy and
environment. The piece has been cited by 119 other researchers since being published at the start
of the century, a nod to its influence in the field. It offers a clear comparison of the emissions,
energy efficiency, and cost performance of different fuel and vehicle technologies on a level
playing field, over an identical life cycle that is free of tax incentives and subsidies (Hackney &
de Neufville, 2001, p. 244). The end result of their paper is a comprehensive performance
summary of AFVs and policy implications from their model’s results. Hackney and de Neufville
uniquely choose target “decision makers” and lay out what information these more important
bodies need to make educated policy decisions on AFVs (Hackney & de Neufville, 2001, p.
244).
While some of these earlier recommendations are outdated, they can still provide
valuable insight into the thought-processes that shaped AFV adoption policies. For example, the
advice for modest steps to be taken to prepare for a number of future AFV’s (Hackney & de
Neufville, 2001, p. 263). Other policy recommendations hold true for approaches fleet managers

Eva James 11
should acknowledge today, such as promoting coordinated research by stakeholders in the
various AFV markets Hackney & de Neufville, 2001, p. 263). They also recognized the need to
reduce vehicle emissions in the face of continued VMT growth and an eventual constraint on our
oil supply, issues still faced today (Hackney & de Neufville, 2001, p. 263). Similar, all-
encompassing studies at the same scale that are more recent would benefit the AFV model of
literature tremendously, as well as a study that was AFV-bus specific.
Despite its comprehensive nature, there was a 7-year break before a flurry of AFV
research came out in 2007 and 2008. The slew of publications expanded on Hackney and de
Neufville’s initial policy recommendations and findings, picking out specific alternative fuel
technologies or barriers to study. “An empirical analysis on the adoption of alternative fuel
vehicles: The case of natural gas vehicles” offers a tremendous global perspective on the
adoption of natural gas fueled AFVs in Argentina, Brazil, China, India, New Zealand, Pakistan,
and the US (Yeh, 2007, p. 5865).
Yeh homes in on all things NGV. She analyzes existing major policies aimed at
promoting the use of NGVs, how to implement these policies while targeting likely stakeholders,
and an extensive list of factors that influence the adoption of NGVs. Yeh also provides a
comprehensive review of the NGV market, adoption patterns, infrastructure and cost variables
impactive NGV adoption, and the possible evolution of these factors over time (Yeh, 2007, p.
5865). The study also delves into the importance of fuel and purchase price differences that can
drive NGV transitions, topics that are crucial to many of the other economic feasibility analyses
presented in this review as well as the AFLEET analysis conducted for this thesis. The author
lists the purchase cost of NGVs compared with gasoline or diesel vehicles, natural gas fuel price
at the pump compared with gasoline or diesel, profitability of operating refueling stations, and

Eva James 12
selling/installing vehicle equipment, as economic factors that can affect consumers’ and
investors’ decisions to enter the NGV market (Yeh, 2007, p. 5873).
In applying this paper’s research to a bus fleet transition, one of the most valuable
sections of the study outlined why governments promote NGV adoption, considerations that are
lacking in some of the broad “pro-government AFV funding” statements of other articles.
According to the article, governments promote NGV adoption due to the environmental benefits
of reducing air pollution; the availability of natural gas resources and existing pipeline delivery
infrastructure; and decreased dependency on foreign oil (Yeh, 2007, p. 5865-6). These
government considerations can easily translate into benefits UofSC decision makers should make
note of when eyeing a transition of the current bus fleet to a CNG or propane fuel source.
Yeh notably draws attention to policy instruments that have been successfully applied to
influence the adoption and utilization of transportation technologies (Yeh, 2007, p. 5867).
Technological control-based regulations and market (or impact) based regulations have already
been implemented in the US. An example of these types of regulation in the US is the Corporate
Average Fuel Economy (CAFE) standards of 1975 that were enacted to improve fuel economies
of cars and light trucks manufactured for consumers in America (Yeh, 2007, p. 5867). Incentive
based instruments like R&D and tax credits that target suppliers have been widely suggested by
other sources in this review. Yeh articulates that subsidies and tax credits should also aim to
target individual purchasers and fleet operators such as businesses units and government
agencies (Yeh, 2007, p. 5867). This conclusion can be relevantly expanded to include other
decision-making fleet heads, such as universities.
Yeh does not explicitly reference the chicken-and-the-egg-dilemma that AFVs face, but
she presents several market-creation initiatives that would adequately tackle the issue of dual-

Eva James 13
sided market-demand. These policy instruments include government procurement preferences;
requirements for disclosure of fuel consumption, safety, and performance; adoption targets for
AFV fleet vehicles; direct investments in refueling stations, and service networks (Yeh, 2007, p.
5867). Although each of these policy instruments are valuable ideas to draw inspiration from for
assisting in the adoption of an AFV UofSC bus fleet, the existing body of literature faces a
shortage of recommendations for the path to increased adoption in AFV bus or shuttle fleets,
specifically. It seems research is ramping up in this niche, but it has not caught up to the plethora
of studies available on light-duty AFV vehicles.
A notably cited article from 2008, “Refueling availability for alternative fuel vehicle
markets: Sufficient urban station coverage” by researchers Melaina and Bremson highlights a
number of long-term challenges that transportation energy systems face. These hurdles include,
but are not limited to, climate change, urban air pollution, energy security, limited inexpensive
oil resources, and continued growth in demand for transportation services. This article is a great
resource as it goes on to focus on one of the biggest challenges, other than cost, that AFV
adoption faces—the lack of filling stations.
Researchers across articles have referred to this issue at the chicken-and-the-egg-
dilemma: there are not enough AFV filling stations available to make AFVs attractive but there
are not enough consumers pushing for AFVs to make filling stations attractive. At some point in
time, a necessary level of station coverage must be established to satisfy the refueling needs of a
large fraction of potential AFV early adopters (Melaina & Bremson, 2008, p. 3234). Melaina and
Bremson suggest fears will go away once fuels are available at 10% of existing stations, a
number that Kazimi also used in her CNG price changing modeling study from 1997. This

Eva James 14
source, as well as the reviewed body of literature, did not explicitly elaborate on the station needs
of medium-and-heavy-duty (MHD) AFV’s, a major hole that needs to be filled.
Another highly influential 2008 article in the field of AFVs by Struben and Sterman gives
insight into the consumer side push for AFVs and change. The article, “Transition challenges for
alternative fuel vehicle and transportation systems” focuses on the generation of consumer
awareness of alternatives through feedback from consumers' experience, word of mouth, and
marketing (Struben & Sterman, 2008, p. 1070). Since its publishing in 2008, the Struben and
Sterman study has been cited over 450 times by articles on sustainable mobility, transition
failures, greener US oil consumption practices, and more. The researchers demonstrate the
existence of an AFV critical threshold that must be met to sustain adoption of AFVs. The AFV
threshold and its feedbacks depends on a mix of economic and behavioral parameters which can
be extended to apply to the realm of bus fleets and transit. Feedbacks include expansions in AFV
research and development, learning by doing, technological spillovers between platforms, and
the development of fueling infrastructure (a solution to the aforementioned chicken-and-the-egg-
dilemma) (Struben & Sterman, 2008, p. 1071). The authors discuss the importance of word of
mouth from non-AFV drivers in promoting diffusion and “dethroning” a market that is
dominated by internal combustion engines (Struben & Sterman, 2008, p. 1071).
Unsurprisingly, the research reveals the need for infrastructure subsidies that can push the
AFV base over the critical threshold. Other studies in this review have mentioned subsidies, most
explicitly calling out for help with the initial infrastructure costs propane and CNG require.
While increased monetary support from federal sources has been a common theme for
overcoming AFV barriers, Struben and Sterman dive into the more social aspects of promoting
AFV adoption. Word of mouth and marketing stimulate awareness and adoption, boosting

Eva James 15
revenue and the number of installed bases of new vehicles, generating still more word of mouth
and marketing expenditure: a positive feedback (Struben & Sterman, 2008, p. 1072). These
findings were key as public perception and conversations will be crucial in getting AFV bus fleet
conversations initiated at UofSC.
Compressed Natural Gas
Moving into the more CNG and AFV bus-specific portion of the feasibility, economics,
and solutions section of this review, it is appropriate to start with a study conducted by the Clean
Cities branch of the DOE in 2004. The report, titled, “Economic Analysis of Alternative Fuel
School Buses” presents a simplified payback analysis of natural gas and propane buses. This
study uses language and presents findings that are broken down in a way that a non-academic
reader could see the benefits of choosing AFV busses; a necessary consideration when
presenting a case to a university or corporate fleet manager versus an expert in the AFV field.
The study found that in general, natural gas is less expensive on an energy equivalent basis
compared to convention (diesel or gasoline) fuels (Laughlin, 2004, p. 2). The analysis laid out
easily digestible positive and negative aspects of natural gas use in buses, finding that NGVs are
cleaner burning compared to diesel and gasoline and can sustain longer oil change intervals, but
NGVs have only 75% of the fuel economy of diesel buses and still require greater upfront capital
costs (Laughlin, 2004, p. 2).
Luckily, there were many up-to-date publications on CNG LCCs to pull from, including
landmark, real-world research that wrapped up in late 2019. The specific case study, “Health
Benefits from Upgrading Public Buses for Cleaner Air: A Case Study of Clark County, Nevada
and the United States” by Olawepo and Chen looked at the Regional Transport Commission of
Southern Nevada (RTC). The RTC has been transitioning from diesel to CNG transit busses

Eva James 16
since 1999; as of early 2019, 75% of the fleet was using CNG. Calculated health benefits in
economic value are discussed alongside the life cycle cost of CNG versus diesel buses and
current levels of federal assistance available to transition programs across the U.S. The study
utilized the EPA’s Co-Benefits Risk Assessment Model (COBRA) which evaluates the impact of
cleaner energy policies through exposure assessment; estimation of health impact associated with
the exposure; and estimation of economic value of the health impacts (Olawepo & Chen, 2019,
p. 2-3). The AFLEET tool utilized for the UofSC Fleet Analysis has less emphasis on health
effects but looks at similar air quality metrics and their anthropogenic consequences.
The authors drew important and fresh health related conclusions that bolster the argument
to make the switch to CNG in a field of research that is growing older. Assuming a bus service
life of 12 years (500,000 miles) regardless of technology, there is an estimated life cycle cost
(LCC) of $0.815–0.875 million for diesel and $0.780–0.838 million for CNG transit buses in the
US for 2015; so diesel is up to $95,000 more expensive over a vehicle’s lifetime (Olawepo &
Chen, 2019, p. 7). This is key for the literature as a whole in showing that CNG-powered transit
buses are, in fact, competitive with diesel buses on the LCC basis and become an economic
choice when accounting for air quality and health benefits discussed later (Olawepo & Chen,
2019, p. 7).
Olawepo and Chen’s research also offers justification to further public investment in
cleaner bus fleets at both regional and national levels, investment that UofSC can benefit from
(Olawepo & Chen, 2019, p. 2) A common thread throughout many of the cited reports and
articles, the authors of this study highly recommend expanding or creating more consistent
federal assistance to accelerate nationwide transition to cleaner bus fleets. Cleaner fuel
transitions are delayed due to capital expenses incurred by local transportation agencies and

Eva James 17
increasing federal investment to address this barrier is justified by gains in US public health
(which will be discussed in the next sub-section) (Olawepo & Chen, 2019, p. 8).
Another recently published article in the Journal of Cleaner Production by Dyr et al.
titled, “Costs and benefits of using buses fueled by natural gas in public transport,” offered a
global take on the costs and benefits of increasing natural gas fuel use in transit systems. The
article aimed to answer the question: why is CNG transit use so low? Researchers identify the
costs and benefits of using CNG buses and compare cash flows of the use of CNG and Diesel
buses in an effort to create an econometric model for forecasting the operating costs. This model
was then employed to assess the effectiveness of using CNG buses in public transport and
recommendations for economic policy were formulated from the results (Dyr et al., 2019, p.
1134). The econometric approach to modeling the LCC and benefits of CNG buses is similar to
the AFLEET model utilized in the UofSC Fleet Analysis in that it considers buses technical
wear, mileage, and model year (Dyr et al., 2019, p. 1135). This indicates that AFLEET is an
appropriate and adequate fleet measurement tool to employ.
Propane
Overall, there was a surprising imbalance in the number of studies available for CNG
versus propane fueled buses. Propane is a well-known, well publicized alternative fuel source for
buses, but research on its use and feasibility it is not nearly as extensive and does not extend as
far back as studies that are available for NGVs. Existing research is more bus-specific than for
other fuel options. Two recent articles in School Bus Fleet expand on various aspects of propane
adoption in buses (Thompson, 2019 & Schlosser, 2019). The magazine covers all aspects of the
school bus industry, reporting on national conferences, crashes, awards, new technology, and
more.

Eva James 18
Assistant editor, Sadiah Thompson, penned an article in early 2019 titled, “Embracing
Best Practices for Propane,” in response to growing demand for propane buses across the nation
(Thompson, 2019, p. 32). In the article, industry experts share their advice and best practices for
maintaining propane school buses, comparing diesel and propane upkeep and delving into fuel
savings and infrastructure. According to the contributors, there are several options for fueling
that propane fleets can explore, each being a potential option for a propane fleet at UofSC to
employ. Fleets can use a typical fueling station, a vendor that is paid to come fill the buses while
they are parked in the central depot, or propane fueling tanks. The latter is cited as the best
option for larger fleets (Thompson, 2019, p. 34). Experts also weighed in on transition logistics.
Existing maintenance and garage facilities do not require costly modifications during a fleet’s
transition to propane if existing buildings are code compliant for diesel and gasoline (Thompson,
2019, p. 34). Lastly, the article listed several top tips for maintenance: regularly maintaining the
fuel pump, consistent oil checks, completing spark plug and fuel filter changes, and inspecting
frosted fuel lines (Thompson, 2019, p. 34). These technical recommendations are a refreshing
break from a body of literature that is overwhelmingly emission and cost analysis heavy.
The second School Bus Fleet article, “Fleet Mix Includes More Alt-Fuel Buses as Diesel
Holds Steady,” was written by Nicole Schlosser, an executive editor, in late 2019. The sponsor
of the article, PERC, raised a red flag about possible reporting bias, but the research cited is
credible and referenced later (see Ryskamp’s “In-Use Emissions and Performance Testing of
Propane-Fueled Engines”). Schlosser completed a school district fleet survey that showed school
districts are still purchasing diesel school buses in high numbers, but electric and propane buses
are making up a larger and growing share of fleets (Schlosser, 2019, p. 24). This survey shows
national trends favor propane adoption over other alternative fuel options. UofSC would not be

Eva James 19
alone in undergoing an AFV adoption as 29.5% of the fleets surveyed had fleet sizes comparable
to UofSC’s. 72% of districts reported buying new school buses for the 2019-2020, 93% of which
bought all or some diesel (Schlosser, 2019, p. 24). UofSC falls among this population of recent
diesel purchasers having acquired a diesel Thomas Saf-T bus in 2019. Propane was third in
percentage of new school buses purchased, behind gasoline but leading electric and CNG
(Schlosser, 2019, p. 24).
Schlosser’s article goes on to list five reasons propane autogas is good for school
transportation purposes. Their recommendations should be taken with the sponsor of the article,
PERC, in mind though. The five reasons given boast propane’s 96% fewer NOx emissions, low
fuel cost, market longevity, ability to perform, and innovative clean performance technology, all
in comparison to traditional diesel fuel (Schlosser, 2019, p. 25). These findings somewhat
complement other propane research from this literature body, in saying that propane fuel costs
are lower than diesel. In comparison to other sources, Schlosser goes into more detail and as the
most recent propane source cited, the cost estimates are the closest to today’s prices. The author
states that propane is 93% more cost effective at $0.19/mile compared to diesel that sits at
$0.80/mile, both numbers accounting for fuel and maintenance (Schlosser, 2019, p. 25). One last
propane versus diesel comparison the magazine makes is a take on LCCs, assuming that if school
buses were driven 12,000 miles driven/year for 15 years, propane buses would see $7,320 year 1
savings and $109,800 lifetime savings compared to a traditional diesel bus (Schlosser, 2019, p.
25). Lifetime cost projections for propane and CNG buses are a crucial component of many of
the sources referenced in this review. They offer a tangible amount of savings that fleet managers
can reference in weighing the benefits and costs of an AFV adoption.

Eva James 20
Drawing again on the payback analysis by Clean Cities and the DOE, research shows that
propane can be less expensive on an energy basis than conventional fuels, and propane bus oil
changes can be lengthened as well (Laughlin, 2004, p. 5). Laughlin’s economic analysis of
propane buses states that as with natural gas, fleets must consider propane infrastructure costs
when eyeing a transition to an alternative fuel source. This being said, propane buses have less
expensive refueling stations, vehicle costs, and fuel tanks compared to natural gas
contemporaries, but the fuel price differentials are smaller between propane and diesel (Laughlin,
2004, p. 5). This analysis is an important addition to the literature review as a whole because it
directly compares the costs and benefits of propane and CNG bus transitions and overarching
considerations that should be taken in choosing between the two. This area of comparative
literature between the two popular AFV bus fuel sources is lacking, and the AFLEET analysis
and subsequent research hope to alleviate this gap.
2. Health Benefits, Environmental Benefits, and the Importance of the Public Perception of
AFVs
Aside from economics, the use of AFVs is also tied to issues of public health,
environmental impacts and public perception. Austin et al. (2019) deftly shows the benefits of
diesel emission reductions. The recent, 8-year study on 2656 school bus retrofits in Georgia
calculated the effects of diesel emissions on student health and academic performance (Austin et
al., 2019, p. 109) finding significant improvement on aerobic capacity, a good measure of
respiratory health as well as increased English and math test scores. (Austin et al., 2019, p. 120).
In “School bus emissions, student health and academic performance,” the diesel after-exhaust
treatment retrofits studied were diesel particulate filters, diesel oxidation catalysts, flow-through

Eva James 21
filters, and closed crankcase filters. While diesel is not one of the alternative fuels focused on
here, the study does illustrate the health benefits a younger population reaps from reducing diesel
emissions, which a switch to alternative fuels can also achieve
Compressed Natural Gas
One of the few pieces that falls solely into the 'environmental benefits niche’ is an early
study performed by Kazimi titled, “Evaluating the Environmental Impact of Alternative-Fuel
Vehicles.” This piece, unlike most of the other available literature, does not delve into the human
health benefits of reduced emissions, mainly focusing on emissions and air quality. Kazimi uses
a microsimulation model to study emission levels in Los Angeles as CNG (and other alternative
fuel vehicles) are "introduced” under various price points (Kazimi, 1997, p. 163). The research
showed that price reductions for alternative-fuel vehicles were effective in leading to reductions
in total emissions, despite the usage tradeoffs that households make between limited-range
vehicles and older gasoline vehicles. This usage tradeoff can be compared to tradeoffs a bus fleet
manager may decide to make between a newer but shorter range CNG bus and an older, longer
range diesel bus, a cost that was not mentioned in other literature that was reviewed. The shorter
range of AFVs can lead to a potential increase in emissions due to shorter ranges and potentially
more reliance on diesel or gasoline vehicles (Kazimi, 1997, p. 164). Kazimi also found that at the
time, a 30% reduction in the price of compressed led to a 0.1-1.8% reduction in NOx emissions
per year (Kazimi, 1997, p. 165). This is another justification for increased availability of federal
funding and incentives mentioned in a majority of reviewed works.
Now returning back to the 2019 research by Olawepo and Chen that assessed the local
and national health and wellbeing impacts of transitioning Nevada RTC transit buses from diesel
to CNG through improved air quality. It is key to note that health benefits from emission
Eva James 22
reductions are not limited locally (Olawepo & Chen, 2019, p. 7) and can reach far beyond the
UofSC campus and metropolitan Columbia area. When factoring in the health benefits and the
aforementioned LCC, CNG powered buses are a favorable option (Olawepo & Chen, 2019, p. 8).
Approaching natural gas AFV adoption from a different and arguably more
environmentally conscious angle, researchers from Carnegie Mellon University compared life
cycle GHG emissions from different natural gas pathways for MHDVs. “Comparison of Life
Cycle Greenhouse Gases from Natural Gas Pathways for Medium and Heavy-Duty Vehicles,”
evaluates whether the best strategies in terms of emissions reductions still hold when one
accounts for the full life cycle emissions. This study is unique and influential in that it does not
look at diesel emission reductions and air quality improvements, but rather the sole impacts
NGVs potentially have on the environment. The authors address a key gap in current policy
discussions that only consider “use phase” emissions (Tong et al., 2015, p. 7124). The study
concludes that none of the natural gas pathways, CNG included, achieve any emission reductions
for Class 8 trucks compared to conventional diesel when full lifecycle emissions, including
methane involvement, are considered (Tong et al., 2015, p. 7124-5).
The authors end on a positive note though in acknowledging the tailpipe benefits from
using NGVs for road transportation, citing health benefits, reduced air pollutants, and lower
operating noises (Tong et al., 2015, p. 7130). This article serves as a nice reality-check in that the
emission reduction conclusions of other articles in this review can have multiple sides to the
story. It should be noted that the study does not explicitly reference school buses, but rather
categories of Class 8 trucks in general. The researchers suggest strategies to reduce the carbon
footprint of using natural gas for MHDVs such as increasing vehicle fuel efficiency, reducing
life cycle methane leakage rate, and achieving payloads and cargo volumes that are comparable

Eva James 23
to conventional diesel trucks (Tong et al., 2015, p. 7123). The anti-idling practices laid out in a
later section of this thesis hope to tackle fuel efficiency issues. The AFLEET analysis also
attempts to capture the true cost of AFV options UofSC can pursue that are in alignment with the
findings of Tong et al.’s study.
An extensive survey conducted by the National Renewable Energy Laboratory (NREL)
titled, “Compressed Natural Gas (CNG) Transit Bus Experience Survey,” aimed to collect and
analyze qualitative data from U.S. transit agencies with varying degrees of CNG bus and station
experience (Adams & Horne, 2010, p. 1). The researchers, Adams and Horne, collected this
information more specifically to unearth problems, mistakes, and areas where CNG services
could benefit from added federal or technical assistance. This being said, the report paints a
sometimes-grim portrait of CNG services, but this is in an effort to publicized pitfalls others can
avoid and learn from (Adams & Horne, 2010, p. 26). The survey covered 10 transit agencies that
represented an array of fleets. The fleets covered were made up of various sizes, management
systems, station ownership and operation dynamics, and geographic locations. The diversity of
the interviewed CNG services aids in the application of the survey’s findings to the
recommendations put forth for the UofSC bus fleet. This survey is a valuable complement to the
body of literature reviewed, especially the Nevada RTC Case Study by Olawepo and Chen. The
survey summarizes CNG bus service success stories, logistics, and issues, while most other
scientific articles lean heavily on models and simulation results versus real world scenarios.
Adams and Horne found that most agencies had limited concerns with the design and
reliability of CNG stations, and the fuel economy in CNG buses is approximately 20% lower
than in diesel buses. A valid concern was noted in this study. An inoperable station could ground
an entire fleet, an issue that would not be faced by a traditional, diesel bus fleet (Adams &

Eva James 24
Horne, 2010, p. 1). Keeping on trend with the entire majority of the available body of literature
on AFV adoptions, the survey listed needs for government assistance. The needs are agency-
identified though, lending them a different form merit and attention than others that are proposed
from a researcher’s standpoint. Agencies praised the $0.50 per gasoline gallon equivalent fuel
subsidy and its efficient delivery; however, some wanted the subsidy to be made permanent to
better quantify financial certainties of operating costs for their 12-year bus purchase
commitments (Adams & Horne, 2010, p. 2). Surveyed transit agencies identified a need to assist
engine manufacturers in entering the CNG market and developing durable products; more
durability and fuel economy testing; and the need for help in training employees and technicians
in CNG practices (Adams & Horne, 2010, p. 2). These last three recommendations are a nod to
the importance of agency-identified government assistance as these recommendations have not
been proposed by any other source in this review.
As with the survey’s unique list of agency-identified federal assistance needs, there is
also a list of issues CNG service providers have experienced. Again, these were documented and
shared in an effort to prevent others from making or experiencing the same errors. Engine
liability, failing sensors, short turbo life, failure of usually reliable parts (eg. Exhaust manifolds),
and bus fires were listed as problems agencies faced (Adams & Horne, 2010, p. 25). These are
unique in that they too have not been brought up by other sources in this literature review, and
they are also mostly mechanical in nature. Is should be noted that the bus fire issue is partially
irrelevant in that agencies considered fires a normal occurrence and indicated a similar
percentage of fires in diesel buses (Adams & Horne, 2010, p. 24).
To end the “Compressed Natural Gas (CNG) Transit Bus Experience Survey,” Adams
and Horne synthesized some of the positive experiences and metrics CNG agencies shared.

Eva James 25
Among these positives were lower fuel costs for CNG vs. diesel (before and after federal rebates
of $0.50/GGE); stability and projected longevity in the low cost of CNG; domestic sourcing;
high engine durability; no issues of diesel spills; improved air quality and cleanliness in agency
garages; and a feeling of environmental stewardship that gives their transit agency a positive
branding image (Adams & Horne, 2010, p. 27).
On a note of public perception, the survey looked at ridership and the public as two
distinct groups. Agencies enjoyed “halo” effect reactions from both groups upon introduction of
CNG though, as riders and the public noticed the buses were cleaner than the diesel buses they
replaced (Adams & Horne, 2010, p. 23). Nonetheless, this effect dies down and both groups have
accepted CNG transit as the norm, not seeing any safety concerns with the AFVs either (Adams
& Horne, 2010, p. 2). Driver acceptance was along similar lines: CNG buses became “business
as usual” (Adams & Horne, 2010, p. 2). These riders’, public, and driver perceptions are key
considerations for a UofSC transition, as the decision would need public support and sustained,
or increased ridership once adopted.
Propane
Completed in 2018, an extensive study by researchers at the West Virginia University
looked into propane school buses and their emissions levels during real world testing scenarios.
The study, “In-Use Emissions and Performance Testing of Propane-Fueled Engines,” involved
two types of tests at different times of the year on four (4) Blue Bird school buses, models
similar to those used in the current UofSC fleet. In terms of measuring the air quality impact of
propane buses, this study is paramount in its field. It directly compares NOx, CO, and CO2
emissions between propane and diesel school buses under a variety of different routes and
conditions. A 2015 propane school bus and a 2014 diesel school bus were tested in January and

Eva James 26
February 2018, after which a 2017 propane bus and a 2017 diesel bus were tested in July and
August 2018 in order to confirm the results of the first round of testing.
Important findings included higher distance specific NOx emissions measured from the
diesel buses, and higher distance specific CO emissions measured from the propane buses for all
routes. (Ryskamp, 2019, p. 66) It is important to note that low ambient temperatures may have
exacerbated the NOx emissions from the diesel school bus in addition to the low speed and low
load operation contained in the tested routes (Ryskamp, 2019, p. 66). Slightly higher CO
emissions are not as large of a threat to human health as NOx emissions, currently, as there are
no longer any non-attainment areas for CO in the United States. Non-attainment areas are
locations that do not meet primary air quality standards. NOx is a predominant attainment
concern for many areas of the US Ryskamp, 2019, p. 67).
CO2 emissions varied for both fuel types. Average distance specific CO2 emissions were
similar yet slightly higher for the propane school bus operated over one particular route, however
lower on average for the propane bus over a stop and go route, compared to the diesel buses
(Ryskamp, 2019, p. 67). Again, this comparative work is priceless in evaluating the real costs
and benefits of transitioning to an alternative fuel fleet. It also highlights the importance of
conducting an analysis that compares different types of emissions which is rare in the propane
and CNG field. The AFLEET analysis performed using the UofSC fleet data will contrast similar
GHG emissions levels from diesel versus AFVs.
3. Anti-Idling Emission Reduction Benefits and Technologies
The final section of this literature review analyzes two academic articles covering anti-
idling techniques and benefits. The first article, “The Impact of an Anti-idling Campaign on

Eva James 27
Indoor Aerosol at Urban Schools,” by Ryan et al. examines how changes in outdoor, traffic
related aerosols translated into changes in indoor aerosol concentrations due to an anti-idling
campaign. The study looks at four urban middle and elementary schools that utilize solely diesel
buses whose campuses surrounded by fairly constant traffic mirrors the environment found at
UofSC. One glaring weakness of this article is its use of only four schools within a certain
geographic location, but the findings presented are still useful in comparing the effectiveness of
anti-idling campaigns in a contemporary setting. Researchers found that changes in outdoor air
quality due to the anti-idling campaign can reduce children exposure to traffic aerosols inside
school buildings when traffic emissions are the main pollutant source in a school’s vicinity
(Ryan et al., 2013, p. 586). These conclusions were drawn after accounting for background
aerosol levels and ambient air quality (Ryan et al., 2013, p. 585) which would be hard at UofSC
as there are a multitude of other buses and shuttles that run through campus regularly. Further
studies of indoor and outdoor air quality within USC facilities may be warranted.
The second piece looks at a new type of onboard-bus technology that could actively
combat aggressive driving and idling habits in drivers. Pace et al. present an innovative approach
to two pervasive issues in bus-driving that transcend fuel type used. In the article, “Celerometer
and Idling Reminder: Persuasive Technology for School Bus Eco-driving” researchers tackle
idling and low fuel economy, as a result of aggressive driving techniques (Pace et al., 2007, p.
2086). The authors designed a feedback system to encourage more fuel-efficient driving habits
among school bus drivers by providing real-time, in-vehicle feedback for self-monitoring. The
goal of the study was to determine if an in-vehicle interface could be successful in persuading
school bus drivers to reduce idling and aggressive driving, as the real time feedback system will

Eva James 28
allow the driver to monitor acceleration/braking as well as idling time (Pace et al., 2007, p.
2086).
The heads-up display (HUD) celerometer serves as a measure of aggressive driving by
displaying the current rate of bus acceleration or deceleration the vehicle is undergoing. This
measurement takes the form of a spectrum of colored bars, moving from small, green to large,
red bars. To reinforce the relationship between the colored celeration spectrum and fuel
economy, the HUD also displays active miles per gallon (MPG) (Pace et al., 2007, p. 2088). This
addition is a smart inclusion on the researcher’s part as most correlate fuel economy feedback in
terms of MPG and not necessarily celeration to begin with.
In comparison to traditional anti-idling efforts, which lean heavily on behavioral changes
rather than technological advancements, this study was groundbreaking but possibly impractical
in its real-world applications. It is groundbreaking in the sense that it provides a tangible,
implementable solution to both anti-idling and aggressive driving issues that bus fleets face,
regardless of fuel type used. It is infeasible in that the HUD technology used is likely outride of a
price range most fleets, including UofSC, could afford to put in each of its shuttles and buses.
The conclusions also do not explicitly state that idling times decreased after installing the HUD
the device, rather the device had a significant effect on participants driving less aggressively
(Pace et al., 2007, p. 2089)
Unrelated to the HUD, the researchers’ field study indicates that enforcement and
compliance are low with EPA-recommended anti-idling policies, and virtually no measures have
been implemented to discourage against aggressive driving (Pace et al., 2007, p. 2086). This is
discouraging but also unsurprising information on the importance school districts assign to air
quality initiatives. The field study results reveal lack of uptake at levels that are typically

Eva James 29
considered, posing a grim forecast for relevance at the university and college level where
policies are considered even less. The researchers did offer some recommendations for
encouraging anti-idling habits though, recommending administrations start paying attention to
fuel economy or offer rewards to top-performing drivers to increase motivation (Pace et al.,
2007, p. 2086-8). Again, the body of literature currently available is lacking in regard to anti-
idling around college and university campuses. Most anti-idling campaigns and studies found
have been performed in the context of addressing air pollution surrounding pre-, middle, or high
schools. The anti-idling campaign-style ideas presented later in this paper are an attempt to fill
this gap in knowledge.

Eva James 30
Methodology
To determine whether or not it is feasible to switch part of the UofSC shuttle fleet to
CNG or propane, two different analytical approaches were used—one that was reliant on
statistics and data manipulation, the other that was more anecdotal and based in best-practices.
Evaluating the possibility of UofSC making a transition to an alternative fuel source required a
combination of technical expertise and social evaluation, both of which were covered by the
following procedures. Addressing the given problem from several different angles allowed for
the most adequate and exhaustive answer to the first part of the research question. A similar,
dual-pronged research approach was taken regarding the anti-idling suggestions UofSC should
retain to produce equally comprehensive results.
As presented in the preceding Literature Review, it is important to incorporate cost-
benefit and LCC analyses when measuring the reality of implementing alternative fuels for a
particular fleet. For this reason, ANL’s AFLEET Tool and fleet data provided by the University
were used to run a series of Simple Payback assessments and an On-Road Fleet Footprint
analysis. These two analyses comprised the technical approach for this study. They were chosen
to mirror some of the complex models scholars ran in groundbreaking AFV, CNG, and propane
research assessments. The UofSC shuttle fleet is composed of a mix of eleven (11) light-duty
vehicles (LDV) and thirteen (13) heavy-duty vehicles (HDV). This unique composition made
AFLEET an ideal tool to use as it can process LDV and HDV inputs and outputs simultaneously.
The Simple Payback Calculator examined acquisition and annual operating costs to
calculate a simple payback for purchasing a new AFV as compared to its conventional
counterpart. The analysis also calculated average annual petroleum use, GHGs, and air pollutant
emissions (Burnham, 2020, p. 1). To get these valuable outputs, the primary vehicle location

Eva James 31
(Richland County, South Carolina), number of LDV and HDVs in the fleet, annual mileage, fuel
economy, and purchase price for each vehicle were inserted into the AFLEET Inputs
spreadsheet. A monthly mileage estimate of 3,000 for each vehicle was provided by UofSC. This
number did not account for off peak time periods when the University is at a lower operating
capacity (eg. December-January and summer months). This number was adjusted to 2,500
miles/month and multiplied by 12 to produce the necessary annual mileage input.
Due to limits on the fleet data that was provided from UofSC, this study relied on
AFLEET’s default estimates for vehicle MPG, acquisition costs for light commercial trucks
(LCT) and school buses, and maintenance (scheduled) and repair (unscheduled) costs on a per
mile basis for each vehicle type. The current UofSC fleet composition, in AFLEET terminology,
was as follows:
• Ten (10) gasoline fueled LCTs
• One (1) diesel fueled LCTs
• Thirteen (13) diesel fueled school buses
See Table 1 below for a more detailed spreadsheet with each fleet vehicle’s year, make, model,
fuel type, fuel economy, and purchase price.
Row Year Make Model AFLEET Vehicle
Type Fuel Type
Annual Mileage
AFLEET Fuel
Economy (MPG)
AFLEET Purchase
Price
1 2012 Ford E450 Light Commercial Truck Gasoline 30,000 13 $ 36,000
2 2012 Ford E450 Light Commercial Truck Gasoline 30,000 13 $ 36,000
3 2012 Ford E450 Light Commercial Truck Gasoline 30,000 13 $ 36,000
4 2012 Ford E450 Light Commercial Truck Gasoline 30,000 13 $ 36,000

Eva James 32
5 2012 Ford E450 Light Commercial Truck Gasoline 30,000 13 $ 36,000
6 2014 Ford E450 Light Commercial Truck Gasoline 30,000 13 $ 36,000
7 2014 Ford E450 Light Commercial Truck Gasoline 30,000 13 $ 36,000
8 2014 Ford E450 Light Commercial Truck Gasoline 30,000 13 $ 36,000
9 2015 Ford T350 Light Commercial Truck Gasoline 30,000 13 $ 36,000
10 2016 Ford E450 Light Commercial Truck Gasoline 30,000 13 $ 36,000
11 2004 Glaval Universal Light Commercial Truck Diesel 30,000 15.6 $ 46,500
12 2001 Blue Bird
All American School Bus Diesel 30,000 7.7 $ 90,000
13 2001 Blue Bird
All American School Bus Diesel 30,000 7.7 $ 90,000
14 2007 Thomas Type A School Bus Diesel 30,000 7.7 $ 90,000 15 2007 Thomas Type A School Bus Diesel 30,000 7.7 $ 90,000 16 2007 Thomas Type A School Bus Diesel 30,000 7.7 $ 90,000 17 2007 Thomas Type A School Bus Diesel 30,000 7.7 $ 90,000 18 2012 Thomas C2 School Bus Diesel 30,000 7.7 $ 90,000 19 2012 Thomas C2 School Bus Diesel 30,000 7.7 $ 90,000 20 2012 Thomas C2 School Bus Diesel 30,000 7.7 $ 90,000 21 2014 Thomas C2 School Bus Diesel 30,000 7.7 $ 90,000 22 2018 Thomas C2 School Bus Diesel 30,000 7.7 $ 90,000 23 2018 Thomas C2 School Bus Diesel 30,000 7.7 $ 90,000
24 2019 Thomas SaF-T Liner School Bus Diesel 30,000 7.7 $ 90,000
Table 1: UofSC fleet data provided by the University with AFLEET estimates for fuel economy and purchase price.
South Carolina defaults were used to get the AFLEET fuel production assumptions. For the
petroleum use, GHGs, and air pollutant options, the Well-to-Wheels calculation type was used.
A Well-to-Wheels analysis, or lifetime assessment, captures the upstream and operational
emissions and energy use of the vehicle; it is the most all-encompassing calculation type. Lastly,
it was assumed that any CNG or propane vehicles that the UofSC fleet converted to from a diesel
source would have low NOx engines.
The On-Road Fleet Footprint Calculator was used to estimate the externality costs,
petroleum use, and GHGs of the three UofSC shuttle fleet scenarios (Burnham, 2020, p. 1). This

Eva James 33
analysis required the vehicle type, model year, fuel use, and remaining lifetime for the UofSC
shuttles. Vehicle type and model year were provided by UofSC. Fuel use was estimated by
dividing a vehicle’s annual mileage by its respective AFLEET MPG or MPGDE (miles per
gallon diesel equivalent). While the average UofSC shuttle fleet is only 8.7 years old, the oldest
two vehicles UofSC shuttle system has in use are 19 years old. Based on these numbers, an
appropriate and conservative vehicle lifetime estimate to use for all vehicles was 20 years. After
these inputs were inserted, the On-Road Fleet Footprint Calculator estimated the entire UofSC
fleet’s energy use, emissions, and externality costs (Burnham 2020, p. 28). The Calculator
outputs gave the tons of current year and remaining lifetime well-to-wheels petroleum and GHGs
for the light commercial truck, current school bus, CNG school bus, and propane school bus
fleets. It also provided the current year and remaining lifetime externality cost of these fleets.
This second analysis was key to visualize the annual and remaining financial and resource-based
toll the UofSC shuttle fleet could be exerting.
For both AFLEET analyses, outputs for the current UofSC fleet were compared to two
mixed alternative fleet options. The first option replaced six (6) of the oldest conventional diesel
school buses with new CNG fueled alternatives. The second option replaced six (6) of the oldest
conventional diesel school buses with new propane fueled alternatives. These different scenarios
were plugged into the Simple Payback and On Road spreadsheets and their results were
thoroughly analyzed. Since the light commercial truck data was not altered in the alternative fuel
scenarios, it was only presented once alongside the current fleet data. Data for the school buses
changed, therefore so it was calculated and presented for each scenario: current fleet, partial
CNG, and partial propane.

Eva James 34
To complement the portion of the study scrutinizing the fiscal and pollutive costs and
benefits of changing UofSC shuttle fuel sources, the study looked at two funding sources UofSC
could turn to in order to ease an alternative fuel transition. The study delved into the Diesel
Emissions Reduction Act (DERA) grant application logistics and past award winners and the
ConserFund/ConserFund Plus programs run by the South Carolina Energy Office (SCEO). As
cited numerous times throughout the aforementioned Literature Review, a majority of the experts
in the AFV field have emphasized that a substantial amount of public and/or federal assistance
(or a consistent incentive program) is often necessary to make a switch to a CNG or propane fuel
source economically attractive. It should also be noted that these AFLEET and feasibility
analyses were made under the assumption that there were no loans procured for the existing
UofSC fleet infrastructure or vehicles. This University-specific information was unobtainable. It
was imperative to include relevant information on DERA—the largest federal funding assistance
program the University could take advantage of—when assessing a transition to transportation
fueling options that drastically reduce emissions. DERA funding also has the ability to alleviate
some of the chicken-and-the-egg dilemma mentioned in the Literature Review, as the financial
award can go toward AFV infrastructure projects for UofSC which can then encourage AFV
adoption.
The second approach to converting the UofSC shuttle fleet was reviewing the success of
nine comparable university and college shuttle fleets across the United States that have made the
switch to propane or CNG. With the help of the Argonne National Lab Technical Response
Team, the following institutions were identified and assessed. The University of California San
Diego (UCSD), the University of New Hampshire (UNH), the University of New Mexico
(UNM), the University of Vermont (UV), and Utah State University (USU) were each identified
Eva James 35
to be servicing their campuses using some CNG fueled buses and shuttles. James Madison
University (JMU), University of Alabama at Birmingham (UAB), University of Houston (UH),
and Bowling Green State University (BGSU) each use propane to power some or all of their
campus transit vehicles.
Reviewing these nine peer institutions and their success with AFVs at the collegiate level
was an attempt to fill a gap in the available literature. There is a decent amount of research on
CNG and propane use in elementary bus fleets and city transit operations, but studies covering
the collegiate demographic present a glaring gap. Showcasing the successes and struggles other
universities have faced in pursuing CNG and propane adoption also serves as a potential
template for UofSC to follow; the University can learn from the paths similar institutions took on
their way to AFV adoption. It was important to study the issue in this manner to assuage some of
the apprehensions or fears UofSC may foresee in undertaking the switch of their current shuttle
fleet to an alternative fuel source. This approach also aggregated the list of nationwide CNG and
propane university fleets, an action that was valuable to any future research in similar transit-
oriented fields.
Finally, to assess and reiterate the importance of implementing anti-idling strategies at
UofSC, I conducted another AFLEET analysis using the software’s Idle Reduction Tool.
Scientific findings, like those presented by Ryan et al., put a heavy emphasis on the deleterious
effects idling can have on surrounding air quality, but there are few studies putting idling waste
in fiscal terms (Ryan et al., 2013, p. 586). For this reason, the Idle Reduction tool’s externality
costs, pollutant measurements, and direct idling costs were crucial. These outputs were important
to include when laying out the costs of UofSC’s idling habits before presenting suggestions for

Eva James 36
improvement. It is important to note this study only assess conventional idling—idling
conducted during normal operation of a vehicle (Burnham, 2020, p. 36).
The next section paired the findings with best practices and ideas advocated by leaders in
the field and presented these data-backed anti-idling practices. These best practices mainly
originate from the Department of Energy’s school bus idle reduction strategies. This source, as
well as others, provided advice and anti-idling campaign models that are more tailored to
elementary bus fleets, revealing there is dire need for anti-idling research and initiatives that
target the collegiate sphere. This study contends to fill the information gap regarding results and
recommendations for collegiate fleets. Through a multi-discipline research agenda, this study
will provide optimal recommendations for the UofSC fleet; rooted in both technical and
intelligible advice. The ultimate goal is that these recommendations enable the University to see
the environmental, health-related, and cost-saving merits behind adopting anti-idling techniques.

Eva James 37
Argument
The purpose of this study is to assess the potential feasibility, costs, and benefits of
switching part of the UofSC shuttle fleet to CNG or propane, and to present anti-idling
suggestions as a short term, emission-reduction tactic. This research is done in an effort to
thoroughly assess the economic, public health, and environmental merits of transitioning to a
cleaner, alternative fuel source while promoting anti-idling techniques in the short-term. After
completing the background research and analyses, I claim that UofSC can make an economically
and environmentally viable transition to a CNG or propane fuel source with the help of federal
Diesel Emissions Reduction Act (DERA) or state ConserFund/ConserFund Plus funding to help
cover initial capital and/or infrastructure costs. Along these lines, there are valuable takeaways
from nine other universities across the nation that UofSC can learn from and mimic in their
transition to a CNG or propane alternative fuel source. I also maintain that there are multiple
anti-idling techniques the University can implement in the short-term to abate current diesel and
gasoline emissions. The following key findings and their corresponding evidence underpin these
three findings.
1. Key Finding and Supporting Evidence #1
Finding: Converting six (6) of the existing UofSC shuttle fleet school buses to a CNG or
propane fuel source is an economically and environmentally feasible option with the initial help
of federal grant funding to cover a portion of alternative fuel capital costs.
Evidence: After inputting the UofSC shuttle fleet data and running two AFLEET
analyses—Simple Payback and On-Road Fleet Footprint—the outputs for each tool yield
encouraging evidence to support a partial fleet switch to an alternative fuel source. Table 1 lists

Eva James 38
the data for the current composition of the UofSC shuttle fleet, data which was used to assemble
the following evidence. Four scenarios and data divisions were studied to assess the costs and
benefits of UofSC partial AFV adoption. They were organized as follows:
• LCT* - the Light Commercial Truck portion of the current fleet, Rows 1-11 in Table 1.
School Bus (CF) - the school bus portion of the current UofSC fleet, Rows 12-24 in
Table 1.
• School Bus (CNG) - the school bus portion of a hypothetical UofSC fleet with six (6) CNG
buses and seven conventional buses.
• School Bus (P) - the school bus portion of a hypothetical UofSC fleet with six (6) propane
buses and seven (7) conventional buses.
*Note: Data for the LCT portion of the fleet did not change when swapping out potential
alternative fuel school buses so this data is presented separately and only once per scenario.
Tables 2-4 feature portions of the AFLEET Simple Payback Calculator, highlighting the Key
Vehicle and Fuel Inputs for each scenario. As described in the Methodology section, fuel
economy and purchase price inputs are AFLEET defaults for the selected vehicle and vocation
types; for example, the estimated fuel economy and purchase price for a propane school bus in
Table 4 is 6.4 MPDGE and $98,000, respectively.

Eva James 39
Table 2: Portion of the AFLEET Simple Payback Calculator inputs for the current UofSC school bus fleet.
Table 3: Portion of the AFLEET Simple Payback Calculator inputs for the partial CNG school bus fleet scenario.
Table 4: Portion of the AFLEET Simple Payback Calculator inputs for the partial propane school bus fleet scenario.

Eva James 40
From these inputs, the Simple Payback analysis first gives a detailed breakdown of the
annual externality costs of each scenario (Figure 1 and Table 5). The annual detailed externality
costs, pictured in Figure 1 and Table 5, show that the current UofSC school bus fleet has higher
total externality costs as well as higher petroleum, NOx, and SOx externality costs than the CNG
and propane scenarios. Also, GHG costs for the current fleet are only slightly below the propane
alternative and above CNG. These externality cost results prove that shifting from the use of
conventional vehicles to AFVs can positively impact energy security and the environment.
Figure 1: Graph of the annual detailed externality costs of each fleet composition scenario.
LCT School Bus (CF)
School Bus (CNG)
School Bus (P)
Petroleum Use $ 8,725 $ 21,148 $ 11,439 $ 15,159 GHGs $11,953 $ 28,207 $ 27,498 $ 28,721 NOx $ 390 $ 2,576 $ 1,981 $ 1,650 PM10 $ 58 $ 217 $ 217 $ 217 PM2.5 $ 263 $ 798 $ 798 $ 810
$-
$5,000
$10,000
$15,000
$20,000
$25,000
$30,000
$35,000
PetroleumUse
GHGs NOx PM10 PM2.5 VOC SOx
LCT School Bus (CF) School Bus (CNG) School Bus (P)

Eva James 41
VOC $ 404 $ 273 $ 230 $ 480 SOx $ 90 $ 247 $ 199 $ 133 Total: $21,883 $ 53,466 $ 42,362 $ 47,170
Table 5: Breakdown of the annual detailed externality costs of each fleet composition scenario.
The externality costs presented are the monetized indirect damages incurred from factors
including petroleum use, GHGs, and air pollution. As externality costs are not explicitly captured
in the marketplace, society will consume and emit more than if the price had included the full
social cost; therefore, these costs are crucial to include while trying to gauge the costs and
benefits of making a partial switch to an alternative fuel (Burnham, 2020, p. 15). For example,
the externality cost of GHG emissions take into account changes in net agricultural productivity,
human health, property damages from increased flood risk, and the value of ecosystem services,
each of which respond to GHG induced climate change (Burnham, 2020, p. 15). Externality costs
are often overlooked when weighing the economic and environmental impacts of current fleet
activities.
Next, the Simple Payback Calculator was used to organize the aforementioned externality
costs for the partial CNG and propane adoption scenarios alongside energy use and emissions;
acquisition and annual operating costs; incremental acquisition costs; annual operating savings;
and estimated payback time. The Annual Simple Payback Calculator outputs shown in Tables 6
- 11 breakdown various costs associated with the partial CNG and propane school bus scenarios.
It should be noted that for the CNG scenarios, incremental maintenance costs for natural gas
vehicles, such as CNG tank inspection and increased oil change intervals for heavy-duty natural
gas vehicles are included (Burnham, 2020, p. 13). These output figures are valuable for the
feasibility assessment as they separate the costs, energy use, and emissions of the six new
alternative fuel powered buses from the existing seven diesel school buses—the outputs for the

Eva James 42
seven diesel buses in the left column, the outputs for the six alternative fuel buses in the middle
column, and the totals in the far right.
One flaw with the Calculator outputs is that they treat the seven diesel buses UofSC
already has in use as new purchases, tacking on new vehicle and infrastructure costs that would
not be included in an accurate, real-world scenario. This inaccuracy inflates the reported
acquisition costs and shortens the simple payback time, an issue that will be addressed later. The
discrepancy does not affect the annual operating costs and savings or the simple payback with
externality costs which are of primary concern with this claim.
Table 6: Annual Simple Payback Calculator Output Externality Costs for partial CNG scenario.
Eva James 43
Table 7: Annual Simple Payback Calculator Output Externality Costs for partial propane scenario.
The partial CNG and propane school bus fleet scenarios in Table 6 and 7 each show
simple payback times shorter than one year when factoring in petroleum use, GHG, and air
pollutant externality costs. To rephrase these findings, it will take 0.9 and 0.4 years, respectively,
for a half CNG or propane UofSC heavy-duty school bus fleet to return the investments as
opposed to a comparable, all-diesel fleet. This quick turnaround in both scenarios favors the
implementation of either alternative-fuel scenario over continuing with the 100% diesel status
quo. More encouraging statistics from the Simple Payback analysis include CNG and propane
AFVs have lower petroleum use and operating costs compared to the diesel half of e. CNG and
propane partial fleets have hefty annual operating savings as well—$79,592 for CNG and
$94,017 for propane compared to an all diesel fleet (Table 6 and 7).

Eva James 44
Table 8: Annual Simple Payback Calculator Output Costs for partial CNG scenario.
Table 9: Annual Simple Payback Calculator Output Costs for partial propane scenario.
The output tables do point out that the alternative fuel vehicle options have higher
acquisition costs compared to conventional diesel school buses (Table 8 and 9). Acquisition
costs cover vehicle purchases and infrastructure installation. UofSC has their own diesel and
gasoline refueling tanks (the shuttles do not refuel at public stations), so infrastructure costs are
included in payback calculations. Large acquisition costs are one of the largest deterrents to AFV
transitions, as seen with the chicken-and-the-egg dilemma and cries for federal funding
assistance presented by numerous scholars in the Literature Review. Luckily, there are funding
opportunities the University can apply for: DERA and ConserFund/ConserFund Plus.
The Environmental Protection Agency (EPA) runs DERA, a program that funds grants
and rebates that “protect human health and improve air quality by reducing harmful emissions

Eva James 45
from diesel engines” (US EPA, 2017). UofSC has thirteen (13) eligible diesel school buses for
which DERA National Grant funds could be used to retrofit or replace. This program can pave
the path for UofSC’s partial alternative fuel school bus transition. A convincing and successful
application could procure enough funding to cover the fleet and infrastructure acquisition costs
needed for partial CNG or propane adoption. One issue with DERA is that under current
eligibility rules, UofSC cannot apply for their School Bus Rebate program. If the current
University shuttle fleet transported pre-primary, primary, or secondary students, UofSC could
apply to this valuable program to replace some conventional buses with AFVs—college students
do not qualify for reduced diesel emission exposure, apparently. There have been very few
DERA applications by colleges or universities in years past. Again, this study hopes to highlight
the gap in research and attention paid to collegiate shuttle services and their pursuit of alternative
fuel solutions.
ConserFund is a revolving loan program administered and managed by the South
Carolina Energy Office, a state agency within the Office of Regulatory Staff that receives federal
funding. The program is intended to support the implementation of energy-efficiency
improvements that provide long-term cost reductions and energy (fuel) savings (SCEO, 2020).
Public colleges and universities are eligible to apply for this funding; therefore, assisting a
UofSC fleet conversion would fall within appropriate application parameters. UofSC could
finance projects from $25,000-$500,000 per state fiscal year, and the loan can cover up to 100%
of eligible project costs. The annual interest rate for the program is a fixed rate set below the
Wall Street Journal prime rate (as of May 2020, the rate is 1.5%). ConserFund Plus is a similar
program to which UofSC could apply. The difference between the two ConserFund programs is
that ConserFund Plus borrowers can receive 30% of the loan amount as a grant (SCEO, 2020).

Eva James 46
Table 10: Annual Simple Payback Calculator Output Energy Use and Emissions for partial CNG scenario.
Table 11: Annual Simple Payback Calculator Output Energy Use and Emissions for partial propane scenario.
A final Simple Payback output statistic an opponent of AFV adoption may pick out is the
substantially larger amount of CO emissions the CNG and propane portions of the hypothetical
fleets produce (Table 10 and 11). Not to downplay the effects of a harmful GHG, but the entire
country meets ambient CO air quality standards, largely because of emissions standards written
into the Clean Air Act (US EPA, 2015). CO emissions are not as large a threat to public health as
the other air pollutants listed as is evident in the $0 externality costs they accrue in all scenarios
(Table 6 and 7).

Eva James 47
Figure 2: Graph of the current year externality costs for each fleet scenario.
Figure 3: Graph of remaining lifetime externality costs for each fleet scenario.
Current Year Externality Costs
LCT School Bus (CF) School Bus (CNG) School Bus (P)
GHGs $ 12,093 $ 28,207 $ 25,927 $ 24,091
Petroleum Use
$ 8,830 $ 21,148 $ 11,433 $ 13,869
Table 12: Current year externality costs for each fleet scenario.
$-
$10,000
$20,000
$30,000
$40,000
$50,000
$60,000
LCT School Bus(CF)
School Bus(CNG)
School Bus (P)
GHGs Petroleum Use
$-
$100,000
$200,000
$300,000
$400,000
$500,000
$600,000
$700,000
LCT School Bus(CF)
School Bus(CNG)
School Bus (P)
GHGs Petroleum Use

Eva James 48
Remaining Lifetime Externality Costs
LCT School Bus (CF) School Bus (CNG) School Bus (P)
GHGs $ 150,874 $ 292,920 $ 442,597 $ 405,870
Petroleum Use
$ 109,970 $ 219,612 $ 171,717 $ 220,436
Table 13: Remaining lifetime externality costs for each fleet scenario.
The second AFLEET analysis, On Road Fleet Footprint, used similar inputs to the Simple
Payback tool, but it also accounts for vehicle type, model year, fuel use, and the vehicle’s
remaining lifetime. The Footprint output compares the current year and remaining lifetime
externality costs of the UofSC fleet scenarios (Figure 2 and Figure 3, Table 12 and 13).
Figure 4: Graph of the current year well-to-well petroleum use and GHGs (tons).
Figure 5: Graph of the remaining lifetime well-to-wheels petroleum use and GHGs (tons) for each fleet scenario.
-
500
1,000
1,500
2,000
2,500
LCT School Bus(CF)
School Bus(CNG)
School Bus(P)
GHGs Petroleum Use
-
5,000
10,000
15,000
20,000
25,000
LCT School Bus(CF)
School Bus(CNG)
School Bus(P)
GHGs Petroleum Use

Eva James 49
Current Year Well-to-Wheels Petroleum Use and GHGs (tons)
LCT School Bus (CF) School Bus (CNG) School Bus (P) GHGs 300 701 644 598
Petroleum Use 528 1,264 683 829 Table 14: Current year well-to-wheels petroleum use and GHGs (tons) for each fleet scenario.
Remaining Lifetime Well-to-Wheels Petroleum Use and GHGs (tons)
LCT School Bus (CF) School Bus (CNG) School Bus (P)
GHGs 3,747 7,274 10,991 10,079 Petroleum Use 6571 13,122 10,260 13,171 Table 15: Remaining lifetime well-to-wheels petroleum use and GHGs (tons) for each fleet scenario.
It also breaks down the current year and remaining lifetime well-to-wheels petroleum use
and GHGs (Figure 4 and Figure 5, Table 14 and 15). Each of these outputs is helpful to
visualize the economic, public health and environmental savings that can come from switching to
a partial CNG or propane fleet.
Current year and remaining lifetime externality costs for petroleum use and GHGs are
much lower for the CNG or propane scenario compared to the current UofSC school bus fleet
(Table 14 and Figure 15). These outputs show the short-term and long-term positive impact that
an AFV can have for UofSC. Figure 4 visualizes similar positive implications of a CNG or
propane scenario—lower quantities of petroleum and GHG used. The remaining lifetime well-to-
wheels petroleum use and GHGs for CNG and propane scenarios are higher than the current
UofSC fleet in Figure 5, but it should be noted that these results may be skewed by model year
inputs. The current UofSC fleet has an average vehicle age of 8.7 years while the CNG and
propane fleet scenarios each introduce six 2020 model year, brand new buses that will have 15-
20 years left in commission. This can explain the higher remaining lifetime petroleum use and
GHGs for the AFV scenarios, as the data sets do not have equal remaining lifetimes in each fleet
scenario.
Eva James 50
2. Key Finding and Supporting Evidence #2
Finding: UofSC is not without guidance if it chooses to make a partial transition to an
alternative fuel source—the University can look to comparable collegiate institutions from across
the nation and learn from their transitions to CNG or propane fleets for guidance.
Evidence: If UofSC chooses to begin transitioning to a partial CNG or propane school
bus fleet, there are ample success stories to learn from. Purchasing CNG or propane vehicles is
not uncharted territory; many comparably sized universities across the country have completed
CNG and propane shuttle transitions over decade ago and as recently as fall 2019. This study
reviewed nine American universities who have added CNG or propane fueled shuttles and buses
to their transportation repertoire. Below, I have compiled these universities’ achievements,
challenges, recommendations, and funding creativity as a blueprint for UofSC to look to if
transition doubts or questions arise. Other ideas for funding vehicle and infrastructure purchases
are also valuable inclusions in the following compilation.
CNG Fleets
• University of California San Diego – The Fleet Services department at UCSD is renowned
in the field of sustainable transportation. UCSD was the first university in the country to
run its fleet on renewable natural gas (RNG), a substantial step up environmentally from
UofSC’s proposed CNG fuel source (UC San Diego, n.d.). UCSD’s transition to eighteen
(18) alternatively fueled buses was a gradual process guided by the school’s budgetary and
operational limitations; As old buses in the fleet were retired, they were replaced with more
efficient ones powered by CNG; a similar path can be foreseen for UofSC. UCSD has since
moved to natural gas sourced from renewable sources, such as landfills. One of the most
valuable lessons UofSC can take from UCSD’s movement was their solution to a fueling

Eva James 51
obstacle. Fueling at CNG stations far from campus proved to be too time consuming and
labor intensive, so fleet services contracted with a third party to build a CNG fueling
station on campus (UC San Diego, n.d.). UofSC could sidestep this hurdle and factor in
fueling infrastructure costs at the outset, as has been done in the preceding AFLEET
analyses.
• University of New Hampshire – One of the earliest pioneers in collegiate CNG bus use, all
of UNH’s transit purchases since 2008 have been biodiesel or CNG fueled. In 2014 UNH
expanded their existing CNG fueling facility and procured more CNG fleet vehicles, and
the university set plans in motion to reach 80 percent of all transit miles to be powered by
CNG within the next few years (University of New Hampshire, n.d.). This type of goal, in
terms of percent transit miles powered by sustainable fuels, may be more attainable,
attractive, and boast-worthy for UofSC versus going for the number vehicles powered by
CNG or propane.
• University of New Mexico – In late 2019, UNM Parking and Transportation Services
received two new Thomas HDX CNG shuttle buses that will replace two of its current
diesel-fueled models (PATS Admin, 2019). Replacing retiring buses is a common theme
for incorporating CNG or propane buses into university fleets that UofSC can employ. It
should be noted that UNM’s PATS is 100 percent self-funded and must plan large capital
expenditures, such as CNG buses, well into the future (PATS Admin, 2019). UofSC will
likely face the same type of procurement restraints and should look to budgeting as well as
external funding sources (see aforementioned funding assistance section for more
information).

Eva James 52
• University of Vermont – Another proponent of collegiate CNG fleets, UV’s alternative fuel
history dates back to 2007 with the procurement of two CNG buses and then four more the
following Fall. The cleaner buses were a result of a partnership between the University, the
City of Burlington Vermont Gas Systems, and a Federal Transit Administration grant
spearheaded by Senator Patrick Leahy (Wakefield, 2007). UofSC can pursue similar,
Columbia specific partnerships in pursuing CNG or propane bus acquisitions, especially in
regard to help from the City of Columbia. For example, a partnership with the Central
Midlands Regional Transit Authority (The COMET), could mitigate some of UofSC’s
acquisition costs. The COMET uses propane to fuel several buses that run routes around
Columbia. The organization has the capability to implement CNG fueled vehicles into their
fleet as they own an old CNG fueling station. The City of Burlington’s role in the process
was allowing University buses to refuel at a city-owned public works station. If a similar
set-up occurred in Columbia with UofSC, the use of a city-owned station near campus
could be a good transition step before acquiring a university-owned station. Lastly, UV
touts how the new CNG buses benefit both the environment and local economy, bragging
about reduced dependence on imported oil and the use of a local plant to build the buses
(Wakefield, 2007).
• Utah State University – USU uses a 2010 Thomas SaF-T Liner CNG fueled bus as a
“cleaner and more environmentally friendly way to transport students, faculty, staff, and
visitors” (Utah State University, 2009). As with a lot of other universities, the bus has
become a bragging point for the school’s sustainability initiatives, a tactic UofSC could
adopt alongside a CNG bus.
Propane Fleets

Eva James 53
• University of Alabama Birmingham – One of UAB’s campus sustainability initiatives
for 2019 was introducing propane-fueled buses as a part of their transportation system
overhaul. Last year, Groome Transportation took over the University’s transportation
operations, and André Davis, the director of UAB transportation, saw the transition as
an opportunity to welcome AFVs into the fleet. The propane buses are a visual
representation of the institution’s commitment to energy efficiency, sustainability, and
cutting carbon emissions (Herfurth, 2019). If UofSC’s transportation services
underwent a similar, large-scale transition to a different service provider, it could be the
perfect opportunity to take a similar path to introducing propane buses into the current
fleet.
• University of Houston – In 2018, UH replaced a large portion of their Cougar Line
shuttles with “new and improved” propane fueled buses (University of Houston, 2018).
Out of the propane examples presented, these bus replacements are some of the most
similar to those envisioned in the UofSC partial propane scenario. Publicizing these
BBCV-3507 propane powered buses is a perfect way to show that parking and
transportation services are actively working to reduce the campus’s carbon footprint, a
practice UofSC could mimic and benefit from.
• Bowling Green State University – Like the propane scenario proposed in this study for
UofSC, BGSU purchased six new propane powered shuttles in 2016 (Bowling Green
State University, n.d.). The conversions were covered by the campus’s Student Green
Initiative Fund. UofSC has a similar pot of money called the Student Sustainability
Fund that UofSC could try to pull from to help fund a propane bus transition.

Eva James 54
• James Madison University – With the help of Virginia Clean Cities and the American
Recovery and Reinvestment Act (ARRA), propane now fuels 12 JMU vehicles with
five more lined up to be converted once the school receives their EPA certifications.
JMU has stuck to light and medium duty AFVs, not converting any school buses or
shuttles yet, but they have recommendations for purchasing their propane fuel. UofSC
currently refuels using University managed and owned tanks, and JMU practices a
similar, cost-saving strategy. JMU buys bulk-priced propane which is cheaper than
paying at a private station. Sabrene Graves, the director of JMU grants administration,
says the newly converted AFVs need fewer oil changes and tune ups. Overall, the
vehicles running on propane save money and keep the money that is spent inside the
US (90 percent of propane comes from domestic sources) (Overstreet, 2013).
3. Key Finding and Supporting Evidence #3
Finding: UofSC’s current idling practices are expensive and harmful to the environment.
There are numerous anti-idling techniques UofSC can promote in the short-term to decrease their
current diesel and gasoline idling emissions that will save the school money and lessen their
negative environmental impact.
Evidence: ANL’s AFLEET Idle Reduction Calculator outputs monetize and breakdown
the current cost UofSC is incurring from its fleet’s idling practices.
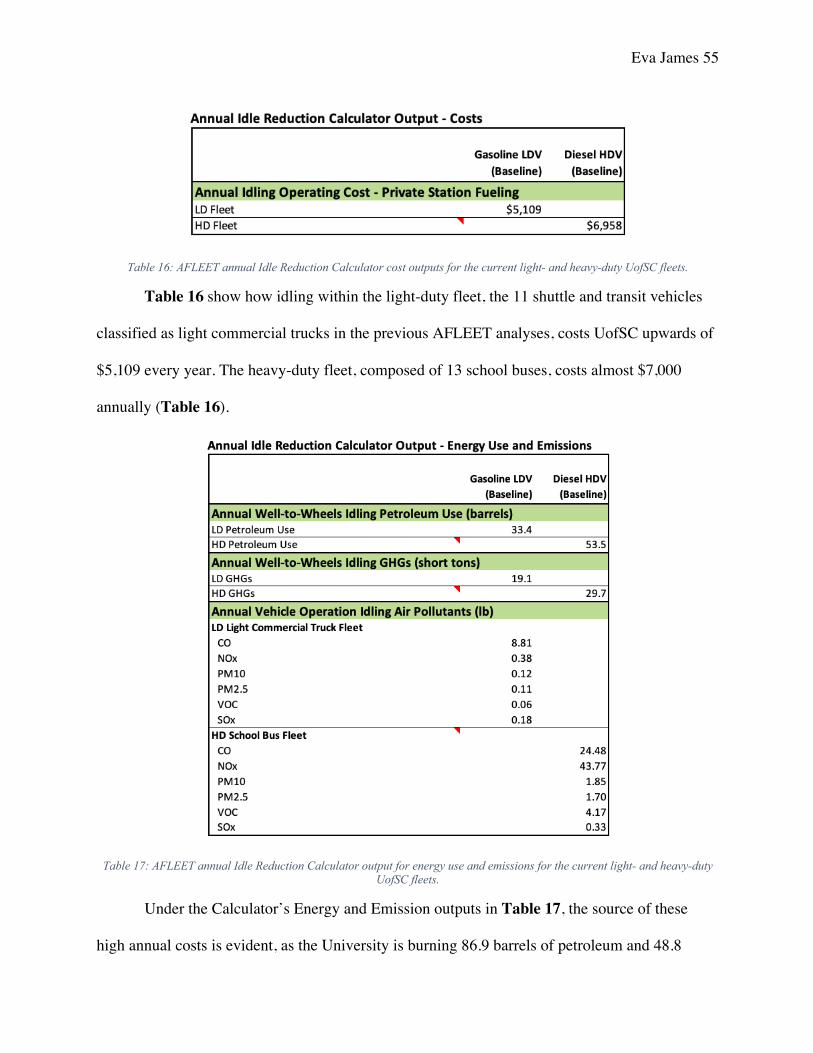
Eva James 55
Table 16: AFLEET annual Idle Reduction Calculator cost outputs for the current light- and heavy-duty UofSC fleets.
Table 16 show how idling within the light-duty fleet, the 11 shuttle and transit vehicles
classified as light commercial trucks in the previous AFLEET analyses, costs UofSC upwards of
$5,109 every year. The heavy-duty fleet, composed of 13 school buses, costs almost $7,000
annually (Table 16).
Table 17: AFLEET annual Idle Reduction Calculator output for energy use and emissions for the current light- and heavy-duty UofSC fleets.
Under the Calculator’s Energy and Emission outputs in Table 17, the source of these
high annual costs is evident, as the University is burning 86.9 barrels of petroleum and 48.8

Eva James 56
GHGs. These numbers are put into dollar terms in Table 18 below as externality costs, further
raising the tangible cost of UofSC fleet idling before even considering the air pollutant impacts.
Table 18:AFLEET annual Idle Reduction Calculator outputs for externality costs of the current light- and heavy-duty UofSC fleet idling habits.
Adding up the total externality and operation costs of the light-duty and heavy-duty
results in a $15,758 direct and indirect annual bill for UofSC that can be credited to idling
activities (Table 16 and 18).
Visualizing the cost of idling with the Idle Reduction Calculator is important before
trying to try to recommend any behavioral or technological changes to mitigate this costly and
environmentally harmful activity. Idling wastes fuel, increases engine wear, and causes
unnecessary noise and pollution on campus (US Department of Energy, n.d.). The main reason

Eva James 57
for UofSC fleet idling can stem from variety of activities, from keeping vehicles cool to waiting
for passengers at stops. Each of these activities could be altered through various training
opportunities. The most popular recommendations to curb school bus idling practices involve
educating drivers, passengers, and heads of transportation services on the cost of burning extra
fuel and the wear and tear on engines. It is key to point out fiscal and engine-wear consequences
of idling practices to heads of transportation services. School bus idling is especially harmful as
it can be harmful for drivers and nearby students, as witnessed in the loading area at the end of
the Horseshoe on most weekdays during the UofSC semester (Ryan et al., 2013, p. 585). The
more well-known deleterious environmental and public health effects of idling are important to
convey to riders and drivers. Inhaling diesel exhaust fumes can cause lung damage, respiratory
problems, premature death, and lung cancer, especially in vulnerable populations who are
exposed; whether directly or indirectly.
The Department of Energy advocates for the aforementioned school bus specific anti-
idling recommendations that have been developed alongside the Clean Bus School Program (US
Department of Energy, n.d.). The campaign has been developed to take a community approach to
reducing diesel emissions from older school buses. The current UofSC fleet has six buses that are
older than 10 years, a common threshold used to define “older” school buses. DERA funding, a
federal grant program previously detailed under Key Finding and Supporting Evidence #1, is
also available to fund EPA verified idle-reduction technologies (IRTs) UofSC may want to
install in their fleet vehicles (US EPA, 2017). Verified technologies include fuel operated heaters
(FOHs), also called direct fired heaters, for school buses. These small, onboard heaters could be
useful for UofSC in the colder winter months when buses idle to keep drivers warm.

Eva James 58
Conclusion
This study assessing the reality of transitioning part of the current UofSC fleet to CNG or
propane yielded useful and significant results that point to adoption being feasible. The two
AFLEET analyses on externality cost paybacks and fleet footprints generated outputs that favor
acquiring six (6) CNG or propane school buses to replace aging diesel counterparts in the current
fleet. An analysis of the externality costs, lifetime petroleum, air pollution consequences,
operation costs, and more show that the replacement of older diesel-fueled school buses with
new CNG or propane buses would benefit UofSC public health and sustainability initiatives.
Furthermore, doubts about the upfront financial burden of an alternative fuel decision can be
eased by applying to federal and state grant funding sources, such as DERA or
ConserFund/ConserFund Plus, to cover part of the infrastructure or vehicle acquisition costs.
This study’s findings confirm what the available literature in the field has said regarding
the need for federal assistance or incentives to make CNG and propane fueled buses more
affordable. These conclusions also help to verify scholar’s acknowledgement of the chicken-and-
the-egg dilemma: how drivers and fleet managers will not find AFVs attractive without ready
access to fuel, parts, and repair services, but energy producers, automakers, and governments
will not invest in AFV technology and infrastructure without the prospect of a large market
(Struben & Sterman, 2008, p. 1072). To state the issue in terms of this research and the scenarios
presented, UofSC may not see alternative fuel buses as attractive options as there is not existing
fueling infrastructure—a hefty capital investment to take on individually. On the other hand,
parties who would be privy to putting in CNG or propane fueling stations, or helping UofSC do
so, have not felt a demand from the University.
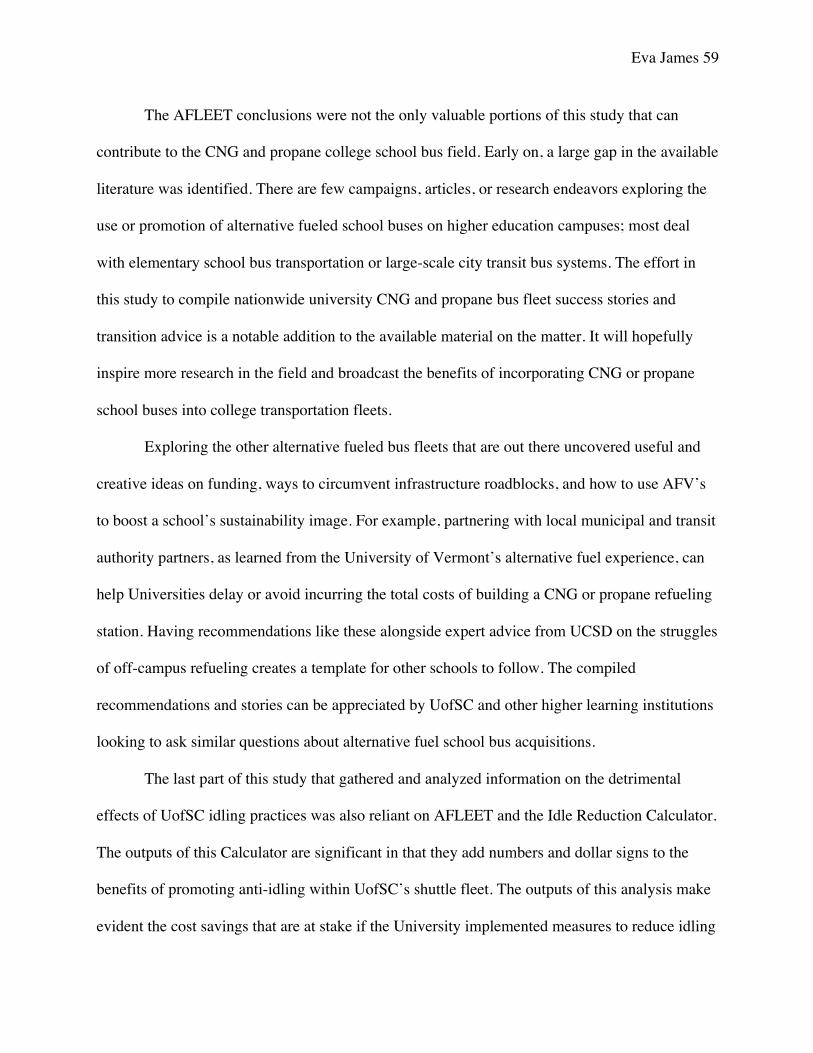
Eva James 59
The AFLEET conclusions were not the only valuable portions of this study that can
contribute to the CNG and propane college school bus field. Early on, a large gap in the available
literature was identified. There are few campaigns, articles, or research endeavors exploring the
use or promotion of alternative fueled school buses on higher education campuses; most deal
with elementary school bus transportation or large-scale city transit bus systems. The effort in
this study to compile nationwide university CNG and propane bus fleet success stories and
transition advice is a notable addition to the available material on the matter. It will hopefully
inspire more research in the field and broadcast the benefits of incorporating CNG or propane
school buses into college transportation fleets.
Exploring the other alternative fueled bus fleets that are out there uncovered useful and
creative ideas on funding, ways to circumvent infrastructure roadblocks, and how to use AFV’s
to boost a school’s sustainability image. For example, partnering with local municipal and transit
authority partners, as learned from the University of Vermont’s alternative fuel experience, can
help Universities delay or avoid incurring the total costs of building a CNG or propane refueling
station. Having recommendations like these alongside expert advice from UCSD on the struggles
of off-campus refueling creates a template for other schools to follow. The compiled
recommendations and stories can be appreciated by UofSC and other higher learning institutions
looking to ask similar questions about alternative fuel school bus acquisitions.
The last part of this study that gathered and analyzed information on the detrimental
effects of UofSC idling practices was also reliant on AFLEET and the Idle Reduction Calculator.
The outputs of this Calculator are significant in that they add numbers and dollar signs to the
benefits of promoting anti-idling within UofSC’s shuttle fleet. The outputs of this analysis make
evident the cost savings that are at stake if the University implemented measures to reduce idling

Eva James 60
habits within its shuttle fleet. This study again attempts to fill a gap in the amount of research
and awareness that exists regarding college-level school bus idling, the detrimental effects it can
have on older student populations, and the costs/wear and tear that is still incurred even though
UofSC does not run an elementary school level bus fleet. There is room for future research in
regards to anti-idling initiatives and measuring emissions effects in general. The University does
not currently monitor air quality near shuttle drop-offs or across campus. If monitoring began
pre-alternative fuel transition or before adopting anti-idling techniques, the University could
track improvements or changes in the air quality as a result of each new adoption.
Finally, the significance of this study lies in the fact that it can be presented to the UofSC
Department of Transportation as a convincing argument for considering the acquisition of new
CNG or propane buses to replace diesel vehicles that get retired, and to consider implementing
more stringent anti-idling protocols. This study acknowledges that there are political and societal
pressures at play surrounding any decision that is made at a University of this size. These
pressures are hard to quantify but beneficial to acknowledge, and this study aims to educate and
dissuade misconceptions that may plague AFV discussions on either side. Both the alternative
fuel transition and the anti-idling suggestions are opportunities for the University to promote and
practice sustainability, to protect public health, and to save the money in the short and long term.
There is room for more AFLEET and real-world analyses to be conducted, as well as more
scholarly research to be completed on university alternative fuel fleets in general. A more
intensive study could be completed if more specific data could be acquired from UofSC in the
future.

Eva James 61
References
Adams, R., & Horne, D. B. (2010). Compressed Natural Gas (CNG) Transit Bus Experience Survey (Subcontract Report No. 7A2-48814). National Renewable Energy Laboratory. https://www.nrel.gov/docs/fy10osti/48814.pdf
Austin, W., Heutel, G., & Kreisman, D. (2019). School bus emissions, student health and
academic performance. Economics of Education Review, 70, 109–126. https://doi.org/10.1016/j.econedurev.2019.03.002
Bowling Green State University. (n.d.). Transportation Campus Initiatives.
https://www.bgsu.edu/campus-sustainability/transportation.html Burnham, A. (2020). User Guide for AFLEET Tool 2019. Department of Energy. Dyr, T., Misiurski, P., & Ziółkowska, K. (2019). Costs and benefits of using buses fueled by
natural gas in public transport. Journal of Cleaner Production, 225, 1134–1146. https://doi.org/10.1016/j.jclepro.2019.03.317
EIA - Use of Energy Explained. (n.d.). [Government]. US Energy Information Administration.
Retrieved April 16, 2020, from https://www.eia.gov/energyexplained/use-of-energy/transportation.php
Hackney, J., & de Neufville, R. (2001). Life cycle model of alternative fuel vehicles: Emissions,
energy, and cost trade-offs. Transportation Research Part A: Policy and Practice, 35(3), 243–266. https://doi.org/10.1016/S0965-8564(99)00057-9
Herfurth, H. (2019, April). UAB to launch new bus fleet with Groome Transportation—News. UAB News. https://www.uab.edu/news/campus/item/10396-uab-to-launch-new-bus-fleet-with-groome-transportation
Kazimi, C. (1997). Evaluating the environmental impact of alternative-fuel vehicles. Journal of
Environmental Economics and Management, 33(2), 163–185. https://doi.org/10.1006/jeem.1997.0984
Laughlin, M. (2004). Economic Analysis of Alternative Fuel School Buses (Final No. 102004–
1870). US Department of Energy. Melaina, M., & Bremson, J. (2008). Refueling availability for alternative fuel vehicle markets:
Sufficient urban station coverage. Energy Policy, 36(8), 3233–3241. https://doi.org/10.1016/j.enpol.2008.04.025
Olawepo, J. O., & Chen, L.-W. A. (2019). Health benefits from upgrading public buses for
cleaner air: A case study of Clark county, Nevada and the United States. International Journal of Environmental Research and Public Health, 16(5). https://doi.org/10.3390/ijerph16050720

Eva James 62
Overstreet, M. (2013, October). JMU vehicles converted to run on alternative fuel source. The
Breeze. https://www.breezejmu.org/news/jmu-vehicles-converted-to-run-on-alternative-fuel-source/article_5e6cdd6c-41ce-11e3-80b5-001a4bcf6878.html
Pace, T., Ramalingam, S., & Roedl, D. (2007). Celerometer and Idling Reminder: Persuasive
Technology for School Bus Eco-driving. CHI ’07 Extended Abstracts on Human Factors in Computing Systems, 2085–2090. https://doi.org/10.1145/1240866.1240954
PATS Admin. (2019, February). Parking & transportation services buys two new shuttles:
Parking & transportation services | the University of New Mexico. Parking and Transportation Services. http://pats.unm.edu/news/2018/02/parking--transportation-services-buys-two-new-shuttles.html
Ryan, P. H., Reponen, T., Simmons, M., Yermakov, M., Sharkey, K., Garland-Porter, D.,
Eghbalnia, C., & Grinshpun, S. A. (2013). The impact of an anti-idling campaign on outdoor air quality at four urban schools. Environmental Science: Processes & Impacts, 15(11), 2030. https://doi.org/10.1039/c3em00377a
Ryskamp, R. (2019). In-Use Emissions and Performance Testing of Propane-Fueled Engines
[PERC Docket 20893]. West Virginia University. Schlosser, N. (2019, November). Fleet Mix Includes More Alt-Fuel Buses as Diesel Holds
Safety. School Bus Fleet, 65(10), 24–26. SCDHEC. (n.d.). Air pollution overview. Retrieved April 16, 2020, from https://
www.scdhec.gov/air-pollution-overview South Carolina Energy Office. (2020). ConserFund; South Carolina Energy Office. http://energy.sc.gov/ Struben, J., & Sterman, J. D. (2008). Transition challenges for alternative fuel vehicle and
transportation systems. Environment and Planning B: Planning and Design, 35(6), 1070–1097. https://doi.org/10.1068/b33022t
Thompson, S. (2019, March). Embracing Best Practices for Propane. School Bus Fleet, 65(3),
32–36. Tong, F., Jaramillo, P., & Azevedo, I. M. L. (2015). Comparison of life cycle greenhouse gases
from natural gas pathways for medium and heavy-duty vehicles. Environmental Science & Technology, 49(12), 7123–7133. https://doi.org/10.1021/es5052759
UC San Diego: Pioneering greener standards with renewable campus transportation. (n.d.).
Clean Energy Fuels; Clean Energy Fuels. https://www.cleanenergyfuels.com/customer-success-stories/uc-san-diego

Eva James 63
University of Houston. (2018, November). New cougar line shuttles. https://www.uh.edu/af- university-services/parking/blog/2018/nov2018/11012018
University of New Hampshire. (n.d.). Transportation demand management at UNH.
Sustainability Institute. https://sustainableunh.unh.edu/tdm Utah State University. (2009, November 30). USU adds another environmentally friendly bus to
fleet. Utah State Today. https://www.usu.edu/today/story/usu-adds-another-environmentally-friendly-bus-to-fleet
US Department of Energy. (n.d.). Alternative Fuels Data Center [Government]. Retrieved April
16, 2020, from https://afdc.energy.gov/ US EPA. (2015, May 27). Air pollution: Current and future challenges [Overviews and
Factsheets]. US EPA. https://www.epa.gov/clean-air-act-overview/air-pollution-current-and-future-challenges
US EPA. (2017, March 13). National DERA awarded grants [Overviews and Factsheets]. US EPA. https://www.epa.gov/dera/national-dera-awarded-grants
Wakefield, J. (2007, February). UVM launches first compressed natural gas buses in Vermont.
https://www.uvm.edu/newsstories/news/uvm-launches-first-compressed-natural-gas- buses-vermont
Werpy, M. R., Burnham, A., & Bertram, K. (2010). Propane Vehicles: Status, Challenges, and
Opportunities (Discussion Paper ANL/ESD/10-2). Argonne National Laboratory. Yeh, S. (2007). An empirical analysis on the adoption of alternative fuel vehicles: The case of
natural gas vehicles. Energy Policy, 35(11), 5865–5875. https://doi.org/10.1016/j.enpol.2007.06.012