Embed Size (px)
Citation preview
1755
Conservation Biology, Pages 1755–1765Volume 14, No. 6, December 2000
Assessing the Geographic Representativeness of Genebank Collections: the Case of Bolivian Wild Potatoes
R. J. HIJMANS,* K. A. GARRETT, Z. HUAMÁN, D. P. ZHANG, M. SCHREUDER, AND M. BONIERBALE
International Potato Center, Apartado 1558, Lima 12, Peru
Abstract:
Genebank collection databases can be used for ecogeographical studies under the assumption thatthe accessions are a geographically unbiased sample. We evaluated the representativeness of a collection ofwild potatoes from Bolivia and defined and assessed four types of bias: species, species-area, hotspot, and in-frastructure. Species bias is the sampling of some species more often than others. Species-area bias is a sam-pling that is disproportionate to the total area in which a species is found. Hotspot bias is the disproportionatesampling of areas with high levels of diversity. Infrastructure bias is the disproportionate sampling of areasnear roads and towns. Each of these biases is present in the Bolivian wild potato collection. The infrastruc-ture bias was strong: 60% of all wild potato accessions were collected within 2 km of a road, as opposed to22%, if collections had been made randomly. This analysis can serve as a guide for future collecting trips. Itcan also provide baseline information for the application of genebank data in studies based on geographicinformation systems.
Evaluación de la Representatividad Geográfica de las Colecciones de Bancos de Genes: El Caso de las PapasSilvestres Bolivianas
Resumen:
Las bases de datos de los bancos de germoplasma pueden ser usadas para estudios ecogeográficosbajo el supuesto que las entradas constituyen una muestra geográficamente imparcial. Evaluamos la repre-sentatividad geográfica de una colección de papas silvestres de Bolivia y definimos y evaluamos cuatro tiposde sesgos: sesgos de especie, de especie-área, de áreas con gran diversidad (hotspot), y de infraestructura. Elsesgo de especie implica el muestrear más algunas especies que otras. El sesgo de especie-área es un muestreoque es desproporcionado con respecto al total del área en la cual se encuentra una especie. El sesgo de“hotspot” es el muestreo desproporcionado de áreas con niveles altos de diversidad. El sesgo por infraestruc-tura es aquel muestreo desproporcionado de áreas cercanas a carreteras y pueblos. Cada uno de estos sesgosse presenta en la colección de papas silvestres de Bolivia. El sesgo por infraestructura fue muy elevado: 60%de todas las entradas de papas silvestres fueron colectados dentro de un radio de 2 km de distancia de lascarreteras, cuando se debería esperar un 22% si las colectas se hubieran hecho de manera aleatoria. Esteanálisis puede servir como guía para futuras exploraciones y proporciona una base para la aplicación de los
datos de bancos de genes en estudios basados en sistemas de información geográfica.
*
email [email protected] submitted November 23, 1998; revised manuscript accepted March 1, 2000.

1756
Representativenesss of Wild Potato Collection Hijmans et al.
Conservation BiologyVolume 14, No. 6, December 2000
Introduction
The collection of plant genetic resources provides ac-cess to the greatest possible amount of genetic variabil-ity in a particular species and helps reveal the ecologicaland geographic distribution of plant species (Bennett1970). A genebank is a collection of a particular cropand its wild relatives and, ideally, includes at least oneexample of each alternative allele for each locus (Chap-man 1984). Because researchers can hope to sampleonly a fraction of the genetic variation that occurs in na-ture, it is important that this sample be as large as possi-ble and contain the maximum amount of useful variationfor both present and future use (Allard 1970; Brown &Marshall 1995).
The role of genebanks in the conservation and use ofgermplasm for crop improvement is well established.More recently, genebanks have been used as a source ofdata on the ecological and geographic distribution of spe-cies. For example, Jones et al. (1997) used genebank data-bases and data on climate surfaces to identify areas wherethe wild common bean (
Phaseolus vulgaris
) might occurbut had not actually been recorded. Analysis of georefer-enced genebank data also proves useful in identifying ar-eas of high diversity (Nabhan 1990; Frankel et al. 1995);targeting genetic resources for breeding programs (Nab-han 1990; Guarino et al. 1999); and selecting and design-ing sites for in situ conservation (Guarino et al. 1999). Thescientific value of these alternative uses of genebank datais questionable if the database of localities used for geo-graphic analysis is small, skewed, or otherwise unrepre-sentative of the total natural distribution (Nabhan 1990).
Diversity is not uniformly distributed in space or amongtaxonomic groups. Some genetic heterogeneity can be at-tributed to selection and gene flow and reflects ecogeo-graphic adaptation, whereas other heterogeneity is due tofactors such as founder effects and genetic drift (Guarino1995). Although ecological factors are a major determi-nant of genetic diversity (Bennett 1970), the amount ofgenetic variation that can be attributed to ecogeographicfactors rarely exceeds 50% (Chapman 1989).
Because the distribution of diversity is not knownprior to data analysis, successful collecting in terms ofdiversity may depend on the proper identification ofpopulations closely adapted to specific environmentsand land-use patterns (Brown & Marshall 1995). There-fore, it is often suggested that collectors take a stratifiedsample, dividing the population into as many ecologicaland geographical subpopulations as possible and draw-ing a sample from each one (Cochran 1977). In doingso, it is important to include extremes of the range of aspecies (Allard 1970). Although these subpopulationsmay not present great genotypic variation, they may har-bor unique traits or taxa (Von Bothmer & Seberg 1995).At present, the optimal scales for accurate sampling ofgenetic diversity have not been determined. Brown and
Marshall (1995) suggest sampling 50 plants from each of50 sampling populations in each region, but they do notclearly define the size of those regions.
A genebank collection may deviate from the ideal sam-ple for a number of reasons. Practical constraints in-clude limits on accessibility, time, and funding. In addi-tion, the collection may be skewed if the germplasmwas collected with a specific objective such as rescuingmaterial at risk of extinction, identifying a specific trait,or fulfilling a specific research need (Engels et al. 1995).
Identification of optimal accession sample size for arepresentative genebank collection is an important is-sue, but it will not be covered here. Instead, we analyzehow genebank collections can systematically deviatefrom a representative sample in a relative sense: whethersome species and
/
or areas have been sampled more in-tensively than others. Whether or not a sample may beconsidered representative depends partly on how repre-sentative sampling has been defined. Samples may bethought of as drawn from a pool of individual organismsor from a pool of geographic areas (Hayek & Buzas 1997).If drawn from a pool of individual organisms, a randomsample would tend to produce collections with propor-tionately more accessions from the more abundant spe-cies or common varieties. Whether or not that is desir-able depends on the specific research goals. To assesswhether a genebank collection is representative in therelative sense, we have defined four types of bias. Threeof these biases are spatial: species-area, hotspot, and in-frastructure bias. The fourth, species bias, is not. Westudied the presence of these four types of bias in agenebank collection of wild potatoes from Bolivia.
Species Bias
Species bias refers to sampling more from one speciesthan from another. Species bias might result from differ-ences in the probability of finding one species relative toother species because of differences in abundance or be-cause of collectors’ preferences for a particular speciesdue to a specific expected trait or a specific research need.In terms of genetic resource applications, species biascould be justified if, for example, some species were con-sidered more useful than others because they containedmore genetic diversity or desirable agricultural traits.
Species-Area Bias
Species-area bias refers to over- or undersampling of a spe-cies in relation to the size of the area in which it occurs.Theoretically, to maximize genebank diversity, the num-ber of accessions collected per species should increasewith the size of the area in which it is found, assumingthat a larger distribution area implies a proportionate in-

Conservation BiologyVolume 14, No. 6, December 2000
Hijmans et al. Representativenesss of Wild Potato Collection
1757
crease in intraspecific diversity. This is true, in general,although biological diversity is more directly dependenton ecological diversity and environmental stress factors(Nevo 1998). The increase in diversity with area tendsto be logarithmic (Rosenzweig 1995; Magurran 1988).
Therefore, a species-area bias exists if a collection con-tains too many accessions from some species, and hencetoo few from others, relative to the size of the areas inwhich the species appear. No species-area bias exists ifeach species is represented proportionately accordingto its geographic range. Unless all species distribution ar-eas are the same size, there will be a species bias, a spe-cies-area bias, or both.
Hotspot Bias
Hotspot bias refers to excessive or insufficient collec-tion in certain geographic areas according to their levelof genetic diversity. This is likely to occur if a genebankcontains material from different expeditions. To avoidthis bias, collection expeditions should cover comple-mentary areas. Collectors may replicate parts of previ-ous expedition routes to find particular species and toensure that they obtain a sufficient amount of germ-plasm. Although it is important to consult genebank andherbarium databases and the route maps of previous col-lectors to design a collecting strategy (Nabhan 1990;Brown & Marshall 1995), this might lead to redundancyif collectors aim only for areas where previous studiesand collections indicate that high species diversity ex-ists. Consequently, some areas may be explored more in-tensively than others, creating a hotspot bias. The collec-tion would have too many accessions from certain highlydiverse areas, in a relative sense, despite the potentiallyhigh level of species diversity.
Infrastructure Bias
Infrastructure bias refers to oversampling near roads andtowns. For reasons of efficiency, logistics, and convenience,collectors tend to follow the roads that connect themain towns. Hermann (1988) showed that most Andeantuber crop collection sites in Ecuador were located alongthe Pan-American Highway and other major roads. Basedon herbarium records, Von Bothmer and Seberg (1995)produced a distribution map for
Elymus cordilleranus
in South America which shows distinct aggregation aroundLa Paz (Bolivia), Lima (Peru), and the Pan-AmericanHighway in Ecuador. This does not reflect species distri-bution accurately (Von Bothmer & Seberg 1995). Øll-gaard (1995) analyzed the geographic distribution of
Hu-perzia
based on collections considered representativeand of sufficient quality for determining priorities in se-lecting biodiversity reserves. He found that these collec-
tions showed a strong tendency to be located near roadsand special collection sites.
Methods
Wild Potato Genebank Data
The wild tuber-bearing
Solanum
species (Solanaceaesect.
Petota
) are relatives of the cultivated potato (
Solanumtuberosum
and six other species; Hawkes 1990). Theyappear in the Americas from Colorado in the UnitedStates to Argentina and Chile and are most abundant inthe Andes of Peru and Bolivia (Hawkes 1990). Wild pota-toes have been used in modern breeding programs toimprove the cultivated potato since the early 1900swhen Mexican
S. demissum
was used to breed for resis-tance against
Phytophthora infestans
, the fungus thatcauses potato late blight (Ross 1986). We restricted ourstudy to data for wild potatoes collected in Bolivia. Anoverview and in-depth information about wild potatospecies from Bolivia are provided by Hawkes and Hjert-ing (1989), Hawkes (1990), and Ochoa (1990). A recentwild-potato collecting expedition in Bolivia is reportedby Spooner et al. (1994).
Our data source was the Intergenebank Potato Data-base (IPD). The IPD contains passport and evaluationdata from the world’s six main wild potato genebanks.Passport data include location variables such as the geo-graphic coordinates and the locality, province, and de-partment of origin for each accession. Each accessionrepresents a number of potato seeds stored in one ormore of the genebanks. The IPD currently has over 7128records, of which 1440 are from Bolivia. The Boliviandata were drawn from 18 different expeditions con-ducted from 1953 to 1994.
Geographic Information System
Each accession has passport data that include geographiccoordinates. We used these data to incorporate the IPDinto a geographic information system (GIS) with IDRISI,Arc
/
Info, and ArcView software. This yielded a digitalmap of collection sites consisting of points with theIPD’s records as attributes. The location of these pointswas checked according to procedures described by Hij-mans et al. (1999). This included the production of anoverlay of the collection site map and an administrativeboundary map of Bolivian departments and provinces toallow comparison of the province and department namesfrom both sources. If coordinates were wrong or miss-ing, new coordinates were assigned when possible, basedon the IPD locality description. After applying these pro-cedures, we found that 1051 out of 1440 Bolivian acces-sions in the database had confirmed geographic coordi-nates (Fig. 1) and could thus be used in our study.

1758
Representativenesss of Wild Potato Collection Hijmans et al.
Conservation BiologyVolume 14, No. 6, December 2000
Species Bias
There is an ongoing debate about species boundaries inwild potatoes (Spooner & Castillo 1997; Van den Berg etal. 1998). We have treated all species, subspecies, andvarieties included in the database as separate taxa, ac-cording to the identification criteria determined by col-lectors and genebank taxonomists. Using this criterion,
we found that there are 45 wild potato taxa (hereafterreferred to as species) collected in Bolivia, conserved inex situ genebanks, and documented in the IPD. We tabu-lated the number of accessions per species,
A
S
. The pres-ence of a species bias was evaluated with a chi-squaretest to compare the observed number of accessions perspecies to the number per species that would be ob-
Figure 1. Bolivia departments (solid lines), locations where wild potatoes (Solanum spp.) were collected (dots, n 5 1051), 100 3 100 km grid cells (dotted lines), and number of collecting expeditions per grid cell.
Conservation BiologyVolume 14, No. 6, December 2000
Hijmans et al. Representativenesss of Wild Potato Collection
1759
served if accessions were equally allocated between allspecies.
Species-Area Bias
We divided Bolivia into 100
3
100 km grid cells (Fig. 1),and for each species,
S
, we determined the number ofgrid cells in which it was collected (
G
S
). If there is nospecies-area bias, there should be a high degree of corre-lation between
A
S
and
G
S
. The relation between
A
S
and
G
S
was described by linear and logarithmic regression.We used a chi-square test to compare the observed num-ber of accessions per species to the number per speciesthat would be observed if accessions were equally allo-cated to each species based on the number of grid cellsin which it occurs. The results of the comparison shouldreveal systematic deviations from the expected relation-ships between
A
S
and
G
S
.
Hotspot Bias
To examine the presence of a hotspot bias, we again di-vided Bolivia into 100
3
100 km grid cells (Fig. 1). Foreach grid cell,
G
, we determined the number of acces-sions collected,
A
G
; the number of species collected,
S
G
;and the number of expeditions that collected a sample(accession),
E
G
. The relationships between
A
G
,
S
G
,
A
G
/
S
G
and
E
G
were determined by linear regression. We deter-mined a hotspot bias to be present if there was a signifi-cant (and positive) correlation between
A
G
/
S
G
and
E
G
.We determined the number of expeditions per areafrom published route maps (e.g., Spooner et al. 1994) orinferred them by plotting collection sites on a road map.Large gaps between collection sites were not included,
because the routes between them were not always clearand because they were likely to represent stretcheswhere no active searching for wild potatoes took place.
Infrastructure Bias
To assess the presence of an infrastructure bias, we di-vided Bolivia into 1
3
1 km grid cells. For each grid cell,we determined the distance to the nearest road, nearestmain road, and nearest large city (i.e., the departmentcapital). Based on this grid, we calculated the distancebetween each accession area and the main road. Thisyielded a specific distribution, which we then comparedby chi-square test with the “random” distribution, thedistribution of the distance between the (main) road orcity over the grid cells where wild potatoes are know tooccur.
Results
Species Bias
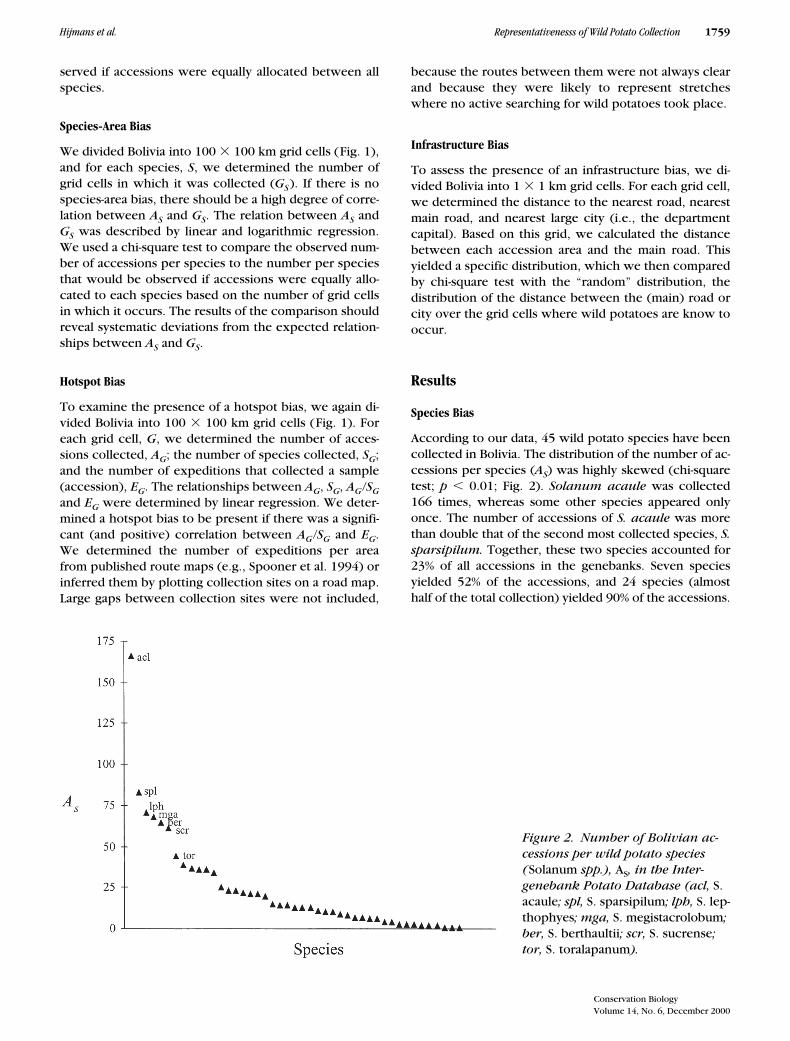
According to our data, 45 wild potato species have beencollected in Bolivia. The distribution of the number of ac-cessions per species (
A
S
) was highly skewed (chi-squaretest;
p
,
0.01; Fig. 2).
Solanum acaule
was collected166 times, whereas some other species appeared onlyonce. The number of accessions of
S. acaule
was morethan double that of the second most collected species,
S.sparsipilum.
Together, these two species accounted for23% of all accessions in the genebanks. Seven speciesyielded 52% of the accessions, and 24 species (almosthalf of the total collection) yielded 90% of the accessions.
Figure 2. Number of Bolivian ac-cessions per wild potato species(Solanum spp.), AS, in the Inter-genebank Potato Database (acl, S. acaule; spl, S. sparsipilum; lph, S. lep-thophyes; mga, S. megistacrolobum; ber, S. berthaultii; scr, S. sucrense; tor, S. toralapanum).

1760
Representativenesss of Wild Potato Collection Hijmans et al.
Conservation BiologyVolume 14, No. 6, December 2000
The strong species bias evident in this case is not de-sirable for maximizing the diversity of a genebank col-lection, but this bias does not have direct implicationsfor geographical representativeness.
S. acaule
is wide-spread, and the high number of accessions from thisspecies might be a reflection of this.
Species-Area Bias
The number of accessions per species increased with in-creasing species distribution area (Fig. 3). The number ofaccessions per species (
A
S
) increased disproportionatelywith
G
S
, and the observed relation between
G
S
and
A
S
was significantly different from the predicted linear andlogarithmic relationships (
x
2
test;
p
,
0.01).
Solanumacaule
was strongly oversampled.
Solanum sucrense
,
S.lepthophyes
, and
S. berthaultii
also were oversampled.Not all species that were collected many times are neces-sarily oversampled according to this criterion. The num-ber of accessions from
S. sparsipilum
and
S. megista-crolobum
, for example, were about what would beexpected on average given the area they occupy, despitetheir second and fourth rank on the abundance curve(Fig. 2). Other species, such as
S. brevicaule
and
S. in-fundibuliforme
, were undersampled.
Hotspot Bias
The Bolivian wild potato collection is the result of 18collecting expeditions. The number of accessions percell increased with the number of expeditions to thecell. A linear approximation of this relationship is
A
G
5
5.1 * EG (r2 5 0.45, p , 0.01). This relationship does notnecessarily imply the presence of a hotspot bias; it mayonly reflect that the cells in which wild potatoes are
more diverse have been visited more often. This is sup-ported by the fact that the number of species collectedwithin a grid cell, SG, also increased with the number ofexpeditions to the cell: SG 5 0.96 * EG (r2 5 0.13, p 50.04). This relationship is rather weak, however. More-over, the ratio of SG and AG—the number of accessionsper species in a cell—also went up with the number ofexpeditions to the cell: AG/SG 5 1.4 1 0.4 * EG (r2 50.52, p , 0.01) (Fig. 4). This suggests the presence of ahotspot bias. In terms of diversity, there has been exces-sive sampling, relatively speaking, in areas with highspecies diversity, unless one assumes that intraspecificdiversity is higher in areas with more species.
Infrastructure Bias
Most accessions have been collected near main roads thatconnect major Bolivian cities and surrounding areas (Fig.5). Sixty percent of all accessions were collected within 2km of the nearest road, and 78% were collected within 4km (Fig. 6). This is in sharp contrast with the distancefrom random points to the major road in each area: 22%within 2 km and 44% within 4 km. Forty-four percent ofthe accessions were found within 10 km of a main road,rather than the expected 27%. Thirty-three percent of theaccessions were found within 40 km of a departmentcapital, as opposed to the expected 21%. In all threecases, the distributions differed significantly from the ex-pectation of a random distribution (x2 test; p , 0.01).
Discussion
The species and species-area biases we found may haveoccurred for several reasons. Collectors may have had a
Figure 3. Number of accessions per wild potato species (Solanum spp.), AS, versus number of grid cells per species, GS (solid line, y 5 24.2 * Ln(x) 2 7.3, r2 5 0.54; dashed line, y 5 5.0 * x , r2 5 0.76; acl, S. acaule; spl, S. sparsipilum; lph, S. leptho-phyes; mga, S. megistacrolobum; ber, S. berthaultii; scr, S. sucrense; brc, S. brevicaule; ifd, S. infundibuli-forme).

Conservation BiologyVolume 14, No. 6, December 2000
Hijmans et al. Representativenesss of Wild Potato Collection 1761
preference for a particular species. Some species may bemore abundant than others, irrespective of the size oftheir distribution area, which increases the likelihood ofcollection. Some species are more common in disturbedareas such as roadsides and are therefore more likely tobe spotted and collected. The most frequently collectedspecies, S. acaule, is an abundant inbreeder that is al-most always found carrying seeds. Other species arerare, endemic, and often found without seeds; therefore,they are hard to collect. On the other hand, collectionexpeditions are sometimes justified by the absence ofcertain species in genebanks (e.g., Spooner et al. 1999),and a lot of effort may be expended to obtain samples ofthese species, which may be difficult to collect.
If there is no species-area bias, a stricter definition ofspecies-area bias might be considered in which a repre-sentative collection would contain equal numbers of ac-cessions for each species in each grid cell where thatspecies occurs. This definition is stricter because it re-quires an equal allocation of accessions per grid cellwithin a species, as well as an allocation per species pro-portional to the number of grid cells a species occupies.
Species and species-area data depend on the definitionof species boundaries. S. megistacrolobum and S. toral-apanum (numbers 4 and 7, respectively, in the abun-dance ranking in Fig. 2), can be considered related vari-eties (Ochoa 1990) or subspecies (Giannattasio & Spooner1994a, 1994b). If they were treated as one entity insteadof two, that one species would be the second most dom-inant in the collection.
The presence of a hotspot bias suggests that collectorstend to collect in areas where previous expedition reportsindicate the presence of many taxa. The fact that theIPD comprises several different genebank collections mayhave amplified this bias because all genebank curatorsseek some representation of the predominant species.
One weakness in analysis of hotspot bias is that it isnot known whether unsuccessful attempts were madeto collect wild potatoes (white areas in Fig. 5). Locationsof these attempts are not recorded in genebank data-bases, and there are probably few collectors who sys-tematically include in their records observations on theabsence of certain species in certain areas. It would beuseful if collectors would develop a more systematic doc-umentation system that would include absence-presenceand abundance data for all sites they explore, whethergermplasm was collected or not. It would be useful ifroute maps indicated along which stretches active ex-ploration took place, to distinguish these stretches fromthose that, for example, were deemed not relevant orwere passed at night. In 1970, Bennett noted that “theneed to formulate basic and standard procedural patternswith the capacity to absorb, integrate, preserve andmake available the data of exploration missions is now ur-gent.” Unfortunately, this statement is still valid.
Species-area and hotspot biases are scale dependent.Final scale selection is usually a compromise betweenthe conflicting objectives of a high number of grid cellsand a high number of observations per cell. Because ourmain objective was to screen genebank data for use in
Figure 4. Ratio of the number of accessions per species (AG/SG ) of wild potato species (Solanum spp.) in the Intergenebank Potato Data-base for Bolivia versus the number of expeditions ( EG ) per 100 3 100 km grid cell.

1762 Representativenesss of Wild Potato Collection Hijmans et al.
Conservation BiologyVolume 14, No. 6, December 2000
Figure 5. Location of roads, towns, and collections sites of wild potatoes (Solanum spp.) in central Bolivia.

Conservation BiologyVolume 14, No. 6, December 2000
Hijmans et al. Representativenesss of Wild Potato Collection 1763
GIS-based studies, it is reasonable to check for these twobiases at the same scale that will be used in subsequentstudies. In terms of maximizing diversity in the actualgenebanks, at least for wild potato, the optimal collec-tion scale has not been determined. Multiscale studies onthe distribution of crop genetic diversity would be use-ful in this respect.
A significant factor leading to infrastructure bias istime limitations, particularly for expeditions in vast, rug-ged areas such as the Bolivian Andes. Maximum cover-age of such areas precludes roaming far from mainroads. In practice, therefore, explorers cannot samplerandomly, particularly for highly endemic species.
The fact that the wild potato has been oversamplednear roads and cities may render the genebank less repre-sentative, but this aspect may have a positive side. Ge-netic erosion is caused mainly by increased human activ-ity such as building and agriculture, which often occurnear roads and cities. Therefore, it may be that the infra-structure bias has inadvertently led to a collection bias to-ward genepools that are the most endangered. The oppo-site might also be true: infrastructure bias may havefavored collection of common weedy species that tendto grow near roads. For these species, an apparent infra-structure bias would be expected even if collection wasdone randomly throughout an area. Other species maybe reduced near roads and cities because of land-use pat-terns such as grazing. For these species, an infrastructurebias would lead to undercollection and/or collection ofonly individual plants growing on the periphery of thespecies’ ecological niche.
Because the primary objective of genebanks is to con-serve diversity, sampling should be carried out accord-
ingly. By standards such as those suggested by Brownand Marshall (1995), all species in the collection are un-derrepresented in the absolute sense. Many wild potatospecies are endemic, rare, and hard to locate. For thesespecies, theoretical sampling schemes do not havemuch practical relevance.
For studies of the spatial distribution of crop diversity,other sampling approaches, such as the grid-based datacollection system analyzed by Prendergast et al. (1993),would be useful. It is unlikely, however, that this type ofdata could be obtained for many areas or species, so re-searchers will have to rely on data from genebanks.Checking for the four types of biases we have describedcan be a useful point of departure for studies based ongenebank data. Depending on the objectives of thestudy, it may be necessary to adjust the methods andscales used. For example, if an infrastructure bias ispresent and could potentially skew data, the subsequentstudy may have to be carried out at a scale that mini-mizes this bias (generally a low-resolution scale). In thecase of a species-area bias, one might consider eliminat-ing some data to remove the bias.
In formal comparisons of the observed allocation ofaccessions to the predicted allocation, assuming no bi-ases, the following should be noted. Because the infor-mation on the collection accessions is, in effect, a com-plete survey, statistical tests are not needed to determinethe presence of the four types of biases we have de-scribed. Therefore, the collection can be examined todetermine whether the accessions are allocated in theproportions expected in the absence of a bias. A deci-sion on how much deviation from this expectation isneeded before a bias may be considered important be-
Figure 6. The distance from the nearest road in Bolivia for the ac-cessions in the genebanks (ob-served) and for random points in the area where wild potatoes(Solanum spp.) occur.

1764 Representativenesss of Wild Potato Collection Hijmans et al.
Conservation BiologyVolume 14, No. 6, December 2000
comes a matter of judgement based on how the informa-tion will be used. The statistical tests we have used tocompare observed allocations to predicted allocations inthe absence of bias are indicators of inherent trends to-ward bias. That is, assuming that past and future pro-cesses for adding accessions to collections are the same,these tests can help indicate whether or not dispropor-tionate allocations are likely to be maintained.
We have defined four types of biases that may bepresent in genebank collections—species, species-area,hotspot, and infrastructure—and have evaluated them fora collection of wild potatoes from Bolivia. Because allfour types of bias were present to some extent, thegenebank data may not be an adequate representation ofthe existing diversity or the actual geographic spread ofwild potato species in Bolivia. Collecting expeditions didnot use a spatially unbiased statistical sampling procedureto collect a representative sample of the wild potatoes inBolivia. Instead, it seems that collectors often went tosites where they expected to find a particular species,perhaps based on the results of former expeditions, andthat they tended to collect samples near major roads.
Because genebanks are mainly compiled to achievemaximum diversity and usefulness (e.g., crossability,presence of resistance genes), spatial biases may be ac-ceptable. The methods and findings we have presentedmay help prevent redundancy and omissions in genebanks.Future collections could focus on underrepresented spe-cies and/or on those from underrepresented areas, de-pending on whether the genetic diversity (in usefultraits) was a function of species, region, or both. Thiswould increase the probability of conserving a more bal-anced collection of potentially useful diversity.
Our findings also have important implications for theuse of genebank data in GIS-based exploration and con-servation studies (e.g., Jones et al. 1997). An underlyingassumption in such studies may be that data from collec-tions are a representative random sample of the existingdiversity of a species. We have shown that this assump-tion may not always be justified. Although we have ana-lyzed data from only one genebank, the factors consid-ered in this study may be relevant in other settings. Forexample, McAllister et al. (1994) mention a sampling-intensity bias that complicates the species-density map-ping of coral reef fish. Therefore, analyses of spatial rep-resentativeness may be important for any biological col-lection being used in GIS-based studies.
Acknowledgments
We thank A. Salas and J. de la Cruz for help in improvingthe coordinates of the accessions; A. Hollister for edito-rial suggestions; and D. Spooner, L. Guarino, M. Her-mann, and the anonymous reviewers for their critical re-view of an earlier version of this paper.
Literature Cited
Allard, R. W. 1970. Population structure and sampling methods. Pages97–107 in O. H. Frankel and E. Bennett, editors. Genetic resourcesin plants: their exploration and conservation. F.A. Davis Company,Philadelphia.
Bennett, E. 1970. Tactics of plant exploration. Pages 157–179 in O. H.Frankel and E. Bennett, editors. Genetic resources in plants: theirexploration and conservation. F.A. Davis Company, Philadelphia.
Brown, A. H. D., and D. R. Marshall. 1995. A basic sampling strategy:theory and practice. Pages 75–91 in L. Guarino, V. Ramanatha Rao,and R. Reid, editors. Collecting plant genetic diversity. Technicalguidelines. CAB International, Wallingford, United Kingdom.
Chapman, C. D. G. 1984. On the size of a genebank and the geneticvariation it contains. Pages 102–119 in J. H. W. Holden and J. T.Williams, editors. Crop genetic resources: conservation and evalua-tion. Allen & Unwin, London.
Chapman, C. D. G. 1989. Collection strategies for the wild relatives offield crops. Pages 263–279 in A. H. D. Brown, O. H. Frankel, D. R.Marshall, and J. T. Williams, editors. The use of plant genetic re-sources. Cambridge University Press, Cambridge, United Kingdom.
Cochran, W. G. 1977. Sampling techniques. Wiley, Chichester, UnitedKingdom.
Engels, J. M. M., R. K. Arora, and L. Guarino. 1995. An introduction toplant germ plasm exploration and collecting: planning, methodsand procedures, follow-up. Pages 31–63 in L. Guarino, V. Ra-manatha Rao, and R. Reid, editors. Collecting plant genetic diver-sity. Technical guidelines. CAB International, Wallingford, UnitedKingdom.
Frankel, O. H., A. H. D. Brown, and J. J. Burdon. 1995. The conserva-tion of plant biodiversity. Cambridge University Press, Cambridge,United Kingdom.
Giannattasio, R. B., and D. M. Spooner. 1994a. A reexamination of spe-cies boundaries between Solanum megistacrolobum and S. torala-panum (Solanum sect. Petota, series Megistacroloba): morpholog-ical data. Systematic Botany 19:89–105.
Giannattasio, R. B., and D. M. Spooner. 1994b. A reexamination of speciesboundaries and hypotheses of hybridization concerning Solanummegistacrolobum and S. toralapanum (Solanum sect. Petota, seriesMegistacroloba): molecular data. Systematic Botany 19:106–115.
Guarino, L. 1995. Mapping the ecogeographic distribution of biodiver-sity. Pages 287–328 in L. Guarino, V. Ramanatha Rao, and R. Reid,editors. Collecting plant genetic diversity. Technical guidelines.CAB International, Wallingford, United Kingdom.
Guarino, L., N. Maxted, and M. Sawkins. 1999. Analysis of geo-refer-enced data and the conservation and use of plant genetic re-sources. Pages 1–23 in S. L. Greene and L. Guarino, editors. Link-ing genetic resources and geography: emerging strategies forconserving and using crop biodiversity. Special publication. Ameri-can Society for Agronomy, Crop Science Society of America, andSoil Science Society of America, Madison, Wisconsin.
Hawkes, J. G. 1990. The potato: evolution, biodiversity and genetic re-sources. Belhaven Press, London.
Hawkes, J. G., and J. P. Hjerting. 1989. The potatoes of Bolivia, theirbreeding value and evolutionary relationships. Clarendon Press,Oxford, United Kingdom.
Hayek, L. A. C., and M. A. Buzas. 1997. Surveying natural populations.Columbia University Press, New York.
Hermann, M. 1988. Progress report of the IBPGR research project onthe genetic resources of Andean tuber crops. AGP-IBPGR report89/2. International Board for Plant Genetic Resources, Rome.
Hijmans, R. J., M. Schreuder, J. De la Cruz, and L. Guarino. 1999. UsingGIS to check coordinates of genebank accessions. Genetic Re-sources and Crop Evolution 46:291–296.
Jones, P. G., S. E. Beebe, J. Tohme, and N. W. Galwey. 1997. The use ofgeographical information systems in biodiversity exploration andconservation. Biodiversity and Conservation 6:947–958.

Conservation BiologyVolume 14, No. 6, December 2000
Hijmans et al. Representativenesss of Wild Potato Collection 1765
Magurran, A. E. 1988. Ecological diversity and its measurement. Prince-ton University Press, Princeton, New Jersey.
McAllister, D. E., F. W. Schueler, C. M. Roberts, and J. P. Hawkins.1994. Mapping and GIS analysis of he global distribution of coralreef fishes on an equal area-grid. Pages 155–175 in R. I. Miller, edi-tor. Mapping the diversity of nature. Chapman & Hall, London.
Nabhan, G. P. 1990. Wild Phaseolus ecogeography in the Sierra MadreOccidental, Mexico: aerographic techniques for targeting and con-serving species diversity. Systematic and ecogeographic studies oncrop genepools 5. International Board for Plant Genetic Resources,Rome.
Nevo, E., 1998. Molecular evolution and ecological stress at global, re-gional and local scales: the Israeli perspective. The Journal of Ex-perimental Zoology 282:95–119.
Ochoa, C. M. 1990. The potatoes of South America: Bolivia. CambridgeUniversity Press, Cambridge, United Kingdom.
Øllgaard, B. 1995. Diversity of Huperzia (Lycopodiaceae) in Neotropi-cal montane forests. Pages 349–358 in S. P. Churchill, H. Balslev, E.Forero, and J. L. Luteyn, editors. Biodiversity and conservation ofNeotropical montane forests. The New York Botanical Garden,New York.
Prendergast, J. R., R. M. Quinn, J. H. Lawton, B. C. Eversham, and D. W.Gibbons. 1993. Rare species, the coincidence of diversity hotspotsand conservation strategies. Nature 365:335–337.
Rosenzweig, M. L. 1995. Species diversity in space and time. Cam-bridge University Press, Cambridge, United Kingdom.
Ross, H. 1986. Potato breeding: problems and perspectives. Advancesin potato breeding 13. Verlag Paul Parey, Berlin.
Spooner, D. M., and R. Castillo. 1997. Reexamination of series relation-ships of South American wild potatoes (Solanaceae: Solanum sect.Petota): evidence from chloroplast DNA restriction site variation.American Journal of Botany 84:671–685.
Spooner, D. M., R. G. van den Berg, W. Garcia, and M. L. Ugarte. 1994.Bolivia potato germplasm collecting expeditions 1993, 1994: tax-onomy and new germplasm resources. Euphytica 79:137–148.
Spooner, D. M., A. Salas, Z. Huamán, and R. J. Hijmans. 1999. Potatogermplasm collecting expedition in Southern Peru (Departmentsof Apurímac, Arequipa, Cusco, Moquegua, Puno, Tacna) in 1998:taxonomy and new genetic resources. American Journal of PotatoResearch 76:103–119.
Van den Berg, R. G., J. T. Miller, M. L. Ugarte, J. P. Kardolus, J. Villand,J. Nienhuis, and D. M. Spooner. 1998. Collapse of morphologicalspecies in the wild potato Solanum brevicaule complex (Solan-aceae: sect. Petota). American Journal of Botany 85:92–109.
Von Bothmer, R., and O. Seberg. 1995. Strategies for the collecting ofwild species. Pages 93–111 in L. Guarino, V. Ramanatha Rao, andR. Reid, editors. Collecting plant genetic diversity, technical guide-lines. CAB International, Wallingford, United Kingdom.