Embed Size (px)
Citation preview
RESEARCH Open Access
Assessing the household economic burdenof non-communicable diseases in India:evidence from repeated cross-sectionalsurveysVeenapani Rajeev Verma*, Piyush Kumar and Umakant Dash
Abstract
Background: Financing for NCDs is encumbered by out-of-pocket expenditure (OOPE) assuming catastrophicproportions. Therefore, it is imperative to investigate the extent of catastrophic health expenditure (CHE) on NCDs,which are burgeoning in India. Thus, our paper aims to examine the extent of CHE and impoverishment in India, inconjunction with socio-economic determinants impacting the CHE.
Methods: We used cross-sectional data from nationwide healthcare surveys conducted in 2014 and 2017–18. OOPEon both outpatient and inpatient treatment was coalesced to estimate CHE on NCDs. Incidence of CHE was definedas proportion of households with OOPE exceeding 10% of household expenditure. Intensity of catastrophe wasascertained by the measure of Overshoot and Mean Positive Overshoot Indices. Further, impoverishing effects ofOOPE were assessed by computing Poverty Headcount Ratio and Poverty Gap Index using India’s official poverty line.Concomitantly, we estimated the inequality in incidence and intensity of catastrophic payments usingConcentration Indices. Additionally, we delineated the factors associated with catastrophic expenditure usingMultinomial Logistic Regression.
Results: Results indicated enormous incidence of CHE with around two-third households with NCDs facing CHE.Incidence of CHE was concentrated amongst poor that further extended from 2014(CI = − 0.027) to 2017–18(CI =− 0.065). Intensity of CHE was colossal as households spent 42.8 and 34.9% beyond threshold in 2014 and 2017-18respectively with poor enduring greater overshoot vis-à-vis rich (CI = − 0.18 in 2014 and CI = − 0.23 in 2017–18).Significant immiserating impact of NCDs was unraveled as one-twelfth in 2014 and one-eighth households in2017–18 with NCD burden were pushed to poverty with poverty deepening effect to the magnitude of 27.7 and30.1% among those already below poverty on account of NCDs in 2014 and 2017–18 respectively. Further, largeinter-state heterogeneities in extent of CHE and impoverishment were found and multivariate analysis indicatedabsence of insurance cover, visiting private providers, residing in rural areas and belonging to poorest expenditurequintile were associated with increased likelihood of incurring CHE.
(Continued on next page)
© The Author(s). 2021 Open Access This article is licensed under a Creative Commons Attribution 4.0 International License,which permits use, sharing, adaptation, distribution and reproduction in any medium or format, as long as you giveappropriate credit to the original author(s) and the source, provide a link to the Creative Commons licence, and indicate ifchanges were made. The images or other third party material in this article are included in the article's Creative Commonslicence, unless indicated otherwise in a credit line to the material. If material is not included in the article's Creative Commonslicence and your intended use is not permitted by statutory regulation or exceeds the permitted use, you will need to obtainpermission directly from the copyright holder. To view a copy of this licence, visit http://creativecommons.org/licenses/by/4.0/.The Creative Commons Public Domain Dedication waiver (http://creativecommons.org/publicdomain/zero/1.0/) applies to thedata made available in this article, unless otherwise stated in a credit line to the data.
* Correspondence: [email protected] of Humanities and Social Sciences, Indian Institute ofTechnology Madras, Chennai, India
Verma et al. BMC Public Health (2021) 21:881 https://doi.org/10.1186/s12889-021-10828-3
(Continued from previous page)
Conclusion: Substantial proportion of households face CHE and subsequent impoverishment due to NCD relatedexpenses. Concerted efforts are required to augment the financial risk protection to the households, especially inregions with higher burden of NCDs.
Keywords: Catastrophic health expenditure, Non communicable diseases, Impoverishment
IntroductionNon-communicable diseases (NCDs) has assumed sig-nificant proportions in contributing to the overall dis-ease burden, measured in disability-adjusted life years(DALYs) in India, over the past 30 years [1]. India’sState-Level Disease Burden Initiative affirmed that everystate in India is currently grappling with higher burdenof NCDs and injuries vis-à-vis infectious diseases. In2017, NCDs accounted for 63.7% of all mortality andwas a major contributor in the cost of treatment for in-patient admissions (40%) and ambulatory care (35%).While India witnessed a paradigm shift in its commit-ment towards Universal Health Coverage post 2014, thepromise of universality would be delivered only if itsstructure and implementation recognize and respond toNCD related poverty [2].The unprecedented financial burden posed by NCDs is
two- pronged; Firstly, at the macroeconomic level, bur-den posed by NCDs has deleterious effects on economicgrowth of nations. A 2011 report delving on economicburden of NCDs in low-and-middle income countriesconcluded that major NCDs like cardiovascular diseases,cancer and chronic respiratory diseases could cost thesecountries roughly $ 7 trillion between 2011 and 2025[3]. Correspondingly, estimates from India suggest thatNCDs in India account for an economic burden in therange of 5–10% of GDP, significantly slowing down eco-nomic growth [4]. Since India is confronted by 'tripleburden' of disease; in conjunction with infectious diseaseand injuries, burden posed by NCDs remains Achillesheel for underfunded health system. Secondly, NCDshave adverse impact on the financial stability of house-holds with ailing members. National Health Accountsestimates divulge that abysmally low coverage of privatehealth insurance coupled with dearth of governmentexpenditure on prepayment mechanisms and publicsubsidies implied a reliance on out-of-pocket payments(58.7% of total health expenditure) for healthcaresuperfluously [5]. Consequently, households becomevulnerable to catastrophic health expenditure and im-poverishment due to health shocks which can culminatein the long term consequence of trans-generational cycleof poverty. The impact of NCDs on households is likelyto be especially severe in LMICs where low-income pop-ulations, many of whom already experience extremeabsolute poverty and precarious living conditions are
especially vulnerable to impoverishment due to any de-gree of health spending. Thus, it is imperative to gaugean estimate of headcount of households susceptible tocatastrophic health expenditure in order to bolster evi-dence backed policy decisions towards the trajectory ofachieving Universal Health Coverage.Traditionally, in India, healthcare financing has been
mostly restricted to the supply side, focusing onstrengthening of infrastructure and human resource. Al-beit, the earmarked spending on NCDs and injuries bythe government is less than 0.5% of GDP which is littlemore than one-fourth of total health spending of thecountry [6]. However, since 2007, myriad of publicly fi-nanced health insurance schemes lave been launched inIndia; both at the state level such as Rajiv AarogyasriHealth Insurance Scheme (RAS) in Andhra Pradesh,Rajiv Gandhi Jeevandayee Arogya Yojana (RGJAY) inMaharashtra, Chief Minister’s Comprehensive Health In-surance Scheme (CMCHIS) in Tamil Nadu and at centerlevel such as Rashtriya Swasthya Bima Yojana (RSBY)and recently more expansive Pradhan Mantri Jan ArogyaYojana (PM-JAY) [7]. These demand-side financingmechanism entitle poor and vulnerable households toseek cashless secondary and tertiary hospitalization inselect empaneled hospitals. However, no attempt hasbeen made to gauge the extent of financial protectionobtained for NCDs via these schemes. Studies have notbeen conducted specifically to discern catastrophicspending and impoverishment in NCD affected house-holds. Thus, despite the policy relevance, there is amajor lacunae in the evidence from population-basedstudies on the economic burden imposed by chronicnon-communicable diseases in India.India is also characterized by pervasive income in-
equalities in healthcare measures and in the absence oftargeted and sustained interventions, the inequality gapis likely to extend. Even though, there is some limitedevidence delving into the impact of socio-economic in-equalities on incidence of catastrophic payments in In-dian context [8] [9]; studies pertaining to NCDs havenot been conducted. Analogously, there is substantialheterogeneity in the burden of NCDs and capacity topay for healthcare between the states that needs to beexamined. Hence, it is pertinent to conduct a disaggre-gated analysis at the granular level in order to generatethe evidence for priority setting and discern how policies
Verma et al. BMC Public Health (2021) 21:881 Page 2 of 22

and implementation can be aligned to provide financialrisk protection amongst the subjects of the state. Not-withstanding its implications, an enquiry into theregional variations are exiguous in literature. Further,the studies making an enquiry into the determinants ofcatastrophic payments are further scarce [10]; and mostof the studies employed smaller sample size and wereconducted at different time periods [11–14]; renderinginter-temporal and inter-regional comparisons arduous.Given this backdrop and limitations in existing litera-
ture, we strived to undertake a succinct analysis of eco-nomic burden associated with NCDs at household level.Three-fold objectives are espoused in our study - Firstly,we carried out an assessment of the incidence and inten-sity of catastrophic health expenditures on NCDs at thenational and disaggregated state level. Secondly, weattempted to quantify the extent to which catastrophicpayments on NCDs results in impoverishment at the na-tional and disaggregated state level and Thirdly, we un-raveled the socio-economic determinants impacting thecatastrophic health expenditures on NCDs in India. Toour knowledge, this is the first study delving into thecatastrophic payments exclusively related to NCDs inIndia. Our study has used most recent nationally repre-sentative large and robust dataset on morbidity,utilization and healthcare expenditures in India.
Data and methodsDataCross sectional individual level data was taken from tworounds of nationally representative National Sample Sur-vey Organization surveys: Survey on Social Consumption(71st round) and Household Social Consumption inIndia: Health (75th round). These surveys were con-ducted under the stewardship of the Ministry of Statis-tics and Programme Implementation, Government ofIndia and are representative at the state level as well. Itcollected information pertaining to households and indi-viduals socio-economic background, morbidity status,utilization of healthcare services and healthcare expend-iture on ambulatory, inpatient and delivery care. Thesurvey rounds employed two-stage stratified design, withcensus villages and urban blocks as the first stage units(FSUs) for rural and urban areas respectively and house-holds as the second stage units (SSUs). The sample sizecircumscribed 3, 35,499 and 5, 57,887 individuals (in-cluding death cases) encompassing 65,932 and 1, 13,823households in 71st and 75th rounds respectively. Thedetailed information on survey design can be found inthe afforementioned report [15, 16].
MeasuresFollowing outcome measures were gauged in the study:a) Extent of out of pocket expenditure (OOPE) on
healthcare b) Incidence and Intensity of catastrophichealth expenditure as per income quintiles c) Impoverish-ing effects of catastrophic health expenditure d) Determi-nants influencing the catastrophic health expenditure.Information on both medical and non-medical expenseswas used from the survey to discern the extent of OOPE.Medical component incorporated information on doc-tor’s/surgeon’s fee, medicines, diagnostic tests, bedcharges, physiotherapy, personal medical appliances andother consumables such as blood and oxygen etc.Whereas, non-medical components subsumed informa-tion on expenses incurred on transportation, food, lodg-ing, and expenditure on escort and registration fees onaccount of treatment. OOPE is then defined as directpayments made by individuals to healthcare providers atthe time of service use net of any reimbursements bymedical insurance company or employer. Generally,catastrophic health expenditure is defined as OOPE forhealthcare that exceeds a certain proportion of a house-hold’s income with the consequence that householdssuffer the burden of disease [17]. However, varied defini-tions and thresholds are employed in the literature tocalculate catastrophic health expenditure. Health ex-penditure is considered as catastrophic either - a) If ahousehold’s financial contributions to the health systemexceeds 40% of income remaining after subsistenceneeds have been met [18–20], in other words, defined asout of pocket payment for health care ≥40% capacity topay or b) If a household’s financial contributions to thehealth system equals or exceeds 10% of total householdexpenditure [21–23]. There is also a gamut of studiesthat have taken varying levels of thresholds exhibitingsensitivity of different measures [24–26]. In this study,we computed the incidence of catastrophic expenditureusing the 10% threshold of total expenditure and con-ducted the sensitivity analysis for varying thresholds at5, 10, 25 and 40%.The Incidence of catastrophic health expenditure
was defined as the headcount ratio of the percentageof households whose OOP health payments exceedabove-defined threshold in a given time period. TheIncidence of catastrophic expenditure estimated byheadcount however, doesn’t divulge information onhow far (Intensity) the households spent beyond thethreshold. This measure was estimated by Overshootthat computed the degree by which an averageOOPE crossed the given threshold. Concomitantly,Mean positive overshoot measuring the degree bywhich the average OOPE by the households that haveexperienced the catastrophe exceeded the giventhreshold was assessed. In order to gauge the distri-bution of catastrophic health expenditure and Over-shoot across income quintiles, Concentration Indiceswere computed.
Verma et al. BMC Public Health (2021) 21:881 Page 3 of 22
The Impoverishing impact of healthcare spendingdelves into measurement of the extent of poverty due toOOP health spending incurred by the households. Weused the methodology developed by Wagstaff and vanDoorslaer [27] to estimate the impoverishing effect ofOOPE. A measure of Poverty Headcount i.e. proportionof households that fell below poverty line was evaluated;a household was considered to be impoverished by OOPwhen its total per capita consumption spending fellbelow the poverty line defined by Planning Commissionof India (Rangarajan Poverty Line). The measure wasderived by calculating a) Pre-payment headcount and b)Post-payment headcount. Pre-payment headcount mea-sured the percentage of individuals whose expenditureper adult equivalent was less than estimated poverty linefor 2014 before spending for OOP health payments overentire reference population, while, Post- payment headcount measured the percentage of individuals whoseconsumption per adult equivalent was less than esti-mated poverty line for 2014 after accounting for OOPhealth payments over the entire population. Hence, thedifference in the headcounts before and after discount-ing OOP exhibited the impoverishment.Although, Poverty Headcount captures the Incidence of
Catastrophic expenditure, it precludes the evidence onthe depth of poverty (Intensity), i.e. amount by whichpoor households fell short of reaching poverty line isn’tcaptured by this measure. Measure of Poverty gap how-ever, encapsulates this information and was estimated toelucidate the amount by which out-of-pocket spendingpushes the household below poverty line. The severity ofthe poverty was normalized by weighting the sum of thepoverty gaps (as a proportion of poverty line) to uncoverthe Normalized poverty gap. However, in case of alreadypoor household, the change in poverty gap is equal tothe full amount of household’s health expenditure whichwas measured by Mean Normalized poverty gap reflect-ing the average depth of poverty among already poordue to OOPE.In order to unravel the determinants driving the cata-
strophic expenditure; a gamut of household and healthsystem’s level covariates were incorporated in the studyguided by Andersen’s behavioral health model [28]. Thechoice of measures stemmed from previous literature,data availability from household survey and existence ofroutine availability of indicators through either routinemanagement information systems or routine health sur-veys for scalability and generalizability. These measuresare further classified and surmised as: a) Predisposingcomponents incorporated into broad spectrum of factorsencompassing i) Demographic characteristics such asage and gender of household head, age and gender mixof the household and household size and ii) Social-Structural characteristics such as educational status of
household head, principal occupation of household andsocial group affiliation of the household. b) Enablingcharacteristics such as monthly per capita consumptionexpenditure quintiles, living condition index (Index ob-tained from composite score via principal componentanalysis upon amalgamation of indicators such as sourceof drinking water, access to latrine, waste disposal mech-anism and primary source of energy for cooking), cover-age of household by some pre-payment /insurancemechanism, source of financing for treatment of non-communicable diseases and choice of provider for treat-ment c) Need based characteristics such as NCD relatedhospitalization in the household, proportion of ailingmembers in household requiring NCD related care inthe reference period and inter-state hospitalization andd) Contextual factors such as epidemiological transitionlevel of state and spatial location of the household(rural/urban). Monthly per capita consumption expend-iture was adjusted for household size and compositionusing the Oxford equivalence scale which was subse-quently used as a proxy for economic status. TheOxford scale assigns the first adult in a household aweight of 1, each additional adult weight of 0.7, andeach child (a person aged under 14) a weight of 0.5.The sum of these weights gives the number of adultequivalents in the household [29].Data on both inpatient and ambulatory care was used
in the analysis; since recall period for inpatient and am-bulatory care expenditure is varied, it was converted anduniformed to the same recall period of one month inorder to compute the OOPE and catastrophic expend-iture. Accommodating for variability across two time pe-riods, we adjusted the 2017–18 prices for inflation usingConsumer Price Index time series data obtained fromHandbook of Statistics on Indian Economy [30]. The listof NCDs in the survey data was mapped and extricatedvia ICD-10 classification.
Statistical analysisEstimates of incidence and intensity of catastrophicexpendituresThe formula for share of out-of-pocket health expend-iture is elucidated as follows:-
Si ¼ HEi
TEið1Þ
Where, HEi denotes i household’s out-of-pocket ex-penditure on healthcare consumption and TEi denotesthe household’s total consumption expenditure. From(1), consider Si to be the share of healthcare expenditurefor household i and Z as the threshold beyond whichhousehold i incurs catastrophic expenditure if, Si > Z.The headcount is then, represented as:
Verma et al. BMC Public Health (2021) 21:881 Page 4 of 22
HC ¼ 1N
XN
i¼1
Di ð2Þ
Where, N is the sample size and Di is an indicatorequal to 1 if Si > Z and 0 otherwise.Average overshoot measuring the degree by which
average OOP expenditure exceeds the given threshold Zis depicted as:
O ¼ 1N
XN
i¼1
Oi ð3Þ
Where, Oi is the amount by which household i shareof health expenditure in total expenditure exceeds thethreshold limit and is represented as:
Oi ¼ Di Si−Zð Þ ð4ÞHC capturing the incidence of CHE occurring and O
computing the intensity of CHE occurring are relatedthrough mean positive overshoot, which is defined asfollows:
MPO ¼ OHC
ð5Þ
Thereby, implying O =HC ×MPO, that can be inter-preted as the catastrophic overshoot equals the fractionwith catastrophic payments times the mean positiveovershoot- the incidence times the intensity.Further, inequality in incidence and intensity of cata-
strophic payments is computed by concentration indexand is represented as:
Concentration Index ¼ 2μCov h; rð Þ ð6Þ
Where, μ is the headcount ratio or overshoot andCov(h, r) is the covariance of HC or O with relative rankof household based on total consumption expenditure. Anindex value of zero suggests absence of income/expend-iture related inequalities, a positive value denotes concen-tration of the measure amongst the rich, whereas, negativevalue is indicative of concentration amongst the poor.
Estimates of poverty headcount and poverty gapThe equations below illustrate a parsimonious represen-tation for examining the OOP payments on two basicmeasures of poverty- i) Headcount and ii) Poverty Gap.The pre-payment Poverty Headcount Ratio is repre-
sented as:
Hpre ¼ 1N
XN
i¼1
Hprei ¼ σppre ð7Þ
Where, ðHprei Þ =1 if Monthly per capita expenditure
(TEi) < Poverty Line l and 0 otherwise, N is the number
of households in the sample and σppre is the proportionof population that is poor.The average pre-payment Poverty Gap Index capturing
amount necessary to raise an individual who is belowpoverty line up to that line is depicted as:
PGpre ¼ 1N
XN
i¼1
pgprei ¼ σgpre ð8Þ
Where, pgprei is the pre-payment poverty gap which isequal to (l − TEi) if (TEi) < Poverty Line l and 0otherwise.Normalized Poverty Gap which is the weighted sum of
poverty gaps (as proportion of poverty line), gives moreweight to observations that fall well below poverty line iscomputed as:
NPGpre ¼ PGpre
lð9Þ
Further, normalized mean positive gap subsuming aver-age depth of poverty amongst the poor is estimated as:
MNPGpre ¼PN
i¼1pgpreiPN
i¼1Hprei
¼ σgpre
σppreð10Þ
which implies, σgpre= σppre× MNPGpre.
Poverty indices for post-payment expenditure are ob-tained by subtracting household health expenditure oninpatient and outpatient care HEi from pre- payment ex-penditure (TEi− HEi). The impoverishment impact ofOOPE is then, estimated by deducting pre-payment indi-ces from post- payment indices which are surmisedbelow:-
Headcount : PHC ¼ Hpost−Hpre ð11ÞPoverty Gap : PG ¼ PGpost−PGpre ð12ÞNormalized Poverty Gap : PNPG
¼ NPGpost−NPGpre ð13Þ
Mean Normalized Poverty Gap : PMNPG
¼ MNPGpost−MNPGpre ð14Þ
Determinants of catastrophic health expenditureDeterminants of Catastrophic Health Expenditure weredetermined by multivariate logistic regression model:
Si ¼ lny
1−y
� �¼ β0 þ β1X1 þ β2X2 þ………
þ βnXn ð15ÞWhere, dependent variable following the definition of
Catastrophic Health Expenditure is dichotomous i.e. Si
Verma et al. BMC Public Health (2021) 21:881 Page 5 of 22
takes the value of 1, if a household’s healthcare expend-iture (HEi) exceeds the 10% threshold of total householdexpenditure (TEi) and 0 otherwise and X1…. . Xn are thelegion of covariates subsuming socio-economic anddemographic characteristics of the households.Statistical analysis of data was conducted with STATA
13 statistical software package and weighted estimateswere considered accounting for complex multistagesampling design of survey rounds. Further, the mapsdepicting inter-state heterogeneities in incidence of cata-strophic payments and Impoverishment impact weregenerated using ArcGIS (ArcMap 10.7).
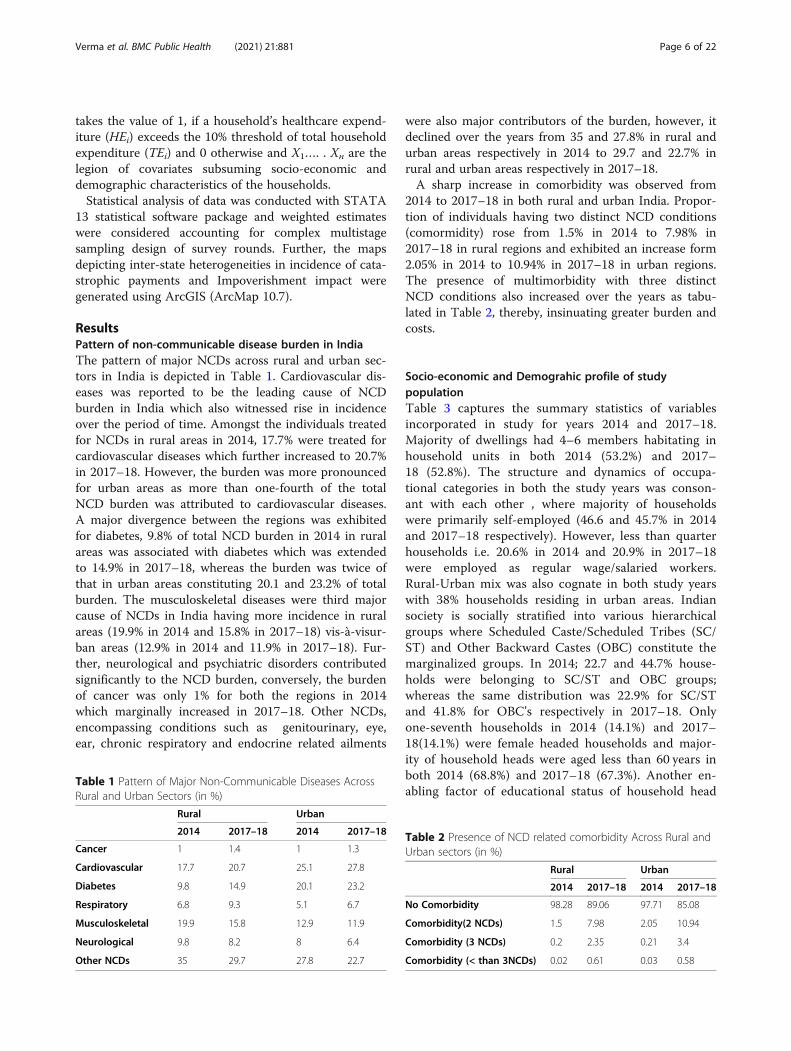
ResultsPattern of non-communicable disease burden in IndiaThe pattern of major NCDs across rural and urban sec-tors in India is depicted in Table 1. Cardiovascular dis-eases was reported to be the leading cause of NCDburden in India which also witnessed rise in incidenceover the period of time. Amongst the individuals treatedfor NCDs in rural areas in 2014, 17.7% were treated forcardiovascular diseases which further increased to 20.7%in 2017–18. However, the burden was more pronouncedfor urban areas as more than one-fourth of the totalNCD burden was attributed to cardiovascular diseases.A major divergence between the regions was exhibitedfor diabetes, 9.8% of total NCD burden in 2014 in ruralareas was associated with diabetes which was extendedto 14.9% in 2017–18, whereas the burden was twice ofthat in urban areas constituting 20.1 and 23.2% of totalburden. The musculoskeletal diseases were third majorcause of NCDs in India having more incidence in ruralareas (19.9% in 2014 and 15.8% in 2017–18) vis-à-visur-ban areas (12.9% in 2014 and 11.9% in 2017–18). Fur-ther, neurological and psychiatric disorders contributedsignificantly to the NCD burden, conversely, the burdenof cancer was only 1% for both the regions in 2014which marginally increased in 2017–18. Other NCDs,encompassing conditions such as genitourinary, eye,ear, chronic respiratory and endocrine related ailments
were also major contributors of the burden, however, itdeclined over the years from 35 and 27.8% in rural andurban areas respectively in 2014 to 29.7 and 22.7% inrural and urban areas respectively in 2017–18.A sharp increase in comorbidity was observed from
2014 to 2017–18 in both rural and urban India. Propor-tion of individuals having two distinct NCD conditions(comormidity) rose from 1.5% in 2014 to 7.98% in2017–18 in rural regions and exhibited an increase form2.05% in 2014 to 10.94% in 2017–18 in urban regions.The presence of multimorbidity with three distinctNCD conditions also increased over the years as tabu-lated in Table 2, thereby, insinuating greater burden andcosts.
Socio-economic and Demograhic profile of studypopulationTable 3 captures the summary statistics of variablesincorporated in study for years 2014 and 2017–18.Majority of dwellings had 4–6 members habitating inhousehold units in both 2014 (53.2%) and 2017–18 (52.8%). The structure and dynamics of occupa-tional categories in both the study years was conson-ant with each other , where majority of householdswere primarily self-employed (46.6 and 45.7% in 2014and 2017–18 respectively). However, less than quarterhouseholds i.e. 20.6% in 2014 and 20.9% in 2017–18were employed as regular wage/salaried workers.Rural-Urban mix was also cognate in both study yearswith 38% households residing in urban areas. Indiansociety is socially stratified into various hierarchicalgroups where Scheduled Caste/Scheduled Tribes (SC/ST) and Other Backward Castes (OBC) constitute themarginalized groups. In 2014; 22.7 and 44.7% house-holds were belonging to SC/ST and OBC groups;whereas the same distribution was 22.9% for SC/STand 41.8% for OBC’s respectively in 2017–18. Onlyone-seventh households in 2014 (14.1%) and 2017–18(14.1%) were female headed households and major-ity of household heads were aged less than 60 years inboth 2014 (68.8%) and 2017–18 (67.3%). Another en-abling factor of educational status of household head
Table 1 Pattern of Major Non-Communicable Diseases AcrossRural and Urban Sectors (in %)
Rural Urban
2014 2017–18 2014 2017–18
Cancer 1 1.4 1 1.3
Cardiovascular 17.7 20.7 25.1 27.8
Diabetes 9.8 14.9 20.1 23.2
Respiratory 6.8 9.3 5.1 6.7
Musculoskeletal 19.9 15.8 12.9 11.9
Neurological 9.8 8.2 8 6.4
Other NCDs 35 29.7 27.8 22.7
Table 2 Presence of NCD related comorbidity Across Rural andUrban sectors (in %)
Rural Urban
2014 2017–18 2014 2017–18
No Comorbidity 98.28 89.06 97.71 85.08
Comorbidity(2 NCDs) 1.5 7.98 2.05 10.94
Comorbidity (3 NCDs) 0.2 2.35 0.21 3.4
Comorbidity (< than 3NCDs) 0.02 0.61 0.03 0.58
Verma et al. BMC Public Health (2021) 21:881 Page 6 of 22
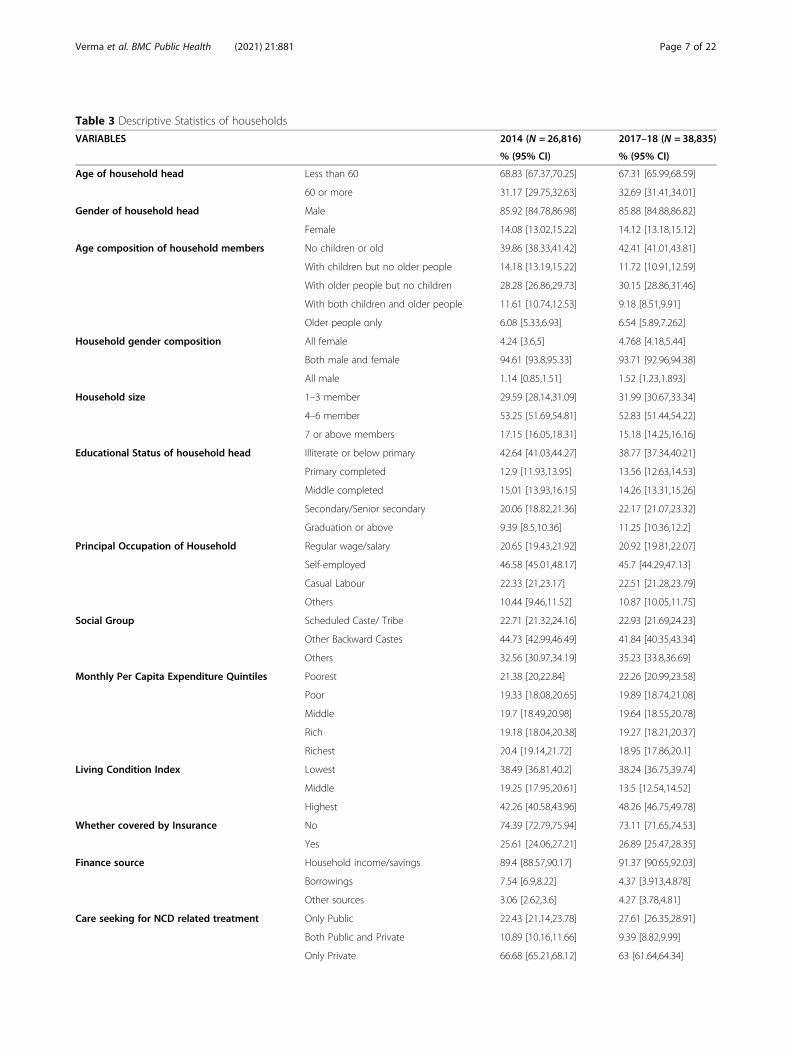
Table 3 Descriptive Statistics of households
VARIABLES 2014 (N = 26,816) 2017–18 (N = 38,835)
% (95% CI) % (95% CI)
Age of household head Less than 60 68.83 [67.37,70.25] 67.31 [65.99,68.59]
60 or more 31.17 [29.75,32.63] 32.69 [31.41,34.01]
Gender of household head Male 85.92 [84.78,86.98] 85.88 [84.88,86.82]
Female 14.08 [13.02,15.22] 14.12 [13.18,15.12]
Age composition of household members No children or old 39.86 [38.33,41.42] 42.41 [41.01,43.81]
With children but no older people 14.18 [13.19,15.22] 11.72 [10.91,12.59]
With older people but no children 28.28 [26.86,29.73] 30.15 [28.86,31.46]
With both children and older people 11.61 [10.74,12.53] 9.18 [8.51,9.91]
Older people only 6.08 [5.33,6.93] 6.54 [5.89,7.262]
Household gender composition All female 4.24 [3.6,5] 4.768 [4.18,5.44]
Both male and female 94.61 [93.8,95.33] 93.71 [92.96,94.38]
All male 1.14 [0.85,1.51] 1.52 [1.23,1.893]
Household size 1–3 member 29.59 [28.14,31.09] 31.99 [30.67,33.34]
4–6 member 53.25 [51.69,54.81] 52.83 [51.44,54.22]
7 or above members 17.15 [16.05,18.31] 15.18 [14.25,16.16]
Educational Status of household head Illiterate or below primary 42.64 [41.03,44.27] 38.77 [37.34,40.21]
Primary completed 12.9 [11.93,13.95] 13.56 [12.63,14.53]
Middle completed 15.01 [13.93,16.15] 14.26 [13.31,15.26]
Secondary/Senior secondary 20.06 [18.82,21.36] 22.17 [21.07,23.32]
Graduation or above 9.39 [8.5,10.36] 11.25 [10.36,12.2]
Principal Occupation of Household Regular wage/salary 20.65 [19.43,21.92] 20.92 [19.81,22.07]
Self-employed 46.58 [45.01,48.17] 45.7 [44.29,47.13]
Casual Labour 22.33 [21,23.17] 22.51 [21.28,23.79]
Others 10.44 [9.46,11.52] 10.87 [10.05,11.75]
Social Group Scheduled Caste/ Tribe 22.71 [21.32,24.16] 22.93 [21.69,24.23]
Other Backward Castes 44.73 [42.99,46.49] 41.84 [40.35,43.34]
Others 32.56 [30.97,34.19] 35.23 [33.8,36.69]
Monthly Per Capita Expenditure Quintiles Poorest 21.38 [20,22.84] 22.26 [20.99,23.58]
Poor 19.33 [18.08,20.65] 19.89 [18.74,21.08]
Middle 19.7 [18.49,20.98] 19.64 [18.55,20.78]
Rich 19.18 [18.04,20.38] 19.27 [18.21,20.37]
Richest 20.4 [19.14,21.72] 18.95 [17.86,20.1]
Living Condition Index Lowest 38.49 [36.81,40.2] 38.24 [36.75,39.74]
Middle 19.25 [17.95,20.61] 13.5 [12.54,14.52]
Highest 42.26 [40.58,43.96] 48.26 [46.75,49.78]
Whether covered by Insurance No 74.39 [72.79,75.94] 73.11 [71.65,74.53]
Yes 25.61 [24.06,27.21] 26.89 [25.47,28.35]
Finance source Household income/savings 89.4 [88.57,90.17] 91.37 [90.65,92.03]
Borrowings 7.54 [6.9,8.22] 4.37 [3.913,4.878]
Other sources 3.06 [2.62,3.6] 4.27 [3.78,4.81]
Care seeking for NCD related treatment Only Public 22.43 [21.14,23.78] 27.61 [26.35,28.91]
Both Public and Private 10.89 [10.16,11.66] 9.39 [8.82,9.99]
Only Private 66.68 [65.21,68.12] 63 [61.64,64.34]
Verma et al. BMC Public Health (2021) 21:881 Page 7 of 22
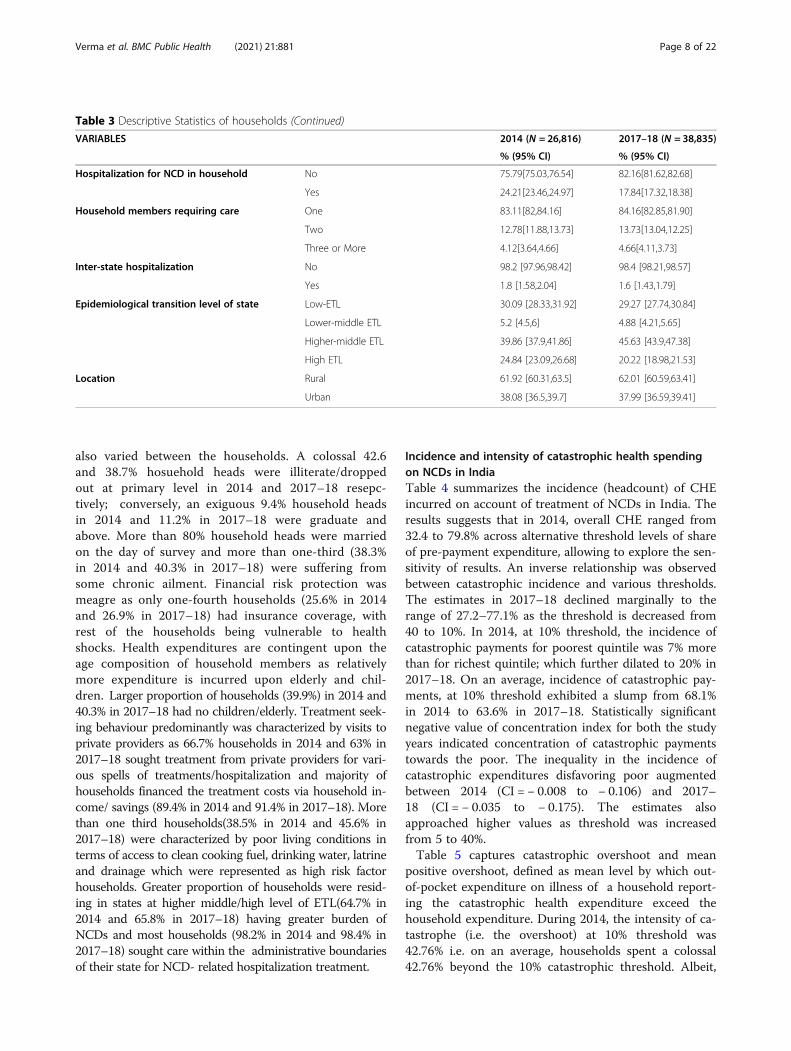
also varied between the households. A colossal 42.6and 38.7% hosuehold heads were illiterate/droppedout at primary level in 2014 and 2017–18 resepc-tively; conversely, an exiguous 9.4% household headsin 2014 and 11.2% in 2017–18 were graduate andabove. More than 80% household heads were marriedon the day of survey and more than one-third (38.3%in 2014 and 40.3% in 2017–18) were suffering fromsome chronic ailment. Financial risk protection wasmeagre as only one-fourth households (25.6% in 2014and 26.9% in 2017–18) had insurance coverage, withrest of the households being vulnerable to healthshocks. Health expenditures are contingent upon theage composition of household members as relativelymore expenditure is incurred upon elderly and chil-dren. Larger proportion of households (39.9%) in 2014 and40.3% in 2017–18 had no children/elderly. Treatment seek-ing behaviour predominantly was characterized by visits toprivate providers as 66.7% households in 2014 and 63% in2017–18 sought treatment from private providers for vari-ous spells of treatments/hospitalization and majority ofhouseholds financed the treatment costs via household in-come/ savings (89.4% in 2014 and 91.4% in 2017–18). Morethan one third households(38.5% in 2014 and 45.6% in2017–18) were characterized by poor living conditions interms of access to clean cooking fuel, drinking water, latrineand drainage which were represented as high risk factorhouseholds. Greater proportion of households were resid-ing in states at higher middle/high level of ETL(64.7% in2014 and 65.8% in 2017–18) having greater burden ofNCDs and most households (98.2% in 2014 and 98.4% in2017–18) sought care within the administrative boundariesof their state for NCD- related hospitalization treatment.
Incidence and intensity of catastrophic health spendingon NCDs in IndiaTable 4 summarizes the incidence (headcount) of CHEincurred on account of treatment of NCDs in India. Theresults suggests that in 2014, overall CHE ranged from32.4 to 79.8% across alternative threshold levels of shareof pre-payment expenditure, allowing to explore the sen-sitivity of results. An inverse relationship was observedbetween catastrophic incidence and various thresholds.The estimates in 2017–18 declined marginally to therange of 27.2–77.1% as the threshold is decreased from40 to 10%. In 2014, at 10% threshold, the incidence ofcatastrophic payments for poorest quintile was 7% morethan for richest quintile; which further dilated to 20% in2017–18. On an average, incidence of catastrophic pay-ments, at 10% threshold exhibited a slump from 68.1%in 2014 to 63.6% in 2017–18. Statistically significantnegative value of concentration index for both the studyyears indicated concentration of catastrophic paymentstowards the poor. The inequality in the incidence ofcatastrophic expenditures disfavoring poor augmentedbetween 2014 (CI = − 0.008 to − 0.106) and 2017–18 (CI = − 0.035 to − 0.175). The estimates alsoapproached higher values as threshold was increasedfrom 5 to 40%.Table 5 captures catastrophic overshoot and mean
positive overshoot, defined as mean level by which out-of-pocket expenditure on illness of a household report-ing the catastrophic health expenditure exceed thehousehold expenditure. During 2014, the intensity of ca-tastrophe (i.e. the overshoot) at 10% threshold was42.76% i.e. on an average, households spent a colossal42.76% beyond the 10% catastrophic threshold. Albeit,
Table 3 Descriptive Statistics of households (Continued)
VARIABLES 2014 (N = 26,816) 2017–18 (N = 38,835)
% (95% CI) % (95% CI)
Hospitalization for NCD in household No 75.79[75.03,76.54] 82.16[81.62,82.68]
Yes 24.21[23.46,24.97] 17.84[17.32,18.38]
Household members requiring care One 83.11[82,84.16] 84.16[82.85,81.90]
Two 12.78[11.88,13.73] 13.73[13.04,12.25]
Three or More 4.12[3.64,4.66] 4.66[4.11,3.73]
Inter-state hospitalization No 98.2 [97.96,98.42] 98.4 [98.21,98.57]
Yes 1.8 [1.58,2.04] 1.6 [1.43,1.79]
Epidemiological transition level of state Low-ETL 30.09 [28.33,31.92] 29.27 [27.74,30.84]
Lower-middle ETL 5.2 [4.5,6] 4.88 [4.21,5.65]
Higher-middle ETL 39.86 [37.9,41.86] 45.63 [43.9,47.38]
High ETL 24.84 [23.09,26.68] 20.22 [18.98,21.53]
Location Rural 61.92 [60.31,63.5] 62.01 [60.59,63.41]
Urban 38.08 [36.5,39.7] 37.99 [36.59,39.41]
Verma et al. BMC Public Health (2021) 21:881 Page 8 of 22
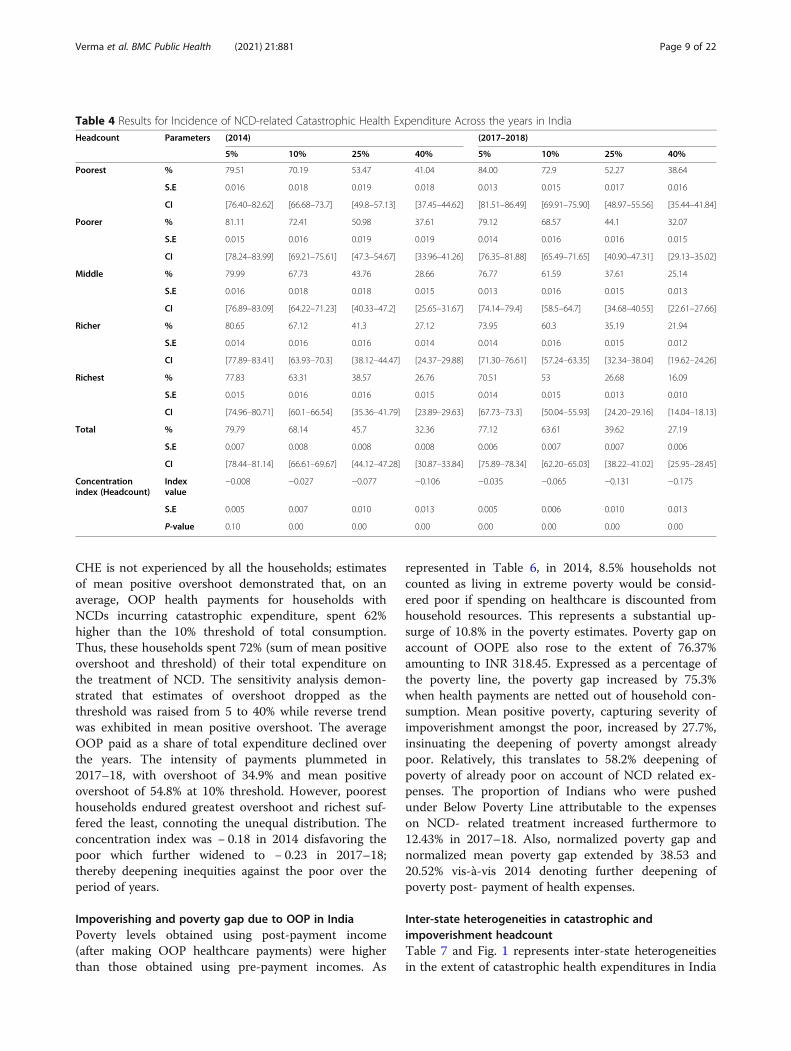
CHE is not experienced by all the households; estimatesof mean positive overshoot demonstrated that, on anaverage, OOP health payments for households withNCDs incurring catastrophic expenditure, spent 62%higher than the 10% threshold of total consumption.Thus, these households spent 72% (sum of mean positiveovershoot and threshold) of their total expenditure onthe treatment of NCD. The sensitivity analysis demon-strated that estimates of overshoot dropped as thethreshold was raised from 5 to 40% while reverse trendwas exhibited in mean positive overshoot. The averageOOP paid as a share of total expenditure declined overthe years. The intensity of payments plummeted in2017–18, with overshoot of 34.9% and mean positiveovershoot of 54.8% at 10% threshold. However, pooresthouseholds endured greatest overshoot and richest suf-fered the least, connoting the unequal distribution. Theconcentration index was − 0.18 in 2014 disfavoring thepoor which further widened to − 0.23 in 2017–18;thereby deepening inequities against the poor over theperiod of years.
Impoverishing and poverty gap due to OOP in IndiaPoverty levels obtained using post-payment income(after making OOP healthcare payments) were higherthan those obtained using pre-payment incomes. As
represented in Table 6, in 2014, 8.5% households notcounted as living in extreme poverty would be consid-ered poor if spending on healthcare is discounted fromhousehold resources. This represents a substantial up-surge of 10.8% in the poverty estimates. Poverty gap onaccount of OOPE also rose to the extent of 76.37%amounting to INR 318.45. Expressed as a percentage ofthe poverty line, the poverty gap increased by 75.3%when health payments are netted out of household con-sumption. Mean positive poverty, capturing severity ofimpoverishment amongst the poor, increased by 27.7%,insinuating the deepening of poverty amongst alreadypoor. Relatively, this translates to 58.2% deepening ofpoverty of already poor on account of NCD related ex-penses. The proportion of Indians who were pushedunder Below Poverty Line attributable to the expenseson NCD- related treatment increased furthermore to12.43% in 2017–18. Also, normalized poverty gap andnormalized mean poverty gap extended by 38.53 and20.52% vis-à-vis 2014 denoting further deepening ofpoverty post- payment of health expenses.
Inter-state heterogeneities in catastrophic andimpoverishment headcountTable 7 and Fig. 1 represents inter-state heterogeneitiesin the extent of catastrophic health expenditures in India
Table 4 Results for Incidence of NCD-related Catastrophic Health Expenditure Across the years in IndiaHeadcount Parameters (2014) (2017–2018)
5% 10% 25% 40% 5% 10% 25% 40%
Poorest % 79.51 70.19 53.47 41.04 84.00 72.9 52.27 38.64
S.E 0.016 0.018 0.019 0.018 0.013 0.015 0.017 0.016
CI [76.40–82.62] [66.68–73.7] [49.8–57.13] [37.45–44.62] [81.51–86.49] [69.91–75.90] [48.97–55.56] [35.44–41.84]
Poorer % 81.11 72.41 50.98 37.61 79.12 68.57 44.1 32.07
S.E 0.015 0.016 0.019 0.019 0.014 0.016 0.016 0.015
CI [78.24–83.99] [69.21–75.61] [47.3–54.67] [33.96–41.26] [76.35–81.88] [65.49–71.65] [40.90–47.31] [29.13–35.02]
Middle % 79.99 67.73 43.76 28.66 76.77 61.59 37.61 25.14
S.E 0.016 0.018 0.018 0.015 0.013 0.016 0.015 0.013
CI [76.89–83.09] [64.22–71.23] [40.33–47.2] [25.65–31.67] [74.14–79.4] [58.5–64.7] [34.68–40.55] [22.61–27.66]
Richer % 80.65 67.12 41.3 27.12 73.95 60.3 35.19 21.94
S.E 0.014 0.016 0.016 0.014 0.014 0.016 0.015 0.012
CI [77.89–83.41] [63.93–70.3] [38.12–44.47] [24.37–29.88] [71.30–76.61] [57.24–63.35] [32.34–38.04] [19.62–24.26]
Richest % 77.83 63.31 38.57 26.76 70.51 53 26.68 16.09
S.E 0.015 0.016 0.016 0.015 0.014 0.015 0.013 0.010
CI [74.96–80.71] [60.1–66.54] [35.36–41.79] [23.89–29.63] [67.73–73.3] [50.04–55.93] [24.20–29.16] [14.04–18.13]
Total % 79.79 68.14 45.7 32.36 77.12 63.61 39.62 27.19
S.E 0.007 0.008 0.008 0.008 0.006 0.007 0.007 0.006
CI [78.44–81.14] [66.61–69.67] [44.12–47.28] [30.87–33.84] [75.89–78.34] [62.20–65.03] [38.22–41.02] [25.95–28.45]
Concentrationindex (Headcount)
Indexvalue
−0.008 −0.027 −0.077 −0.106 −0.035 −0.065 −0.131 −0.175
S.E 0.005 0.007 0.010 0.013 0.005 0.006 0.010 0.013
P-value 0.10 0.00 0.00 0.00 0.00 0.00 0.00 0.00
Verma et al. BMC Public Health (2021) 21:881 Page 9 of 22
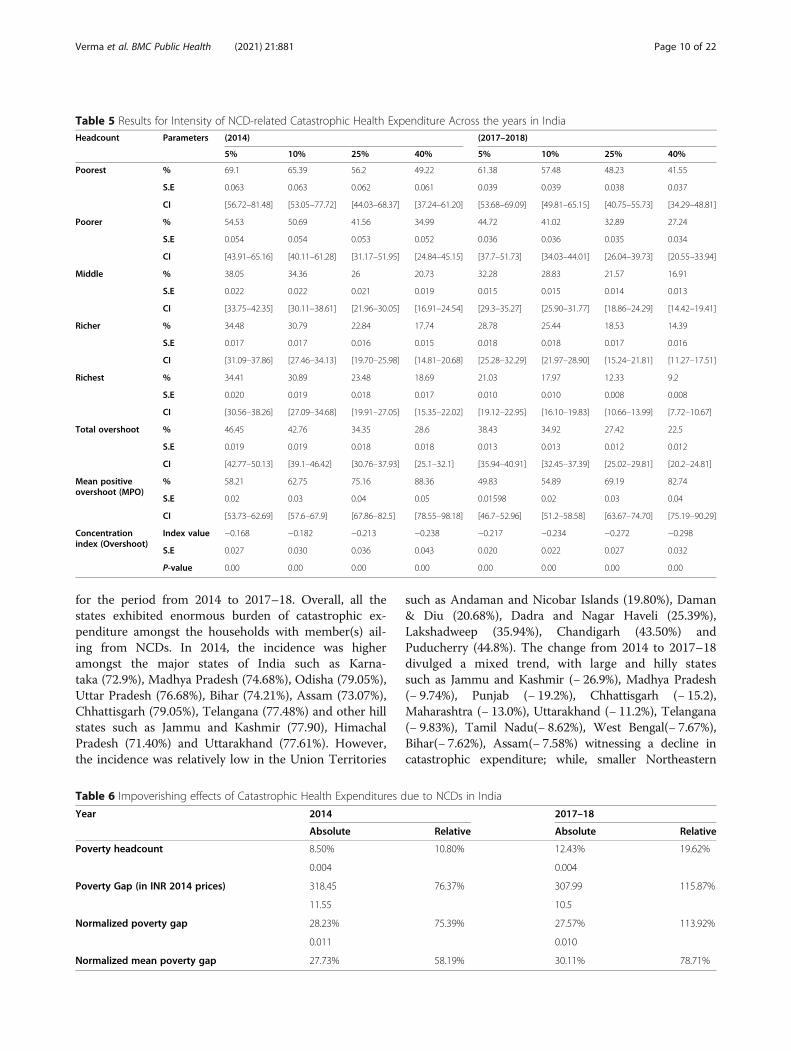
for the period from 2014 to 2017–18. Overall, all thestates exhibited enormous burden of catastrophic ex-penditure amongst the households with member(s) ail-ing from NCDs. In 2014, the incidence was higheramongst the major states of India such as Karna-taka (72.9%), Madhya Pradesh (74.68%), Odisha (79.05%),Uttar Pradesh (76.68%), Bihar (74.21%), Assam (73.07%),Chhattisgarh (79.05%), Telangana (77.48%) and other hillstates such as Jammu and Kashmir (77.90), HimachalPradesh (71.40%) and Uttarakhand (77.61%). However,the incidence was relatively low in the Union Territories
such as Andaman and Nicobar Islands (19.80%), Daman& Diu (20.68%), Dadra and Nagar Haveli (25.39%),Lakshadweep (35.94%), Chandigarh (43.50%) andPuducherry (44.8%). The change from 2014 to 2017–18divulged a mixed trend, with large and hilly statessuch as Jammu and Kashmir (− 26.9%), Madhya Pradesh(− 9.74%), Punjab (− 19.2%), Chhattisgarh (− 15.2),Maharashtra (− 13.0%), Uttarakhand (− 11.2%), Telangana(− 9.83%), Tamil Nadu(− 8.62%), West Bengal(− 7.67%),Bihar(− 7.62%), Assam(− 7.58%) witnessing a decline incatastrophic expenditure; while, smaller Northeastern
Table 5 Results for Intensity of NCD-related Catastrophic Health Expenditure Across the years in IndiaHeadcount Parameters (2014) (2017–2018)
5% 10% 25% 40% 5% 10% 25% 40%
Poorest % 69.1 65.39 56.2 49.22 61.38 57.48 48.23 41.55
S.E 0.063 0.063 0.062 0.061 0.039 0.039 0.038 0.037
CI [56.72–81.48] [53.05–77.72] [44.03–68.37] [37.24–61.20] [53.68–69.09] [49.81–65.15] [40.75–55.73] [34.29–48.81]
Poorer % 54.53 50.69 41.56 34.99 44.72 41.02 32.89 27.24
S.E 0.054 0.054 0.053 0.052 0.036 0.036 0.035 0.034
CI [43.91–65.16] [40.11–61.28] [31.17–51.95] [24.84–45.15] [37.7–51.73] [34.03–44.01] [26.04–39.73] [20.55–33.94]
Middle % 38.05 34.36 26 20.73 32.28 28.83 21.57 16.91
S.E 0.022 0.022 0.021 0.019 0.015 0.015 0.014 0.013
CI [33.75–42.35] [30.11–38.61] [21.96–30.05] [16.91–24.54] [29.3–35.27] [25.90–31.77] [18.86–24.29] [14.42–19.41]
Richer % 34.48 30.79 22.84 17.74 28.78 25.44 18.53 14.39
S.E 0.017 0.017 0.016 0.015 0.018 0.018 0.017 0.016
CI [31.09–37.86] [27.46–34.13] [19.70–25.98] [14.81–20.68] [25.28–32.29] [21.97–28.90] [15.24–21.81] [11.27–17.51]
Richest % 34.41 30.89 23.48 18.69 21.03 17.97 12.33 9.2
S.E 0.020 0.019 0.018 0.017 0.010 0.010 0.008 0.008
CI [30.56–38.26] [27.09–34.68] [19.91–27.05] [15.35–22.02] [19.12–22.95] [16.10–19.83] [10.66–13.99] [7.72–10.67]
Total overshoot % 46.45 42.76 34.35 28.6 38.43 34.92 27.42 22.5
S.E 0.019 0.019 0.018 0.018 0.013 0.013 0.012 0.012
CI [42.77–50.13] [39.1–46.42] [30.76–37.93] [25.1–32.1] [35.94–40.91] [32.45–37.39] [25.02–29.81] [20.2–24.81]
Mean positiveovershoot (MPO)
% 58.21 62.75 75.16 88.36 49.83 54.89 69.19 82.74
S.E 0.02 0.03 0.04 0.05 0.01598 0.02 0.03 0.04
CI [53.73–62.69] [57.6–67.9] [67.86–82.5] [78.55–98.18] [46.7–52.96] [51.2–58.58] [63.67–74.70] [75.19–90.29]
Concentrationindex (Overshoot)
Index value −0.168 −0.182 −0.213 −0.238 −0.217 −0.234 −0.272 −0.298
S.E 0.027 0.030 0.036 0.043 0.020 0.022 0.027 0.032
P-value 0.00 0.00 0.00 0.00 0.00 0.00 0.00 0.00
Table 6 Impoverishing effects of Catastrophic Health Expenditures due to NCDs in India
Year 2014 2017–18
Absolute Relative Absolute Relative
Poverty headcount 8.50% 10.80% 12.43% 19.62%
0.004 0.004
Poverty Gap (in INR 2014 prices) 318.45 76.37% 307.99 115.87%
11.55 10.5
Normalized poverty gap 28.23% 75.39% 27.57% 113.92%
0.011 0.010
Normalized mean poverty gap 27.73% 58.19% 30.11% 78.71%
Verma et al. BMC Public Health (2021) 21:881 Page 10 of 22
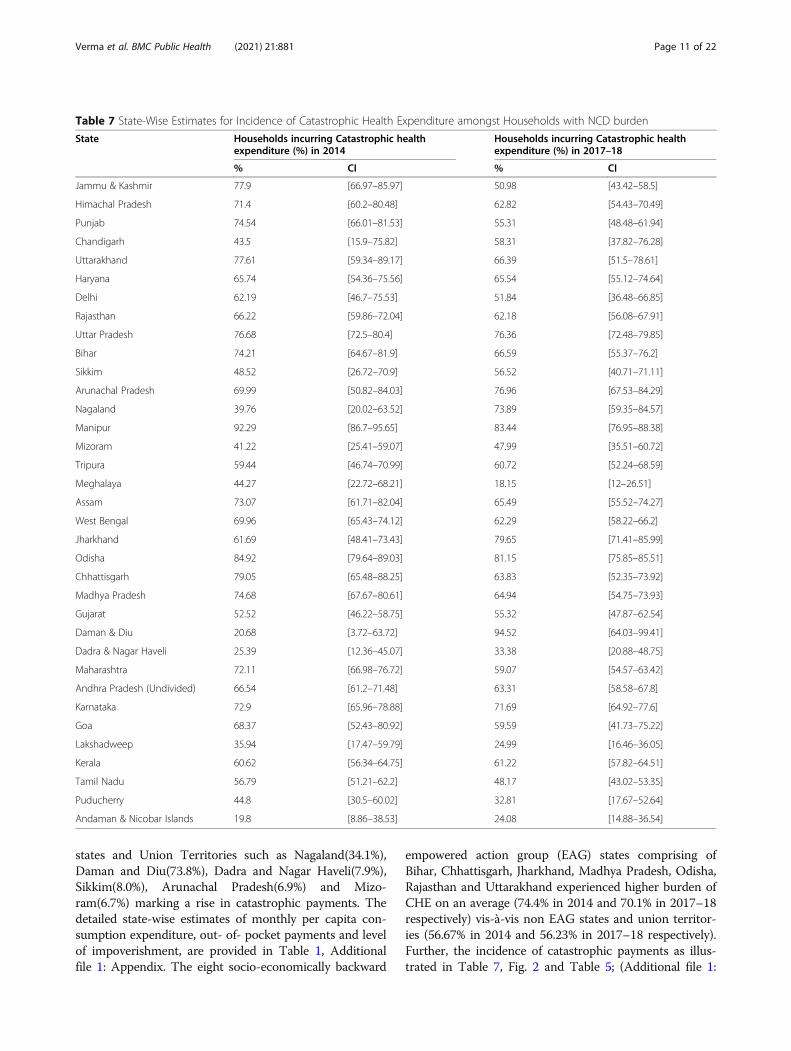
states and Union Territories such as Nagaland(34.1%),Daman and Diu(73.8%), Dadra and Nagar Haveli(7.9%),Sikkim(8.0%), Arunachal Pradesh(6.9%) and Mizo-ram(6.7%) marking a rise in catastrophic payments. Thedetailed state-wise estimates of monthly per capita con-sumption expenditure, out- of- pocket payments and levelof impoverishment, are provided in Table 1, Additionalfile 1: Appendix. The eight socio-economically backward
empowered action group (EAG) states comprising ofBihar, Chhattisgarh, Jharkhand, Madhya Pradesh, Odisha,Rajasthan and Uttarakhand experienced higher burden ofCHE on an average (74.4% in 2014 and 70.1% in 2017–18respectively) vis-à-vis non EAG states and union territor-ies (56.67% in 2014 and 56.23% in 2017–18 respectively).Further, the incidence of catastrophic payments as illus-trated in Table 7, Fig. 2 and Table 5; (Additional file 1:
Table 7 State-Wise Estimates for Incidence of Catastrophic Health Expenditure amongst Households with NCD burden
State Households incurring Catastrophic healthexpenditure (%) in 2014
Households incurring Catastrophic healthexpenditure (%) in 2017–18
% CI % CI
Jammu & Kashmir 77.9 [66.97–85.97] 50.98 [43.42–58.5]
Himachal Pradesh 71.4 [60.2–80.48] 62.82 [54.43–70.49]
Punjab 74.54 [66.01–81.53] 55.31 [48.48–61.94]
Chandigarh 43.5 [15.9–75.82] 58.31 [37.82–76.28]
Uttarakhand 77.61 [59.34–89.17] 66.39 [51.5–78.61]
Haryana 65.74 [54.36–75.56] 65.54 [55.12–74.64]
Delhi 62.19 [46.7–75.53] 51.84 [36.48–66.85]
Rajasthan 66.22 [59.86–72.04] 62.18 [56.08–67.91]
Uttar Pradesh 76.68 [72.5–80.4] 76.36 [72.48–79.85]
Bihar 74.21 [64.67–81.9] 66.59 [55.37–76.2]
Sikkim 48.52 [26.72–70.9] 56.52 [40.71–71.11]
Arunachal Pradesh 69.99 [50.82–84.03] 76.96 [67.53–84.29]
Nagaland 39.76 [20.02–63.52] 73.89 [59.35–84.57]
Manipur 92.29 [86.7–95.65] 83.44 [76.95–88.38]
Mizoram 41.22 [25.41–59.07] 47.99 [35.51–60.72]
Tripura 59.44 [46.74–70.99] 60.72 [52.24–68.59]
Meghalaya 44.27 [22.72–68.21] 18.15 [12–26.51]
Assam 73.07 [61.71–82.04] 65.49 [55.52–74.27]
West Bengal 69.96 [65.43–74.12] 62.29 [58.22–66.2]
Jharkhand 61.69 [48.41–73.43] 79.65 [71.41–85.99]
Odisha 84.92 [79.64–89.03] 81.15 [75.85–85.51]
Chhattisgarh 79.05 [65.48–88.25] 63.83 [52.35–73.92]
Madhya Pradesh 74.68 [67.67–80.61] 64.94 [54.75–73.93]
Gujarat 52.52 [46.22–58.75] 55.32 [47.87–62.54]
Daman & Diu 20.68 [3.72–63.72] 94.52 [64.03–99.41]
Dadra & Nagar Haveli 25.39 [12.36–45.07] 33.38 [20.88–48.75]
Maharashtra 72.11 [66.98–76.72] 59.07 [54.57–63.42]
Andhra Pradesh (Undivided) 66.54 [61.2–71.48] 63.31 [58.58–67.8]
Karnataka 72.9 [65.96–78.88] 71.69 [64.92–77.6]
Goa 68.37 [52.43–80.92] 59.59 [41.73–75.22]
Lakshadweep 35.94 [17.47–59.79] 24.99 [16.46–36.05]
Kerala 60.62 [56.34–64.75] 61.22 [57.82–64.51]
Tamil Nadu 56.79 [51.21–62.2] 48.17 [43.02–53.35]
Puducherry 44.8 [30.5–60.02] 32.81 [17.67–52.64]
Andaman & Nicobar Islands 19.8 [8.86–38.53] 24.08 [14.88–36.54]
Verma et al. BMC Public Health (2021) 21:881 Page 11 of 22
Appendix), was found to be relatively high either in thestates which are at the lowest (70.5 and 64.3% in 2014 and2017–18, on an average) or the highest stage(66.3 and57.4% on an average in 2014 and 2017–18 respectively) ofthe Epidemiological transition level (ETL which is definedon the basis of ratio of Disability-Adjusted Life Years(DALYs), computed as the sum of years of potential lifelost due to premature mortality and the years of
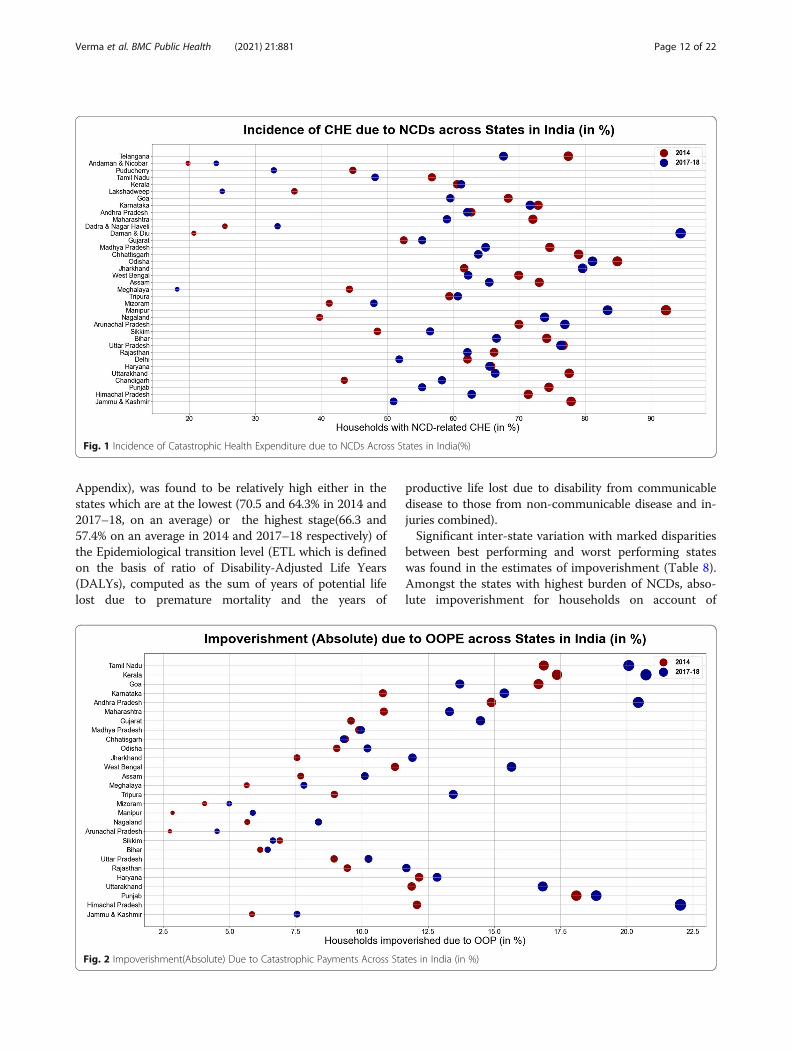
productive life lost due to disability from communicabledisease to those from non-communicable disease and in-juries combined).Significant inter-state variation with marked disparities
between best performing and worst performing stateswas found in the estimates of impoverishment (Table 8).Amongst the states with highest burden of NCDs, abso-lute impoverishment for households on account of
Fig. 1 Incidence of Catastrophic Health Expenditure due to NCDs Across States in India(%)
Fig. 2 Impoverishment(Absolute) Due to Catastrophic Payments Across States in India (in %)
Verma et al. BMC Public Health (2021) 21:881 Page 12 of 22
treatment of NCDs was highest in Kerala (17.4% in 2014and 20.7% in 2017–18), Tamil-Nadu (16.9% in 2014 and20% in 2017–18), Goa (16.7% in 2014 and 13.7% in2017–18), Himachal Pradesh (12.1% in 2014 and 22.0%in 2017–18) and Punjab (18.1% in 2014 and 18.8% in2017–18). All these states belonged to the highest Epi-demiological Transition Level (ETL) group characterizedwith burden of disease which is skewed disproportion-ately towards the NCDs such as cardiovascular disease,diabetes, respiratory problems and cancer etc. [1]. More-over, other states like West Bengal (11.25% in 2014 and15.6% in 2017–18) and Andhra Pradesh (14.9% in 2014and 20.4% in 2017–18) which are at the higher-middlegroup of ETL also experienced higher incidence of pov-erty. Conversely, states which are at the low or lower-
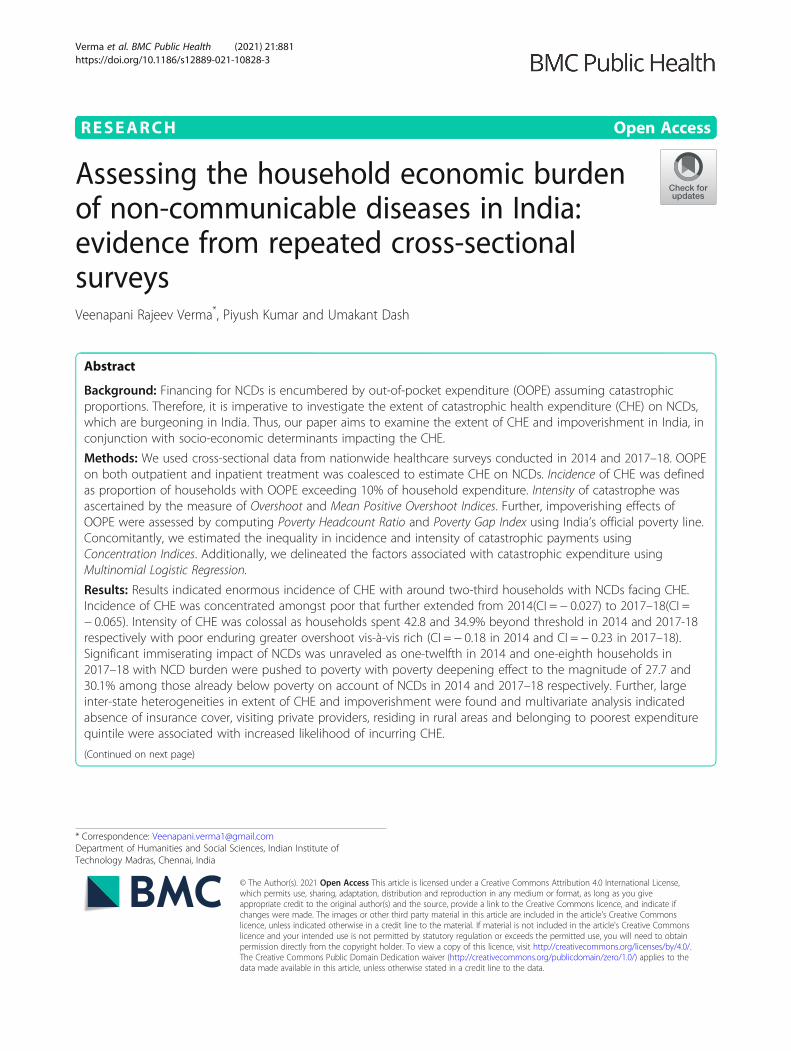
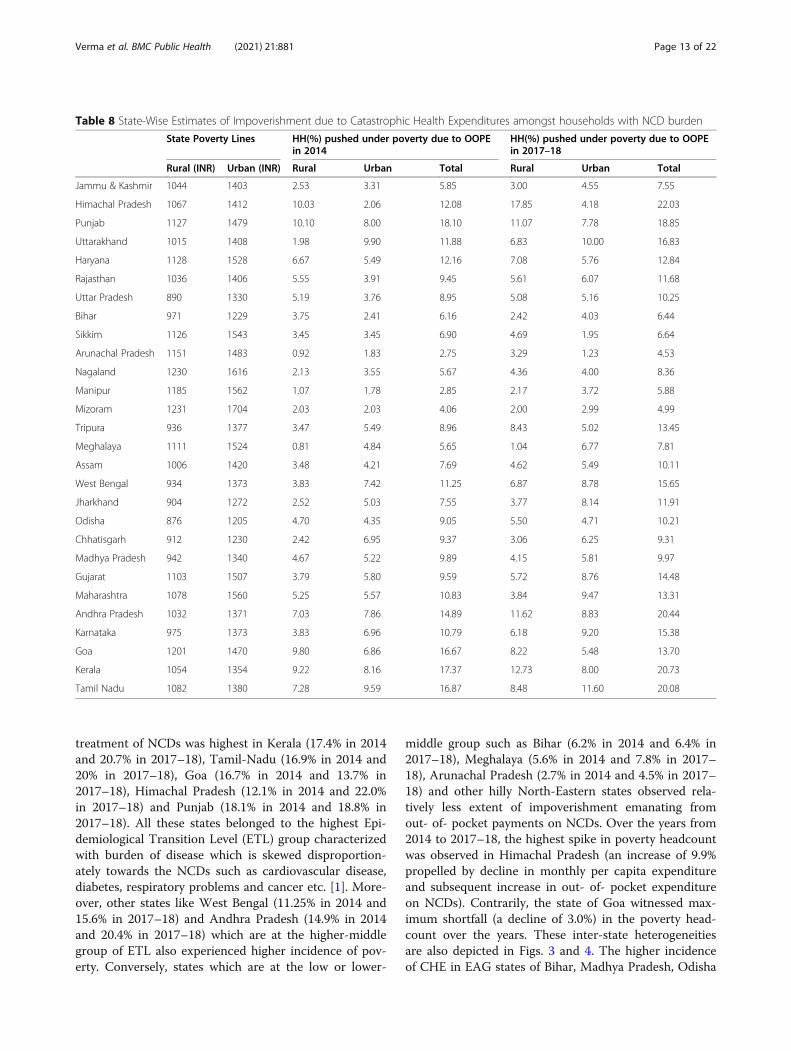
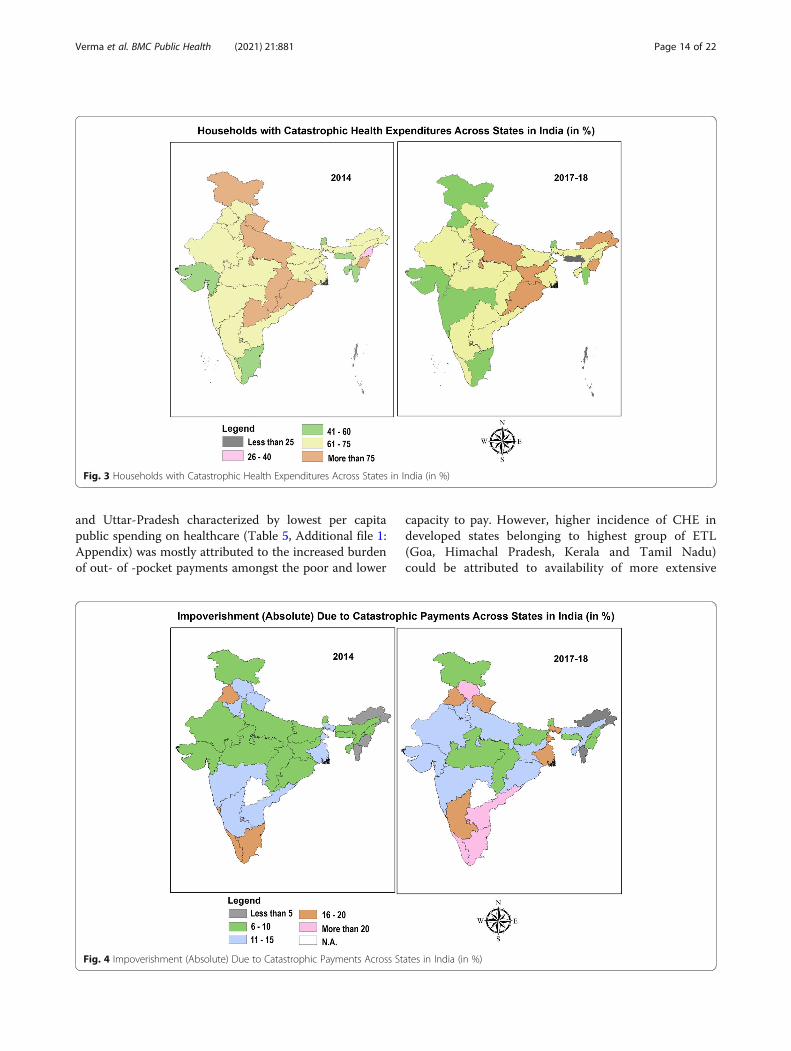
middle group such as Bihar (6.2% in 2014 and 6.4% in2017–18), Meghalaya (5.6% in 2014 and 7.8% in 2017–18), Arunachal Pradesh (2.7% in 2014 and 4.5% in 2017–18) and other hilly North-Eastern states observed rela-tively less extent of impoverishment emanating fromout- of- pocket payments on NCDs. Over the years from2014 to 2017–18, the highest spike in poverty headcountwas observed in Himachal Pradesh (an increase of 9.9%propelled by decline in monthly per capita expenditureand subsequent increase in out- of- pocket expenditureon NCDs). Contrarily, the state of Goa witnessed max-imum shortfall (a decline of 3.0%) in the poverty head-count over the years. These inter-state heterogeneitiesare also depicted in Figs. 3 and 4. The higher incidenceof CHE in EAG states of Bihar, Madhya Pradesh, Odisha
Table 8 State-Wise Estimates of Impoverishment due to Catastrophic Health Expenditures amongst households with NCD burden
State Poverty Lines HH(%) pushed under poverty due to OOPEin 2014
HH(%) pushed under poverty due to OOPEin 2017–18
Rural (INR) Urban (INR) Rural Urban Total Rural Urban Total
Jammu & Kashmir 1044 1403 2.53 3.31 5.85 3.00 4.55 7.55
Himachal Pradesh 1067 1412 10.03 2.06 12.08 17.85 4.18 22.03
Punjab 1127 1479 10.10 8.00 18.10 11.07 7.78 18.85
Uttarakhand 1015 1408 1.98 9.90 11.88 6.83 10.00 16.83
Haryana 1128 1528 6.67 5.49 12.16 7.08 5.76 12.84
Rajasthan 1036 1406 5.55 3.91 9.45 5.61 6.07 11.68
Uttar Pradesh 890 1330 5.19 3.76 8.95 5.08 5.16 10.25
Bihar 971 1229 3.75 2.41 6.16 2.42 4.03 6.44
Sikkim 1126 1543 3.45 3.45 6.90 4.69 1.95 6.64
Arunachal Pradesh 1151 1483 0.92 1.83 2.75 3.29 1.23 4.53
Nagaland 1230 1616 2.13 3.55 5.67 4.36 4.00 8.36
Manipur 1185 1562 1.07 1.78 2.85 2.17 3.72 5.88
Mizoram 1231 1704 2.03 2.03 4.06 2.00 2.99 4.99
Tripura 936 1377 3.47 5.49 8.96 8.43 5.02 13.45
Meghalaya 1111 1524 0.81 4.84 5.65 1.04 6.77 7.81
Assam 1006 1420 3.48 4.21 7.69 4.62 5.49 10.11
West Bengal 934 1373 3.83 7.42 11.25 6.87 8.78 15.65
Jharkhand 904 1272 2.52 5.03 7.55 3.77 8.14 11.91
Odisha 876 1205 4.70 4.35 9.05 5.50 4.71 10.21
Chhatisgarh 912 1230 2.42 6.95 9.37 3.06 6.25 9.31
Madhya Pradesh 942 1340 4.67 5.22 9.89 4.15 5.81 9.97
Gujarat 1103 1507 3.79 5.80 9.59 5.72 8.76 14.48
Maharashtra 1078 1560 5.25 5.57 10.83 3.84 9.47 13.31
Andhra Pradesh 1032 1371 7.03 7.86 14.89 11.62 8.83 20.44
Karnataka 975 1373 3.83 6.96 10.79 6.18 9.20 15.38
Goa 1201 1470 9.80 6.86 16.67 8.22 5.48 13.70
Kerala 1054 1354 9.22 8.16 17.37 12.73 8.00 20.73
Tamil Nadu 1082 1380 7.28 9.59 16.87 8.48 11.60 20.08
Verma et al. BMC Public Health (2021) 21:881 Page 13 of 22
and Uttar-Pradesh characterized by lowest per capitapublic spending on healthcare (Table 5, Additional file 1:Appendix) was mostly attributed to the increased burdenof out- of -pocket payments amongst the poor and lower
capacity to pay. However, higher incidence of CHE indeveloped states belonging to highest group of ETL(Goa, Himachal Pradesh, Kerala and Tamil Nadu)could be attributed to availability of more extensive
Fig. 3 Households with Catastrophic Health Expenditures Across States in India (in %)
Fig. 4 Impoverishment (Absolute) Due to Catastrophic Payments Across States in India (in %)
Verma et al. BMC Public Health (2021) 21:881 Page 14 of 22
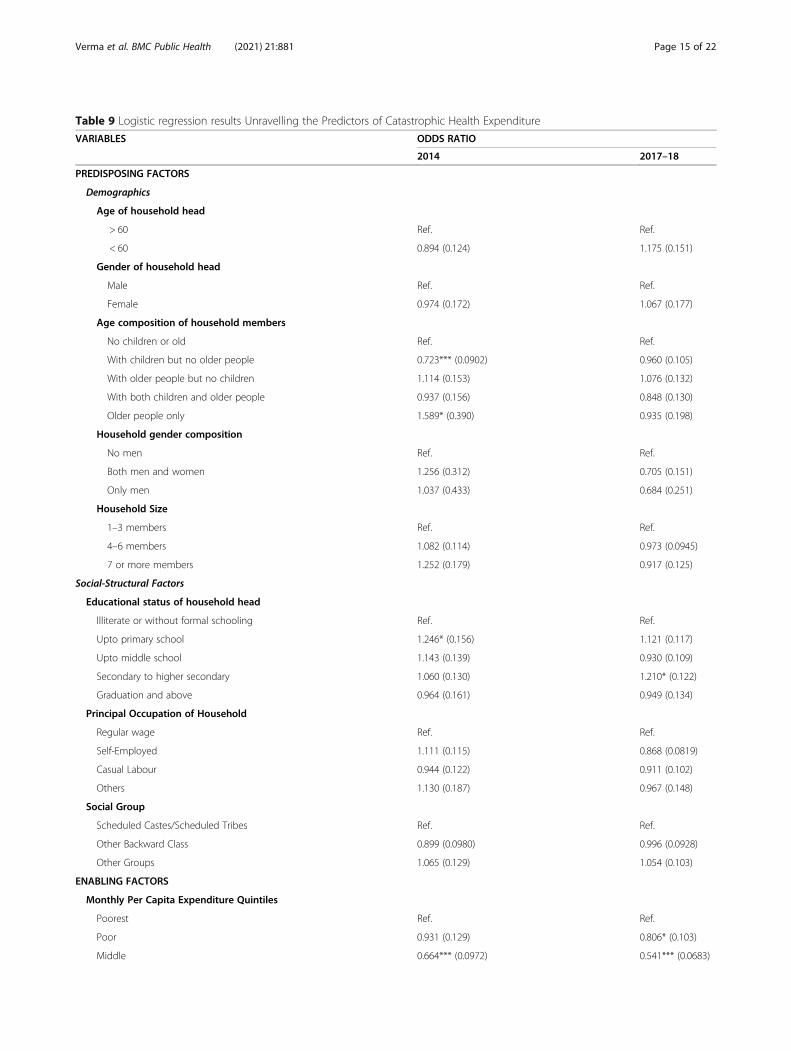
Table 9 Logistic regression results Unravelling the Predictors of Catastrophic Health Expenditure
VARIABLES ODDS RATIO
2014 2017–18
PREDISPOSING FACTORS
Demographics
Age of household head
> 60 Ref. Ref.
< 60 0.894 (0.124) 1.175 (0.151)
Gender of household head
Male Ref. Ref.
Female 0.974 (0.172) 1.067 (0.177)
Age composition of household members
No children or old Ref. Ref.
With children but no older people 0.723*** (0.0902) 0.960 (0.105)
With older people but no children 1.114 (0.153) 1.076 (0.132)
With both children and older people 0.937 (0.156) 0.848 (0.130)
Older people only 1.589* (0.390) 0.935 (0.198)
Household gender composition
No men Ref. Ref.
Both men and women 1.256 (0.312) 0.705 (0.151)
Only men 1.037 (0.433) 0.684 (0.251)
Household Size
1–3 members Ref. Ref.
4–6 members 1.082 (0.114) 0.973 (0.0945)
7 or more members 1.252 (0.179) 0.917 (0.125)
Social-Structural Factors
Educational status of household head
Illiterate or without formal schooling Ref. Ref.
Upto primary school 1.246* (0.156) 1.121 (0.117)
Upto middle school 1.143 (0.139) 0.930 (0.109)
Secondary to higher secondary 1.060 (0.130) 1.210* (0.122)
Graduation and above 0.964 (0.161) 0.949 (0.134)
Principal Occupation of Household
Regular wage Ref. Ref.
Self-Employed 1.111 (0.115) 0.868 (0.0819)
Casual Labour 0.944 (0.122) 0.911 (0.102)
Others 1.130 (0.187) 0.967 (0.148)
Social Group
Scheduled Castes/Scheduled Tribes Ref. Ref.
Other Backward Class 0.899 (0.0980) 0.996 (0.0928)
Other Groups 1.065 (0.129) 1.054 (0.103)
ENABLING FACTORS
Monthly Per Capita Expenditure Quintiles
Poorest Ref. Ref.
Poor 0.931 (0.129) 0.806* (0.103)
Middle 0.664*** (0.0972) 0.541*** (0.0683)
Verma et al. BMC Public Health (2021) 21:881 Page 15 of 22
health services with better physical access, thereby in-creasing utilization. Previous studies in the Indiancontext have revealed that states with lower poverty
levels make higher use of public health centers,thereby rendering the care seeking more expensive indeveloped states. Adjusting for socio-economic
Table 9 Logistic regression results Unravelling the Predictors of Catastrophic Health Expenditure (Continued)
VARIABLES ODDS RATIO
2014 2017–18
Rich 0.551*** (0.0809) 0.438*** (0.0612)
Richest 0.420*** (0.0675) 0.245*** (0.0349)
Living Condition Index
Lowest Ref. Ref.
Middle 1.206 (0.146) 0.935 (0.108)
Highest 1.257* (0.157) 0.986 (0.0921)
Whether Covered by Insurance or Pre-payment scheme
No Ref. Ref.
Yes 0.680*** (0.0628) 0.787*** (0.0633)
Source of finance to pay for treatment
Household income/savings Ref. Ref.
Borrowings 5.002*** (0.782) 2.693*** (0.363)
Other Sources 1.764** (0.418) 0.666*** (0.0968)
Care-seeking choices for NCD related treatment of households
Only Public Ref. Ref.
Both Public and Private 1.977*** (0.239) 2.223*** (0.228)
Only Private 3.249*** (0.309) 3.536*** (0.283)
NEED FACTORS
Hospitalization episode for NCDs over past 365 days
No Ref. Ref.
Yes 0.967 (0.0697) 1.248*** (0.0719)
Number of household members who fell ill and sought care due to NCDs
One Ref. Ref.
Two 2.027 (0.270) 1.819 (0.157)
Three or more 3.131 (0.395) 2.886 (0.319)
Whether member(s) of household sought inter-state hospitalization
No Ref. Ref.
Yes 1.797*** (0.313) 2.609*** (0.347)
CONTEXTUAL FACTORS
Level of epidemiological transition (ETL) of state where household is located
Low ETL Ref. Ref.
Lower-Middle ETL 0.442*** (0.0731) 0.664** (0.113)
Higher-middle ETL 0.653*** (0.0713) 0.669*** (0.0650)
High ETL 0.490*** (0.0604) 0.557*** (0.0586)
Location
Rural Ref. Ref.
Urban 0.798**(0.0769) 0.968 (0.0877)
Constant 1.384 (0.452) 2.087 (0.664)
Observations 26,190 37,980
Standard error (S.E) in parentheses; Level of significance: *** p < 0.01, ** p < 0.05, * p < 0.1
Verma et al. BMC Public Health (2021) 21:881 Page 16 of 22
correlates, the cost per hospitalization episode amongstthe poor using public health centers was 51% lowerthan for non-poor using private health centers inIndia [31].
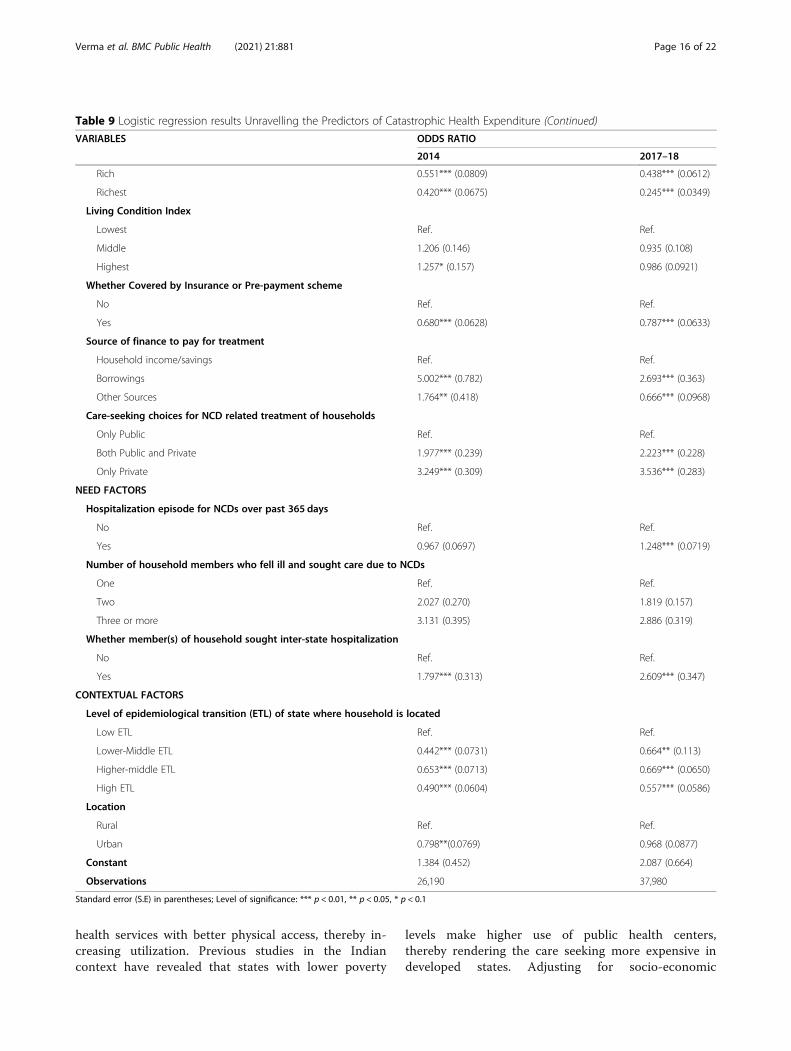
Determinants of catastrophic health expenditureThis section delves into socio-economic and demo-graphic factors associated with catastrophic health ex-penditure computed at 10% threshold. The detailedresults are tabulated in Table 9. The factors thatsignificantly increased the odds of catastrophic healthexpenditure in 2014, were revealed as – demographiccharacteristics such as households with composition ofonly elderly members (odds ratio [OR] = 1.59; P < 0.1),socio-structural measure of households with head edu-cated up-to primary school only (odds ratio [OR] = 1.25;P < 0.1), enabling attribute of treatment seeking frommix of public and private hospitals for various spells ofailments (odds ratio[OR] = 1.98; P < 0.01), seeking treat-ment from only private hospital for all spell of ailments(odds ratio[OR] = 3.25; P < 0.01), households incurringborrowings and liquidating other sources of finance topay for treatment (odds ratio [OR] = 5.002; p < 0.01 andodds ratio[OR] = 1.764; p < 0.05 respectively) andhouseholds dwelling in poorer living conditions (oddsratio[OR] = 1.26; P < 0.1). Further, need- based compo-nent of households requiring hospitalization in a differentstate (odds ratio [OR] =1.80, p < 0.01) also increased thelikelihood of incurring catastrophic health expenditure.Conversely; contextual factor of spatial locality i.e.households located in urban area (odds ratio [OR] =0.80; p < 0. 05], households belonging to lower-middle,higher middle and high ETL states [0.442; p < 0.01;0.653; p < 0.01 and 0.490; p < 0.01], enabling componentof households belonging to higher income quintiles(Middle Income quintile odds ratio[OR] = 0.664; p <0.01; Rich income quintiles odd ratio [OR] = 0.551; p <0.01 and Richest income quintile odds ratio[OR] = 0.420;p < 0.01], households with insurance/financial risk pro-tection coverage [0.680; p < 0.01] and household demo-graphics such as households without the presence ofelderly people [0.723; p < 0.01], were significantly lesslikely to incur catastrophic health expenditure.However, in 2017-18; social structural characteristic of
households with household heads educated upto second-ary to higher- secondary level vis-à-vis illiterate/ infor-mally educated increased the odds of incurringcatastrophic health expenditure (odds ratio [OR] = 1.21;p < 0.1), Further, need for care, in terms of getting hospi-talized for NCD in the household over the 365 days priorto the survey (odds ratio [OR] = 1.25; p < 0.01) had in-creased odds of financial catastrophe for the household.Amongst the enabling and need -based factors, in tan-dem with the previous findings of 2014, households
seeking treatment from a mix of public and private hos-pitals for various spells of ailments (odds ratio [OR] =2.22; p < 0.01); households seeking treatment from onlyprivate hospital for all spell of ailments (odds ratio[OR] = 3.54; p < 0.01), households borrowing moneyfor treatment (odds ratio [OR] = 2.69; p < 0.0) andhouseholds having hospitalization in different states(odds ratio [OR] = 2.61; p < 0.01) were more likely toincur catastrophic health spending. Contrarily, house-holds with higher income group (Middle incomequintile odds ratio [OR] = 0.54; p < 0.01, Rich incomequintiles odd ratio [OR] = 0.44; p < 0.01 and Richestincome quintile odds ratio [OR] = 0.24; p < 0.01),households with financial risk protection (odds ratio[OR] = 0.79; p < 0.01), households residing in statesgrouped under advanced ETL level (Lower middleETL group odds ratio [OR] = 0.664; p < 0.01,), highermiddle ETL (0.669; p < 0.01) and high ETL (0.557;P < 0.01) vis-à-vis lowest group of ETL and house-holds financing treatment with sources other thansavings and borrowings (0.666; p < 0.01) were associ-ated with lower probability of having catastrophicexpenditure.
Discussion and conclusionsOur study revealed the incidence and intensity of cata-strophic payments and subsequent impoverishment dueto NCDs in India during the period of 2014 and 2017–18.We further investigated the socio-economic and demo-graphic determinants influencing the catastrophic pay-ments during the study years. The salient findings fromthe study are surmised as follows – a) Households wereeconomically vulnerable to illness from NCDs witharound two-third households with NCDs incurring cata-strophic expenditure at 10% threshold b) Catastrophicpayments were concentrated amongst the poor with fur-ther widening of inequality in incidence of catastrophicpayments from 2014 to 2017–18 c) The intensity (depth)of catastrophic payments was colossal with around two-fifth and one-third of all households with NCDs spendingbeyond 10% catastrophic threshold in 2014 and 2017–18respectively d) The inequalities disfavoring poor in the in-tensity (depth) of catastrophic payments deepened from2014 to 2017–18 e) Level of impoverishment increaseddue to OOP payments on NCDs, as around one-twelfthand one-eighth of all households with NCD burden in2014 and 2017–18 respectively, were pushed to povertydue to healthcare expenses on treatment of NCDs f) Se-verity of impoverishment amongst those households thatwere already poor increased further by a fraction of one-fourth and one- fifth respectively in 2014 and 2017–18,connoting further deepening of poverty h) There weresubstantial inter-state heterogeneities in the headcount forcatastrophic payments and impoverishment with states
Verma et al. BMC Public Health (2021) 21:881 Page 17 of 22
having higher burden of NCDs and economically back-ward status estimated to have higher levels of CHE andpoverty- deepening impacts.Our findings are convergent with previous literature
which revealed that likelihood of incurring cata-strophic payments and distressed financing in Indiawas inordinately large for NCDs. The incidence wasmore exacerbated for rural residents vis-à-vis urbancounterparts [32, 33], which was also found in ourstudy (see Figs. 1 and 2, Additional file 1: Appendix).Furthermore, results were in tandem with evidencedemonstrating that poor households were less able tocope with healthcare costs compared to their affluentcounterparts [18, 34–36]. Studies have indicated thathouseholds positioned closer to the poverty line facemuch higher risk of falling into poverty trap if treat-ment is sought and expenditure is incurred. Thesefindings validate the equity staircase model pro-pounded by Tugwell et al. [37] which posits that poorface higher risks of disease and mortality; lower finan-cial or physical access to prevention, diagnosis, andtreatment; and structural challenges that diminish ef-fectiveness of interventions.In India, on an average, the out-of-pocket expenditure
is copiously higher than the WHO estimate for develop-ing countries which is predominantly attributed to pau-city of insurance coverage and social security net. As acorollary, catastrophic payments towards healthcare pre-cipitates into increase in impoverishment. In India, amajor proportion of the OOP on NCD care was associ-ated with hospitalization- related expenses and proce-dures. The rate of hospitalization amongst individualsailing with NCDs increased from 2014 to 2017–18. In2014, 36.3% individuals in rural areas and 43.9% individ-uals in urban areas suffering from chronic NCD- relatedconditions were hospitalized which increased by a colos-sal 33% in 2017–18.(Fig. 3, Additional file 1: Appendix).Concurrently, cost of hospitalization also increased overthe years as average OOP on NCD- related hospitalizationincreased by INR 4461. However, the financial protectionagainst hospitalization- related expenses were abysmal inboth rural and urban areas. In 2014, merely 86% popula-tion in rural areas and 82% in urban areas [15] were cov-ered under any scheme of health expenditure support.However, the coverage remained unchanged in 2017 forrural population and witnessed 1% decline among urbanpopulation [16]. Amongst the covered population, majorcoverage was through government- sponsored scheme ofRashtriya Swasthya Bima Yojana (RSBY) for those belowpoverty line and in unorganized labour. However, therewere some major lacunae in this cover as indicated by animpact evaluation of the scheme which revealed thatRSBY could not provide any significant financial protec-tion for poor households [38]. The scheme excluded cover
on outpatient expenditure and provided a yearly cover ofjust INR 30,000 per household for hospitalization ex-penses, impelling households to extend expenses muchabove the stipulated cap. Persistently high catastrophic ex-penditure on NCDs in India and subsequent impoverish-ment insinuates that schemes such as RSBY and NationalHealth Mission were ineffective in protecting poor house-holds from economic shocks. Thus, it is an imperative tohave an augmented financial risk protection mechanismin India, particularly for the poor and the vulnerable.However, in 2018, Government of India launched a flag-ship scheme of Ayushman Bharat (AB-PMJAY) aimed atproviding financial risk protection against health shocks tobottom 40% population of India, with a cover of INR 5lakh per household annually for secondary and tertiarycare hospitalizations which is around 16 times higher thanthe precursor scheme. Albeit, the outpatient expenses arenot covered under AB-PMJAY which constitutes majorityof OOPE in chronically ill patients suffering from NCDs.Results elucidate that there is deepening of health in-
security in India on account of healthcare expenseswhich is recounted in previous studies as well. Evidencefrom India revealed that households are grappling withdouble whammy of dwindling public provisioning ofhealthcare and rising healthcare costs [39]. Concomi-tantly, there is a burgeoning of private providers inthe last twenty years, compelling patients to seek carefrom private providers with high user fee and procuredrugs and diagnostics from private outlets. During oursurvey years, only 22.4% households sought treatmentfrom public providers for NCDs, whereas thrice thatnumber sought treatment from private providers in2014; correspondingly; in 2017–18, 27.6% householdsresorted to public providers and disproportionately largenumber (63%) sought care from private providers. Also,Indian evidence from India divulges that public pro-viders are usually fraught with problems pertaining toquality and availability of basic amenities at healthcarecenters in rural areas, thus, impelling a large proportionof ailing persons to seek treatment from expensive pri-vate health centers located in urban areas. Our surveydata revealed that households which sought care in onlypublic facilities for NCDs incurred an average OOPE ofINR 1161 vis-à-vis households which solely sought carefrom private providers, incurred INR 2550 on an averagefor treatment episode in 2014. The gap in treatmentcosts between providers was exacerbated in 2017–18with households paying INR 1113 to public providersand twice the amount (INR 2761) to private providers.Such inflated costs often culminate in distressed finan-cing by households in the form of borrowings and sellingof assets to cope with health shocks and catastrophicpayments. Thus, it is pertinent to augment public provi-sioning and public subsidy on healthcare by increasing
Verma et al. BMC Public Health (2021) 21:881 Page 18 of 22
the government budget share on health. The NationalHealth Policy, 2017 proposed to increase the centralgovernment spending on health from current level of1.15 to 2.5% of GDP by 2025 and explicitly enunciatesthe goal of reducing the proportion of households incur-ring catastrophic health expenditure from current levelby 25%, by 2025 [40]. Previously, Government of Indiaalso launched targeted National Programme for Preven-tion and Control of Cancer, Diabetes, CardiovascularDisease and Stroke [41] in 2010 to give impetus to cap-acity of district health systems for prevention, early diag-nosis, treatment and rehabilitation for these NCDs at anaffordable cost. However, implementation bottlenecksand ineffective monitoring and evaluation rendered theprogram ineffectual in improving coverage.Affordable access to medicines is one of the onerous
factor influencing OOPE for NCDs, since the chronicailments require treatment over a prolonged period oftime. Expenditure on medicines constituted, on anaverage, roughly one-fifth of OOPE on NCD relatedhospitalization and one-third of OOPE on outpatient re-lated expenditure. However, the affordability of medi-cines was highly contingent upon choice of provider,with highest CHE burden in private facilities as OOPpayment on medicines was almost universally mandatoryto access medicines in private facilities (Fig. 4-Fig. 16,Additional file 1: Appendix). For inpatient care, aroundone-fourth (24.8% in 2014 and 28% in 2017–18) of thepatients received completely free medicines in public fa-cilities located in rural areas, whereas, only 3.5 and 1.8%patients admitted in rural private facilities received freemedicines in 2014 and 2017–18 respectively. The pro-portion of inpatients receiving completely free medicinesin public facilities in urban areas was even greater thanrural areas (33% in 2014 and 37.1% in 2017–18 respect-ively), Conversely, access to free medicine in private fa-cilities located in urban areas for inpatients was furthersubjacent(3.2% in 2014 and 1.6% in 2017–18) than ruralareas. The divergence in the access to free medicines be-tween public and private facilities was even more pro-nounced for outpatient care. In rural areas, around one-third outpatients (33.9% in 2014 and 35.1% in 2017–18respectively) paid full amount for medicines in public fa-cilities, however, a colossal proportion of 90.7% in 2014and 88.6% in 2017–18 in private rural facilities paid outof pocket price for medicines. Similarly, in urban publicfacilities, lesser proportion of outpatients (38.7 and 36%in 2014 and 2017–18 respectively) did not receive freemedicines vis-à-vis private counterparts (91.5 and 89.5%in 2014 and 2017–18 respectively). Relatively affordablemedicines in public facilities can be attributed to centralgovernment schemes like Pradhan Mantri BharatiyaJanaushadi Pariyojana (PMBJP) that explicitly aims to re-duce out-of-pocket expenditure on medicines by making
quality generic medicines available at affordable prices[42]. The impact evaluation of the scheme in reducingthe incidence of CHE can be explored in future studies.Further, underscoring the dichotomy in the sectors, theincidence of CHE for outpatient care (Fig. 8, Additionalfile 1: Appendix) exhibited higher prevalence for OOPburden when treatment was sought from private pro-viders vis-à-vis public providers,thereby indicating theneed for more decisive interventions by the governmentin improving the quality of services in public facilities.Our multivariate analysis also conceded that householdsin rural areas were more likely to endure the impact ofcatastrophic payments despite lower OOPE on an aver-age in rural areas (INR 1971) as compared to urbanareas (INR 2698) in 2014 and subsequently, INR 2077and INR 2729 in rural and urban areas respectively in2017. Similar observations with respect to location wereresounded in 2004–05 as well, reflecting disproportion-ately more impoverishment in rural areas over a pro-tracted period of time [39]. Further, the states withhigher burden of NCDs (high ETL groups) were moresusceptible to catastrophic payments due to higherutilization, whereas, lower burden of catastrophic ex-penditure was found in states with lower levels of epi-demiological transition that concurs with other studiesin India [31]. A plausible explanation for lower burdenin ETL groups is the prevalence of unmet need in thesestates as the states at the lower level of epidemiologicaltransition are also economically backwards, thereby, im-peding financial accessibility to seek care. An inverse re-lationship has been found between epidemiologicaltransition ratio and socio-economic development ofstates [1]. India’s policies however, have been focused onhealth improvements in less developed EmpoweredGroup states of Bihar, Chhattisgarh, Jharkhand, MadhyaPradesh, Odisha, Rajasthan, Uttar Pradesh; whereas, theincidence of NCDs and its associated economic burdenhas been substantial in developed states as well [43].Public health expenditure as a percentage of Gross StateDomestic Product (GSDP) in states with highest NCDburden (1.34, 1.68, 0.93, 0.87 and 0.74% for Goa, Hima-chal Pradesh, Kerala, Punjab and Tamil Nadu respect-ively) was revealed to be lowest across the states andmuch beneath the recommended 3% goal. These inter-state heterogeneities has pertinent policy ramificationsand it is suggested that promulgation of state-specificpolicies should be done that regards the contextual vari-ations and budgetary allocations for health sector shouldbe revised with increased prioritization.Our study has few limitations emanating from caveats
in the survey data and methodological approach. Firstly,the outcome measure is non-normative as the weightsplaced on catastrophic payments incurred by poor andnon-poor households were same and ignores the fact
Verma et al. BMC Public Health (2021) 21:881 Page 19 of 22
that opportunity cost of health spending is different be-tween poor and non-poor households. The measures donot allow for distributional sensitivity and results shouldbe interpreted with caution as the same threshold wasused for different socio-economic groups. Assuming thediminishing marginal utility of money, beyond a fixedthreshold level, the marginal utility of next amount ismuch higher for poorer households. Thus, it is more ap-propriate to consider distribution-sensitive measures ofcatastrophe at different levels for disparate socio-economic groups which is in tandem with vertical equityprinciple insinuating that higher expenditure propor-tions are required to designate a richer household ashaving experienced a catastrophic event [44]. Secondly,we did not consider coping-adjusted health expendituresin the study. Subsequently, the ‘hidden’ poverty due toinflation of total household expenditure by financial cop-ing strategies and ‘transient’ impoverishment due to sac-rifice of necessary consumption to temporarily pay forhealth is not demonstrated. Measures that ignore copingstrategies not only overstate risk to current consumptionand exaggerate the scale of catastrophic payments butalso overlook the long-run burden of health payments[45]. One of the lacunae of this relativist approach stemsfrom the fact that threshold used to define catastrophicpayment is inevitably somewhat arbitrary with no guar-antee that spending less than this ratio is not a threat tothe satisfaction of basic needs. A systematic review [46]conceded that the impact that NCDs exert on house-holds and impoverishment is likely to be underestimatedsince important economic domains, such as copingstrategies and inclusion of marginalized and vulnerablepeople who do not seek healthcare due to financial rea-sons, are overlooked in literature. Studies have estab-lished that economically vulnerable households mayunconsciously alter their perception of an illness andthus, forgo treatment altogether. This forgone treatmentcould lead to an exacerbation of an illness and thus,higher catastrophic expenditures, thereby, triggering an-other vicious cycle [47]. Literature also underscores thehigh prevalence of non-adherence of the treatment anddisruption in the medication for NCDs due to chronicand progressive nature of disease requiring long termmanagement, thereby, leading to deflated estimates ofout-of-pocket expenditures [48, 49]. Thirdly, the disag-gregated impact of price of health services and quantityof services used on catastrophic payments was not disen-tangled as these two components are intertwined witheach other. A given level of out- of- pocket spendingcould be a consequence of low prices or high use orcombination of both. Fourthly, the expenditure dataused in study is self-reported that is amenable to recallbias and is not verified by other sources. A study investi-gating OOP expenses for diabetes patients in a tertiary
care setting, highlighted that social-desirability bias ledto patients overestimating their adherence to the pre-scription course for medications, thereby, leading to aninformation bias on OOP-related expenses [50]. The ab-sence of a validating exercise in the survey design ren-ders our study susceptible to social-desirability bias aswell. Fifthly, the self-reporting of monthly householdconsumer expenditure without a parallel validation dur-ing the survey poses challenges in terms of underestima-tion of household incomes. Winter (2004) demonstratedin a controlled survey experiment that a one-shotopen-ended question on household consumptionyielded significantly lower estimates of consumptionthan a disaggregated question with multiple categories[51]. Hence, it is pertinent to note that more refinedconsumption expenditure estimates can be obtainedfrom National Sample Survey (NSS) Consumption Ex-penditure Survey (CES) enabling estimation of cap-acity to pay and further studies should be conductedto ascertain sensitivity of impoverishment measuresutilizing health survey and consumption expendituresurvey. Finally, the disruption in living standards dueto catastrophic payments should be ascertained withlongitudinal data, however, in the absence of suchdata, we have used repeated cross- sectional in ourstudy. Despite these limitations, the evidence gener-ated by our study has important policy implicationsin India and other resource-constrained nationsundergoing demographic and economic transitionwith high increasing burden of NCDs.
Supplementary InformationThe online version contains supplementary material available at https://doi.org/10.1186/s12889-021-10828-3.
Additional file 1.
AcknowledgementsAuthors would like to acknowledge Sven Neelsen, Economist, World Bank,Washington D.C. for clearing the doubts pertaining to methodologicaldesign.
Authors’ contributionsVRV conceptualized, assisted the analysis and did the writing of manuscript;PK analyzed the data and revised the manuscript and UD was involved instudy design and revision of manuscript. Co-authors have read and approvedthe final manuscript.
FundingThe authors did not receive any funding for this study
Availability of data and materialsThe datasets generated/or analyzed during the current study are availablefrom Ministry of Statistics and Programme Implementation (MOSPI),Government of India upon request or can be downloaded from https://mospi.gov.in/web/mospi/download-tables-data
Verma et al. BMC Public Health (2021) 21:881 Page 20 of 22
Declarations
Ethics approval and consent to participateNot applicable
Consent for publicationNot applicable
Competing interestsThe authors declare that they have no competing interests.
Received: 31 December 2020 Accepted: 9 April 2021
References1. Dandona L, Dandona R, Kumar GA, Shukla DK, Paul VK, Balakrishnan K, et al.
Nations within a nation: variations in epidemiological transition across thestates of India, 1990–2016 in the Global Burden of Disease Study. Lancet.2017; 390: (10111): 2437–2460. Available from: https://doi.org/10.1016/S0140-6736(17)32804-0 [cited 2020 22 Dec]
2. Bukhman G, Mocumbi AO, Atun R, Becker AE, Bhutta Z, Binagwaho A, et al.The lancet NCDI poverty commission: bridging a gap in universal healthcoverage for the poorest billion. Lancet. 2020;396:991–1044 Available from:https://doi.org/10.1016/S0140-6736(20)31907-3 [cited 2020 17 Dec].
3. Bloom DE, Cafiero ET, Jané-Llopis E, Abrahams-Gessel S, Bloom LR, FathimaSF, Gaziano T, Mowafi M, Pandya A, Prettner K, Rosenberg L, Seligman B,Stein A, Weinstein C. The global economic burden of noncommunicablediseases. Geneva: World Economic Forum; 2011.
4. Thakur J, Garg C, Menabde N, Prinja S, Mendis S. Social and EconomicImplications of Noncommunicable diseases in India. Indian J Commun Med.2011;36(5):13 Available from: https://www.ijcm.org.in/text.asp?2011/36/5/13/94704 [cited 2020 15 Dec].
5. Ministry of Health and Family Welfare. Change in Medical ExpenditurePattern [Internet]. 2020. Available from: https://pib.gov.in/PressReleasePage.aspx?PRID=1602758
6. Gupta I, Ranjan A. Public expenditure on Non-Communicable Diseases &Injuries in India: A budget-based analysis. Vellakkal S, editor. PLoS One. 2019;14(9):e0222086 Available from: https://dx.plos.org/10.1371/journal.pone.0222086 [cited 2020 24 Dec].
7. Prinja S, Chauhan AS, Karan A, Kaur G, Kumar R. Impact of Publicly FinancedHealth Insurance Schemes on Healthcare Utilization and Financial RiskProtection in India: A Systematic Review. Xia C-Y, editor. PLoS One. 2017;12(2):e0170996 Available from: https://dx.plos.org/10.1371/journal.pone.0170996 [cited 2020 17 Sep].
8. Akhtar MDA, Ahmad N, Chowdhury IR. Measuring Socio-EconomicInequality in Self-Reported Morbidity in India: Decomposition Analysis. RevDev Chang. 2020;25(1):89–111 Available from: http://journals.sagepub.com/doi/10.1177/0972266120916317 [cited 2020 20 Nov].
9. Chowdhury S, Gupta I, Trivedi M, Prinja S. Inequity & burden of out-of-pocket health spending: District level evidences from India. Indian J MedRes. 2018;148(2):180–9 Available from: /pmc/articles/PMC6206772/?report=abstract [cited 2020 25 Dec].
10. Pal R. Measuring incidence of catastrophic out-of-pocket healthexpenditure: With application to India. Int J Health Care Finance Econ. 2012;12(1):63–85 Available from: https://link.springer.com/article/10.1007/s10754-012-9103-4 [cited 2020 26 Dec].
11. Brinda EM, Rajkumar AP, Enemark U, Prince M, Jacob KS. Nature anddeterminants of out-of-pocket health expenditure among older people in arural Indian community. Int Psychogeriatrics. 2012;24(10):1664–73 Availablefrom: https://www.cambridge.org/core/journals/international-psychogeriatrics/article/abs/nature-and-determinants-of-outofpocket-health-expenditure-among-older-people-in-a-rural-indian-community/593025C290D19A85C00DBC573B6F31C4 [cited 2020 24 Dec].
12. Sinha R, Chatterjee K, Nair N, Tripathy P. Determinants of Out-of-Pocket andCatastrophic Health Expenditure: A Cross-sectional Study. Br J Med Med Res.2016;11(8):1–11 Available from: https://www.mospi.nic.in/Mospi_New/site/inner.aspx [cited 2020 Dec 25].
13. Dalui A, Banerjee S, Roy R. Determinants of out-of-pocket and catastrophichealth expenditure in rural population: A community-based study in a blockof Purba Barddhaman, West Bengal. Indian J Public Health. 2020;64(3):223
Available from: https://www.ijph.in/text.asp?2020/64/3/223/295800 [cited2020 26 Dec].
14. Misra S, Awasthi S, Singh JV, Agarwal M, Kumar V. Assessing the magnitude,distribution and determinants of catastrophic health expenditure in urbanLucknow, North India. Clin Epidemiol Glob Heal. 2015;3(1):10–6. https://doi.org/10.1016/j.cegh.2013.10.003.
15. National Sample Survey Office, Ministry of Statistics and ProgrammeImplementation G of I. Health in India: NSS Report No 574(71/25.0). 2015.
16. National Statistical Office, Ministry of Statistics & ProgrammeImplementation G of I. Health in India: NSS REPORT NO 586(75/25.0). 2020.
17. Li Y, Wu Q, Xu L, Legge D, Hao Y, Gao L, et al. Facteurs affectant lesdépenses de santé catastrophiques et l’appauvrissement dû aux dépensesmédicales en Chine: Implications des politiques de l’assurance de santéuniverselle. Bull World Health Organ. 2012;90(9):664–71 Available from:https://pubmed.ncbi.nlm.nih.gov/22984311/ [cited 2020 Dec 27].
18. Xu K, Evans DB, Kawabata K, Zeramdini R, Klavus J, CJL M. Householdcatastrophic health expenditure: A multicountry analysis. Lancet. 2003;362(9378):111–7 Available from: https://www.thelancet.com/article/S0140673603138615/fulltext [cited 2020 15 Dec].
19. Yardim M, Cilingiroglu N, Policy NY-H, 2010 undefined. Catastrophichealth expenditure and impoverishment in Turkey. Elsevier [Internet].[cited 2020 Jun 1]; Available from: https://www.sciencedirect.com/science/article/pii/S0168851009002127?casa_token=tm23A1G1a8gAAAAA:8cHZwcyHCU-VpT2jNR3e7IJcXNUnG7Zp8oi7HQHYbAsWxNS6wvqpHbsEfkXpw4EGKC9c67VTspM
20. Su TT, Kouyaté B, Flessa S. Catastrophic household expenditure for healthcare in a low-income society: A study from Nouna District, Burkina Faso. BullWorld Health Organ. 2006;84(1):21–7 Available from: https://pubmed.ncbi.nlm.nih.gov/16501711/ [cited 2020 27 Dec].
21. Pandey A, Ploubidis GB, Clarke L, Dandona L. Public Health Foundation ofIndia. Health Policy Plan. 2017;47:969–79 Available from: https://academic.oup.com/heapol/article-abstract/32/7/969/3737837 [cited 2020 3 Aug].
22. Devadasan N, Criel B, Van Damme W, Ranson K, Van Der Stuyft P. Indiancommunity health insurance schemes provide partial protection againstcatastrophic health expenditure. Vol. 7, BMC Health Services Research. 2007.
23. Kastor A, Sanjay MK. Disease-specific out-of-pocket and catastrophic healthexpenditure on hospitalization in India: Do Indian households face distresshealth financing? PLoS One [Internet]. 2018 May 1 [cited 2020 Dec 15];13(5).Available from: https://www.ncbi.nlm.nih.gov/pmc/articles/PMC5945043/.
24. Wagstaff A, Flores G, Hsu J, Smitz MF, Chepynoga K, Buisman LR, et al.Progress on catastrophic health spending in 133 countries: a retrospectiveobservational study. Lancet Glob Heal. 2018;6(2):e169–79. https://doi.org/10.1016/S2214-109X(17)30429-1.
25. Barros A, … JB-C de saude, 2011 undefined. Catastrophic spending onhealth care in Brazil: private health insurance does not seem to be thesolution. SciELO Public Heal [Internet]. [cited 2020 Jun 1]; Available from:https://www.scielosp.org/article/csp/2011.v27suppl2/s254-s262/en/
26. Bredenkamp C, Mendola M, Gragnolati M. Catastrophic and impoverishingeffects of health expenditure: New evidence from the Western Balkans.Health Policy Plan. 2011;26(4):349–56 Available from: https://academic.oup.com/heapol/article/26/4/349/661333 [cited 2020 27 Dec.
27. Wagstaff A, van Doorslaer E. Catastrophe and impoverishment in paying forhealth care: with applications to Vietnam 1993-1998. Health Econ. 2003;12(11):921–33. https://doi.org/10.1002/hec.776.
28. Andersen RM. Revisiting the behavioral model and access to medical care:does it matter? [internet]. Vol. 36, Source: Journal of Health and SocialBehavior. 1995 [cited 2021 Feb 28]. Available from: https://www.jstor.org/stable/2137284
29. Martin H. Calculating the standard of living of a household: one orseveral equivalence scales? 2017 [cited 2020 Jun 8]; Available from:https://www.epsilon.insee.fr/jspui/bitstream/1/58117/1/estat_2017_491_9_eng.pdf
30. Handbook of Statistics on Indian Economy. Reserve Bank of India -Publications [Internet]. [cited 2020 Jun 11]. Available from: https://www.rbi.org.in/scripts/PublicationsView.aspx?id=19029
31. Pandey A, Kumar GA, Dandona R, Dandona L. Variations in catastrophichealth expenditure across the states of India: 2004 to 2014. Gopichandran V,editor. PLoS One. 2018;13(10):e0205510 Available from: https://dx.plos.org/10.1371/journal.pone.0205510 [cited 2020 15 Dec].
32. Kastor A, Mohanty SK. Disease-specific out-of-pocket and catastrophichealth expenditure on hospitalization in India: Do Indian households face
Verma et al. BMC Public Health (2021) 21:881 Page 21 of 22
distress health financing? PLoS One. 2018;13:5 Available from: https://pubmed.ncbi.nlm.nih.gov/29746481/ [cited 2020 15 Dec].
33. Sangar S, Dutt V, Thakur R. Comparative Assessment of Economic Burden ofDisease in Relation to Out of Pocket Expenditure. Front Public Heal. 2019;7(JAN): 9. Available from: https://www.frontiersin.org/article/10.3389/fpubh.2019.00009/full [cited 2020 15 Dec]
34. Wagstaff A. Poverty and health sector inequalities. Bull World Health Organ.2002;80(2):97–105.
35. Kien VD, Van MH, Ngoc NB, Phuong TB, Ngan TT, Quam MB. Inequalities inHousehold Catastrophic Health Expenditure and ImpoverishmentAssociated with Noncommunicable Diseases in Chi Linh, Hai Duong,Vietnam. Asia-Pac J Public Heal. 2017;29(5_suppl):35S–44S Available from:https://pubmed.ncbi.nlm.nih.gov/28719772/ [cited 2020 Dec 15].
36. Rahman MM, Gilmour S, Saito E, Sultana P, Shibuya K. Health-relatedfinancial catastrophe, Inequality and Chronic Illness in Bangladesh,Inequality and Chronic Illness in Bangladesh PLoS One 2013 25;8(2).
37. Tugwell P, De Savigny D, Hawker G, Robinson V. Applying clinicalepidemiological methods to health equity: The equity effectiveness loop. BrMed J. 2006;332(7537):358–61 Available from: /pmc/articles/PMC1363922/?report=abstract [cited 2020 20 Dec].
38. Karan A, Yip W, Mahal A. Extending health insurance to the poor in India:An impact evaluation of Rashtriya Swasthya Bima Yojana on out of pocketspending for healthcare. Soc Sci Med. 2017;181:83–92 Available from: /pmc/articles/PMC5408909/?report=abstract [cited 2020 Dec 20].
39. Selvaraj S, Karan AK. Deepening health insecurity in India: Evidence fromNational Sample Surveys since 1980s. Econ Polit Wkly 2009;44(40):55–60.
40. Ministry of Health and Family Welfare G of I. National Health Policy 2017[Internet]. 2017 [cited 2020 Dec 20]. Available from: https://www.nhp.gov.in/nhpfiles/national_health_policy_2017.pdf
41. Ministry of Health and Family Welfare G of I. No Titl [Internet]. 2017 [cited2020 Dec 20]. Available from: https://dghs.gov.in/content/1363_3_NationalProgrammePreventionControl.aspx
42. Pradhan Mantri Bhartiya Janaushadhi Pariyojana (PMBJP) | Department ofPharmaceuticals [Internet]. [cited 2021 Mar 29]. Available from: https://pharmaceuticals.gov.in/schemes/pradhan-mantri-bhartiya-janaushadhi-pariyojana-pmbjp
43. Bhargava B, Paul VK. Informing NCD control efforts in India on the eveof Ayushman Bharat [Internet]. Vol. 0, The Lancet. Lancet PublishingGroup; 2020 [cited 2020 Dec 24]. Available from: https://doi.org/10.1016/S0140-6736
44. Onoka CA, Onwujekwe OE, Hanson K, Uzochukwu BS. Examiningcatastrophic health expenditures at variable thresholds using householdconsumption expenditure diaries. Trop Med Int Heal. 2011 Oct;16(10):1334–41. https://doi.org/10.1111/j.1365-3156.2011.02836.x.
45. Flores G, Krishnakumar J, O’Donnell O, Van Doorslaer E. Coping with health-care costs: Implications for the measurement of catastrophic expendituresand poverty. Health Econ. 2008;17(12):1393–412 Available from: https://pubmed.ncbi.nlm.nih.gov/18246595/ [cited 2020 27 Dec].
46. Jaspers L, Colpani V, Chaker L, van der Lee SJ, Muka T, Imo D, et al.The global impact of non-communicable diseases on households andimpoverishment: a systematic review. Vol. 30, Eur J Epidemiol; 2014. p.163–188. Available from: https://pubmed.ncbi.nlm.nih.gov/25527371/[cited 2020 14 Dec]
47. Sauerborn R, Adams A, Hien M. Household strategies to cope with theeconomic costs of illness. Soc Sci Med. 1996;43(3):291–301 Available from:https://pubmed.ncbi.nlm.nih.gov/8844932/ [cited 2021 29 Mar].
48. Heidari P, Cross W, Crawford K. Do out-of-pocket costs affect medicationadherence in adults with rheumatoid arthritis? A systematic review. Vol. 48,Semin Arthritis Rheum; 2018. p. 12–21. Available from: https://pubmed.ncbi.nlm.nih.gov/29496225/ [cited 2021 1 Apr]
49. Hirth RA, Greer SL, Albert JM, Young EW, Piette JD. Out-of-pocket spendingand medication adherence among dialysis patients in twelve countries.Health Aff. 2008 Jan 2;27(1):89–102. https://doi.org/10.1377/hlthaff.27.1.89.
50. Basu S, Garg S, Sharma N, Mm S, Garg S, Asaria M. The determinants of out-of-pocket health-care expenses for diabetes mellitus patients in India: Anexamination of a tertiary care government hospital in Delhi. Perspect ClinRes. 2020;11(2):86 Available from: http://www.picronline.org/text.asp?2020/11/2/86/257232 [cited 2021 27 Mar].
51. Winter J. Response bias in survey-based measures of householdconsumption. Econ Bull. 2004;3(9):1–12 Available from. https://ideas.repec.org/a/ebl/ecbull/eb-03c80001.html [cited 2021 27 Mar].
Publisher’s NoteSpringer Nature remains neutral with regard to jurisdictional claims inpublished maps and institutional affiliations.
Verma et al. BMC Public Health (2021) 21:881 Page 22 of 22