Embed Size (px)
Citation preview

£vG 4gdp
POLICY RESEARCH WORKING PAPER 2929
Assessing the Impact of CommunicationCosts on International Trade
Carsten FinkAaditya Mattoo
Ileana Cristina Neagu
The World BankDevelopment Research Group m
TradeNovember 2002
Pub
lic D
iscl
osur
e A
utho
rized
Pub
lic D
iscl
osur
e A
utho
rized
Pub
lic D
iscl
osur
e A
utho
rized
Pub
lic D
iscl
osur
e A
utho
rized

I POLICY RESEARCH WORKING PAPER 2929
AbstractRecent research suggests that trade costs have a strong variations in prices yields estimates that are superior toinfluence on the pattern of specialization and trade, but the ones obtained from country-specific measures ofthere is limited empirical research on the determinants of communication infrastructure used in previous studies.trade costs. The existing literature identifies a range of The authors find that international variations inbarriers that separate nations, but then typically focuses communication costs indeed have a significant influenceonly on transport costs. Although communication costs on bilateral trade flows-both at the aggregate level andfigure prominently in intuitive explanations and casual for most individual sectors disaggregated according toobservations, they have played little role in the formal the 2-digit SITC classification.analysis of trade costs. Fink, Mattoo, and Neagu seek to Since information and communication needs are likelyexamine whether this neglect matters, and whether the to be much greater for differentiated goods, the authorsinclusion of the magnitude and variation of test whether trade in these products is more sensitive tocommunication costs across partner countries can add variations in the costs of communication. Using thevalue to existing explanations of the pattern of trade. Rauch classification of product heterogeneity, the
The authors develop a simple multi-sector model of estimates suggest that the impact of communication costs"impeded" trade that generates testable hypotheses in a on trade in differentiated products is as much as one-gravity-type estimation framework. The main proxies for third larger than on trade in homogenous products.bilateral communication costs are the per-minute Finally, the authors verify, to the extent possible, that thecountry-to-country calling prices charged in the significance of communication costs is not driven byimporting and exporting countries. The use of bilateral their endogeneity or by omitted variables.
This paper-a product of Trade, Development Research Group-is part of a larger effort in the group to assess theimplications of liberalizing trade in services. Copies of the paper are available free from the World Bank, 1818 H StreetNW, Washington, DC 20433. Please contact Paulina Flewitt, room MC3-333, telephone 202-473-2724, fax 202-522-1159, email address [email protected]. Policy Research Working Papers are also posted on the Web at http://econ.worldbank.org. The authors may be contacted at [email protected], [email protected], [email protected]. November 2002. (38 pages)
The Policy Research Workmig Paper Series disseminates the findings of work in progress to encourage the exchange of ideas aboutdevelopment issues. An objective of the series is to get the findings out quickly, even if the presentations are less than fully polished. Thepapers carry the namnes of the authors and should be cited accordingly. The findings, interpretations, and conclusions expressed in thispaper are entirely those of the authors. They do not necessarily represent the view of the World Bank, its Executive Directors, or the
countries they represent.
Produced by the Research Advisory Staff

Assessing the Impact of Communication Costs onInternational Trade
By Carsten Fink, Aaditya Mattoo and Ileana Cristina Neagu*
JEL Classification: F 10Keywords: International trade, trade costs, communication costs
Development Research Group (DECRG), The World Bank, 1818 H Street, NW, Washington, DC20433; Email: cfink@worldbank org, [email protected], and ineagugworldbank.org, respectively.This paper is part of the World Bank's research program on trade in services, which is supported in partby the United Kingdom Department of Intemational Development. We would like to thank SimonEvenett and David Hummels for stimulating discussions and Mary Amiti, Caroline Freund, BernardHoekman, Keith Maskus, Christine McDaniel, Randeep Rathindran, Isidro Soloaga, and seminarparticipants at the World Bank and the United States Intemational Trade Commission for helpfulcomments.


Introduction
Economists have long recognized the importance of communication costs in international trade
(Harris, 1995). Discussions of the causes of growth in world trade in the last quarter of the 20 "
century frequently cite technological progress in telecommunications and associated declines in
communication costs as an important contributor. In particular, it has been argued that the
emergence of international production networks has been driven by improved communication
links that facilitated the coordination of geographically dispersed production processes (see, for
example, Krugman, 1995, and Venables, 2002).
Yet we have virtually no empirical insight on how much communication costs matter for trade
and how important they are relative to other components of trading costs. Firm-based surveys
frequently list the costs and quality of telecommunications as an important factor in trade and
investment decisions. For example, Spinanger (2001) reports evidence from a survey of 14
major textiles and clothing producers in Hongkong (with activities throughout Asia and around
the world), which identifies the quality of telecom infrastructure as a key factor in decisions on
export-oriented foreign direct investment-more important than policies affecting trade and
investment, labor costs, and education and training of workers. Limao and Venables (1999)
construct an index of infrastructure density-including availability of telecommunications-and
find that it is a significant determinant of bilateral trade costs. Similarly, Freund and Weinhold
(2000) analyze the effect of Internet diffusion-measured by a country's number of web hosts-
on trade and find an increasing and significant impact from 1997 to 1999. While these studies
provide interesting insights regarding the relevance of communication infrastructure, they do not
offer evidence on how international communication costs affect export and import patterns.
This study is a first attempt to directly quantify the effect of communication costs on bilateral
trade, both in the aggregate and across different product categories. By employing country-to-
country calling prices, the econometric investigation relies on bilateral variations in
communication costs between trading partners. This approach is likely to yield superior
estimates compared to the ones obtained from country-specific measures of communication
infrastructure.
3

The paper is organized as follows. We first briefly discuss how communication costs might
influence trade (Section I). We then introduce communication costs into a gravity-type model
that will form the basis of our empirical investigation (Section II). After describing the data used
in this study (Section III), we present the structural estimation results and test the validity of our
findings with alternative model specifications (Section IV). Some concluding remarks are
offered at the end (Section V).
I. Communication costs, trade costs and trade
Recent research suggests that trade costs have a strong influence on the pattern of specialization
and trade. The insights of economic geography models depend critically on the size of trade
costs (Krugman, 1991). Trade costs have also been seen as influencing the choice between trade
and investment (Markusen and Venables, 2000, Brainard, 1998). More recently, Obstfeld and
Rogoff (2000) have argued that the introduction of trade costs helps explain not just the "home
market bias" but a variety of puzzles in the field of international macroeconomics.
In view of this growing prominence, it is surprising that there is limited empirical research on the
determinants of trade costs. The existing literature identifies a range of barriers that separate
nations-distance, time, information, etc.-but then typically focuses only on transport costs.'
Although communication costs figure prominently in intuitive explanations and casual
observations, they have played little role in the formal analysis of trade costs. This paper seeks
to examine whether this neglect matters, and whether the inclusion of the magnitude and
variation of communication costs across partner countries can add value to existing explanations
of the pattern of trade. The explicit inclusion of communication costs could also shed some light
on how far proxies for trade costs such as distance represent the cost of moving goods rather than
the cost of moving information.
Our study focuses on both aggregate bilateral trade and trade in different categories of products.
Rauch (1999) has persuasively argued that the heterogeneity of manufactures along the
dimensions of both characteristics and quality limits the scope for prices to convey all the
lHummels (1999) has undertaken pioneering work in this area.
4

necessary information. Therefore, there is little scope for international commodity arbitrage
either through organized exchanges or "globally scanning" traders. Instead, connections
between buyers and sellers are made through a search process. In facilitating this process, Rauch
emphasizes the importance of proximity and preexisting ties that result in trading networks rather
than markets. We do not doubt that such networks play an important role, but it would seem that
the costs and quality of communication links are also an important determinant of the ease with
which information is transmitted. Since the information and communication needs are much
greater for differentiated goods, trade in these products is likely to be more sensitive to variations
in the costs of communication (Harris, 1995).
Modeling the role of communication costs is not, however, straightforward. For example,
whether conmnunication costs are seen to affect the fixed or variable costs of trade depends on
the role that communication plays in the transaction. If communication is primarily relevant in
facilitating search for trading partners, then its costs could be seen as affecting the fixed or sunk
costs of trading - which is the view Freund and Weinhold (2000) take of the impact of the
Internet and Harris (1995) of communication networks. 2 Communication between the supplier
and consumer is, however, also necessary for other reasons, e.g. transmission of product
specifications and timing of production processes. In many cases, the consumer and producer
often need to interact in order to jointly produce a customized product that has the desired
characteristics. The extent of such interaction evidently depends on the nature of the product,
and could affect both the fixed and variable costs of trade.
We assume, nevertheless, that communication costs affect trade primarily by influencing
variable trade costs between two nations. This assumption allows us to draw on the large
literature that links trade costs to trade performance. Specifically, we can develop a simple
multi-sector model of "impeded" trade that generates testable hypotheses in a gravity type
estimation framework. The gravity equation is widely regarded as a successful device to
empirically model international trade and is well-founded in economic theory.3 In contrast, the
2 Such pre-sale activities as price-negotiations, etc. can also be assumed to affect the fixed costs.
3 Various studies have shown that the gravity equation can be derived from a variety of trade models that can resultin countries' perfectly specializing in a particular good. These models include the simple Ricardian and Heckscher-Ohlin trade theories as well as the newer theories with increasing returns to scale and monopolistic competition.
5

literature on search costs and buyer/seller matching does not offer tractable models that easily
lend themselves to empirical application.
It is not obvious how fixed costs could be incorporated into the gravity framework. While
Freund and Weinhold (2000) argue that the Internet reduces sunk costs of trading, they
eventually estimate an equation that is little different from the standard gravity model. Evans
(2000) does amend the standard model to incorporate fixed trading costs that differ across
producers. The implication is that some producers would not recover the fixed cost of exporting
and so not all output is available to be exported. Empirically, this implies using an appropriately
scaled down level of aggregate output in the gravity equation. Failure to make this adjustment
implies that the variable trade cost term is (dis)credited with the trade impeding impact of fixed
trade costs. This finding in fact supports the approach taken here, because our objective is to
measure the aggregate impact of telecommunications costs rather than to identify the precise
channel through which they act.
II. Introducing communication costs into a gravity type model of bilateral trade
The.purpose of this section is to develop an empirical model that will allow us to empirically
explore how cross-country variations in communication costs affect bilateral trade. We consider
a representative consumer in the importing countryj who maximizes the following utility
function defined on the production of all countries:
u' =J7J n , E k X (1)
where Cyk is countryj's consumption of sector k's good produced by country i, Sk the elasticity
of substitution between any pair of countries' products in sector k, and 13 ,k is a weight parameter.
Preferences are assumed to be Cobb-Douglas over sectors and CES within sectors, whereby P,k
is countryj's (constant) share of expenditure devoted to sector k. Consumers inj derive their
See, for exanple, Anderson (1979), Helpman and Krugman (1985), Bergstrand (1985 and 1989) and Deardorff(1998).
6

income, Y,, from producing domestic products xJk at prices Pik. They face trade cost inclusive
prices of consumption goods t,Jkpik , where the trade cost factor t,ik is assumed to be equal to one
for the domestically produced good and greater than one for foreign produced goods.
Constrained maximization of (1) leads to optimal consumption levels
1 _______k ___
Cyk - Pjk (2)
where pk is an index of trade cost inclusive prices
ll(0-ak)
Pik SWl ,k P,k (3)
Multiplying (2) by the trade cost inclusive price t p,k yields the value of exports from country i
toj in sector k, Tk:
Tk Pjkyjfi,kk k (4)
We assume that the trade cost factor tyk is a function of countryj's ad-valorem tariff as applied
to imports fromj in sector k, taryk, the geographic distance (as a proxy inter alia for transport
costs) between countries i and], D,,, the costs of communication between the two trading
partners, C,,, and the usual set of variables capturing other ties between the exporting and
importing countries (adjacency and common language), E . We choose the following Cobb-
Douglas functional form for the trade cost function: 4
4 Hummels (1999) has pointed out the-counterintuitive implications of a multiplicative trade cost function: theimpact of a percentage change in one trade cost variable depends on the level of the other(s). He proposes a tradecost function in which the individual components enter additively. This functional form has the additionaladvantage that the estimation of the resulting non-linear gravity equation can separately identify the substitutionelasticity and the trade cost parameters. We tried to estimate a similar model using a linear trade cost function
7

tjk = ak (1 + tark)D,j C,, Eyk (5)
Since the import tariff variable is a direct measure of trade costs, the definition of the trade cost
factor implies a proportional relationship between tk and (1 + tarOk). With this assumption, (4)
can be transformed to:
I-erk
TIJ= P/kYfI 6 k Pk a I7k (1 + taryk , (6)
The variables on the right hand side are a mix of exogenous and endogenous variables. To fully
estimate the model, one would need to specify supply conditions. This would complicate the
analysis significantly, as exogenous determinants of trade (technology, factor endowments)
interact with endogenous location effects (firms locate production close to final demand, in order
to minimize on trade costs). However, in this study we are primarily interested in estimating the
effect of communication costs on trade costs and trade substitution. We can therefore proceed by
employing importer and exporter specific dummy variables that account for the country specific
exogenous and endogenous variables, and rely entirely on the bilateral variation in the trade cost
variables to estimate their impact on trade (Hummels, 1999).5 The advantage of this approach is
that our empirical model embeds alternative supply determinants of trade. The resulting gravity
type equation for bilateral trade between i andj in sector k can be expressed as:
hn Tk -A,k + B, + (1- -k ) ln(l + taryk ) +k lnD4 +Xck lnC, + Ek lnE, +e k (7)
where A,k is a set of exporter fixed effects, B,k is set of importer fixed effects, ek is a normally
distributed error term, OD -Sk(l-ok) AX -Yk=(-kk),and E - 2 k(l-ok)-
Obviously, the better substitutes countries' goods are for one another, i.e. the higher the value of
kIk, the greater is the extent to which bilateral trade between the two countries is impeded by
incorporating communication costs. However, we were not able to obtain non-linear least squares estimates for ourestimation sample.
5 Hallack (2001) and Reddings and Venables (2001) use a similar approach in their econometric models of bilateraltrade.
8

trade costs. Thus, while being potentially small compared to the value of trade, international
variations in trade costs can exhibit a strong influence on global trade patterns.6 The estimation
of XD, c C, and Ek does not permit the direct identification of the trade cost elasticities 6k , Yk
and 2k. However, the coefficient on the tariff variable yields an estimate of the substitution
elasticity, which permits indirect imputation of the trade cost elasticities and, in particular, allows
comparison of these elasticities across sectors.
A neat feature of our estimation equation (7) is that the inclusion of exporter and importer fixed
effects can correct for the omission of variables that are country specific (e.g., non-tariff
barriers, differences in inland transportation costs, availability of export finance). In fact, it
could be argued that equation (7), while derived from a specific model, has general application:
any model explaining bilateral trade could be expected to result in an exporter specific effect, an
importer specific effect, and factors determining trade costs between two trading partners. At the
same time, it is important to emphasize that we only measure the effect of trade costs on trade
substitution. We do not capture the possibility that a country with overall high costs of
communication or transport may in total trade less compared to a country where the overall level
of these costs is lower.
III. Data sources
We collected cross-sectional data on the dependent and exogenous variables for the year 1999.
Bilateral trade flows and import tariffs are from the World Bank's World Integrated Trade
Solutions (WITS) database. We work with import data, which are reported on a cost-insurance-
freight (cif) basis and therefore include international freight and insurance charges. Information
on applied bilateral import tariffs accounts for preferential trading arrangements.7 We
constructed our tariff variable as the weighted average bilateral imported tariff over all 4-digit
SITC product groups belonging to the more aggregate product group used in the estimation.
6 This argument is at the core of the study by Obstfeld and Rogoff (2001).
7For a number of countries, tariff data was unavailable for the year 1999. In these instances, we used the yearclosest to the estirnation period. In a few cases, we 'extrapolated' missing bilateral tariffs by taking the average ofan importer's bilateral tariff over a range of source countries.
9

Variation in the importer's tariff across export sources can therefore be due to either trade
preferences or a non-uniform tariff structure combined with a varying composition of bilateral
trade. The latter can be interpreted as a reflection of the 'Armington assumption' employed in
our structural model (i.e., that imports from different sources are imperfect substitutes for one
another).
The distance measure refers to the straight-line distance between nations' capitals and was taken
from the City Distance Calculator provided by VulcanSoft.8 As variables capturing other ties
between exporters and importers, we used the standard set of dummy variables for sharing a
common border and a common language (English, Spanish, French, Portuguese, and Arabic).
We assembled two proxies to capture the communication-related effect of trade costs, each with
certain pros and cons. Our first proxy is the per-minute bilateral calling prices charged in the
importing and exporting countries, as reported in the ITU's Direction of Traffic Statistics.
Current exchange rates from the IMF International Financial Statistics were used to convert the
prices into U.S. dollar values. For each country only the calling prices of the 20 most popular
destinations were listed in the ITU database, which limits the number of observations available
for estimation. Because the simultaneous availability of bilateral price data for the importing
and exporting countries is limited, we tested these two proxies in separate regressions.9
Our second proxy is the product of each country's calling price to the United States. Since the
United States is always among the top 20 destinations, use of this proxy allowed us to
substantially increase the size of the sample. However, the proxy has two drawbacks. First,
calling prices to the United States may not be representative of a country's overall tariff
structure. Secondly, in contrast to the two bilateral calling price variables, the variation in one
country's calling prices across trading partners is not directly measured, but constructed by
multiplying two country-specific variables. The latter approach introduces a bias if the telecom
proxy employed is correlated with other country-specific variables that influence bilateral trade
and if those variables enter the regression equation in a multiplicative functional form.
8 The software can be freely downloaded at www.vulcansoft.com.
9 The sample that includes calling prices for both exporting and importing country has less than 500 observations.Tentative OLS regressions using this small sample led to similar findings as the ones presented in this study
10

Table 1 presents summary statistics on the dependent and independent variables used-in the
empirical analysis. It is interesting to note the large variation in the costs of international
communication. Thus, the 1999 calling price to the United States ranged from 9 cents per
minute for the Netherlands to $8.91 per minute for Syria. Most dramatically, bilateral calling
prices ranged from less than one-tenth of one cent per minute (for a call from Vietnam to several
neighboring countries) to $9.80 per minute (for a call from Syria to Japan).
Tables 2 presents partial correlations among the dependent and independent variables (in natural
logs). Tariffs, distance and communication costs are all negatively correlated with bilateral
trade. The distance term itself is weakly correlated with the "constructed" telecom proxy
(product of U.S. calling prices), but shows a stronger correlation with the bilateral calling prices.
The correlation between the two bilateral calling prices is weak and not statistically significant.
This finding is surprising, as operators at both-ends of a bilateral route face the same accounting
rate. 10 It suggests that differences in factor costs, market structures, elasticities of demand and
pricing regulations play an important role in determining international tariffs. For the purpose of
this study, the weak correlation between the two bilateral calling prices is actually advantageous,
as we can separately assess the role of communication costs incurred by the exporting and
importing country.
IV. Structural estimation results
Aggregate tradeflows
We start by estimating a single-sector version of equation (7), using aggregate bilateral trade in
1999 as the dependent variable and ordinary least squares estimation technique (Table 3). The
coefficient on the tariff variable is negative and statistically significant. The implied substitution
elasticity ranges from -3.3 to -3.8. The coefficients on distance and each of the three telecom
proxies are negative and statistically significant at the 1 percent level. The border and language
'° The accounting rate is the wholesale price negotiated between national telecommunications operators forterminating international calls. It is symmetric in the sense that a carrier from country A faces the same accountingrate for settling traffic in country B as the carrier from country B for settling traffic in country A. See, for example,Yun et al (1997) and Galbi (1 998) for further explanation.

dummy variables either show a significant positive coefficient or are not statistically different
from zero (except on coefficient on Arabic language which shows a significant negative
coefficient). The explanatory power of the model is quite high, with R-squares ranging from
0.809 to 0.927.1'
These estimations were subject to several robustness tests, which are described in the Annex.
We tested a model specification that is closer to the functional constraints imposed by the CES
preferences. We also addressed potential biases stemming from non-random selection of
samples. These additional estimations did not lead to fundamentally different results, but the
coefficients on the "pure bilateral" telecommunications price variables were more stable than the
"constructed bilateral" telecommunications proxy. In view of these findings and their superior
econometric properties, we conclude that the two "pure bilateral" price variables are better
measures of the effect of communication costs on bilateral trade.
Disaggregated trade flows
Our second set of estimates are sectoral gravity equations using trade flows disaggregated
according to the 2-digit SITC classification. 12 We only present estimation results with regard to
the two bilateral calling price variables, distance and the tariff variable (in Table 4 for the
bilateral calling price of the exporting country and in Table 5 for the bilateral calling price of the
importing country). 13 The sectors are sorted by descending value of the ratio of the coefficient
on the bilateral calling price to the coefficient on the tariff variable-the imputed trade cost
elasticity with respect to communications costs. Virtually all estimated coefficients on distance
and calling prices have the expected negative sign and the great majority of the coefficients are
"1 Note that the distance coefficient is smaller in the estimations with the two bilateral calling price variables, forwhich sample sizes are substantially smaller. One explanation could be that the 'pure bilateral' proxies exert astronger offsetting effect on the distance coefficient than the product of calling prices to the U.S. Indeed, runningthe former regression without any telecom proxy yields a distance coefficient that is about 0.2 higher, which equalsapproximately the partial correlation between distance and bilateral calling prices (Table 2a). While the distancecoefficient with a hypothetical 0.2 increase is still smaller than the large sample estimates, it is consistent with thegravity literature, which typically reports distance coefficients around or somewhat above unity (see, for example,Rose (2000) or Limao and Venables (1999)).
12 We excluded two sectors from the estimation ("electric current" and "gas"), because the number of observationsin the concerned 2-digit SITC group was too small to permit meaningful estimations.
13 We also estimated sectoral gravity equations using the product of U.S. calling prices. While the estimatedcoefficients mostly showed the expected signs, the results did not reveal any interesting patterns across sectors. Inview of the inferior econometric properties of this variable, we decided to not present these results here.
12

statistically significant. The coefficients on the tariff variable are also mostly negative and
statistically significant.' 4
The sorting of sectors by the imputed trade cost elasticity suggests that communication costs are
relatively more important in sectors that exhibit a greater extent of product differentiation or low
international transport costs. Examples of these sectors include chemical materials,
pharmaceutical products, specialized machinery. Could it be that communication needs in the
case of differentiated products are greater and that trade in these products is therefore more
sensitive to variations in the costs of communication?
To explore this question more formally, we employed the product classification developed by
Rauch (1999), who divides internationally traded commodities into three groups. The first group
includes all goods that are traded on organized exchanges and consist of homogenous
commodities such as cement, steel or tobacco. The second group includes goods that are not
traded on organized exchanges but nevertheless possess reference prices. This category of goods
still largely consists of homogenous products, such as certain chemicals for which prices are
listed in specialized trade publications. The third product group includes all other commodities
and thus encompasses all differentiated goods for which significant buyer-seller interaction is
necessary.
We estimated sectoral gravity equations using trade flows classified according to Rauch's three
product groups, again confining our estimates to the two bilateral calling price proxies (Table 6).
The results reveal several interesting patterns. First, the estimated coefficient on the tariff
variable is not statistically different from zero in the case of differentiated products, suggesting a
low elasticity of substitution (close to unity). However, it is negative and statistically significant
in the case of reference priced products (only when using the importer's calling price) and
negative, statistically significant and greater in absolute size in the case of products traded over
organized exchanges. Our result is consistent with the expectation that the elasticity of
14 The average value of the tariff variable for the exporter calling price sample is, in fact, substantially larger than thecorresponding value in the comparable one-sector gravity estimation presented in Table 3. This result is consistentwith findings in the literature that substitution elasticities are larger at the sectoral level than at the aggregate level(Hummels, 1999 and Gallaway et al, 2000). However, this 'disaggregation effect' is not found in the importercalling price sample.
13

substitution is larger for more homogenous products, leading to a greater sensitivity of bilateral
trade to changes in trade costs.
Second, the estimated distance coefficients for differentiated products are smaller in absolute
value than the coefficients for reference priced products, and the coefficients on the latter are
again smaller than the ones for products traded over organized exchanges. In other words, in line
with our structural model, the rising substitution elasticity leads to a greater sensitivity of
bilateral trade to distance. This result is in contrast to Rauch (1999) who finds the coefficient on
distance to be larger in absolute value for differentiated products. He argues that the trade-
inhibiting effect of distance is likely to be larger in the case of differentiated products, for which
greater buyer-seller interaction is necessary. 5
Third, the estimated coefficient on the exporter's calling price is not statistically different from
zero for products traded over organized exchanges, suggesting that communication cost
conditions in the exporting country are of little importance for pure homogenous commodities.
Fourth, the impact of the importer's calling price on trade in differentiated products is
substantially larger than on trade in reference priced products and trade in homogenous products.
In fact, we observe an overall 'downward trend' in the coefficient on the telecom proxies as we
move from differentiated to homogenous products. Since our estimated substitution elasticity
shows a reverse 'upward trend,' the implied elasticity of trade costs with respect to the
communication cost proxy is substantially larger for differentiated products than for homogenous
products. These results confirm our initial observations based on the sectoral estimations
described above. In the Annex, we corrected for a possible bias in our estimates for Rauch's
product groups due to a non-random selection of samples, but the results did not change.
15 To test whether this result is due to the inclusion of the communication cost proxy, we excludedtelecommunications costs from our model and reran the regressions in two scenarios. The first, using the entiredataset available in the absence of telecom bilateral prices, reproduced the Rauch finding, i.e. distance seemed tomatter more for differentiated goods. In the second, using only data for which bilateral telecom prices wereavailable, the distance coefficient preserved the pattern observed in our initial regressions including the telecomvariables, except that its overall magnitude was slightly larger. These results suggest that the Rauch result is notrobust to changes in the sample.
14

The sectoral estimates reveal that the importer's calling price consistently has a larger effect than
the exporter's calling price.16 Two explanations are possible. One is that the exporter's
expenditure on international telecommunications is likely to be included in observed trade
values, whereas the importer's expenditure may not be. In the derivation of the econometric
model, we implicitly assumed that trade values are inclusive of all trade costs. A more general
specification would allow for a share of trade costs to be excluded in recorded trade values. It is
easy to verify that in this case the estimated coefficient on the communication cost proxy can be
expressed as:
4c -rk (ak Ck ) v
where ak (0 < ak < 1) is the (geometric) share of communication costs implicitly included in
trade values. Hence, if a larger share of communication costs is part of observed trade values (as
one would expect in the case of the exporter's calling price), the trade-inhibiting effect of
telecommunications is dampened.
The other more speculative explanation is that communication costs affect the fixed costs of
trading, and that the relative impact on exporters and importers differs across the type of
products. Note that if the impact were on the variable costs alone, then who actually pays the
cost would be irrelevant because the incidence of those costs would be ind&pendently given by
the elasticities of demand and supply. With fixed costs of trade, it does matter who actually
pays-even though some costs may be passed through prices. Our findings suggest, for
example, that suppliers play a virtually passive communication role where homogeneous goods
are concerned, and that importers bear a larger burden of communication in the case of
differentiated products.
Alternative specifications
Our results accord with intuition, but we must ensure that the revealed importance of
telecommunications is not attributable to any specification errors in our structural model. Such
16 The larger relative impact of the importer calling price was found for the sectoral estimates in Tables 4 and 5, aswell as for the Rauch product group estimates in Table 6. This difference is also evident when controlling forpossible selection biases in the two samples (see Annex Table A3).
15

errors could be due to omitted variables and endogeneity. In this sub-section, we address each of
these problems to the extent feasible.
First of all, we could have excluded determinants of trade costs that are correlated with
communications costs. Perhaps the most important such omission is the cost of transportation,
which is only imperfectly captured by bilateral distance. Unfortunately, no comprehensive data
source exists for bilateral freight charges. Based on national customs data, Hummels (1999) has
assembled a dataset that includes commodity-specific ad-valorem transport cost figures for six
importing countries (Argentina, Brazil, Chile, New Zealand, United States, and Uruguay). In
spite of the small size of the sample, we tested our model for this set of importing countries for
the year 1994. 17
We introduce the ad-valorem freight variable into the gravity equation (7), by constructing a new
variable of directly measured trade costs, (1 + tar,k + fuk ), which leads to a better estimate of the
substitution elasticity a. Since we only have relatively few observations on the bilateral calling
price variables, we run this regression at the 2-digit SITC level. 18 This is feasible because our
tariff and transport cost variable are available at that level of disaggregation. The drawback with
this procedure is that we implicitly assume that all the independent variables affect each of the 2-
digit SITC product groups in an identical way.' 9
Table 7 presents our estimation results. The tariff plus transport cost variable performs
according to expectations: it has a negative sign and is statistically significant at the 1 percent
level. The implied elasticity of substitution ranges between -5.3 and -6, which in line with the
previous literature (see Hummels, 1999), but larger than in the 'world gravity' model. The
17 We thank David Hummels for sharing the transport cost data. The dataset actually includes Paraguay as a seventhimporting country, but we had to exclude Paraguay due to the unavailability of data on our telecom proxies. Wecomplemented the ITU information with more comprehensive data on the 1994 international calling tariffs for theUnited States, Brazil and Uruguay. These data were provided to us by national regulators and telecom operators.We did not test the 'constructed telecom proxy' of calling prices to the United States, as this variable cannot, bydefinition, be constructed for the United States and would have caused a substantial reduction in the number ofobservations.
18 The regression at the aggregate level could only be run with less than 300 observations and did not producestatistically significant coefficients on the communication cost proxies.
19 Inclusion of product group specific fixed effect could, in principle, account for sectoral heterogeneities, but thisapproach would take us away from our structural estimation equation (7).
16

coefficients on the two telecom variables take the expected negative value, are statistically
significant at the 1 percent level (exporter's calling price) and 5 percent level (importer's calling
price) and are comparable in magnitude to our earlier results.20
The estimated coefficient on distance takes a similar negative value as in Table 3 and is always
statistically significant at the 1 percent level. This result offers an insight to the so-called
'distance puzzle' in explanations of bilateral trade (Loungani et al., 2002): even after explicitly
controlling for transport and communications costs, distance has a strong impeding effect on
bilateral trade. In other words, distance seems to capture trade-inhibiting factors other than
concurrent transport and communication costs. 2 1
A second problem could be that telecommunications costs are endogenous to bilateral trade. For
example, international calling prices may themselves be influenced by bilateral trade flows. One
possibility is that stronger commercial ties and greater telecommunications traffic between two
nations may allow operators to reap economies of scale and lower operating costs. Conversely,
it could be that country pairs with more trade and thus greater communications needs exhibit
lower demand elasticities and this may lead international operators-many of which are still
monopolies-to raise prices substantially above marginal costs.
It is customary to address endogeneity problems by using the instrumental variable approach in a
two stages least squares estimation. In our case, it is not obvious what the appropriate
instruments would be, especially since we wish to capture bilateral variations in our telecom
variables, and the specific nature of the endogeneity problem is not clear. Nevertheless, we
constructed three different instruments: the product of the two trading partners' bilateral
accounting rate with the United States; a dummy variable that is one if there was competition for
20 We also performed Rauch product group estimates, using the transport-cost inclusive dataset. Again, to generatemore variation in the data, we performed these regressions at the 4-digit SITC level, which is the level on which theRauch classification is based. While the importer's calling price is only statistically significant in the case ofdifferentiated goods, the pattern of coefficients emerging for the exporter's calling price suggests thatcommunications costs are most important for reference-priced goods, followed by homogeneous and differentiatedproducts. One important caveat with regard to these results is that they are based on markedly different samplesizes, and so there are doubts about their comparability.
21 The border and language dummies also perform according to prior expectations, although the dummies forSpanish and Portuguese language are not statistically different from zero. R-squares are relatively low, rangingbetween 0.337 and 0.386. This is due to the fact that estimations are performed on disaggregate trade flows w'hichshow greater noise than aggregate trade flows or trade flows belonging to the same product group.
17

international services on both ends of the bilateral route; and the product of a country specific
proxy capturing the extent to which incumbent public telecommunications operators were
privatized.2 2 The three variables performed according to expectations in the first stage
estimation (positive sign for the accounting rate, negative sign for the competition and
privatization proxies), although the privatization variable was not always statistically significant.
The second stage estimation results for the aggregate 'world gravity model' are presented in
Table 8. The coefficient on the instrumented calling prices is significantly negative and much
larger than the estimate in the earlier OLS regression (Table 3), taking a value of -2.806 in the
case of the importer's .calling price.23
These results underline a concern that is in fact also raised by our earlier estimates: the
unexpectedly large impact of telecommunication costs-and trade costs more generally-on
trade. Taken at their face value, our estimates suggest, for example, that a halving of the
importer's calling price leads to a 42.5 percent increase in aggregate bilateral trade. These are
large values even if bilateral communication costs are seen as proxies for the quality and ease of
communication between two nations. The large impact of the trade cost proxies is not new to
our study or to communications costs per se, however. Take the distance coefficient, which is in
line with estimates found in the literature. A doubling of the exporter-importer distance reduces
bilateral trade by up to 50 percent, which can hardly be justified in pure transport cost terms.24
The existing literature offers at least two explanations. One is that trade costs affect bilateral
trade through channels other than the 'simple' trade substitution mechanism underlying the
gravity equation. Hummels (1999) suggests that the trade cost proxies may pick up endogenous
supply responses by firms choosing production locations to minimize trade costs. If endogenous
22 Specifically, the latter variable is defined as one plus the equity share in the incumbent operator that was in privatehands. The data on competition in intemational telecommunications and the extent of privatization was obtainedfrom the ITU-World Bank Telecommunications Policy Database.
23 We also performed instrumental variable regressions for the three 'Rauch' product groups. The coefficients onthe calling price variables are much larger in absolute value than those obtained from the aggregate regression,although the exporter calling price is not always statistically significant.
24 Hummels (1999) provides some estimates of the elasticity of ad-valorem transport costs with respect to distance,ranging between 0.2 and 0.4 depending on the transport mode. Given that transport, on average, does not make upmore than 10 percent of the value of traded goods, this implies an elasticity of the transport cost factor-one plus thead-valorem transport cost-with respect to distance of 0.02 to 0.04, implying a much smaller price premium. Thispoint was originally noted by Grossman (1998).
18

supply effects simply lead to a reallocation of resources between individual sectors k, then they
are captured in our estimation equation.25 However, each individual sector k still lumps together
fairly heterogeneous sub-groups, and so our trade cost proxies may in fact pick up endogenous
location effects operating at a more disaggregate level.26
A second possibility is that our trade cost proxies measure not only trade costs but also
differences in consumer preferences over products from different locations. The utility function
in equation (1) assumes that consumers in all importing countriesj put equal preference weights,
fi,k, on products from the same sources i. A more general specification would allow these
weights to differ across exporting countries. It is easy show that these bilateral weights, 8j,k, are
then not absorbed by the country-specific fixed effects. If these bilateral weights are correlated
with the proxies we took as measuring trade costs alone, then it is possible that the estimated
coefficients in the gravity equation capture the effect of both bilateral trade costs and bilateral
preferences (see Balistrery and Hillberry, 2001). However, while it is plausible that distance and
language proxies are related to bilateral preferences, such a relationship is less obvious in the
case of telecommunication costs.
V. Conclusion
The link between communication costs and the pattern of trade has been based previously more
on intuition than evidence We tested this relationship by incorporating alternative measures of
communication costs in a standard model of bilateral trade. International variations in
communication costs were shown to have a significant influence on trade patterns. Furthermore,
estimates using disaggregated trade data revealed that communication costs have a greater
impact on trade in differentiated products than on trade in homogenous products.
25 Obviously, in the aggregate, one-sector version of the gravity equation there is no room for endogenous supplyresponses.26 Another possibility to the 'simple' substitution mechanism is that trade costs have a fixed, as opposed to avariable character, as already pointed out above. It has been shown that small differences in partner-specific fixedcosts-incurred either by the consumer or the producer-can yield large swings in trade flows (Evans, 2000).
19

The paper should, nevertheless, be seen only as a first step in understanding the role of
communication in trade, and its broader objective is to provoke both theoretical and empirical
research in this area. Several basic questions deserve more detailed attention. What precisely is
the nature of communication between importers and exporters? How does it differ across
product categories, final goods and intermediate, homogeneous and differentiated? How does it
differ for intra-firm trade relative to inter-firm trade? What types of costs are incurred, variable
or fixed? Who bears these costs and when does it matter? Greater information on these issues,
would make it possible to address grander questions, such as the role of communication in
facilitating the development of international production chains, or more generally, influencing
the pattern of global integration.
20

References
Anderson, J.E. (1979). "A Theoretical Foundation for the Gravity Equation." AmericanEconomic Review, 69(1), pp. 106-116.
Balistreri, E. and R. Hillberry. (2001). "Trade Frictions and Welfare in the Gravity Model: HowMuch of the Iceberg Melts?" USITC/OE Working Paper No. 01 - 11 -B.
Bergstrand, J.H. (1985). "The Gravity Equation in International Trade: Some MicroeconomicFoundations and Empirical Evidence." Review of Economics and Statistics, 67, pp. 474-81.
. (1989). "The Generalized Gravity Equation, Monopolistic Competition, and theFactor-Proportions Theory in International Trade." Review of Economics and Statistics,71, pp. 143-53.
Brainard, S. Lael. (1997). "An Empirical Assessment of the Proximity-Concentration Trade-offbetween Multinational Sales and Trade." American Economic Review, 87(4), pp. 520-544.
Deardorff, A.V. (1998). "Determinants of Bilateral Trade: Does Gravity Work in a NeoclassicalWorld?" In J.A. Frankel (ed.), The Regionalization of the World Economy, Chicago: TheUniversity of Chicago Press.
Evans, Carolyn N. (2000). "National Border Effects and Heterogeneous Fixed Costs ofInternational Trade." Mimeo. (Federal Reserve Bank of New York).
Freund, C. and D. Weinhold. (2000). "On the Effect of the Internet on International Trade."International Finance Discussion Papers, No. 693. Board of Governors of the FederalReserve System: Washington, DC.
Galbi, D.A. (1998). "Cross-border Rent Shifting in International Telecommunications."Information Economics and Policy, 9, pp. 515-536.
Gallaway, M., C. McDaniel, and S. Rivera. (2000). "Industry -Level Estimates of U.S.Armington Elasticities." USITC/OE Working Paper No. 00-09-A.
Hallak, J.C. (2001). "The Effect of Cross-Country Differences in Product Quality onInternational Trade Flows." Mimeo. (Harvard University).
Harris, R.G. (1995), Trade and Communication Costs, Canadian Journal of Economics SpecialIssue, 28, S46-S75.
Helpman, E. and Krugman, P.R. (1985). Market Structure and Foreign Trade: IncreasingReturns, Imperfect Competition, and the International Economy. Cambridge: MIT Press.
Hummels, David. (1999). "Towards a Geography of Trade Costs." Mimeo. (University ofChicago).
21

Krugman, Paul. (1991). "Increasing Returns and Economic Geography." Journal of PoliticalEconomy, 99(3), pp. 483-499.
Krugman, Paul. (1995). "Growing World Trade: Causes and Consequences." Brookings Paperson Economic Activity: Macroeconomics, 1, pp. 327-377.
Loungani, Prakash, Ashoka Mody, and Assaf Razin. (2002). "The Global Disconnect: The Roleof Transactional Distance and Scale Economies in Gravity Equations." Mimeo.
Limao, Nuno and Anthony J. Venables. (1999). "Infrastructure, Geographical Disadvantage, andTransport Costs." Policy Research Working Paper, No. 2257. World Bank: Washington,DC.
Markusen, James R. and Anthony J. Venables. (2000). "The Theory of Endowment, Intra-Industry, and Multinational Trade." Journal of International Economics, 52(2), pp. 209-234.
Mattoo, A., R. Rathindran, and A. Subramanian. (2001). "Measuring Services TradeLiberalization and its Impact on Economic Growth: An Illustration." World Bank PolicyResearch Working Paper, No. 2380. World Bank: Washington, D.C.
Obstfeld, M. and K. Rogoff (2000), "The Six Major Puzzles in International Macroeconomics: IsThere a Common Cause?," NBER Working Paper, No. 7777.
Rauch, J.E. (1999). "Networks versus markets in international trade." Journal of InternationalEconomics, Vol. 48, pp. 7-35.
Redding, Stephen and Anthony J. Venables. (2001). "Economic geography and internationalinequality." Centrefor Economic Performance Discussion Paper, No. 495, (LondonSchool of Economics).
Rose, Andrew K. (2000). "One money, one market: the effect of common currencies on trade."Economic Policy, 15(30), pp. 7-46.
Spinanger, D. (2001). "Beyond Eternity: What Will Happen when the ATC Gives Way to MFNPrinciples beyond 2004?" Paper presented at the EU-LDC Conference on Trade andPoverty Reduction, Rotterdam, May 30-31, 2001.
Venables, A.J. (2001). "Geography and International Inequalities: The Impact of NewTechnologies." Journal ofIndustry, Competition and Trade. 1(2), pp. 135-159.
Yun, K.-L., H.-W. Choi, B.-H. Ahn. (1997). "The Accounting Revenue Division in InternationalTelecommunications: Conflicts and Inefficiencies." Information Economics and Policy,9, pp. 71-92.
22

Table 1: Summary statistics
Number of StandardVariable observations Mean deviation Minimum Maximum
Bilateral trade 8,302 614,814 4,631,744 0.001 201,000,000
Distance 11,554 7,868 4,351 78 19,920
Weighted average tariff 8,614 0.099 0.115 0.000 3 270
Bilateral calling price 12,769 5.052 2.812 1.000 9.000
Calling price to US 8,588 1.293 1.207 0.092 8.909
Note. Dataset covers bilateral trade of 107 countries.
Table 2: Partial correlation between variables
Product ofExporter Importer calling
Bilateral calling calling prices totrade Distance price price US Tariff
Bilateral trade 1
Distance -0.192 1
Exporter calling price -0.316 0.236 1
Importer calling price -0.450 0.236 0.128 1
Product of calling prices to -0.502 0.080 0.273 0.273 1UsTariff -0.195 0.039 0.036 0.117 0.269 1
Notes All variables are expressed in natural logarithms. Bolded figures are statistically significant at the Ipercent level.
23

Table 3: Gravity model using aggregate trade flows, 1999
Dependent variable: T,, (1) (2) (3)Distance -0.651*** -0.582*** -1.085***
(-9.14) (-9.93) (-24.04)
Tariff -2.342* -2.693*** -2.801***(-1.89) (-2.89) (-3.47)
Bilateral calling price of exporter -0.943***(-5.90)
Bilateral calling price of importer -0.848***(-5.79)
Product of calling prices to the US -2.325***(-23.44)
Common border Correct Correct Correct
Language dummiesEnglish Correct Correct CorrectSpanish Insignificant Insignificant CorrectPortuguese Insignificant Insignificant InsignificantFrench Insignificant Correct CorrectArabic Insignificant Wrong Correct
Number of observations 1,231 1,116 4,179
F-statistic 385.37*** 1463.79*** 127.8***R-square 0.902 0.927 0.809
Notes: OLS regression with exporter and importer fixed effects and White robust standard errors. t-statistics in parentheses. *** denotes significance at the I percent level; ** denotes significance at the 5percent level; * denotes significance at the 10 percent level. 'Correct' indicates a dummy variable as theexpected positive sign and is statistically significant at least at the 10 percent level; 'insignificant' indicates adummy variable is not statistically different from zero; and 'wrong' indicates a dummy variables has awrong negative sign and is statistically significant at least at the 10 percent level.
24

Table 4: Sectoral estimates using the bilateral calling price of the exporting country, 1999
BilateralSITC2 calling Ratio callingcode Sector No. of obs Distance price Tariff price to tariff
22 Oil seeds and oleaginous fruit 700 -0.655 -1.114 -0.743 1.50071 Power generating machinery/ equipment 951 -0.774 -0.724 -0.514 1.409
12 Tobacco and tobacco manufactures 671 -0.556 -0.826 -0.739 1.11773 Metalworking machinery 841 -0.618 -0.700 -0.707 0.990
54 Medicinal and pharmaceutical products 884 -0.614 -1.358 -1.490 0.911
62 Rubber manufactures,n.e.s. 928 -0.603 -1.256 -2.093 0.60056 Fertilizers, manufactured 569 -0.749 -1.491 -2.992 0.49855 Essential oils & perfume materials 975 -0.925 -1.071 -3.564 0.30172 Specialized machinery 1,012 -0.758 -0.761 -3.047 0.25052 Inorganic chemicals 834 -0.870 -1.061 -4.487 0.23677 Electrical machinery/apparatus n.e.s. 1,077 -0.888 -0.720 -3.116 0.23159 Chemical materials and products. 894 -0.904 -0.534 -2.431 0.2202 Dairy products and birds' eggs 588 -0.864 -0.923 -4.242 0.218
84 Articles of apparel/clothing accessories 1,098 -0.967 -0.644 -2.975 0.21774 General industrial machinery 1,054 -0.641 -0.897 -5.123 0.17568 Non-ferrous metals 878 -0.987 -0.965 -5.984 0.16169 Manufactures of metal 1,073 -0.746 -0.889 -5.540 0.1609 Miscel.edible products and preparations 861 -0.858 -0.840 -5.471 0.1547 Coffee, tea, cocoa, spices 1,024 -0.646 -0.431 -2.825 0.152
41 Animal oils and fats 458 -0.430 -1.051 -6.961 0.15151 Organic chemicals 870 -0.513 -0.847 -5.791 0.14657 Explosives and pyrotechnic products 381 -0.452 -1.093 -7.639 0.143
4 Cereals and cereal preparations 854 -0.986 -0.653 -4.635 0.14163 Cork and wood manufactures 1,046 -0.822 -0.931 -7.078 0.13233 Petroleum, petroleum products 828 -1.588 -1.296 -10.364 0.12558 Artif.resins,plastic materials 878 -0.823 -1.264 -10.377 0.12285 Footwear 881 -0.741 -0.797 -6.603 0.12128 Metalliferous ores and metal scrap 819 -1.148 -0.728 -6.189 0.118
67 Iron and steel 877 -1.028 -0.810 -6.922 0.1176 Sugar, sugar preparations and honey 841 -0.939 -0.552 -4.786 0.11561 Leather and leather manufactures 919 -0.684 -0.828 -7.186 0.115
82 Furniture and parts thereof 1,023 -0.711 -0.818 -7.265 0.11321 Hides,skinsandfurskins,raw 601 -0.611 -0.336 -3.144 0.1075 Vegetables and fruit 1,067 -0.670 -0.892 -8.761 0.102
66 Non-metallic mineral manufactures 1,085 -0.615 -0.703 -7.060 0.10087 Professional & scientific instruments 1,018 -0.598 -0.692 -7.194 0.09653 Dyeing, tanning and coloring materials 840 -0.637 -0.853 -9.117 0.0941 Meat and meat preparations 661 -1.036 -0.461 -5.031 0.092
64 Paper, paperboard, paper-pulp/board 942 -1.082 -1.149 -12.985 0.08865 Textile yarn, fabrics, made-upart. 1,108 -0.723 -0.832 -9.428 0.08889 Miscellaneous manufactured articles, nes 1,170 -0.914 -0.375 -4.353 0.08675 Office machines/data processing equip. 999 -0.703 -0.707 -8.239 0.08683 Travel goods and handbags 921 -0.735 -0.414 -4.949 0.084
25

BilateralSITC2 calling Ratio callingcode Sector No. of obs Distance price Tariff price to tariff
3 Fish,crustaceans,mollucs, 967 -0.796 -0.430 -5.578 0.07781 Samtary, heating and lighting fixtures 873 -0.842 -0.619 -8.154 0.0760 Live animals chiefly for food 474 -0.885 -0.597 -8.088 0.074
32 Coal, coke and briquettes 437 -0.768 -0.888 -12.556 0.07188 Photographic and optical goods, watches 939 -0.506 -0.305 -4.855 0.06376 Telecom. and sound recording apparatus 1,023 -0.680 -0.542 -8.958 0.06042 Fixed vegetable oils and fats 698 -0.369 -0.662 -11.211 0.05926 Textile fibres and their wastes 923 -0.743 -0.307 -5.592 0.055
27 Crude fertilizers and crude materials 916 -1.089 -0.331 -11.797 0.02825 Pulp and waste paper 519 -1.489 -0.180 -19.625 0.00943 Animal-vegetable oils-fats 614 -1.002 0.134 -2.981 n/a23 Crude rubber (incl. synthetic/reclaimed) 616 -0.825 -0.111 1.284 n/a
78 Road vehicles (incl. air cushion vehicles) 996 -0.969 -0.832 2.721 n/a79 Other transport equipment 801 -0.727 -1.006 3.081 n/a24 Cork and wood 893 -1.018 -0.418 0.737 n/a
29 Crude animal and vegetable materials 1,037 -0.620 -0.986 1.327 n/aII Beverages 881 -0.614 -0.374 0.327 n/a8 Feeding stuff for animals 765 -0.758 -0.953 0.266 n/a
Average: 859 -0.795 -0.749 -5.243 0.098
Notes OLS regression with exporter and importer fixed effects and White robust standard errors. t-statistics inparentheses. * ** denotes significance at the I percent level; ** denotes significance at the 5 percent level; * denotessignificance at the 10 percent level.
26

Table 5: Sectoral estimates using the bilateral calling price of the importing country, 1999
BilateralSITC2 calling Ratio callingcode Sector No. of obs Distance price Tariff price/tariff
11 Beverages 980 -0.509 -1.782 -0.169 10.557
59 Chemical materials and products, n.e.s. 1,070 -0.814 -1.612 -0 164 9.85829 Crude animal and vegetable materials 994 -0.777 -0.741 -0.263 2.822
82 Furniture and parts thereof 1,069 -0.986 -1.020 -0.383 2.664
8 Feeding stuff for animals 882 -0.833 -1.707 -0.726 2.35251 Organic chemicals 1,031 -0.441 -1.710 -1.018 1.68041 Animal oils and fats 597 -0.837 -1.296 -1.707 0.759
55 Essential oils & perfume materials 1,074 -0.727 -1.945 -2.797 0.695
62 Rubber manufactures, n.e.s. 1,073 -0.819 -1.447 -2.096 0.69023 Crude rubber (incl. synthetic/reclaimed) 789 -0.828 -1 196 -2.177 0.549
6 Sugar, sugar preparations and honey 973 -1.089 -1.650 -3.035 0.544
9 Miscel.edible products and preparations 1,038 -0.916 -1.987 -3.683 0.54067 Iron and steel 1,061 -0.907 -1.588 -2.988 0.532
26 Textile fibres and their wastes 987 -1.110 -0.764 -1.463 0.522
84 Articles of apparel, clothing accessories 1,077 -0.911 -1.112 -2.143 0.519
52 Inorganic chemicals 1,032 -0.775 -1.592 -3.165 0.503
7 Coffee, tea, cocoa, spices 990 -1.074 -1.343 -2.851 0.471
68 Non-ferrous metals 1,030 -0.936 -1.827 -4.148 0.441
88 Photographic/ optical goods, watches 1,048 -0.615 -1.761 -4.010 0.43924 Corkandwood 814 -0.851 -0.925 -2.145 0.431
58 Artif.resins,plastic materials 1,060 -0.851 -2.099 -5.169 0.40666 Non-metallic mineral manufactures 1,091 -0.655 -1.274 -3.616 0.352
28 Metalliferous ores andmetal scrap 788 -0.788 -0.883 -2.541 0.348
65 Textile yarn,fabrics,made-upart. 1,095 -0.843 -1.150 -3.446 0.334
2 Dairyproductsandbirds'eggs 853 -1.075 -1.375 4.151 0.331
61 Leather, leather manufactures 939 -0.696 -1.212 -3.927 0.30985 Footwear 981 -0.764 -1.595 -5.186 0.30827 Crude fertilizers and crude materials 1,012 -1.084 -1.360 4.443 0.306
22 Oil seeds and oleaginous fruit 725 -1.279 -0.667 -2.459 0.27112 Tobacco and tobacco manufactures 748 -0.548 -1.045 -4.034 0.259
83 Travel goods and handbags 995 -0.673 -1.046 -4.071 0.257
4 Cereals and cereal preparations 1,020 -I 020 -1.845 -7.210 0.2563 Fish, crustaceans, mollucs, 891 -0.874 -1.164 -4.643 0.251
I Meat and meat preparations 813 -1.399 -1.024 -4.196 0.24463 Cork and wood manufactures 1,033 -1.007 -0.812 -3.478 0.23464 Paper, paperboard, paper-pulp/board 1,081 -1.165 -1.521 -6.978 0.21833 Petroleum and petroleum products 1,022 -1.543 -1.218 -5.686 0.214
81 Sanitary, heating and lighting fixtures 1,023 -0.970 -1.112 -5.584 0.199
75 Office machines & data process. equip. 1,061 -1.105 -0.907 4.581 0.198
42 Fixed vegetable oils and fats 876 -1.145 -0.852 -4.334 0.197
79 Other transport equipment 932 -0.870 -0.830 -4.584 0.181
56 Fertilizers 796 -1.260 -0.891 -5.380 0.16657 Explosives and pyrotechnic products 521 -0.328 -1.056 -6.609 0.160
27

BilateralSITC2 calling Ratio callingcode Sector No. of obs Distance price Tariff price/tariff
5 Vegetables and fruit 1,026 -1.153 -0.587 -3.848 0.1530 Live animals chiefly for food 572 -0.966 -0.859 -5.682 0.151
76 Telecom. &sound recording apparatus 1,070 -0.813 -0.811 -5.512 0.14721 Hides, skins and furskins 562 -0.554 -0.673 -4.906 0.13743 Animal-vegetable oils-fats 790 -1.183 -0.359 -4 195 0.08632 Coal, coke and briquettes 496 -0.881 -1.103 -25.908 0.04325 Pulp and waste paper 629 -0.983 -0.771 6.727 n/a87 Professional & scientific instruments 1,066 -0.556 -1.388 6.035 n/a73 Metalworking machinery 1,003 -0.755 -1.457 4.368 n/a72 Specialized machinery 1,083 -0.674 -1.246 3.578 n/a89 Miscellaneous manufactured articles 1,108 -0.742 -1.214 1.909 n/a53 Dyeing, tanning and coloring materials 1,044 -0.814 -1.690 1.999 n/a69 Manufactures of metal, n.e.s. 1,101 -0.764 -1.470 1.539 n/a77 Electrical machinery & appliances 1,096 -0.661 -1.338 0.853 n/a78 Road vehicles 1,095 -0.864 -1.651 1.024 n/a74 General industrial machinery 1,093 -0.773 -0.970 0.535 n/a54 Medicinal and pharmaceutical products 1,070 -0.379 -1.791 0.356 n/a71 Power generating machinery 1,054 -0.543 -1.399 0.187 n/a
Average: 950 -0.865 -1.258 -2.760 0.904
Notes: OLS regression with exporter and importer fixed effects and White robust standard errors. t-statistics inparentheses. *** denotes significance at the I percent level; ** denotes significance at the 5 percent level; * denotessignificance at the 10 percent level.
28

Table 6: Trade in differentiated versus homogenous goods, 1999
Products tradedDifferentiated Reference priced over organized
products products exchanges
Dependentvariable: T,1 (1) (2) (1) (2) (1) (2)
Distance -0.714*** -0.573*** -0.892*** -0.834*** -1.061*** -I.136***(-9.35) (-9.11) (-9.43) (-9.02) (-8.67) (-10.28)
Tariff 0.793 0.063 -0.440 -1.793*** -3.794* -2.998***(0.72) (0.06) (-0.38) (-2.41) (-1.87) (-3.22)
Bilateral calling -0.750*** -0.814*** -0.383price of exporter (-4.71) (4.08) (-1.42)
Bilateral calling -1.022*** -0.793*** -0.818***price of importer (-6.82) (-3.14) (-3.54)
Common border Correct Correct Correct Correct Correct Correct
Language dummiesEnglish Correct Correct Correct Correct Insignificant InsignificantSpanish Insignificant Correct Insignificant Insignificant Insignificant InsignificantPortuguese Correct Insignificant Insignificant Insignificant Insignificant CorrectFrench Correct Correct Correct Insignificant Insignificant InsignificantArabic Insignificant Insignificant Insignificant Insignificant Insignificant Insignificant
Number of 1,224 1,117 1,197 1,110 1,148 1,083observationsF-statistic 212.22*** 735.64*** 185.05*** 381.37*** 236.17*** 87.68***
R-square 0.917 0.932 0.842 0.883 0.726 0.790
Notes' OLS regression with exporter and importer fixed effects and White robust standard errors. t-statisticsin parentheses. *** denotes significance at the 1 percent level; ** denotes significance at the 5 percent level;* denotes significance at the 10 percent level. The classification of product groups is based on Rauch (1999).'Correct' indicates a dummy variable as the expected positive sign and is statistically significant at least at the10 percent level; 'insignificant' indicates a dummy variable is not statistically different from zero; and'wrong' indicates a dummy variables has a wrong negative sign and is statistically significant at least at the10 percent level.
29

Table 7: Transport cost inclusive gravity model, 1994
Dependent variable: T,, (1) (2)Distance -0.645*** -0.678***
(-6.01) (-7.64)
Tariff + Transport costs -5.080*** -4.309***(-9.51) (-13.99)
Bilateral calling price of exporter -0.924***(-3.10)
Bilateral calling price of importer -0.543**(-2.50)
Common border Correct Correct
Language dummiesEnglish Correct CorrectSpanish Insignificant InsignificantPortuguese Insignificant Insignificant
Number of observations 4,932 10,798
F-statistic 45.94*** 125.90***R-square 0.337 0.386
Notes: OLS regression with exporter and importer fixed effects and White robust standard errors. t-statistics inparentheses. *** denotes significance at the 1 percent level; ** denotes significance at the 5 percent level; *denotes significance at the 10 percent level. 'Correct' indicates a dummy variable as the expected positive signand is statistically significant at least at the 10 percent level; 'insignificant' indicates a dummy variable is notstatistically different from zero; and 'wrong' indicates a dummy variables has a wrong negative sign and isstatistically significant at least at the 10 percent level.
30

Table 8: Gravity model using aggregate trade flows, 1999 (IV estimation)
Dependent variable: T,j (1) (2)Distance -0.855*** -0.788***
(-13.69) (-16.82)
Tariff -3.037** -2.428***(-2.17) (-2.58)
Bilateral calling price of exporter -1.673**(-2.20)
Bilateral calling price of importer -2.806***(-4.78)
Product of calling prices to the USCommon border Correct Correct
Language dummiesEnglish Correct CorrectSpanish Insignificant CorrectPortuguese Insignificant InsignificantFrench Insignificant CorrectArabic Insignificant Wrong
Number of observations 1,187 1,063
F-statistic 17031.30*** 1685.02***R-square 0.899 0.924
Notes Second stage instrumental variable regression with exporter and importer fixed effects and Whiterobust standard errors. t-statistics in parentheses. *** denotes significance at the I percent level; ** denotessignificance at the 5 percent level; * denotes significance at the 10 percent level. 'Correct' indicates a dummyvariable as the expected positive sign and is statistically significant at least at the 10 percent level;'insignificant' indicates a dummy variable is not statistically different from zero; and 'wrong' indicates adummy variables has a wrong negative sign and is statistically significant at least at the 10 percent level.Bilateral calling price variables are fitted values from a first stage regression, using as instruments the productsof accounting rates and proxies for privatization and competition in the provision of international telephoneservices (as explained in text).
31

Data Annex
List of countries included in the econometric analysis, using the 1999 trade data:
ALGERIA b GUINEA b PAPUA NEW GUINEA C
ANGOLA8a' GUINEA-BISSAU 8' PARAGUAY bARGENTINA b GUYANAat PERUb
AUSTRALIA b HAITI 8 PHILIPPINES bAUSTRIA b HONDURAS b POLANDbBANGLADESH' HUNGARY' PORTUGALbBELGIUM a C ICELANDb ROMANIA b
BENIN b INDIA " SENEGAL C
BOLIviA b INDONESIA b SIERRA LEONE
BRAZIL b IRAN, ISLAMIC REP. OF b SINGAPORE b
BURKINA FASO ' IRELAND b SOUTH AFRICA bBURUNDI a ISRAEL C SPAIN b
CAMEROONb ITALYb SRI LANKA bCANADA" JAMAICA' SWEDENbCENTRAL AFRICAN REP.a c JAPAN b SWIERLAND b
CHAD a' KENYA' SYRIAN ARAB REP."
CHILE C KOREA b TAIWAN, CHINA b
CHINA. HONG KONG b LIBERIA a TANZANIA b
CHINA. MAINLAND' MADAGASCARb THAILAND)'
COLOMBIA b MALAWI ' TOGObCONGO, REPUBLIC OF c MALAYSIA b TRINIDAD AND TOBAGOCOSTA RICA ' MALI c TUNISIA'
COTE D'IVOIRE b MALTA d TURKEY bDENMARKb MAURITIUS b UGANDA C
DOMINICAN REPUBLICat MEXICO b UNITED ARAB EMIRATES a c
ECUADOR b.C MOROCCOb UNITED KINGDOM b
EGYPT bC MOZAMBIQUE b UNITED STATES c
EL SALVADORc MYANMAR '- URUGUAYb
ETHIOPIA' NEPAL VENEZUELA'
FINLAND b NETHERLANDSb VIETNAM "cFRANCE b NEW ZEALAND b YEMEN, REPUBLIC OF C
GABON "c NICARAGUA b ZAMBIA a
GAMBIA, THE NiGER c ZIMBABWE b
GERMANY" NIGERIA b
GHANA' NORWAYb
GREECE' PAKISTAN b
GUATEMALAb PANAMA b
Notes:aExporter, but not importer;b Country reports data on bilateral telecom prices, and is reported as destination for the same variable in reports by atleast one other country;c Country does not report data on bilateral telecom prices, but is reported as destination for the same variable inreports by at least one other country;
d Country reports data on bilateral telecom prices, but is not reported as degtination for the same variable in reportsby other countries.
32

Annex: Robustness tests
In this annex, we present additional econometric estimates to assess how robust our findings are
to earlier years of estimation, additional regressors, and alternative model specifications.
First, in a one-sector setup, our model can be extended to yield the well-known gravity equation
with unit-elastic income terms. The purpose of this exercise is to test the robustness of our
estimation equation (7) vis-a-vis an alternative specification that is closer to the functional
constraints imposed by the CES preferences in equation (1).27
Dropping the super/subscript k and normalizing each country's product price, p,, at unity, we
can transform equation (4) to:
TV= yw I ( 4|, (Al)
h Yw E48gtig
where yW denotes world GDP.28 Similar to the multi-sector models, we can account for country
specific variables by employing exporter and importer specific dummy variables. But we can
preserve the unit-elastic income terms by specifying our estimation equation in terms of the share
of bilateral trade in the product of the two trading partners' GDPs:
Int KT = A;+B, +(1-a)(l+tar,,q)+DlnDa + X lnC,, +E lnEa +c, (A2)
27 Note that structural derivations of the gravity equations do not always predict a unit-elastic effect of the twoincome terms. See, for example, Anderson (1979) and Bergst-and (1985 and 1989).
28 See Deardorff(1998). In equation (Al), bilateral trade depends on incomes and a complex term which capturesthe trade inhibiting effect of bilateral trade costs. Specifically, the term in the square bracket says that if importingcountryj's relative trade cost with country i is greater than an average of all demander's relative trade costs with i,then exports from i toj will be correspondingly smaller. The trade inhibiting effect depends crucially on theelasticity of substitution a . If a = I (the Cobb-Douglas case), the term in the square bracket is equal to one andexports will simply be reduced proportional to the trade cost factor to a level below the "frictionless" benchmark.
33

Table Al shows the results of estimating equation (A2).29 The overall fit of the regression is
poorer than in Table 3, with R-squares ranging from 0.45 to 0.73. Nonetheless, it is remarkable
that the estimated coefficients on the tariff variable, distance and the two "pure bilateral" calling
prices remain largely unchanged. By contrast, the coefficients on the "constructed bilateral"
telecom proxy is smaller in value. The latter finding may be explained by the variable picking
up the effect of the excluded GDP terms in the regression with unconstrained income elasticities.
Second, our estimations may suffer from a biased selection of samples, especially the regressions
with the bilateral calling price variables which only encompass between 1,000 and 1,200
observations. We distinguish between two types of sample selection biases: zero trade flows
(which are, by definition, excluded in a log-linear model specification) and the availability of
data on our telecom proxy. We employ a Heckman sample selection model to correct for a
possible estimation bias in the basic OLS regression. Specifically, we estimate two first-stage
probit equations-one for the existence of positive trade flows and one for the availability of
telecom data-and include two selectivity correction variables in the main regression. 30 Our
explanatory variables in the probit equations are GDP, population and dummies for being a
landlocked or island economy of both the exporting and importing country as well as geographic
distance and dummy variables for sharing a common language.
Table A2 presents the second stage estimation results of the sample selection model.31 The
estimated coefficients are similar to the ones obtained in the simple OLS regression (Table 3). A
notable exception is the coefficient on the product of calling prices to the US, which is much
smaller in size, but still significant at the 1 percent level. None of the selectivity correction
parameters are statistically significant, except the parameter for non-zero trade flows in the
regression using the product of calling prices to the United States. This result suggests a sample
selection bias in the larger sample estimates that use the product of US calling prices as the
telecom proxy. Correcting for this bias reduces the size of the coefficient on this proxy to a level
comparable to the other two calling price proxies.
29 Countries' GDPs were taken from the World Bank's World Development Indicators.
30 In doing so, we assume that the error terms in the two probit regressions are uncorrelated.
31 The first stage probit regressions overwhelmingly show the expected signs and are mostly statistically significant.
34

We 'also estimated a sample selection model for the sectoral gravity models using the Rauch
classification of products. The second stage estimation results are presented in Table A3. The
coefficients on the tariff variable are similar to the simple OLS regressions (Table 6). In the case
of differentiated goods the point estimate is now close to zero for both samples, suggesting a
substitution elasticity of close to unity. The coefficients on distance are somewhat lower
compared to the simple OLS regression (Table 6), whereas the telecom coefficients remain
largely unchanged. The conclusions regarding the relative importance of communications costs
across the three Rauch product groups remain unchanged. In particular, we observe a
'downward trend' in the coefficient on the importer's calling price as we move from
differentiated to homogenous products, whereas the estimated substitution elasticity shows a
'reverse' upward trend. Moreover, the exporter's calling price does not have a statistically
significant impact for products traded over organized exchanges. Only three out of twelve
sample correction parameters are statistically significant at the 1 percent level and two more
parameters are significant at the 10 percent level. Overall, these findings suggest that potential
biases from a non-random selection of samples are likely to be small.
Finally, we tested how robust our findings concerning trade in differentiated versus homogenous
products are to the product classification used. Rauch (1999) provides an alternative "more
liberal" classification, which maximizes the number of commodities that are classified as either
organized exchange or reference priced. The OLS estimation results using the "more liberal"
classification (not presented here) were very similar to the ones presented in Table 6 and
confirme,d all the findings discussed in the text.
35

Table Al: Gravity model using aggregate trade flows(unit-elastic income elasticities), 1999
Dependent variable: T,/I(YY) (1) (2) (3)Distance -0.665*** -0.575*** -1.065***
(-9.57) (-9.79) (-23.38)
Tariff -2.454* -2.331*** -2.836***(-1.97) (-2.48) (-3.45)
Bilateral calling price of exporter -0.846***(-5.47)
Bilateral calling price of importer -0.774***(-5.28)
Product of calling prices to the US -0.572***(-5.77)
Common border Insignificant Correct Correct
Language dummiesEnglish Correct Correct CorrectSpanish Insignificant Insignificant CorrectPortuguese Insignificant Insignificant InsignificantFrench Insignificant Correct CorrectArabic Insignificant Insignificant Correct
Number of observations 1,209 1,083 4,079
F-statistic 239.54*** 1048.42*** 25.27***R-square 0.731 0.719 0.451
Notes: OLS regression with exporter and inporter fixed effects and White robust standard errors. t-statistics in parentheses. *** denotes significance at the 1 percent level; ** denotes significance at the 5percent level; * denotes significance at the 10 percent level.
36

Table A2: Sample selection model using aggregate trade flows, 1999
Dependent variable: T,, (1) (2) (3)Distance -0.415*** -0.507*** -0.990***
(-3.13) (-3.93) (-14.32)
Tariff -2.529*** -2.319*** -2.634***(-2.06) (-2.46) (-3.26)
Bilateral calling price of exporter -0.870***(-5.50)
Bilateral calling price of importer -0.748***(-5.07)
Product of calling prices to the US -0.785***(-8.86)
Common Border Correct Correct Correct
Language DummiesEnglish Correct Correct InsignificantSpanish Insignificant Insignificant CorrectPortuguese Insignificant Insignificant CorrectFrench Insignificant Correct CorrectArabic Insignificant Insignificant Correct
Selectivity correction (positive -1.365 0.862 -2.586***trade) (-1.49) (1.18) (-7.14)
Selectivity correction (telecom data) -0.407 -0.199 -0.012(-1.57) (-0.81) (-0.01)
Number of observations 1,209 1,083 4,079(10,710) (10,710) (10,710)
F-statistic 976.34*** 614.83*** 144.44***
R-square 0.907 0.929 0.814
Notes: Second stage OLS regression with exporter and importer fixed effects and White robust standarderrors. t-statistics in parentheses. *** denotes significance at the I percent level; ** denotes significance atthe 5 percent level; * denotes significance at the 10 percent level. The number of observations in thebrackets indicate the number of observations used in the two probit equations.
37
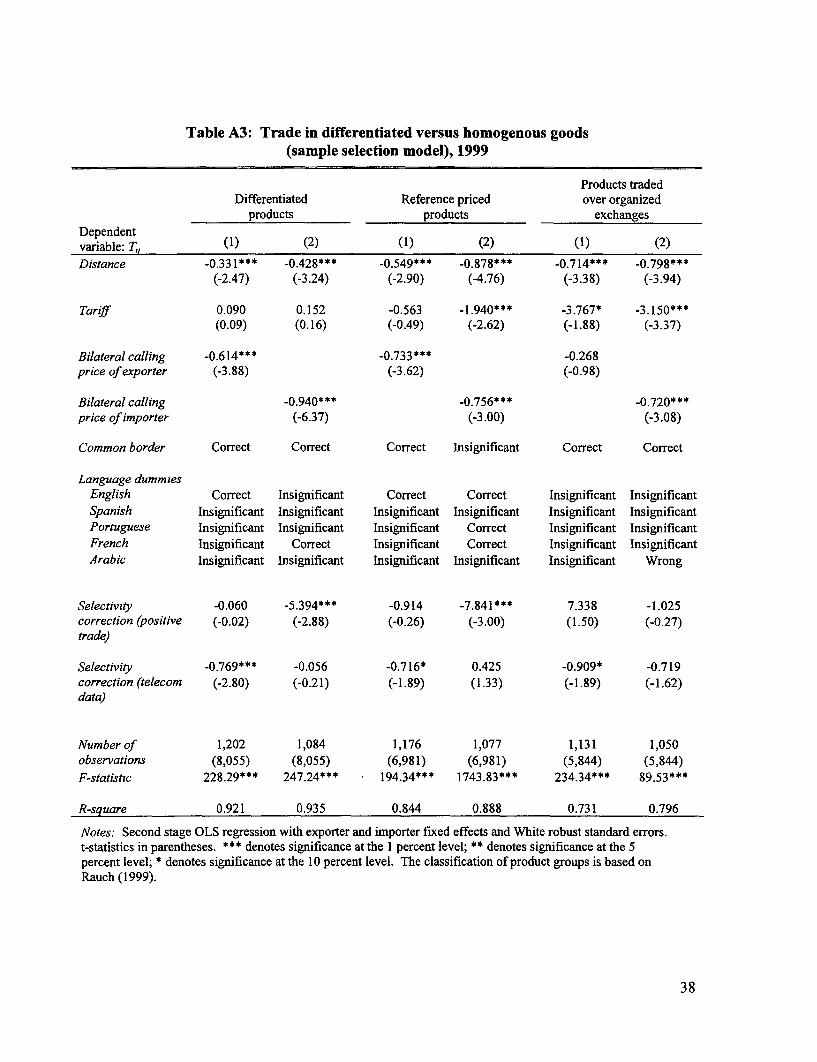
Table A3: Trade in differentiated versus homogenous goods(sample selection model), 1999
Products tradedDifferentiated Reference priced over organized
products products exchangesDependentvariable: T, (1) (2) (1) (2) (1) (2)Distance -0.331*** -0.428*** -0.549*** -0.878*** -0.714*** -0.798***
(-2.47) (-3.24) (-2.90) (-4.76) (-3.38) (-3.94)
Tarif 0.090 0.152 -0.563 -1.940*** -3.767* -3.150***(0.09) (0.16) (-0.49) (-2.62) (-1.88) (-3.37)
Bilateral calling -0.614*** -0.733*** -0.268price of exporter (-3.88) (-3.62) (-0.98)
Bilateral calling -0.940*** -0.756*** -0.720***price of importer (-6.37) (-3.00) (-3.08)
Common border Correct Correct Correct Insignificant Correct Correct
Language dummiesEnglish Correct Insignificant Correct Correct Insignificant InsignificantSpanish Insignificant Insignificant Insignificant Insignificant Insignificant InsignificantPortuguese Insignificant Insignificant Insignificant Correct Insignificant InsignificantFrench Insignificant Correct Insignificant Correct Insignificant InsignificantArabic Insignificant Insignificant Insignificant Insignificant Insignificant Wrong
Selectivity -0.060 -5.394*** -0.914 -7.841*** 7.338 -1.025correction (positive (-0.02) (-2.88) (-0.26) (-3.00) (1.50) (-0.27)trade)
Selectivity -0.769*** -0.056 -0.716* 0.425 -0.909* -0.719correction (telecom (-2.80) (-0.21) (-1.89) (1.33) (-1.89) (-1.62)data)
Number of 1,202 1,084 1,176 1,077 1,131 1,050observations (8,055) (8,055) (6,981) (6,981) (5,844) (5,844)F-statistic 228.29*** 247.24*** 194.34*** 1743.83*** 234.34*** 89.53***
R-square 0.921 0.935 0.844 0.888 0.731 0.796
Notes: Second stage OLS regression with exporter and importer fixed effects and White robust standard errors.t-statistics in parentheses. *** denotes significance at the I percent level; ** denotes significance at the 5percent level; * denotes significance at the 10 percent level. The classification of product groups is based onRauch (1999).
38


Policy Research Working Paper Series
ContactTitle Author Date for paper
WPS2910 Boondoggles and Expropriation Philip Keefer October 2002 P Sintim-AboagyeRent-Seeking and Policy Distortion Stephen Knack 38526when Property Rights are Insecure
WPS2911 Micro-Level Estimation of Welfare Chris Elbers October 2002 P SaderJean 0 Lanjouw 33902Peter Lanjouw
WPS2912 Short-Run Pain, Long-Run Gain Graciela Laura Kaminsky October 2002 E KhineThe Effects of Financial Sergio L Schmukler 37471Liberalization
WPS2913 Financial Development and Dynamic Inessa Love October 2002 K LabrieInvestment Behavior. Evidence from Lea Zicchino 31001Panel Vector Autoregression
WPS2914 The Impact of Cash Budgets on Hinh T Dinh October 2002 D SidibePoverty Reduction in Zambia A Case Abebe Adugna 35074Study of the Conflict between Well- Bernard MyersIntentioned Macroeconomic Policyand Service Delivery to the Poor
WPS2915 Federal Politics and Budget Deficits Stuti Khemani October 2002 H SladovichEvidence from the States of India 37698
WPS2916 Ex-ante Evaluation of Conditional Fran,ois Bourguignon October 2002 P SaderCash Transfer Programs. The Case Francisco H G Ferreira 33902of Bolsa Escola Phillippe G Leite
WPS2917 Economic Development, Competition Bernard Hoekman October 2002 R MartinPolicy, and the World Trade Petros C Mavroidis 39065Organization
WPS2918 Reducing Agricultural Tariffs versus Bernard Hoekman October 2002 R. MartinDomestic Support What's More Francis Ng 39065Important for Developing Countries? Marcelo Olarreaga
WPS2919 Financial Regulatory Harmonization Cally Jordan October 2002 H Issaand the Globalization of Finance Giovanni Majnoni 30154
WPS2920 Social Polarization, Political Philip Keefer October 2002 P Sintim-AboagyeInstitutions, and Country Stephen Knack 37656Creditworthiness
WPS2921 Initial Conditions and Incentives for Bernard Hoekman October 2002 P FlewittArab Economic Integration: Can the Patrick Messerlin 32724European Community's SuccessBe Emulated9
WPS2922 "Does Globalization Hurt the Poor? Pierre-Richard Agenor October 2002 M Gosiengfiao33363
WPS2923 Does Foreign Direct Investment Beata K Smarzynska October 2002 P FlewittIncrease the Productivity of Domestic 32724Firms? In Search of Spillovers throughBackward Linkages
WPS2924 Financial Development, Property Stijn Claessens November 2002 R VoRights, and Growth Luc Laeven 33722

Policy Research Working Paper Series
ContactTitle Author Date for paper
WPS2925 Crime and Local Inequality in Gabriel Demombynes November 2002 P SaderSouth Africa Berk Ozler 33902
WPS2926 Distinguishing between Rashmi Shankar November 2002 P. HoltObservationally Equivalent Theories 37707of Crises
WPS2927 Military Expenditure: Threats, Aid, Paul Collier November 2002 A. Kitson-Waltersand Arms Races Anke Hoeffler 33712
WPS2928 Growth without Governance Daniel Kaufmann November 2002 K MorganAart Kraay 37798