Embed Size (px)
Citation preview

Assessing the Market for Poultry Litter in
Georgia: Are Subsidies Needed to Protect
Water Quality?
Jeffrey Mullen, Ulugbek Bekchanov, Berna Karali, David Kissel,
Mark Risse, Kristin Rowles, and Sam Collier
Concerns about nutrient loads into our waters have focused attention on poultry litter ap-plications. Like many states with a large poultry industry, Georgia recently designed a sub-sidy program to facilitate the transportation of poultry litter out of vulnerable watersheds.This paper uses a transportation model to examine the necessity of a poultry litter subsidy toachieve water protection goals in Georgia. We also demonstrate the relationship betweendiesel and synthetic fertilizer prices and the value of poultry litter. Results suggest that a well-functioning market would be able to remove excess litter from vulnerable watersheds in theabsence of a subsidy.
Key Words: fertilizer, phosphorous, poultry litter, subsidy, transportation model, water quality
JEL Classifications: Q12, Q13, Q25, Q53
Nutrient over-enrichment in watersheds through-
out the United States threatens water quality
and the use of water resources for drinking water,
fishing, and recreation. Animal operations are
one of several important contributors of nutrient
loadings. In the Midwest, hog and cattle pro-
duction are dominant sources; in the South and
East, poultry production is especially important
(Kellogg et al., 2000; Lander, Moffitt, and Alt,
1998).
To address water quality concerns associ-
ated with the use and disposal of poultry litter
in vulnerable watersheds, several states have
implemented incentives for transferring litter
out of these watersheds. Alabama, Arkansas,
Maryland, Oklahoma, Pennsylvania, Virginia,
and West Virginia all have provided incentive
payments for transporting chicken litter out of
vulnerable watersheds.1 The state of Georgia,
the nation’s leading broiler producer, also re-
cently initiated a pilot program to facilitate
poultry litter transport.
Like many states, Georgia’s animal pro-
duction is primarily concentrated in one region
(the Piedmont), while major crop production is
located in another (the Coastal Plain). Because
poultry litter is bulky and heavy relative to
Jeffrey Mullen, Ulugbek Bekchanov, and Berna Karali,respectively, are an associate professor, graduate stu-dent, and assistant professor, Department of Agricul-tural and Applied Economics, University of Georgia,Athens, Georgia. David Kissel is professor, Soil, Plantand Water Lab, University of Georgia, Athens, Georgia.Mark Risse is professor, Department of Biological andAgricultural Engineering, University of Georgia,Athens, Georgia. Kristin Rowles and Sam Collier areresearchers, Georgia Water Planning and Policy Cen-ter, Albany, Georgia.
1 By vulnerable watersheds, we mean watershedsthat are likely to experience water quality problemsdue to excess nutrient loads.
Journal of Agricultural and Applied Economics, 43,4(November 2011):553–568
� 2011 Southern Agricultural Economics Association

nutrient content, it has traditionally been ap-
plied to fields within the vicinity of the poultry
grow-out operations. This has led to concerns
about nutrient imbalances – when more nutri-
ents are applied to an area than the plant matter
(crops or other vegetation) can absorb – that
can subsequently jeopardize water quality.
When considering environmental impacts of
poultry litter application, the main concern is
eutrophication or nutrient enrichment of surface
water. Phosphorus (P) is the primary nutrient that
causes fresh water eutrophication (Carpenter
et al., 1998; Schindler, 1977). The risk of P from
land-applied poultry litter reaching surface water
is based on application rate, timing, and location
(Lemunyon and Gilbert, 1993).
There is ample evidence that P concentra-
tions in runoff increase as P application rates
increase (Edwards and Daniels, 1992, 1993;
Kleinman and Sharpley, 2003). Furthermore, as
soil test P increases, P concentrations in runoff
also increase (Edwards and Daniels, 1993; Pote
et al., 1999).
From 2006–2008, U.S. Department of Agri-
culture Natural Resources Conservation Service
(NRCS) implemented a pilot program in Geor-
gia that subsidized the transport of poultry litter.
Based on an assessment of county-level phos-
phorous balances, 17 counties in north Georgia
were identified from which poultry litter could
be transported at subsidized rates (Figure 1).2
The pilot program paid recipients of the litter
between $6 and $10 per ton. The pilot program
contracted more than $600,000 in payments.
Although transporting poultry litter out of
vulnerable watersheds is a laudable goal, is it
necessary to subsidize litter transport in Georgia?
Poultry litter is, after all, a valuable fertilizer,
rich in phosphorous, nitrogen, potassium, and
other micronutrients. It also serves to enhance
soil organic matter and the ability of soils to
retain moisture, and may lower soil acidity
(Mokolobate and Haynes, 2002). The value of
poultry litter as a substitute for inorganic fertil-
izers is intricately related to the price of those
fertilizers and the costs associated with litter
transportation. Widely fluctuating oil prices over
recent years have led to volatility in the prices of
diesel fuel and fertilizers (Figure 2) which, in
turn, suggest the value of poultry litter has also
fluctuated.
Recent studies of poultry litter transport pro-
grams have found them to be effective in moving
litter out of vulnerable watersheds (Carreira
et al., 2007; Collins and Basden, 2006; Paudel,
Adhikari, and Martin, 2004). Carreira et al. and
Paudel, Adhikari, and Martin used linear pro-
gramming models designed to minimize the cost
of meeting crop nutrient requirements. Collins
and Basden (2006) estimated the present value
costs of nutrient applications, including litter,
over an infinite horizon for tall grass hay land
in West Virginia. They found the breakeven dis-
tance for transporting litter ranged from 120–260
miles, depending on litter cost, price, discount
rate, and nitrogen efficiency assumptions.
Carreira et al. (2007) considered two modes
of transportation – truck and barge – and two
types of litter – baled and raw litter – for their
analysis in Arkansas. They found that trans-
porting baled litter by truck could lower nutrient
Figure 1. Location of Poultry Litter Removal
Counties for Pilot Transfer Program in Georgia
2 For the purposes of our study, the watersheds thatencompass these 17 counties are considered vulnera-ble watersheds.
Journal of Agricultural and Applied Economics, November 2011554

costs by about $2.6 million. They concluded that
public subsidies should not be necessary for a
litter market to function in Arkansas.
Paudel, Adhikari, and Martin (2004) apply
their model to 29 counties in northern Alabama,
divided into ‘‘surplus’’ and ‘‘deficit’’ counties.
Surplus counties are those that ‘‘exceed the cu-
mulative nutrient demands for the four major
crops. . .deficit counties are those in which litter
production cannot meet the crops’ nutrient
demands’’ (p. 19). The cost of moving litter
between surplus and deficit counties is incor-
porated into the model. The initial model solu-
tion left significant amounts of litter in surplus
counties. In an attempt to address this, they solve
a ‘‘priority model’’ in which surplus counties are
ranked according to the tons of surplus litter. A
penalty structure is used to manipulate the flow
of litter out of surplus counties based on their
ranking – all of the excess litter in the county
with the largest surplus was forced to be removed
before any litter in the county with the second
largest surplus could be removed, and so on.
Neither of these models succeeds in removing all
of the excess litter from the surplus counties. This
may be due to the geographic scope of the model.
In this paper, a transportation model is de-
veloped for Georgia to examine the ability of a
well-functioning poultry litter market to redis-
tribute poultry litter out of vulnerable watersheds
and into areas with acceptable concentrations
of soil phosphorous.3 The model structure is
similar to Paudel, Adhikari, and Martin (2004),
but we specify the model for the entire state and
use it to determine the need, or lack thereof, for
a transportation subsidy given recent market
fertilizer and diesel prices. We also identify
how the market clearing price for poultry litter
changes as the prices of fertilizer and diesel fuel
change. Unlike Carreira et al. (2007), we do not
consider baling litter prior to transport. We do,
however, incorporate a potential liming effect
into our model and examine the sensitivity of
our results to the ability of poultry litter to serve
as a substitute for lime.
Pilot Program for Litter Transport
in Georgia
To address nutrient loading concerns in North
Georgia watersheds, the U.S. Department of Ag-
riculture Natural Resources Conservation Service
in Georgia developed a pilot litter transfer
Figure 2. Commercial Fertilizer Prices 1995–2009 ($/ton)
3 We use the term ‘‘well-functioning litter market’’to mean a market in which accurate information aboutbuyers and sellers, market prices, and the nutrientcontent of litter is readily available at costs on parwith the transaction costs associated with acquiringsynthetic fertilizers.
Mullen et al.: Assessing the Market for Poultry Litter in Georgia 555
incentive program in 2005. Implementation
began in 2006. The pilot program had three
objectives: (1) to create an incentive to dis-
tribute poultry litter to areas of the state that
have historically not used poultry litter as a
fertilizer, (2) to promote a long-term market for
animal manure as a fertilizer around the state,
and (3) to reduce over-application of poultry
litter in areas where it has been traditionally
over applied.
Farmers interested in using litter could ap-
ply for an incentive intended to offset trans-
portation costs, but the litter had to originate in
a ‘‘targeted removal’’ county and be applied in
a ‘‘targeted application’’ county. The litter also
had to be hauled by a Georgia licensed animal
manure hauler. These counties were identified
based on an assessment of the phosphorus bal-
ance in each county. Surplus counties were
identified as removal counties, and other counties
were application counties. Within each category,
counties received a priority ranking, also based
on the phosphorus balance.
The incentive payment was $10.00/ton, but
an applicant could receive a higher ranking if
willing to receive a lower payment rate (e.g.,
$6 or $8 per ton). Applications were ranked
on several criteria, including: priority level of
removal county, priority level of application
county, willingness to accept a lower payment
rate, receiving crop, P-index for receiving land,
use of conservation tillage, availability of ap-
propriate storage facilities, and litter applica-
tion rate. The maximum incentive payment per
farmer was $10,000.00 per year.
The receiver was required to have litter
storage available that meets NRCS Waste Field
Storage Standard, and litter application had to
be based on the P-index (NRCS, 1994) and
follow NRCS Nutrient Management Standards.
No application sites with a P-index >75 were
approved for litter application.
Methodology
The unit of analysis is the county. Poultry litter
produced within each county is estimated based
on county-level broiler production. Each county
also has nutrient needs for the crops it grows.
Seven crops are considered: corn, cotton, wheat,
hay and pasture,4 peanuts, and soybeans. The
distance between two counties is measured
as the linear distance from each county’s
centroid. The model presented below mini-
mizes the cost of meeting the county’s nutrient
needs for the selected crops. The general form
of the model is described in Equation (1).
The symbols used in the model are defined in
Table 1.
A county’s crop nutrient needs are met by
applying commercial fertilizers (F) and broiler
litter (BL). Broiler litter can come from within
the county itself, or be transported from another
county. Application costs are based on the num-
ber of tons of fertilizer and broiler litter applied.
Transportation costs are added for broiler litter
hauled in from another county. These costs are
figured on a per load basis, where a load is 25
tons. The cost of lime is also incorporated into
the model.
Equation (1) is minimized subject to con-
straints 1.1 through 1.6.
(1.1)X
i
XC
BLC,i,j £ BLTOTAL,j8j
(1.2)
Xj
XF
FertF,C,iNF 1 BLC,i,j
�NBL ³ NREQ,i,C8i,C
(1) MinF,BL
Xj
Xi
XC
XF
PF � FertF,C,i 1 AF � FertF,C,i 1 PBL � BLC,i, j
1 ABL � BLBL,C,i,j 1 TBL,i, j � LBL,,C,i, j 1 PLime � LimeC,i
� �
4 For counties located in the Coastal Plain, hay andpasture are assumed to be planted to Coastal Bermudahay; counties outside the Coastal Plain are assumed toplant fescue clover on their hay and pasture land.
Journal of Agricultural and Applied Economics, November 2011556

(1.3)
Xj
XF
FertF,C,iPhF 1 BLC,i, j
� PhBL 5 PhREQ,i,C8i,C
(1.4)
Xj
XF
FertF,C,iKF 1 BLC,i, j
�KBL ³ KREQ,i,C8i,C
(1.5) LimeC,i 1 BLC,i ³ LimeREQ,i,C8i,C
(1.6) TBL,i,j 5 Disti,j � GBL8i, j
(1.7) BLC,i, j,FertF,C,i,LimeC,i ³ 08C,F,i, j
The constraints represent physical relation-
ships between the model variables, and can be
interpreted as follows.
(1.1) The total amount of broiler litter trans-
ported out of a county cannot exceed the
total amount of broiler litter produced in
that county.
(1.2) The total amount of nitrogen applied to a crop
in a given county, from all fertilizer sources,
mustmeet, but canexceed, the total amountof
nitrogen required by that crop in that county.
(1.3) The total amount of phosphorous applied
to a crop in a given county, from all fertil-
izer sources, must exactly meet, and cannot
exceed, the total amount of phosphorous
required by that crop in that county.
(1.4) The total amount of potassium applied to
a crop in a given county, from all fertilizer
sources, must meet, but can exceed, the total
amount of potassium required by that crop
in that county.
(1.5) The total amount of lime applied to a crop
in a given county, from all liming sources,
must meet, but can exceed, the total amount
of lime required by that crop in that county.
(1.6) The transportation costs per load of broiler
litter between counties i and j are equal to
the distance between the counties times the
per mile cost of transporting a load of litter.5
Table 1. Definitions and Symbols Used in Mathematical Programming Model
Symbol Definition
PF Price per ton of commercial fertilizer F
FertF,C,i Tons of commercial fertilizer F applied to crop C in county i
AF Application cost per ton of commercial fertilizer F
PBL Price per ton of broiler litter
BLC,i,j Tons of broiler litter applied to crop C in county i, received from county j
ABL Application cost per ton of broiler litter
LBL,C,i,j Loads of broiler litter received by county i from county j for crop C
TBL,i,j Cost of transporting a load of broiler litter from county i to county j
PLime Price per ton of lime, including application cost
LimeC,i Tons of lime applied to crop C in county i
BLTOTAL,j Tons of broiler litter produced in county j
NF Proportion of fertilizer F that is nitrogen and available to the plant
NBL Proportion of broiler litter that is nitrogen and available to the plant
NREQ,C,i Tons of nitrogen required for crop C in county i
PhF Proportion of fertilizer F that is phosphorous and available to the plant
PhBL Proportion of broiler litter that is phosphorous and available to the plant
PhREQ,C,i Tons of phosphorous required for crop C in county i
KF Proportion of fertilizer F that is potassium and available to the plant
KBL Proportion of broiler litter that is potassium and available to the plant
KREQ,C,i Tons of potassium required for crop C in county i
LimeREQ,i,C Tons of lime required for crop C in county i
Disti,j Distance, in miles, between the geometric center of county
i and the geometric center of county j
GBL Transportation cost per mile for a load of broiler litter
5 The model implicitly ignores the cost of trans-porting litter within a county. In other words, a countyincurs no transportation costs for applying litter pro-duced within the county.
Mullen et al.: Assessing the Market for Poultry Litter in Georgia 557

(1.7) One cannot apply negative amounts of any
fertilizer.
Setting the Parameter Values
The parameter values used in the model are
presented in Table 2 for ease of reference.
This section explains how those values were
derived.
Broiler Litter Production
The annual amount of broiler litter produced in
each county depends on the number of broilers
raised per year. Each broiler generates 2.5 pounds
of litter and grows to an average of 6.6 pounds
(Vest, Merka, and Segars, 1994). To estimate the
number of broilers produced in each county, the
2007 United States Department of Agriculture
National Agricultural Statistics Service (NASS)
Table 2. Initial Parameter Values
Parameter Values
Broiler Litter Production 2.5 lb litter/broiler
Pasture Land 2.6 acres/beef cow
1.5 acres/stocker
0.5 acres/dairy cow
Crop Land Harvested acres as reported by NASS
Nitrogen Requirement
Wheat 90 lb N/acre
Corn 180 lb N/acre up to 180 bushels/acre
1.2 lb N/acre for each bushel over 180
Cotton 60 to 105 lb N/acre depending on production targets
Hay and Pasture 200 to 300 lb N/acre depending on location
Phosphorous Requirement Depend on soil tests and equations listed in Appendix
Potassium Requirement Depend on soil tests and equations listed in Appendix
Lime Requirement Depend on soil tests
Poultry Litter Price $10/ton
Poultry Litter Application Cost $7/ton
Poultry Litter Transportation Cost/Mile For each 25-ton load:
$0.98 1 (price per gallon of diesel/5)
Commercial Fertilizer Application Cost $9.50/ton
Nitrogen Solution Cost $249/ton (2006), $286/ton (2007),
$392/ton (2008), $320/ton (2009)
Ammonium Nitrate Cost $390/ton (2006), $425/ton (2007),
$543/ton (2008), $438/ton (2009)
Ammonium Sulfate Cost $266/ton (2006), $288/ton (2007),
$391/ton (2008), $378/ton (2009)
Urea Cost $362/ton (2006), $453/ton (2007),
$552/ton (2008), $486/ton (2009)
Diammonium Phosphate $354/ton (2006), $481/ton (2007),
$879/ton (2008), $638/ton (2009)
Potassium Polyphosphate $318/ton (2006), $358/ton (2007),
$650/ton (2008), $482/ton (2009)
Potassium Chloride (Muriate) $294/ton (2006), $309/ton (2007),
$524/ton (2008), $853/ton (2009)
Broiler Litter Nutrient Content
Nitrogen 64 lb N/ton, 60% available
Phosphorous 54 lb P2O5/ton, 90% P available
Potassium 48 lb K2O/ton, 100% K available
P2O5 is Phosphorus pentoxide; K2O is Potassium oxide.
Journal of Agricultural and Applied Economics, November 2011558

estimates of the pounds of broilers produced are
divided by 6.6 pounds/broiler. Multiplying by 2.5
pounds of litter/broiler results in the total pounds
of litter, which is then converted to tons.
Crop Nutrient Requirements
The total requirement, in pounds, of each nu-
trient for each crop in each county depends on
the number of acres grown and the per-acre
crop nutrient requirement. County level crop
acreages for all crops except pasture are set to
the 2007 harvested acres reported by NASS,
and can be found at http://www.georgiastats.uga.
edu/crossection.html.
Because NASS does not report pasture
acreage, it has to be calculated for each county.
NASS does report county level beef cattle,
stocker, and dairy cattle numbers, which can
also be found at http://www.georgiastats.uga.
edu/crossection.html. The acreage of pasture land
in a county depends on the number of cows. Each
beef cow is assumed to require 2.6 acres of pas-
ture, while stockers and dairy cows are assumed
to require 1.5 acres and 0.5 acres, respectively.
Nitrogen
Georgia Extension Service recommendations
serve as the basis for setting the per acre nitro-
gen requirements for each crop. Peanuts and
soybeans are nitrogen-fixing legumes that do not
require additional nitrogen (N). As such, the
nitrogen requirement for those crops is 0 pounds
per acre. Wheat nitrogen requirements are as-
sumed to be 90 pounds per acre for all counties.
Corn and cotton nitrogen needs are based on
production targets.
For corn, 180 pounds of N/acre are recom-
mended for all production targets less than or
equal to 180 bushels/acre. An additional 1.2
pounds N/acre is required for each bushel over
180. Production targets for each county are
based on the county’s 2007 average yield/acre,
as reported by NASS.
For cotton, 60 pounds of N/acre are recom-
mended for all the production targets less than
875 pounds lint per acre. Production targets be-
tween 875 and 1,125 pounds lint per acre require
75 pounds N/acre. Targets between 1,125 and
1,375 pounds lint/acre require 90 pounds of N,
while targets above 1,375 pounds lint/acre require
105 pounds N/acre. As with corn, production
targets for each county are based on the coun-
ty’s 2007 average yield/acre reported by NASS.
Nitrogen is recommended to be applied in
two separate applications for all of the row
crops. The first application, about one third of
the total N recommended, should occur before
or during planting; after plant emergence, the
remaining two thirds of recommended N should
be applied. Because poultry litter cannot be ap-
plied after plant emergence, the model accounts
only for the first nitrogen application.
Hay and pasture nitrogen recommendations
depend on the grass grown. For Coastal Plain
counties growing Coastal Bermuda hay and
pasture, the requirement is 300 pounds N/acre/
year. Counties located outside the Coastal Plain
growing fescue clover require 200 pounds of
N/acre/year. All of the nitrogen for hay and
pasture can come from broiler litter, and is ap-
plied after each cutting.
Phosphorous and Potassium
While the P-index was used to guide subsidized
litter applications on specific fields in the
Georgia Pilot Program, a county-level approach
is used in our model. Phosphorous and potas-
sium (K) recommendations depend on soil test
P and K levels for all of the crops considered in
the model. Results from soil tests conducted in
2006 and 2007 by the University of Georgia Soil
Test Laboratory were averaged, by county and
crop, to estimate the amount of phosphorous
and potassium in a typical acre growing a given
crop in a given county. If soil test levels exceed
a threshold, no phosphorous (potassium) is rec-
ommended. Below that threshold, a quadratic
equation is used to determine the phosphorous
(potassium) application recommendation. Both
the thresholds and the quadratic equations are
crop specific and depend on whether the field is
located in the Coastal Plain or not. For cotton,
P and K recommendations also depend on target
production levels. The threshold soil test P and
K levels and the quadratic equations used to
generate the P and K recommendations are pre-
sented in the appendix.
Mullen et al.: Assessing the Market for Poultry Litter in Georgia 559

Two counties, Chattahoochee and Taliaferro,
did not have soil test data for 2006 and 2007. To
develop the P and K recommendations for these
counties, the soil test levels of their contiguous
neighbors were averaged.
Lime
Lime recommendations are dichotomous – either
a field needs lime or does not. For those needing
lime, an application rate of 0.75 tons of dolomitic
lime per acre is used. It is further assumed that,
pound for pound, poultry litter provides the same
liming function as dolomitic lime; this assump-
tion is later relaxed. To estimate the total amount
of lime by crop and county, soil test results for
2006 and 2007 were used. The number of acres
planted to a given crop was multiplied by the
proportion of soil tests requiring lime in each
county, and then multiplied by the application
rate (0.75 tons/acre).
Fertilizer Considerations
Seven commercial fertilizers, plus broiler litter
and dolomitic lime were incorporated into the
model. The nitrogen fertilizers included am-
monium nitrate, ammonium sulfate, nitrogen
solutions, and urea. Phosphorous fertilizers were
diammonium phosphate and potassium poly-
phosphate. The potassium fertilizer was potas-
sium chloride (muriate).
Prices and Application Costs
Commercial fertilizer prices used in the model
were those reported by NASS for the southeast
region. Prices for 2006–2009 are presented in
the appendix. The price of poultry litter was
initially set to $10/ton. This is the median value
from a survey of Georgia poultry producers,
poultry litter users, and poultry litter trans-
porters conducted in 2008.
Application costs were assumed to be
$9.50/ton of commercial fertilizer. In the model,
liquid fertilizers were able to be mixed, as were
dry fertilizers. The cost of application included
delivery. These decisions were based on a survey
conducted during a series of poultry litter
workshops in Georgia during 2007. The
workshops were attended by more than 120 row
crop and forage producers, poultry litter haulers
and spreaders, and poultry producers.
Unlike commercial fertilizer, poultry litter
had to be applied alone. The cost of applying
poultry litter was set to $7.00/ton, the median
value from the workshop survey. This appli-
cation cost did not include delivery.
The cost of transporting a 25-ton load of litter
has several components in addition to the price of
diesel fuel. These include driver, truck, insurance,
and maintenance costs, taxes, and a profit mar-
gin. Based on the workshop survey, on average
these costs amount to $0.98/mile. A vehicle
hauling a load of litter is assumed to get 5 miles
per gallon. The total transportation costs per
loaded mile in the model, then, are equal to
$0.98 1 price per gallon of diesel. While the
model will accommodate partial loads, the trans-
portation costs for a partial load are assumed to
be the same as those for a full load. The dis-
tance between each county was measured in
ARC GIS.
Broiler Litter Nutrient Content
Although the University of Georgia provides
litter nutrient profiles as a service, those data
are not retained. In lieu of data from Georgia,
the average nutrient levels in broiler litter re-
ported by North Carolina State University
Department of Biological and Agricultural En-
gineering were used as estimates for nutrient
content of broiler litter in Georgia. Each ton of
broiler litter was assumed to contain 64 pounds
of N, 54 pounds of diphosphorus pentoxide,
and 48 pounds of potassium oxide, with 60%,
90%, and 100%, respectively, available to the
plant. These values are similar to those used by
Carreira et al. (2007) and are consistent with
Georgia Cooperative Extension estimates (Kissel
et al., 2008).
Model Scenarios
The model can examine a multitude of ques-
tions about the spatial demand for poultry litter
as a fertilizer by adjusting the model parame-
ters and constraints. Three scenarios were built
and analyzed for this project.
Journal of Agricultural and Applied Economics, November 2011560

Scenario I: No Transportation, P Equality
This scenario is designed to identify counties with
excess poultry litter when nutrient application
rates are based on phosphorous requirements.
Transportation of litter out of a county is not
allowed, which enables the model to calculate
excess litter per county. Constraints (1.1) through
(1.7) are set as described above. In particular,
phosphorous applications must meet crop require-
ments, but cannot exceed them.
In addition to identifying counties with excess
litter under a P-based fertilizer regime, Scenario I
also calculates a shadow price for poultry litter for
each county. Shadow prices represent the change
in the objective function [Equation (1)] due to a
marginal change in the limiting value of a con-
straint. The shadow price associated with con-
straint (1.1) in a given county represents how much
the total fertilizer costs for the county would fall if
the county had an additional ton of poultry litter. In
other words, the shadow price on constraint (1.1)
for county i represents the price producers in
county i would be willing to pay for an additional
ton of poultry litter. In counties with excess poultry
litter, the shadow price would be zero – they al-
ready have more than they can use, so they would
not be willing to pay for more. These counties are
potential sellers of poultry litter. Counties with a
non-zero shadow price are potential buyers.
Scenario II: No Transportation, P Inequality
Here, phosphorous applications must meet, but
are allowed to exceed, crop requirements. This is
accomplished by changing constraint (1.3) from
an equality constraint to a greater than or equal
to constraint, as in Equation (1.3a). Producers
may choose the mix of commercial fertilizer and
poultry litter that minimizes their nutrient costs
without paying special attention to phosphorous.
(1.3a)
Xj
XF
FertF,C,iPhF 1 BLC,i,j
� PhBL ³ PhREQ,i,C8i,C
Again, transportation of litter out of a county is
not allowed.
Comparing Scenarios I and II generates an
estimate of the cost of adhering to a P-based fer-
tilizer regime. Scenario I solves equation 1 under
a P-based regime, selecting the fertilizer mix
for each crop in each county, and calculating
the costs. Scenario II does the same thing, but
relaxes the phosphorous constraint. Because
poultry litter is the cheapest source of nitro-
gen, the model chooses it to meet the nitrogen
requirement. Litter, however, also contains
phosphorous.
Under Scenario I, producers must stop ap-
plying litter and switch to a commercial nitrogen
fertilizer once the phosphorous requirement is
met. Scenario II allows producers to continue to
apply litter after the phosphorous requirement is
met. Here, the model continues to choose poultry
litter as a nitrogen source as long as the cost of
acquiring and applying it is cheaper than other
sources of nitrogen, regardless of the phospho-
rous issue.
Subtracting the total cost of meeting a
county’s nutrient requirements under Scenario
II from the cost in Scenario I equals the cost of
the P-based application requirement. That is, it
is equal to the extra fertilizer costs producers
incur when a P-based application rate is in
effect.
There are several ways to interpret this value.
It could be considered the cost to producers from
historic over-application of phosphorous. Alter-
natively, it could be seen as the cost imposed on
crop producers by P-based regulations. It can
also be interpreted as the minimum com-
pensation needed to persuade producers to
abide by a P-based fertilizer regime. Under
this last interpretation, a minimum selling
price for poultry litter could be estimated by
dividing the cost differential between Sce-
nario I and II by the difference in excess litter
between the two scenarios. This is represented
by Equation (2).
(2) MWTABL,i 5ðCosti,I � Costi,IIÞ
ððBLTOTAL,i �PC
BLC,i,IÞ � ðBLTOTAL,i �PC
BLC,i,IIÞÞ
Mullen et al.: Assessing the Market for Poultry Litter in Georgia 561

where MWTABL,i is, for producers in county i,
the minimum willingness to accept ($/ton) for
a ton of broiler litter;
Costi,I is the total cost of meeting fertilizer re-
quirements in county i under Scenario I;
Costi,II is the total cost of meeting fertilizer re-
quirements in county i under Scenario II;
BLTOTAL,i is the total amount of broiler litter
(tons) produced in county i;
BLC,i,I is the amount of broiler litter (tons) ap-
plied to crop C in county i under Scenario I;
BLC,i,II is the amount of broiler litter (tons) ap-
plied to crop C in county i under Scenario II.
This estimate can be generated for each
county to illustrate the spatial dimension of the
poultry litter market.
Scenario III: Transportation, P Equality
Scenario III opens up the market to litter
transport, under a P-based fertilizer regime.
That is, the counties with excess litter in Sce-
nario I are now able to sell it, and the counties
with non-zero shadow prices for litter are now
able to buy it. The model tracks the exchange of
litter between counties and identifies which
counties, if any, continue to have excess litter
after all exchanges are completed. It also
identifies which counties continue to demand
litter (those with a non-zero shadow price) after
all exchanges have been completed.
If the 17 target counties from the Poultry
Litter Pilot Program continue to have excess
litter under current market conditions in Scenario
III, that would suggest the need for financial
support or regulatory mandates to remove it. In
other words, under current market conditions,
buyers would be unwilling to compensate the
sellers in these 17 counties enough to cover their
increased expenditures on commercial fertilizer.
However, if those counties are able to sell all
of their excess litter in Scenario III, the case for
financial support would be undermined. Rather,
the preferred policy would be to encourage the
application of a P-based fertilizer regime and
facilitate the market exchange of litter without
direct monetary incentives.
Results
County level broiler litter production is illustrated
in Figure 3. It is worth noting that, while the bulk
of broilers are grown in the Piedmont, there is
considerable production throughout the state.
Cotton production is located primarily in the
southwest of the state, an area with low levels of
poultry production and generally low levels of
soil phosphorous. Corn and wheat acreages drift
a bit north of the cotton acres, with a fair amount
of each located in the heavy poultry producing
Piedmont counties. The hay and pasture acreages
are dispersed fairly evenly throughout the state.
The initial results under Scenarios I, II, and
III presented below are generated using a $10/ton
price for litter, and the maximum diesel price
recorded in Georgia between 2006 and 2009
($4.71/gallon). These price parameters are then
Figure 3. County Level Broiler Litter Production, 2007
Journal of Agricultural and Applied Economics, November 2011562

adjusted to find the market clearing price of litter.
The value of a potential liming effect from litter
is addressed in the final section of the results.
Scenario I
As expected, the 17 target counties from the pilot
program all had large amounts of excess litter
under this scenario. There are, however, many
counties with excess litter throughout the central
and southeastern parts of the state. Figure 4 il-
lustrates the excess litter in each county under
2008 fertilizer prices.
This scenario was run separately with fer-
tilizer prices from 2006, 2007, 2008, and 2009.
Over this period the price of nitrogen fertilizers
rose by 49% on average, potassium chloride
(muriate) rose by 78%, and the phosphate fer-
tilizers more than doubled, rising by an average
of 125%. These are strikingly high increases,
and they have direct implications for the market
value of litter. As explained above, the shadow
price of broiler litter in the model reflects the
marginal value of litter as a substitute for fer-
tilizers. As such, it serves as an estimate of the
maximum amount a producer would be willing
to pay for a ton of litter, including transportation
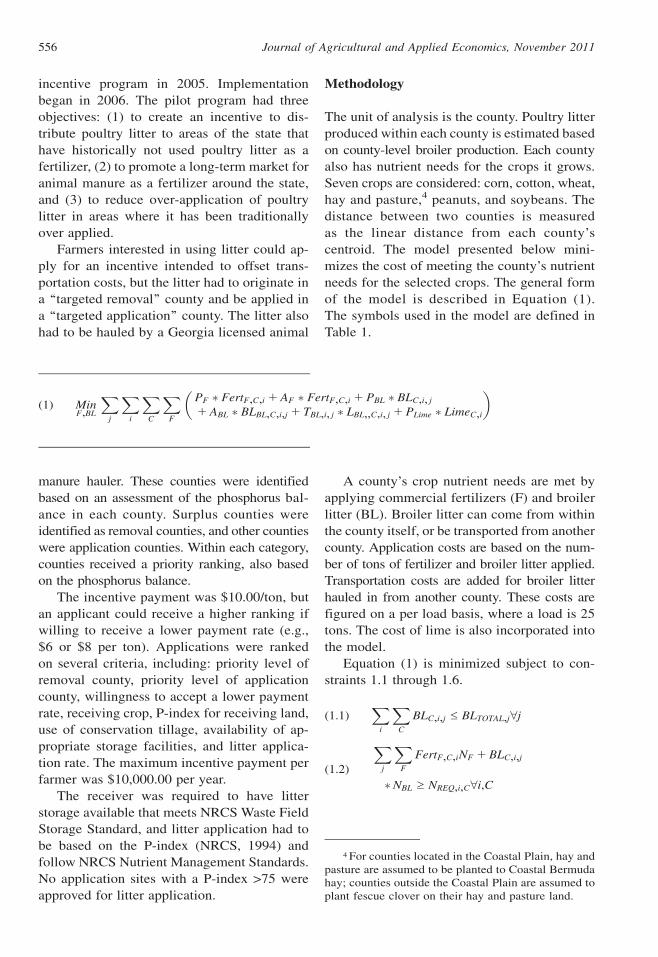
costs. Figures 5, 6, and 7 show the shadow prices
for litter under fertilizer prices from 2006, 2007,
and 2008, respectively.
What is important to note is that there is
a spatial dimension to the shadow prices. The
value of an additional ton of litter in a given
county depends on the crops grown, the amount
of litter produced in that county, and the price
of other fertilizers. There is no single ‘‘value of
litter.’’ With 2006 fertilizer prices, the shadow
prices ranged from $11/ton to $60/ton in the
‘‘buyer’’ counties – those without excess lit-
ter. With 2007 fertilizers prices the shadow
prices rise to a range of $21/ton to $70/ton.
When fertilizer prices are at 2008 levels, the
shadow prices jump to between $50/ton and
$100/ton.
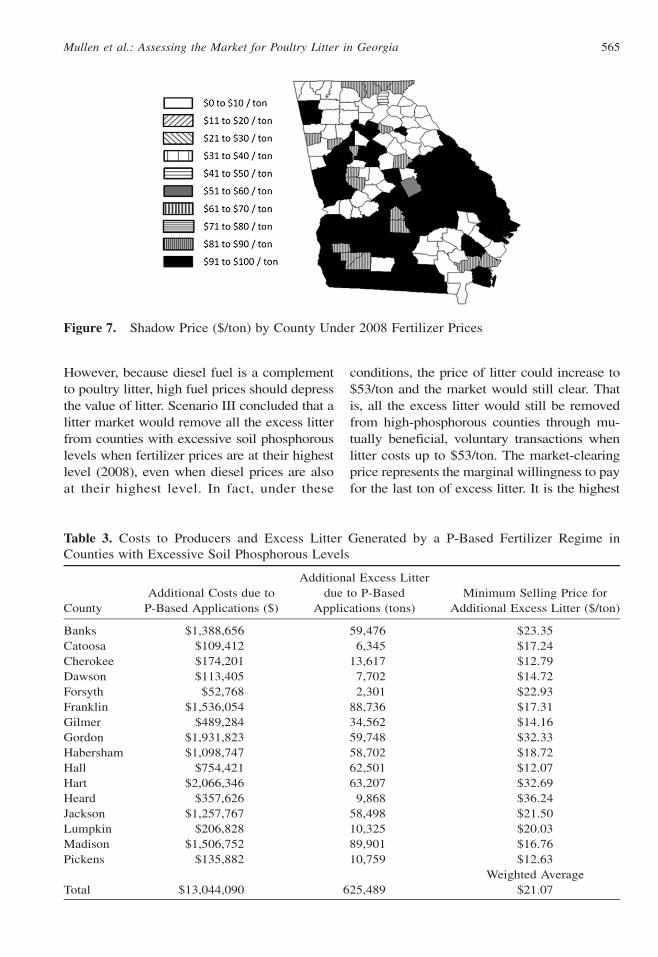
Scenario II
In the 17 target counties the cost of meeting
crop nutrient needs under Scenario I was
$31.2M. When the phosphorous constraint is
relaxed in Scenario II the cost drops to $18M.
Table 3 shows how the $13.2 million in addi-
tional costs are distributed across the 17 target
counties. Also shown in the table, by county, is
the difference in excess litter between Scenario
I and Scenario II. This difference equals the
amount of litter crop producers in the county
would like to apply but are not able to because
of the requirement of P-based application rates.
Dividing the additional costs by the excess litter
differential provides an estimate of the minimum
price per ton that would be needed to entice the
county to apply litter at P-based application rates
and export the excess. This price does not in-
clude transportation costs. Rather, it is the
price the litter suppliers would have to receive.
Figure 4. Excess Litter (tons) by County Under 2008 Fertilizer Prices
Mullen et al.: Assessing the Market for Poultry Litter in Georgia 563

Scenario III
In this scenario litter is able to be transported out of
the ‘‘seller’’ counties and into the ‘‘buyer’’
counties described above. Using 2008 fertilizer
prices, a diesel price of $4.71/gallon, and $10/ton
broiler litter, the solution to the model transports
all excess litter from Scenario I out of the 17 target
counties. This is not surprising, considering the
range of 2008 shadow prices displayed in Figure 7
($50/ton – $100/ton) is higher than the minimum
price required by the target counties shown in
Table 3 ($12/ton – $37/ton). The difference be-
tween the ‘‘seller’’ counties’ asking price and the
‘‘buyer’’ counties’ willingness to pay is more than
enough to cover the transportation costs. In fact,
with 2008 fertilizer prices the excess litter from
all ‘‘seller’’ counties is bought, transported, and
applied at P-based rates to crops in ‘‘buyer’’
counties. This suggests that a well-functioning
litter market should be able to address the over-
application of poultry litter in the target counties
without public subsidies, given 2008 fertilizer
prices and a $10/ton price of litter.
Sensitivity Analysis of Market Clearing Litter
Price. Because litter is a substitute for commer-
cial fertilizers, when fertilizer prices are high,
the value of poultry litter should increase.
Figure 5. Shadow Price ($/ton) by County Under 2006 Fertilizer Prices
Figure 6. Shadow Price ($/ton) by County Under 2007 Fertilizer Prices
Journal of Agricultural and Applied Economics, November 2011564
However, because diesel fuel is a complement
to poultry litter, high fuel prices should depress
the value of litter. Scenario III concluded that a
litter market would remove all the excess litter
from counties with excessive soil phosphorous
levels when fertilizer prices are at their highest
level (2008), even when diesel prices are also
at their highest level. In fact, under these
conditions, the price of litter could increase to
$53/ton and the market would still clear. That
is, all the excess litter would still be removed
from high-phosphorous counties through mu-
tually beneficial, voluntary transactions when
litter costs up to $53/ton. The market-clearing
price represents the marginal willingness to pay
for the last ton of excess litter. It is the highest
Figure 7. Shadow Price ($/ton) by County Under 2008 Fertilizer Prices
Table 3. Costs to Producers and Excess Litter Generated by a P-Based Fertilizer Regime inCounties with Excessive Soil Phosphorous Levels
County
Additional Costs due to
P-Based Applications ($)
Additional Excess Litter
due to P-Based
Applications (tons)
Minimum Selling Price for
Additional Excess Litter ($/ton)
Banks $1,388,656 59,476 $23.35
Catoosa $109,412 6,345 $17.24
Cherokee $174,201 13,617 $12.79
Dawson $113,405 7,702 $14.72
Forsyth $52,768 2,301 $22.93
Franklin $1,536,054 88,736 $17.31
Gilmer $489,284 34,562 $14.16
Gordon $1,931,823 59,748 $32.33
Habersham $1,098,747 58,702 $18.72
Hall $754,421 62,501 $12.07
Hart $2,066,346 63,207 $32.69
Heard $357,626 9,868 $36.24
Jackson $1,257,767 58,498 $21.50
Lumpkin $206,828 10,325 $20.03
Madison $1,506,752 89,901 $16.76
Pickens $135,882 10,759 $12.63
Weighted Average
Total $13,044,090 625,489 $21.07
Mullen et al.: Assessing the Market for Poultry Litter in Georgia 565

price per ton of litter that would achieve the
policy goal of removing all of the excess litter
from counties located in vulnerable watersheds.
As fertilizer and diesel prices change, how-
ever, so does the market-clearing price for litter.
To analyze the effect of diesel and fertilizer
prices on the market clearing price, Scenario III
is run using four sets of fertilizer prices (2006
through 2009), and three different diesel prices –
$2.17/gallon (the average price in Georgia in
February 2009), $3.37/gallon (the average price
in Georgia in February 2008), and $4.71/gallon
(historically the highest average price of diesel
in the state of Georgia). Table 4 presents the
results. The lowest market-clearing litter value
($12/ton) occurs when diesel prices are at their
highest, and fertilizer prices are at their lowest.
Sensitivity Analysis of Value of Liming Effect. In
the analyses above, poultry litter was assumed,
pound-for-pound, to have the same liming ef-
fect as dolomitic lime. Three alternative as-
sumptions are analyzed. The first assumption is
that poultry litter has no liming effect at all. The
second assumption is that poultry litter has
one quarter the liming effect of dolomitic
lime; that is, four pounds of poultry litter
provide the same liming effect as one pound of
dolomitic lime. The final assumption analyzed
is that poultry litter has one half the liming
effect as dolomitic lime.
Under all three assumptions the market-
clearing price for litter does not change. There is,
however, an effect on the total cost of meeting
crop nutrient and liming needs. If poultry litter
does not have any liming effect, the cost of
meeting crop needs with 2008 fertilizer prices,
$53.09 per ton litter, and $4.71/gallon diesel is
$325.5 million. This cost drops to $312.2 million,
$302.8 million, and $294.8 million for quarter
liming effect, half liming effect, and full liming
effect, respectively. As the prices of litter and/or
diesel fall, the value of the liming effect increases.
The magnitude of the liming effect also has an
impact on the shadow price of litter when it is not
transported between counties. For the counties
that apply additional lime, the shadow price for
litter is $38.40 lower (the cost of a ton of dolomitic
lime) when litter has no liming effect compared
with the full liming effect. When litter is only half
as effective as dolomitic lime, the shadow price of
litter is $19.20 higher than when there is no liming
effect. Similarly, when litter is one fourth as ef-
fective as dolomitic lime, its shadow price is $9.60
higher than when there is no liming effect.
Conclusions and Recommendations
Poultry litter is a valuable nutrient for crop pro-
duction. Land application of poultry litter to meet
plant nitrogen demand, however, can threaten
water quality through phosphorous loadings. To
prevent excessive litter application rates, many
states have developed programs that subsidize the
transportation of poultry litter out of vulnerable
watersheds. Georgia has undertaken a pilot pro-
gram to address this issue. Our analysis shows
that a well-functioning market in Georgia would
redirect poultry litter out of vulnerable watersheds
without the need for a publicly funded trans-
portation subsidy. This result is robust over a wide
range of fertilizer prices and diesel fuel prices.
The model developed here is static and could
be improved by incorporating dynamic soil nu-
trient effects and the value of important micro-
nutrients such as calcium. More sophisticated
means of estimating the amount of litter produced
based on bird weight derived from a biological
response function could also be incorporated
(Willet et al., 2006). Another limitation of the
study is the treatment of poultry litter as a perfect
Table 4. Maximum Market-Clearing Price of Litter
Diesel Price
($/Gallon)
Poultry Litter Market-Clearing Price ($/ton)
2006 Fertilizer
Prices
2007 Fertilizer
Prices
2008 Fertilizer
Prices
2009 Fertilizer
Prices
$2.17 $17.45 $26.66 $58.09 $56.00
$3.37 $15.18 $24.30 $55.73 $54.35
$4.71 $12.67 $21.79 $53.09 $51.71
Journal of Agricultural and Applied Economics, November 2011566

substitute for commercial fertilizers. In reality,
litter is generally more difficult to handle than
commercial fertilizers and may emit an offensive
odor, which could reduce its price. Finally, some
broiler grow out operations do not clean out all
of their litter after every flock, as assumed here.
Incorporating partial cleanout would affect the
supply of litter, but not its demand. Such a sce-
nario would strengthen our conclusions.
While our model results suggest a transpor-
tation subsidy is not needed to move excess litter
out of vulnerable watersheds in Georgia, there is
a role for the state to play. To establish a well-
functioning market for poultry litter, the state
could invest in lowering transaction costs within
a litter market. This could be done by intensifying
efforts to increase awareness and use of Georgia’s
poultry litter exchange website (www.galitter.
org). The state could also consider hiring a
‘‘market-maker’’ to support this effort and to
facilitate the distribution of information and the
development of market relationships. On the de-
mand side, increased extension efforts regarding
the nutrient replacement value of litter would be
helpful. Additionally, the development of water
quality trading programs, like the one actively
supporting poultry litter transfer in Pennsylvania
(Baranyai and Bradley, 2008), could serve as an
impetus for a litter market when phosphorus
regulation is sufficiently strict.
[Received August 2010; Accepted May 2011.]
References
Baranyai, V., and S. Bradley. ‘‘Turning Chesapeake
Bay Poultry Manure and Litter into Energy,’’
Chesapeake Bay Program Report CPB/TRS-289-
08, January 2008.
Carpenter, S.R., N.F. Carrell, R.W. Howarth,
A.N. Sharpley, and V.H. Smith. ‘‘Nonpoint Pollu-
tion of Surface Waters with Phosphorus and Ni-
trogen.’’ Ecological Applications 8(1998):559–68.
Carreira, R.I., K.B. Young, H.L. Goodwin, Jr., and
E.J. Wailes. ‘‘How Far Can Poultry Litter Go? A
New Technology for Litter Transport.’’ Journal of
Agricultural and Applied Economics 39(2007):
611–23.
Collins, A.R., and T. Basden. ‘‘A Policy Evalua-
tion of Transport Subsidies for Poultry Litter in
West Virginia.’’ Review of Agricultural Eco-
nomics 28(2006):72–88.
———. ‘‘Effects of Poultry Litter Application Rate
and Rainfall Intensity on Quality of Runoff from
Fescue grass Plots.’’ Journal of Environmental
Quality 22(1993):361–65.
Kellogg, R.L., C.H. Lander, D.C. Moffitt, and
N. Gollehon. Manure Nutrients Relative to the
Capacity of Cropland and Pastureland to Assimi-
late Nutrients: Spatial and Temporal Trends for the
U.S. Washington, DC: U.S. Department of Agri-
culture, Natural Resources Conservation Service,
2000. 140 pp.
Kissel, D., M. Risse, L. Sonon, and G. Harris.
‘‘Calculating the Fertilizer Value of Broiler Lit-
ter.’’ University of Georgia Cooperative Extension
Circular C933, November 2008.
Kleinman, P.J., and A.N. Sharpley. ‘‘Effect of
Broadcast Manure on Runoff Phosphorus Con-
centrations of Successive Rainfall Events.’’ Jour-
nal of Environmental Quality 32(2003):1072–81.
Lander, C.H., D. Moffitt, and K. Alt. ‘‘Nutrients
Available from Livestock Manure Relative to Crop
Growth Requirements.’’ Resource Assessment
and Strategic Planning Working Paper 98-1, U.S.
Department of Agriculture, Natural Resources
Conservation Service, February 1998.
Lemunyon, J.L., and R.G. Gilbert. ‘‘The Concept and
Need for a Phosphorous Assessment Tool.’’ Jour-
nal of Production Agriculture 6(1993):483–86.
Mokolobate, M.S., and R.J. Haynes. ‘‘Compara-
tive Liming Effects of Four Organic Residues
Applied to an Acid Soil.’’ Biology and Fertility
of Soils 35(2002):79–85.
National Resources Conservation Service. The
Phosphorous Index: A Phosphorous Assessment
Tool. Washington, DC: United States Department
of Agriculture, Natural Resources Conservation
Service, Technical Note, Series No. 1901, 1994.
Paudel, K.P., M. Adhikari, and N.R. Martin, Jr.
‘‘Evaluation of Broiler Litter Transportation
in Northern Alabama, USA.’’ Journal of Envi-
ronmental Management 73(2004):15–23.
Pote, D.H., T.C. Daniel, D.J. Nichlos, A.N. Sharpley,
P.A. More, Jr., D.M. Miller, and D.R. Edwards.
‘‘Relationship between Phosphorus Levels in
Three Ultisols and Phosphorus Concentrations
in Runoff.’’ Journal of Environmental Quality
28(1999):170–75.
Schindler, D.W. ‘‘The Evolution of Phosphorus
Limitation in Lakes.’’ Science 195(1977):260–62.
Vest, L., B. Merka, and W.I. Segars. ‘‘Poultry
Waste: Georgia’s 50 Million Dollar Forgotten
Crop.’’ Georgia Cooperative Extension Leaflet
206. Athens, GA, 1994.
Mullen et al.: Assessing the Market for Poultry Litter in Georgia 567

Willet, K., D.M. Mitchell, H.L. Goodwin,
B. Vieux, and J.S. Popp. ‘‘The Opportunity
Cost of Regulating Phosphorous from Broiler
Production in the Illinois River Basin.’’ Journal
of Environmental Planning and Management
49(2006):181–207.
Appendix
The phosphorous and potassium recommendations
are based on the following equations. The factors
considered are soil nutrient content, crop, and
whether the field is located in the Coastal Plain or
Piedmont region of Georgia. Table A1 presents the
P2O5 recommendation in pounds per acre. Table
A2 presents the K2O recommendations in pounds
per acre.
Table A1. P2O5 Recommendations
Crop Location
Threshold
Soil Level
(lbs P/acre)
Yield Target
(lbs/acre) Recommendation (lbs P2O5/acre)
Corn Piedmont 75 122 2 1.23P 1 0.00574P2
Corn Coastal Plain 100 121 2 0.755P 1 0.00147P2
Cotton Piedmont 75 750 129 2 3.074P 1 0.01435P2
Cotton Piedmont 75 1000 146 2 3.228P 1 0.01196P2
Cotton Piedmont 75 1250 163 2 3.383P 1 0.00957P2
Cotton Piedmont 75 1500 173 2 3.383P 1 0.00957P2
Cotton Coastal Plain 100 750 127 2 1.886P 1 0.00366P2
Cotton Coastal Plain 100 1000 144 2 1.943P 1 0.00183P2
Cotton Coastal Plain 100 1250 160 2 2P 1 0P2
Cotton Coastal Plain 100 1500 170 2 2P 1 0P2
Hay Piedmont 75 129 2 3.074P 1 0.01435P2
Hay Coastal Plain 100 88 2 0.491P 2 0.00293P2
Pasture Piedmont 75 103 2 2.459P 1 0.01148P2
Pasture Coastal Plain 100 76 2 1.132P 1 0.0022P2
P2O5 is Phosphorus pentoxide.
Table A2. K2O Recommendations
Crop Location
Threshold Soil
Level (lbs K/acre)
Yield Target
(lbs/acre) Recommendation (lbs K2O/acre)
Corn Piedmont 75 158 2 0.614K 1 0.00107K2
Corn Coastal Plain 100 152 2 0.79K 1 0.0019K2
Cotton Piedmont 75 750 126 2 0.439K 1 0.00016K2
Cotton Piedmont 75 1000 133 2 0.373K 2 0.00011K2
Cotton Piedmont 75 1250 158 2 0.46K 2 0.00008K2
Cotton Piedmont 75 1500 165 2 0.394K 2 0.00035K2
Cotton Coastal Plain 100 750 123 2 0.672K 1 0.00054K2
Cotton Coastal Plain 100 1000 131 2 0.591K 1 0.00002K2
Cotton Coastal Plain 100 1250 155 2 0.724K 1 0.00012K2
Cotton Coastal Plain 100 1500 163 2 0.644K 2 0.0004K2
Hay Piedmont 75 123 2 0.779K 1 0.00083K2
Hay Coastal Plain 100 273 2 0.779K 1 0.00083K2
Pasture Piedmont 75 98 2 0.622K 1 0.00066K2
Pasture Coastal Plain 100 149 2 1.024K 1 0.00215K2
K2O is Potassium oxide.
Journal of Agricultural and Applied Economics, November 2011568