Embed Size (px)
Citation preview

Assessing the potential impacts of maximum stake reduction on B2 gaming machines Report for bacta January 2018

2
© Centre for Economics and Business Research
Disclaimer
Whilst every effort has been made to ensure the accuracy of the material in this document, neither Centre for Economics and
Business Research Ltd nor the report’s authors will be liable for any loss or damages incurred through the use of the report.
Authorship and acknowledgements
This report has been produced by Cebr, an independent economics and business research consultancy established in 1992. The
views expressed herein are those of the authors only and are based upon independent research by them.
The report does not necessarily reflect the views of bacta
London, January 2018

3
© Centre for Economics and Business Research
Contents
Executive Summary 5
Purpose, objectives, approach and methodology 5
Key findings: LBOs, the gambling sector and the wider economy 5
Key findings: Gamblers, their social networks and wider society 9
1 Introduction 11
1.1 Purpose and objectives of the report 11
1.2 Overview of approach and methodology 11
1.3 Structure of the report 12
2 Starting point: the DCMS Impact Assessment 13
2.1 DCMS estimates of reduced industry GGY 13
2.2 The importance of the behavioural responses of B2 players 13
2.3 Other important aspects of the DCMS model and analysis 14
2.4 A short Cebr critique of the DCMS IA 15
3 The range of potential outcomes and their net economic impacts 17
3.1 Cebr’s baseline model of losses in industry GGY 17
3.2 Cebr’s scenario model of alternative outcomes 21
3.3 Comparative analysis of the different possible baseline scenarios 24
3.4 Comparative analysis of the of plausible alternative outcomes (Cases A-E) 26
3.5 Analysis of the likely net impact on macroeconomic indicators 27
4 The benefits to society of potential reductions in gambling-related harm 32
4.1 Evidence on the cost to society of gambling-related harm 32
4.2 The relative risk of problem gambling associated with B2 machines 35
4.3 Methodology underlying Cebr’s high-level assessment of societal impacts 38
4.4 The results of our assessment 40

4
© Centre for Economics and Business Research
5 Heavier weight on reduced social harm amongst the already deprived 43
5.1 The Law of Diminishing Marginal Utility 43
5.2 The location of Licensed Betting Offices in the UK 43
5.3 Establishing a distribution of gambling-related harm by local authority 44
5.4 Adjusting the value of reductions in social harm to the already deprived 46
Appendix 1: Detailed results for Cases A-E 48
Appendix 2: Synthesis of evidence on gambling-related harm 51
Appendix 3: Updating the evidence used to estimate excess fiscal costs associated with B2 54
Appendix 4: Further detail on estimation of welfare impacts of reducing maximum B2 stakes
56
Attribution notice for the social value bank 48

5
© Centre for Economics and Business Research
Executive Summary
This is the summary of a report by the Centre for Economics and Business Research (Cebr) that presents the results of an independent assessment of the potential impacts of the various proposals for reducing the maximum allowable stakes on B2 gaming machines, often also referred to as Fixed Odds Betting Terminals (FOBTs).
Purpose, objectives, approach and methodology
The potential impacts of reducing the maximum stake on B2 machines are considered from a range of perspectives that fall into two categories.
• Licensed Betting Operators (LBOs), the gambling sector and the wider economy: the impact on the LBOs (which account for 99.2% of all GGY on B2 machines) and the gambling sector in general, the potential for other sectors to benefit if ‘attrition from gambling’ is to be believed and the consequential net impact on the economy.
• Gamblers themselves, their family/social ties and the wider society of taxpayers: we consider the social value of reducing the harm caused by problem gambling that can be linked to B2 machines, not only the harm to the player, but to their family and social networks and others in society affected by it, including taxpayers who ultimately foot the bill for the additional demands placed on public services as a result of problem gambling.
Cebr has undertaken economic modelling that seeks to build on and supplement the existing evidence and data to provide a fresh perspective. Cebr does not believe that the IA released by DCMS to accompany the consultation document provides an adequate treatment of the potential impacts of reducing the maximum stakes on B2 machines. Neither do we think it adequately considers the range of possible outcomes that could be realised under different but equally plausible assumptions about the behavioural responses of gamblers to different reductions in maximum stakes. Another weakness of the IA is the absence of any attempt to attach monetary value to the social harms that can be linked to problem gambling on B2 gaming machines and that could be reduced as a result of a maximum stake reduction.
However, at no point in this report is it Cebr’s intention to be definitive or prescriptive in suggesting that the impacts of lower maximum stakes on B2 machines will follow any of the paths outlined in this report. Rather, our objective is to provide indicative estimates of what their value might be under different sets of assumptions that might be considered to represent at least equally plausible outcomes to what has been presented by DCMS.
Key findings: LBOs, the gambling sector and the wider economy
In respect of the first category of perspectives from which we consider the potential impacts of a reduction in maximum stakes on B2 machines, the key findings of our report are as follows:
• Cebr believes that the DCMS analysis provides an effective distillation of new and existing evidence in terms of predicting how the demand for B2 games is likely to respond to a reduced maximum stake on B2 machines.
• As such, Cebr has constructed a model that, in the first instance, seeks to replicate the results of the DCMS analysis of net losses in industry GGY. By aligning the results of this model with the DCMS

6
© Centre for Economics and Business Research
central estimates of these net losses and backward inducting these results through our baseline, we have produced what is a proxy for the DCMS model by alternative means and that overcomes the significant data limitations we faced due to confidentiality restrictions.
• This backward induction of the DCMS central estimates has provided the basis for a granular analysis of alternative sets of underlying assumptions, including assessments of the implications of these on the GGY of current B2 operators (mainly LBOs) and the implications in net terms for the gambling sector and the wider economy as a whole.
• As a starting point, Cebr compared the DCMS central estimates of net GGY losses to B2 machine operators to two alternative baseline scenarios (developed by Cebr) – one that seeks to take fuller account of the potential strength of the online presence of LBOs (Cebr Alternative Baseline 1) and one that distributes diverted B2 GGY that remains within the gambling industry according to what is currently observed in the distribution of all current GGY excluding that from B2 machines. For all intents and purposes, these (like Cases A-E below) are just different scenarios based on alternative sets of assumptions to those adopted by DCMS. Unlike Cases A-E, however, they were not developed to take better account of the demographic characteristics and circumstances of the B2 player, rather as alternative baselines that address potential uncertainties in interpreting the DCMS central estimates.
Table 1: Two alternatives to the DCMS central estimates of net losses in GGY to B2 machine operators (LBOs)
• The key comparison is between the DCMS central estimates and Cebr’s Alternative Baseline 1, which shows the sensitivity of the DCMS central estimates to changes in the assumptions about the online presence of LBOs. By re-diverting half of what is diverted to online back to the LBOs, the losses in GGY under a £2 stake see a significant fall from the £639 million in the DCMS central estimates to £509 million in Alternative Baseline 1. (We note, for the sake of clarity, that the £509 million is what we expect the DCMS model would predict if it adopted the same assumptions. The £633 million is likewise what we expect the DCMS model would predict under Cebr’s Alternative Baseline 2 assumptions.)
• But Cebr has also produced comparable results for an entirely different set of scenarios (Cases A-E), in which we have sought to represent what might be a better or at least equally plausible representation of the demographics of B2 players, the range of substitution opportunities available to them and the likelihood in practice that they would switch to these other gambling channels.
• However, the alternative cases also seek to incorporate a dose of ‘realism’ in terms of how LBOs can be expected to respond following a reduction in the B2 maximum stake. Given the importance of B2 gaming revenues to the LBOs, we struggle to imagine anything other than a ‘fight’ (on their part) to maintain their overall share of the gambling market by re-capturing as much as possible of the GGY

7
© Centre for Economics and Business Research
that would have been earned on B2 games had the maximum stake on B2 machines not been reduced (as is proposed).
• Table 2 summarises the results of our analysis by comparing Cases A-E with the DCMS central estimates. This shows how plausible variations in the key assumptions underlying the DCMS central estimates have the potential to significantly alter the picture. For instance, at a £2 maximum stake, the alternative cases suggest smaller net LBO losses in GGY – ranging from £530 million in Case A to as low as £159 million under the extreme Case E.
Table 2: Comparison between DCMS central estimates of losses in LBO GGY with a range of alternative plausible outcomes, as represented by Cases A to E
• While it is not possible to be definitive, the balance of evidence suggests that Case D (or some variation) represents a more likely outcome than that represented by the DCMS central estimates. In Case D, the losses in GGY to the current operators of B2 machines is projected to be just over half the DCMS central estimate for each corresponding maximum stake. Case D represents a scenario in which the majority of lost GGY on B2 games that is diverted to other gambling channels is diverted to OTC gambling in LBOs. This cannot be viewed as implausible given the emergence of electronic betting terminals that mimic the LBO’s online platform within LBO premises and the potential for OTC betting on live roulette being shown on TV screens within betting shops. What is diverted to online is assumed to be equally distributed between LBOs and non-LBOs in Case D. Case E is an extreme case that is probably the least plausible of all outcomes, representing a situation in which 95% of the lost GGY on B2 games diverting to other gambling channels diverts to LBO online platforms.
• GGY is not, however, a robust basis for establishing the implications for macroeconomic indicators. It is akin to turnover, which includes a range of gambling-specific taxes as well as supply chain costs. Furthermore, any attrition from gambling is likely to be either saved (thus benefiting the economy through investment in the long term) or spent on other goods and services which could, in turn, provide a boost to other sectors of the economy. Finally, it is not appropriate to consider LBOs in isolation, but through the lens of the gambling sector as a whole, given the many alternative forms of gambling and gambling provider to which former B2 GGY could be diverted.
• The results of our assessment suggest a net increase in GVA contributions to GDP at all potential maximum stakes. This is driven by the fact that, in the sectors that would likely gain from attrition from gambling, one pound of revenue generates more GVA than is observed in the gambling sector (per £ of GGY). The magnitudes are not significant though - ranging from a £4 million increase at a £50 maximum stake to a £45 million increase at a £2 maximum stake.

8
© Centre for Economics and Business Research
Table 3: Economic impacts in terms of net changes in overall GVA contributions to GDP, based on DCMS central estimates
• This paints a different picture to that represented by the rather narrow focus on losses in GGY to the operators of B2 machines. While a £2 maximum stake is expected to result in the largest net losses in GGY to LBOs, it also yields the largest net positive impact on the economy.
• We do admit, however, that it may be possible to argue that these net macroeconomic impacts cannot be said to be anything other than negligible and within the bounds of reasonable margins of error of an expected value of zero. In that case, it would at least be possible to conclude that, even if the net macroeconomic impacts are negative, they are still likely to be negligible in absolute terms.
• The changes in employment in the economy that correspond with the GVA impacts above are presented in Table 4 below. This suggests a net increase in jobs of 2,150 as a consequence of a £2 maximum stake, after netting off a loss of 150 jobs in the gambling sector.
Table 4: Economic impacts in terms of net changes in employment, based on DCMS central estimates
Sources: Cebr Analysis
• In practice, interpreting the consequences for employment is less straightforward than for GVA. It is not inconceivable, for instance, to envisage an increase in employment in the gambling sector if LBOs succeed in maintaining their share of the overall gambling market by stimulating demand for forms of gambling that are more labour-intensive or, alternatively, if the boost to non-LBO providers of gambling is sufficient to generate a large enough number of new jobs to absorb any job losses in LBOs. This would depend again on relative labour intensities, with the reasonable expectation that online gambling is inherently less labour-intensive than B2 machine gambling in LBOs, in which case this outcome would be less likely.

9
© Centre for Economics and Business Research
• In interpreting any projections of net job losses in LBOs as a result of maximum stake reductions on B2 machines, it would be vital to consider the existing circumstances of the LBOs in order to ensure robust lines of causality. For instance, it would be important not to conflate the effects of a reduction in maximum stakes on B2 machines with the consequences of over-zealous investment in betting shops (the only way for LBOs to increase the number of B2 machines that they can operate) to take advantage of a market that was already approaching saturation in terms of growth.
• The gain in jobs in other sectors is likewise uncertain and this would again depend on the wider economic circumstances and the particular circumstances facing the sectors in question. For instance, in a situation in which these sectors already have excess capacity in their ability to supply, any boost in demand is unlikely to result in the creation of many new jobs.
Key findings: Gamblers, their social networks and wider society
• The association between problem gambling and social harm is well-established in the existing literature, with the term ‘gambling-related harm’ most likely coined to summarise this association. To explore the link between B2 machines specifically and problem gambling, Cebr considered the nature of B2 machine play, the risk profile of other machines and the socioeconomic profile of B2 machine gamblers. The hypothesis is that the higher staking levels available on B2 machines (relative to other gaming machines) combined with the socioeconomic profile of B2 machine gamblers, raises the risk of either causing or exacerbating problem gambling and the associated social harm.
• Whilst stakeholders like the ABB point to the concept of ‘average loss per minute’ and to data suggesting that the loss per minute on B2 roulette play is significantly lower than on other categories of machines, this indicator has the potential to conceal incidences of the large losses that it is possible to accumulate on B2 machines, given the significantly higher staking possibilities. Furthermore, most if not all of the social harm that it is possible to link problem gambling on B2 machines can be expected to be the result of large losses of this nature. Indeed, Gambling Commission data provides clear evidence that extreme outcomes for the gambler are more frequent on B2 machines than on the other types of machine featured.
• In terms of the socioeconomic profile of B2 players, the available data provides some evidence of the concentration of B2 machine play amongst members of society that are already socially and economically disadvantaged. This includes NatCen data suggesting: (i) a higher prevalence of B2 machine play amongst the unemployed; (ii) that 61% of B2 loyalty card gamblers have a personal income lower than the UK median; and (iii) that, while the highest share of losses are incurred by players with income in excess of £26,000, the percentage of losses attributable to gamblers with an income of less than £10,400 is substantial.
• To produce indicative estimates of the possible societal impacts of a reduction in B2 maximum stakes, we build on the evidence presented in the 2016 IPPR report Cards on the table - The cost to Government associated with people who are problem gamblers in Britain. We used this to establish the share of the excess fiscal costs identified by IPPR that might reasonably be associated with problem gambling specifically linked to B2 gaming machines.
• Separately to this, we estimate welfare impacts by drawing on the Housing Association’s Charitable Trust (HACT) and Simetrica “Community and investment and homelessness values from the Social Value Bank” database (see www.socialvaluebank.org). This resource provides data that can capture the monetary value of impacts that typically occur ‘outside the market’ (or, equivalently, outside of the domain of macroeconomic indicators like GDP and employment). The Social Value Bank is used to obtain the value that the average person attributes to aspects such as having a job, being

10
© Centre for Economics and Business Research
financially stable and having good health and we assume that these are valued in the same way by B2 problem gamblers as by any other member of society.
• This analysis reveals that problem gambling linked to B2 machines could be associated with an excess fiscal cost in the region of £210 million. This translates to an estimate of £1,723 per B2 problem gambler. In welfare terms, the population of B2 problem gamblers could be imposing a cost of £1.5 billion on themselves, their families and their wider social networks. This equates to about £13,780 per B2 problem gambler.
• But it is not our intention to suggest that lower maximum stakes on B2 machines will simply erase the excess fiscal costs or the welfare costs associated with problem gambling on B2 machines. Outcomes are, in reality, unlikely to be binary in the sense that problem gamblers are unlikely to stop being problem gamblers as a result of the single policy measure under consideration – a reduction in maximum stakes on B2 machines. It is more realistic to think in terms of a two-dimensional spectrum of prevalence (in this case, the number of problem gamblers) and severity of the problem (in terms of the losses, especially relative to personal income). A reduction in the maximum stakes on B2 gaming machines should be expected to reduce prevalence but, even if it did not, it would surely have the potential to reduce the exposure to and severity of large losses amongst problem gamblers that continue to play on machines in LBOs.
• Assuming that a reduction in the maximum stake on B2 machines to £2 results in a 50% reduction in the prevalence and severity of B2 problem gambling, benefits of £105 million could be realised in the form of a reduced excess fiscal burden. Welfare benefits of £565 million and £186 million could be realised by, respectively, B2 problem gamblers and their families/social networks, in the form of a reduction in the welfare cost associated with B2 gambling-related harm.
• Cebr has also explored the potential to attach a higher weighting to the benefits of reducing the social harms associated with problem gambling if the harms are falling disproportionately on those who are already disadvantaged in socioeconomic terms. To that end, our research reveals a strong positive association between the concentration of Licensed Betting Offices (betting shops) and the deprivation score of the Local Authority Districts in which they are located. Similar (but even stronger) links were observed when mapping the local concentration of betting shops to unemployment, economic inactivity and claimant count rates observed in the Districts in which those concentrations exist.
• While it is unclear whether the Index of Multiple Deprivation is the appropriate indicator to use, it at least provides some indication of the impact of an attempt to factor in the distributional implications for policy of the Law of Diminishing Marginal Utility. According to this, each nominal additional £1 of benefit will be worth more in real terms to a person who is deprived than to a person who is not. As such, the monetary estimates of the potential benefits of reducing the social harms associated with problem gambling on B2 machines presented above may not reflect their true value to society if they are likely to disproportionately benefit those who are economically and socially disadvantaged.
• The results suggest that the application of these weightings produce a 10% increase in the value of the potential welfare benefits that could be associated with any reduction in (the prevalence and/or severity of) problem gambling. This would increase the welfare benefits to problem gamblers from the £565 million outlined above to £619 million and to their families/friends from £186 million to £204 million.

11
© Centre for Economics and Business Research
1 Introduction This report by the Centre for Economics and Business Research (Cebr) presents the results of an independent assessment of the potential impacts of the various proposals for reducing the maximum allowable stakes on B2 gaming machines, often also referred to as Fixed Odds Betting Terminals (FOBTs). This report was commissioned by Bacta, the voice of the British amusement industry.1
1.1 Purpose and objectives of the report
The current maximum stake on B2 machines is £100 and the Department for Culture, Media and Sport (DCMS) is consulting on a range of options for its reduction, ranging from £50 right down to £2.
Bacta requested Cebr to consider the net impact on the economy that could be expected to arise as a result of reducing the maximum stakes on B2 machines, including a consideration of where alternative expenditure might occur and the likely implications for employment. Bacta also requested Cebr to consider the economic costs of the social harm caused by problem gambling, whether a clear link could be established between some proportion of this cost to society and FOBTs and how it might be impacted if new reduced maximum stakes on B2 machines succeeded in reducing the extent or, at least, severity of problem gambling.
This is important in the context of a DCMS Impact Assessment (IA) accompanying the consultation document on maximum stake reductions that is rather limited in its focus on only monetising the potential losses in Gross Gambling Yield (GGY) to the current operators of B2 machines – predominantly Licensed Betting Offices (LBOs), but also some casinos.
With this in mind, the objective we set ourselves in producing this report was to assist in painting a more balanced picture of the potential implications of the policy. The impacts on the GGY of the current operators of B2 machines is only a starting point and says nothing about the likely net impacts on the macro economy. Neither does it capture the value to society of potential reductions in gambling-related harm that can be linked to B2 gaming machines.
1.2 Overview of approach and methodology
The potential impacts of reducing the maximum stake on B2 machines are considered from a range of perspectives that fall into two categories.
• LBOs, gambling sector and wider economy: first, we assess the impact on LBOs and the gambling sector in general, the potential for other sectors to benefit if ‘attrition from gambling’ is to be believed and the consequential net impact on the economy.
• Gamblers themselves, their family/social ties and wider society of taxpayers: second, we consider the social value of reducing the harm caused by problem gambling that can be linked to B2 machines, not only the harm to the player, but to their family and social networks and others in society affected by it, including taxpayers who ultimately foot the bill for the demands placed on public services as a result of problem gambling.
Cebr has undertaken economic modelling that seeks to build on and supplement the existing evidence and data to provide a fresh perspective. Cebr does not believe that the IA released by DCMS to accompany the consultation document provides an adequate treatment of the potential impacts of
1 See http://www.bacta.org.uk/

12
© Centre for Economics and Business Research
reducing the maximum stakes on B2 machines. Neither does it adequately consider the range of possible outcomes that could be realised under different but equally plausible assumptions about the behavioural responses of gamblers to different reductions in maximum stakes. Another weakness of the IA is the absence of any attempt to attach monetary value to the social harms that can be linked to problem gambling on B2 gaming machines and that could be reduced as a result of a maximum stake reduction.
We note at the outset that at no point in this report is it Cebr’s intention to be definitive or prescriptive in suggesting that the impacts of lower maximum stakes on B2 machines will follow any of the paths outlined in this report. Rather, our objective is to provide indicative estimates of what their value might be under certain plausible sets of assumptions that might not be considered unreasonable or any less realistic than the assumptions underlying the DCMS assessment.
1.3 Structure of the report
The remainder of this report is structured as follows:
• Section 2: Review of DCMS Impact Assessment
This section provides an overview of the Impact Assessment undertaken by DCMS. The focus of the IA is on the financial impact of reducing the maximum stake on B2 games on the operators of B2 machines. This is a logical starting point, not least because the IA provides the necessary foundation for Cebr’s analysis in Section 3.
• Section 3: The range of potential outcomes and their net economic impacts
This section seeks to demonstrate the wide range of potential outcomes that could be realised under different but equally plausible assumptions about the behavioural responses of gamblers to a maximum stake reduction on B2 machines. Specifically, we show how variations from the behavioural assumptions underlying DCMS’ central estimates of the loss in industry GGY can produce outcomes that are not nearly as detrimental to the operators of B2 machines as the central estimates presented in the IA would suggest.
• Section 4: The benefits to society of potential reductions in gambling-related harm
This section provides a review of the existing evidence on the impacts of the social harm that can be caused by problem gambling. This provides a foundation for an initial assessment of the potential for maximum stake reductions on B2 gaming machines to reduce problem-gambling and, to the extent that they could, the value of the potential benefits to the individual problem gamblers themselves and to wider society associated with the consequent reductions in gambling-related harm.
• Section 5: The appropriate weighting of gambling-related harms on B2 machine gamblers
This section focuses on assessing whether B2 machines disproportionally affect gamblers from a lower socioeconomic background, given their concentration in deprived areas across the UK. This provides the foundation for increasing the emphasis or weighting on the value of any potential reductions in gambling-related harm to society.
The four appendices to the report are organised in a manner consistent with the order in which they are referred in the main body of the report.

13
© Centre for Economics and Business Research
2 Starting point: the DCMS Impact Assessment This section provides an overview of the IA released by DCMS to accompany the consultation document. In terms of monetised costs and benefits, the focus of the IA is on the financial impact of reducing the maximum stake on B2 games on the operators of B2 machines. This is a logical starting point, not least because the IA provides the necessary foundation for Cebr’s analysis in Section 3 of this report.
DCMS anticipates that a reduction in the maximum permitted stake on B2 gaming machines means there is likely to be a reduction in GGY for the operators of these machines. This reduction in B2 GGY can be expected to have a corresponding impact on industry revenue. Cebr’s interpretation of ‘industry’ here is that which consists of the operators of B2 gaming machines – principally LBOs, but also some casinos.
2.1 DCMS estimates of reduced industry GGY
The results of the DCMS IA analysis, in terms of the reduction in industry GGY, are summarised in Table 5 below.
Table 5: DCMS central estimates of net losses in GGY to the operators of B2 machines as a result of new reduced maximum stake
Source: Impact Assessment accompanying DCMS consultation document (Oct 2017)2
As can be seen from the table, the estimated reduction in industry revenue is increasing in the level of B2 maximum stake reduction. At a £50 maximum stake, the cost to the industry is estimated to be £34.7 million, while a £2 maximum stake envisages a £639 million loss in industry revenue.
2.2 The importance of the behavioural responses of B2 players
Underpinning these estimates are key assumptions on the behavioural responses of individual gamblers to a new maximum stake. There are a number of key mechanisms for relating potential maximum stake reductions to changes in industry revenue, as follows:
1 Percentage of high staking players reducing stakes to the new cap: acknowledged as the primary mechanism, with the model assuming that some B2 players will stake down to the new maximum stake. DCMS bases this on KPMG’s study for the Association of British Bookmakers (ABB), which estimated that, dependent on current stake level, a proportion of players can be expected to have a preference for maintaining machine play at the new stake limit. Assuming that session lengths
2 See Annex A – B2 Cost model output of DCMS (2017) “Consultation on proposals for changes to Gaming Machines and Social
Responsibility Measures”.

14
© Centre for Economics and Business Research
remain constant, this can be expected to reduce spend per session, with a corresponding impact on machine GGY.
2 Level of session adjustment: this acknowledges that revenue losses would be dampened if some players choose to gamble at a lower stake limit for longer periods. DCMS estimates how long the average session length changes for players who opt to stake down, “in line with data provided by the Gambling Commission”.
3 Attrition from gambling: this acknowledges that revenue could be lost from players who choose not to gamble at the new cap and who choose not to migrate their gambling spend elsewhere, which takes this spend out of the gambling industry.
4 Gambling through other channels: this acknowledges that revenue losses might be mitigated if some of the players who choose not to play at the new stake limit migrate their gambling spend to other forms of gambling. To incorporate this, DCMS observes that, according to data provided by the Gambling Commission, more than 75% of machine gamblers also participate in at least one other form of gambling. On this basis, DCMS assumes that for those who gamble through multiple channels currently, migrating spend from one to another will be far more likely than for those players who solely engage in B2 gambling.
The estimates of how a reduction in maximum stake can be expected to affect GGY will depend heavily on the assumed propensity of individuals to act through each of the four channels identified above. Specifically, player behaviour is assumed by DCMS to vary depending on the extent to which the new maximum stake would cause players to change their staking behaviour. For B2 machine gaming, players are separated into three groups – those currently staking at each of 3, 2 or 1 band higher than the proposed stake cap. For each group, behavioural assumptions are provided for:
• The take-up of the reduced maximum stake (or, as above, the percentage of gamblers who previously bet above the new maximum stake who will continue to gamble on B2 machines at the new maximum stake);
• The level of session adjustment; and
• The level of attrition from gambling.
2.3 Other important aspects of the DCMS model and analysis
In a section of the IA entitled “Explanation of what we think will happen based on previous evidence”, DCMS opens with a tabular summary of KPMG’s findings for LBOs based on alternative maximum stakes of £2, £20 and £50. KMPG’s estimates suggest that the imposition of a £2 maximum stake would result in a 65% reduction in LBO revenue, a 28% reduction under a £20 maximum stake and a 5% reduction under a £50 maximum stake.
However, paragraph 12 (p. 27) of the DCMS IA appears to imply that KPMG’s estimates do not take account of the mitigating factors of (i) longer sessions at the lower stake limit or (ii) the migration of spend to different gambling channels. Our interpretation is that DCMS makes this point as a way of differentiating its analysis from that of KPMG.
Nonetheless, the DCMS model used to produce changes in industry revenue in response to reductions in the maximum stake “is built upon a method for adjusting plays in each staking band based on variable

15
© Centre for Economics and Business Research
assumptions similar to those used by KPMG”.3 The method, says the IA, is underpinned by data on spins and total stake – from the machine manufacturers, SG and Inspired Gaming – which includes the number of spins and the gross stake expected for each staking category.
Noting that the return-to-player ratio at which B2 roulette games (the focus of this report) is 97.3%, the DCMS model adjusts GGY based on changes in player behaviour, calculated using the aforementioned assumptions for the different staking groups. The level of loss of GGY depends on the stake cap, with a lower stake cap imposing a larger loss, as per Table 5 above. But DCMS notes that “predicting player behaviour becomes less accurate [at the lowest stake caps] than at higher stake caps”. This potential loss of accuracy arises because player behaviour may change more substantially with smaller maximum stakes than higher ones.
2.4 A short Cebr critique of the DCMS IA
Cebr believes that the DCMS analysis provides an effective distillation of new and existing evidence in terms of predicting how the demand for B2 games is likely to respond to a reduced maximum stake on B2 machines. Beyond this, the IA does, arguably, have a number of limitations. These are outlined as follows.
Questionable assumptions about gambler behaviour having dropped B2
The IA’s central estimates of reductions in industry GGY represent what might reasonably be described as one of many possible outcomes of the policy. Cebr is of the view that there are a wide range of other outcomes that could be realised under different but equally plausible assumptions about the behavioural responses of gamblers to the maximum stake reduction. We show in Section 3 how variations in these behavioural assumptions can produce outcomes that are not nearly as detrimental to the operators of B2 machines as the central estimates presented in the IA would suggest.
Unbalanced representation of the potential net macroeconomic impacts
The IA acknowledges that the task of assessing net economic impacts is not straightforward: “The framework for analysis only looks at gambling markets through the impact on machine revenues... however, it does not attempt to look at the effects on the rest of the economy (general equilibrium) because doing so would be disproportionate relative to the size of the policy impacts expected.”
Cebr accepts that the use of a general equilibrium framework would be disproportionate relative to the size of the policy impacts expected. However, Cebr does think that the IA could have gone further in terms of the application of a partial equilibrium framework. This, we believe, would have assisted DCMS in painting a more balanced picture in terms of the monetised costs and benefits of the policy. This is the principal objective of Section 3.
No attempt to monetise the value to society of potential reductions in gambling-related harm
The IA is lacking in the monetisation of anything beyond effects on industry GGY. But, it does acknowledge that, for each stake reduction option, the most significant benefits are:
• The benefits to society of reduced gambling related harm; and
3 This would appear to refer to the behavioural assumptions for the three staking groups, but it is not clear. See DCMS (2017,
p.27) “Consultation on proposals for changes to Gaming Machines and Social Responsibility Measures”.

16
© Centre for Economics and Business Research
• As a result of reduced harm, reduced government expenditure on programmes linked to gambling-related harm, including healthcare (psychological therapy), welfare costs, housing costs and criminal justice costs.
The IA also notes: “We [DCMS] believe that any reduction in GGY due to a new lower maximum stake is directly linked to a reduction in losses amongst players. Given players that exhibit problematic play contribute disproportionately to B2 GGY, this reduction in losses to these players could result in a reduction in harm.”
Cebr acknowledges the difficulties, but the absence of any attempt to translate the impacts on GGY into potential reductions in harmful losses to B2 players would have been beneficial in terms of painting a balanced picture through the IA. Furthermore, surely it is possible to say that a reduction in B2 losses will result in a reduction in harm when the player is on a small income or on state benefits, which has been shown to be the circumstances of many B2 players.
We also note that there may be reluctance to seek to monetise the benefits to society of the potential reductions in gambling-related harm and that this could well relate to HMT scepticism about the robustness of the valuations that exist of concepts like wellbeing, happiness, satisfaction, utility and welfare. Nonetheless, the work that has been done in this area by academics at the London School of Economics is referenced in the Green Book on appraisal and evaluation in central government. Therefore, surely it is better to use what does exist – even if there is not complete faith in the current estimates – to establish at least some idea of the scale of the implicit value in reducing gambling related harm.
In reference to the DCMS expectation of significant non-monetised benefits to society as a result of reduced maximum stakes on B2 machines, the IA notes: “These benefits accrue via reduced gambling-related harm. It is impossible to accurately quantify these benefits given the data available but given the social costs of gambling-related harm we expect any action taken to limit the prevalence of harm from addiction to have significant positive social benefits.” This arguably begs the question as to why no attempt is made to turn these social costs of gambling related harm on their head, translating reductions in those costs into the benefits of reducing such harm. Some proportion of this could then be allocated to B2 gaming machines according to the share of all gambling related harm that can be attributed to these machines.
We also note the necessity of considering, as the IA does, the potential disbenefits of the policy in terms of the restriction on gamblers’ ability to gamble in their preferred way. As the IA notes: “There may a dis-benefit associated with restricting gamblers ability to gamble in their preferred way. This is because non-problem gamblers gain utility from staking at the level they wish to, and any restriction of their ability to stake at the level they wish may lead to a loss of utility derived from gambling. This has not been quantified however, steps will be taken during the consultation to address this.” However, given the wide range of alternatives to gambling on B2 machines, we doubt that there would be anything but negligible losses of utility in net terms.
Section 4 considers the evidence available to support an indicative monetisation of the value to society of the potential reductions in gambling-related harm that could result from reduced maximum stakes on B2 machines. It also provides Cebr’s attempt to build on this evidence to produce an indicative monetisation, with a view to helping DCMS to fill the gaps in the IA and to paint a more balanced picture of the likely net impact on society of the policy. Before that, Section 3 considers in more detail the expected impacts on LBOs, on the gambling sector as a whole but also, in net terms, on the wider macro economy.

17
© Centre for Economics and Business Research
3 The range of potential outcomes and their net economic impacts
This section seeks to demonstrate the wide range of potential outcomes that could be realised under different but equally plausible assumptions about the behavioural responses of gamblers to a maximum stake reduction on B2 machines. Specifically, we show how deviations from the behavioural assumptions underlying DCMS’ central estimates of the losses in industry GGY can produce outcomes that are not nearly as detrimental to the operators of B2 machines as the central estimates presented in the IA would suggest.
We have also sought to address the unbalanced representation of the potential net economic impacts. This is provided through the application of a partial equilibrium framework, the absence of which from the IA is, as already noted, an addressable shortcoming of the DCMS analysis in painting a more balanced picture.
This section is structured as follows. Section 3.1 establishes Cebr’s baseline model of losses in industry GGY, which is then aligned to the DCMS results for the sake of comparability. Section 3.2 outlines the method underlying Cebr’s scenario modelling of alternative outcomes. Sections 3.3 and 3.4 provide comparative analyses of, respectively, a range of possible baseline scenarios and a range of entirely different outcomes that might be viewed as at least equally, if not more, plausible. Section 3.5 concludes with an assessment of the net implications for the UK macro economy.
3.1 Cebr’s baseline model of losses in industry GGY
To achieve these objectives, Cebr has constructed a model that, in the first instance, seeks to replicate the results of the DCMS analysis of losses in industry GGY.
Challenges in replicating the DCMS results
To do so, Cebr has had to overcome the challenge of not having access to a number of the key data sources underlying the DCMS analysis, due to confidentiality restrictions. Specifically, Cebr had no access to data on:
• The percentage of high staking players reducing stakes to the new cap: the DCMS IA uses data from a report by KMPG, which estimated the proportion of gamblers who have a general tendency to maintain machine play at new maximum stake levels. This proportion will vary with the stake level.
• The level of session adjustment: the IA uses confidential data from the Gambling Commission to estimate how average session duration varies with changes in maximum stakes.
As such, the model constructed by Cebr is not capable of producing results that exactly match the DCMS findings. The approach adopted to overcome this is set out below, including a review of the accuracy of the Cebr baseline. First we set out the basis for this baseline.
The foundations of Cebr’s baseline model
Subsection 2.2 above highlighted the four key mechanisms for relating maximum stake reductions on B2 games to changes in industry revenue, namely:
• Percentage of high staking players reducing stakes to the new cap;
18
© Centre for Economics and Business Research
• Level of session adjustment;
• Migration to other gambling channels; and
• Attrition from gambling.
The first two behavioural response mechanisms determine the level of GGY on B2 games that is retained following a change in the maximum stake – by those high-staking players who continue to play B2 games but who adjust their staking behaviour to the new maximum stake and by those players who choose to gamble at a lower stake limit for longer periods. To represent these effects, Cebr developed the concept of a ‘retention rate’, which can be conceptualised as:
𝑅𝑒𝑡𝑒𝑛𝑡𝑖𝑜𝑛 𝑟𝑎𝑡𝑒 = 𝐺𝑎𝑖𝑛 𝑖𝑛 𝐺𝐺𝑌 𝑓𝑟𝑜𝑚 𝐵2 𝑔𝑎𝑚𝑒𝑠 𝑎𝑡 𝑜𝑟 𝑏𝑒𝑙𝑜𝑤 𝑡ℎ𝑒 𝑛𝑒𝑤 𝑐𝑎𝑝
𝐿𝑜𝑠𝑠 𝑖𝑛 𝐺𝐺𝑌 𝑓𝑟𝑜𝑚 𝐵2 𝑔𝑎𝑚𝑒𝑠 𝑎𝑏𝑜𝑣𝑒 𝑡ℎ𝑒 𝑛𝑒𝑤 𝑐𝑎𝑝
This formulation seeks to capture the gross or overall rate of loss in GGY from B2 games as the ratio between:
a What is likely to be retained through the mitigating effects of some high-staking players continuing to play B2 at the new maximum stake and the likelihood that some of those players will gamble at the lower stake limit for longer (increases is session length) and:
b The loss in GGY from B2 games as a result of the inability to stake above the new maximum.
The retention rate is a fraction less than one and subtracting it from one provides an overall gross GGY loss ratio. The smaller the maximum B2 stake, the smaller the retention ratio and the larger the gross loss rate becomes.
A retention rate is estimated for each possible maximum stake in the range of £2 to £50 at £1 intervals. To do so, we derived a retention rate function based on existing data from the DCMS report “Evaluation of Gaming Machine Regulations 2015”4, which considers the effect of a £50 “soft” cap. We calculated the retention rate for the £50 maximum stake using the above formula and then used the retention rate function to derive corresponding values for maximum stakes below £50.
At each maximum stake level, the application of the retention ratio to current GGY from B2 games provided an initial estimate of gross losses in GGY from B2 games at each stake level.5 This is Cebr’s starting point in terms of moving on to consider the third and fourth channels above – migration to other gambling channels and attrition from gambling.
These are concerned with how the loss of GGY on B2 games specifically could be spent elsewhere, either within the gambling sector or on other goods and services. Cebr’s interpretation of the DCMS starting point is an assumption that 25% of the gross losses in GGY from B2 games is retained by the current operators of B2 machines through B3 play.
4 See DCMS (2016) “Evaluation of Gaming Machine (Circumstances of Use) (Amendment) Regulations 2015”. 5 The current GGY from B2 games is assumed to be £1.27 billion, which is derived from the 2016-17 GGY of £1.82 billion on B2
machines and an assumption that 70% of GGY from B2 machines is derived from B2 gaming content.
19
© Centre for Economics and Business Research
Attrition is assumed to be 10% of the same gross losses. This is important in understanding the net impact on the economy - although the revenue may be lost to the gambling industry, most if not all is likely to be spent elsewhere, thus benefiting other sectors of the economy.
On the issue of attrition, data from the Gambling Commission suggests that over 75% of all gamblers engage in at least one other form of gambling. This casts some doubt over whether any attrition from gambling can be expected as a result of reduced maximum stakes on B2 machines, especially if B2 roulette play can be classed as high-stakes gambling. In other words, basic logic and common sense suggests that B2 players who reduce their B2 expenditures (either partially or entirely) will simply migrate to other gambling channels.
Nonetheless, the 10% attrition assumption is adopted in Cebr’s model baseline but we later examine how reducing this assumed rate could impact on the projected net effects on the economy.
Of the remaining gross losses in GGY (65% of the total, having extracted 25% retention through B3 and 10% attrition), our understanding is that DCMS assumes diversion to other gambling channels in the following proportions:
• One-third to over-the-counter (OTC) betting;
• One-third to online gambling; and
• One-third to casinos.
For modelling purposes, Cebr used these assumptions to estimate ‘attenuation’ factors, which address the likelihood that losses in GGY can be expected to be distributed across a potentially wide range of other gambling channels, both within LBOs and through other gambling outlets, such as casinos, adult gaming centres, bingo halls and online.
There are several reasons to question the plausibility of the ‘attenuation’ assumptions underlying the DCMS IA and, for that reason, Cebr’s scenario model of alternative outcomes is largely concerned with testing alternative attenuation factors. This is the subject of subsection 3.2 below.
Aligning Cebr’s model to the DCMS results
We noted above that the model constructed by Cebr is not capable of producing results that exactly match the DCMS findings due to a lack of access to the commercially sensitive data that was available to DCMS.
However, Cebr’s model baseline, which seeks to adopt the same assumptions underlying the IA’s central estimates of losses in industry GGY, is reasonably accurate at higher maximum stakes. For instance, at a £50 maximum stake, Cebr’s model predicts losses in industry GGY of £27.5 million, about £7.2 million lower than the DCMS estimate of £34.7 million.
But the model becomes increasingly inaccurate as the maximum stake levels drop below £50, with a maximum difference of about £145 million at a £10 maximum stake. Cebr’s baseline model then regains some accuracy at maximum stakes below £10. It predicts a £589.2 million loss in industry GGY at a £2 maximum stake, which is about £49.7 million lower than the DCMS estimate of £638.9 million – a much smaller discrepancy than at the £10 maximum stake level. This discrepancy is illustrated for all maximum stakes between £2 and £50 in Figure 1 below.

20
© Centre for Economics and Business Research
To overcome this, Cebr has aligned the results of its baseline model to the DCMS central estimates, as presented in Table 5 above. In other words, although the magnitudes of industry GGY losses produced by the Cebr model are different, the direction of travel is consistent with the DCMS central estimates.
Figure 1: Cebr’s baseline predicted losses vs. DCMS central estimates losses
Sources: Cebr Analysis
By aligning the Cebr’s model with the DCMS results and backward inducting these through our model, we have produced what is a proxy for the DCMS model by alternative means and that overcomes the data limitations we faced. This backward induction of the DCMS results supports, in turn, the granular analysis of alternative attrition and attenuation assumptions, an assessment of the implications of these on the GGY of current B2 operators (mainly LBOs) and the implications in net terms for the gambling sector and the wider economy as a whole, the subject of the remainder of this section of the report.
Before proceeding, we note that we sought to understand better what might be driving the differences between the Cebr baseline and the DCMS central estimates. This amounted to testing the performance of the Cebr ‘retention rate’ assumptions (and consequent overall loss rates in GGY from B2 games at each possible maximum stake). We used Cebr’s aligned baseline model (which replicates the DCMS estimates) to backward induct the retention rates implicit in the DCMS results. These are compared with the retention derived by Cebr for its original baseline model, as featured in Figure 2 above. As such, the results mirror the picture in Figure 1, with the maximum difference at the £10 maximum stake and the original Cebr model regaining accuracy at maximum stakes less than £10.
At the £2 maximum stake, the retention rate derived for the purposes of Cebr’s original baseline is actually lower than that assumed by DCMS. Nonetheless, to ensure consistent comparisons, the rest of this section builds on the version of Cebr’s baseline model that is aligned with the DCMS central estimates. This effectively aligns Cebr’s retention assumptions with the retention assumptions implicit in the DCMS results.
-
100
200
300
400
500
600
700
£2
£4
£6
£8
£10
£12
£14
£16
£18
£20
£22
£24
£26
£28
£30
£32
£34
£36
£38
£40
£42
£44
£46
£48
£50
Cebr baseline DCMS central estimates

21
© Centre for Economics and Business Research
Figure 2: Cebr’s baseline retention rates vs. implied retention rates built into DCMS central estimates
Sources: Cebr Analysis
3.2 Cebr’s scenario model of alternative outcomes
This section outlines the basis for Cebr’s scenario model of alternative outcomes. Before considering what we believe might constitute equally plausible assumptions about the diversion of lost B2 revenues, Cebr considers what we have termed ‘alternative baseline scenarios’.
Cebr’s alternative baseline scenarios
As part of its scenario modelling, Cebr has produced two alternative baseline scenarios, in order to consider remaining uncertainties in interpreting the DCMS assumptions and central estimates of reductions in GGY. These uncertainties relate to whether the significant online presence of the ‘big four’ bookmakers has been taken into account in the DCMS assumptions. There is no evidence to suggest that it has, in which case there is good reason to believe that some share of the former B2 spend assumed to be diverted to online gambling would accrue back to the LBOs. This could be expected to mitigate the losses in industry GGY suggested by the DCMS central estimates.
The alternative baseline scenarios are summarised as follows:
• Alternative Baseline 1: this involves assuming that half of the one-third of what is lost to LBOs in terms of GGY from B2 games (net of B3 retention and attrition), and diverted to online gambling, accrues back to LBOs through their online platform.6 The other half is assumed to accrue to non-LBO online operators. This allows us to see how the DCMS central estimates might be expected to change having taken account of this mitigating factor for LBOs, the predominant operators of B2 machines.
• Alternative Baseline 2: this involves a complete departure from the DCMS assumptions and involves assigning proportions of diverted spend to LBO and non-LBO activities using GGY data from the Gambling Commission. In other words, diverted spend is assumed to be allocated according to the distribution of GGY across all gambling channels as it is today (excluding B2 machines in LBOs). As in
6 It is assumed, for the sake of simplicity, that any losses in GGY from B2 games in casinos is absorbed by casinos or by online
providers other than LBOs (and might be the online platform of the casino itself). We also note that smaller independent Licensed Betting Operators are unlikely to have online platforms. In their case, GGY that is diverted to online is likely to benefit the online platforms of others, but with a significant share likely to be captured by the ‘big four’ LBOs.
0%
20%
40%
60%
80%
100% £
2
£4
£6
£8
£10
£12
£14
£16
£18
£20
£22
£24
£26
£28
£30
£32
£34
£36
£38
£40
£42
£44
£46
£48
£50
Cebr baseline DCMS central estimates

22
© Centre for Economics and Business Research
the DCMS baseline and Cebr’s Alternative Baseline 1, these shares (attenuation factors) are applied to LBO GGY losses on B2 machines after netting off LBO GGY retention through B3 and attrition. The diversion of spend in this alternative baseline scenario reflects the relative size of the various gambling channels today, although there is still considerable uncertainty around the LBO share of the online market in this potential alternative baseline.
The assumptions underlying how the attenuation factors vary between the DCMS baseline and Cebr’s alternative baselines is shown in Table 6 below.
Table 6: How the assumed attenuation factors (diversion of lost B2 spend to other gambling channels) vary across the alternative baseline scenarios
Sources: Cebr Analysis
The outcomes derived for Cebr’s alternative baseline scenarios are presented in Table 8 in Subsection 3.3 below.
Case analysis of a sample of entirely different scenarios
Table 7 below presents the assumed attenuation factors underlying an entirely different set of scenarios to those featured in the three alternative baselines. These are represented as Cases A-E in Table 7 below, which shows how the attenuation factors are assumed to vary between each case.
Table 7: Attenuation factor assumptions
Sources: Cebr Analysis
These alternative cases represent, as already noted, what might reasonably be considered as equally, if not more, plausible assumptions around the diversion of lost B2 spend to non-B2 channels within and outside the LBO environment. The outcomes under all cases are compared to the DCMS central estimates of the losses in industry GGY in Subsection 3.4 below.
In the alternative cases A to E, we have sought to represent what Cebr considers might provide more realistic representations of the demographics of B2 players, the range of substitution opportunities available to them and the likelihood in practice that they would switch to these other gambling

23
© Centre for Economics and Business Research
channels.7 However, the alternative cases also seek to incorporate a dose of ‘realism’ in terms of how LBOs can be expected to respond following a reduction in the maximum stake on B2 machines. Given the importance of B2 gaming revenues to the LBOs, we struggle to imagine anything other than a ‘fight’ (on their part) to maintain their overall share of the gambling market by re-capturing as much as possible of the GGY that would have been earned on B2 games had the maximum stake on B2 machines not been reduced (as is proposed).
This scepticism about the magnitude of the negative impacts on LBOs is based on considerations like the following:
• Advertising of online availability of B2 content: a feature of B2 machine play is continual reminders that the gaming content is also available through the website of the LBO. At least some players who respond to a maximum stake reduction on B2 machines by switching to online play can be expected to use the platform of the LBO that they most frequently visit, or other LBO platforms at the very least. This is not unreasonable given the ‘trust’ that can be naturally associated with the ‘big four’ LBO brands, not least due to their physical presence on the high street. We believe that any shift to non-LBO online platforms is likely to be concentrated amongst the large online-only players, such as Betfair. We note however, that this consideration must be tempered by the fact that many high stakes B2 players demonstrated a continued reluctance to set up account-based play in response to the introduction of the so-called ‘soft’ cap on maximum B2 stakes (the requirement to set up an account in order to stake in excess of £50 on any single play). Online play also requires accounts to be set up and may not, therefore, be a realistic option for some proportion of B2 players.
• Availability of over-the-counter roulette play: visits to a small number of LBO premises revealed the availability of OTC options to play roulette - the most popular form of B2 machine play - that is being played live on TV screens within the LBO. While we understand that this cannot be said to widespread, we also understand that this was a more common feature of the LBO offer before the introduction of B2 gaming machines and that a resurgence might be considered a rational response on the part of the LBOs to maximum stake reductions on B2 machines. It also seems logical given that there would always be the requirement for some form of OTC interaction regardless of the size of the stakes being gambled on this form of roulette betting.
• The emergence of new electronic betting machines within LBOs: these new electronic betting terminals, for all intents and purposes, mimic the OTC elements of an LBO’s online platform. Our understanding is that, although account-based play is possible on these new terminals, they still facilitate the avoidance of OTC interaction with LBO staff that is a characteristic of B2 machines. These are likely to provide a realistic substitutable alternative for B2 players that want to continue to engage in high-stakes gambling in LBOs without having to set up an account, either at the LBO or online. This is especially the case if these new electronic terminals facilitate the aforementioned OTC form of roulette play.
• The likely lack of substitutability between casinos and LBOs for the majority of B2 players: of primary importance here is the fact that the opportunity to use casinos is low given how few there are relative to LBO premises. They tend to be located in city centres which means long travel distances, possibly for a significant share of B2 players. But it is also important to observe that the demographics of B2 gamblers suggest that, for many, the glamour of casino gambling may not suit their preferences, especially given anecdotal evidence which suggests that a lot of B2 machine play is
7 This likelihood can also be thought of as representing the extent to which alternative gambling channels are substitutable in
practice.

24
© Centre for Economics and Business Research
by people on their lunch break or on their way home from work. As such, all of the alternative cases assume that only 5% of lost B2 revenues that remain within the gambling industry are diverted to casinos.
The attenuation factors specified in Table 7 above for each of the alternative cases seek to take account of these factors, with each alternative case representing a different emphasis on each factor. Specifically,
• Cases A to C: in all three of these cases, we hold LBO OTC and non-LBO B3 activities at their baseline levels (those observed today in Gambling Commission data) and vary the extent to which the remaining 60% share of B2 revenues (after also excluding the assumed 5% casino share) that is assumed to be diverted to online gambling filters through to LBOs and non-LBOs. In Case A, we assume that one-third (20%) diverts to LBOs and two-thirds (40%) diverts to non-LBO online gambling. Case B assumes that the 60% remainder that is diverted to online activities is split equally between LBO and non-LBO online platforms. Finally, Case C assumes two-thirds (40%) is diverted to LBO online and one-third (20%) is diverted to non-LBO online.
• Case D: this case involves holding diversion of lost B2 spend to B3 machine play at LBOs and non-LBOs at levels consistent with Cebr’s Alternative Baseline 2 assumptions. Thereafter, we assume that equal shares of 15% of lost B2 revenues are spent on online gambling through LBOs and non-LBOs. However, the vast majority is assumed to be diverted to OTC gambling at LBOs in this case. This cannot be viewed as implausible given the emergence of the aforementioned electronic betting terminals that mimic the LBO’s online platform within LBO premises and that will probably offer the type of OTC-based roulette play described previously.
• Case E: this is an extreme case for the purposes of illustration and is likely to represent the least plausible of the alternative cases. Lost B2 revenues that remain within the gambling industry are assumed in this case to be diverted to two alternative gambling channels – 95% going to LBO online platforms and 5% going to casinos.
Before moving on to the presentation of the modelled results, it may be useful to note that each alternative case involves diverting greater proportions of lost B2 GGY that remains in the gambling industry towards LBOs. It is therefore unsurprising that, in subsection 3.4, the net losses in industry GGY declines in each successive case.
3.3 Comparative analysis of the different possible baseline scenarios
Table 8 compares the predicted net losses of GGY to LBOs under the DCMS central estimates with both of Cebr’s alternative baseline estimates. Recall that the latter are based on the attenuation factors presented in Table 6 above. Specifically,
• Cebr’s Alternative Baseline 1 is a variation on DCMS baseline assumptions that splits the B2 GGY that is diverted to online gambling equally between LBO and non-LBO platforms.
• Cebr Alternative Baseline 2 distributes diverted B2 GGY that remains within the gambling industry according to what is currently observed in the distribution of all current GGY, excluding all GGY from B2 machines. But this, like the DCMS central estimates, is likely to significantly under-represent the online presence of the LBOs. It may also under-represent the potential diversion to OTC betting, especially in light of the emergence of the new electronic betting terminals that simulate an LBO’s online platform, but also in light of the potential re-emergence of live roulette on TV screens, within the betting shop environment.

25
© Centre for Economics and Business Research
But the key comparison is between the DCMS central estimates and Cebr’s Alternative Baseline 1, which shows the sensitivity of the DCMS estimates to changes in the assumptions about the online presence of LBOs. By re-diverting half of what is diverted to online back to the LBOs, the losses in GGY under a £2 stake fall from £639 million in the DCMS central estimates to £509 million in Cebr Alternative Baseline 1.8
Table 8: Comparison of net GGY losses to LBOs – DCMS central estimates vs. Cebr’s alternative baselines
Sources: Cebr Analysis
A more granular breakdown of the DCMS central estimates, as modelled by Cebr, is presented in Table 9 below. For each level of maximum stake, our retention ratio is used to calculate the level of gross losses in GGY on B2 games in Cebr’s baseline model. Having then aligned the latter to the DCMS central estimates, the level of gross losses in GGY on B2 games was derived through backward induction, as described above. This is represented in the second column of the table as negative numbers. To explain further with an example, the figure of -£1,175 million in gross GGY losses from B2 games at a £2 maximum stake is Cebr’s derivation of the gross GGY losses that underpin the DCMS central estimate of £639 million in net GGY losses for the LBOs (the final column).
Table 9: Gross GGY losses from B2 games and breakdown of ‘net’ losses to LBOs, DCMS central estimates
Source: DCMS (for net LBO losses in GGY), Cebr analysis (rest)
The third column captures attrition at 10%, while the next six columns provide estimates of how the lost B2 GGY that remains within the gambling industry is distributed across the various LBO and non-LBO gambling alternatives to B2 games. These are represented as positive numbers – attrition is a positive for the economy outside of the gambling sector and the diverted GGY that remains within gambling is a gain to each of the LBO and non-LBO channels represented. The ‘net’ loss to LBOs, as given in the final
8 For clarity, we note that the £509 million is what we expect the DCMS model would predict if it adopted the attenuation
assumptions used in Cebr’s Alternative Baseline 1. The £632 million is likewise what we expect the DCMS model would predict under Cebr’s Alternative Baseline 2 attenuation assumptions.

26
© Centre for Economics and Business Research
column, is calculated as the sum of attrition and revenue remaining within the gambling industry but accruing to non-LBO gambling providers, and is thus represented with a negative sign.
Table 10 and 11 present the equivalent for Cebr’s Alternative Baseline 1 and 2 scenarios, respectively. Note that gross losses and attrition are based on fixed parameters and do not change. What changes is the assumed distribution of how GGY that remains within the gambling industry is diverted to the alternative LBO and non-LBO gambling channels based on the alternative attenuation factors in Table 6 above.
Table 10: Gross GGY losses from B2 games and breakdown of ‘net’ losses to LBOs, Cebr Alternative Baseline 1
Source: Cebr Analysis
Table 11: Indicative breakdown of ‘net’ loss in GGY to current B2 machine operators (LBOs), Cebr Alternative Baseline 2
Source: Cebr Analysis
3.4 Comparative analysis of the of plausible alternative outcomes (Cases A-E)
In order to retain the ability to compare the range of plausible alternative outcomes represented by Cases A-E with the DCMS central estimates, the Cebr model of each of these cases is calibrated to those estimates. This is, as with the reconciliation of Cebr’s baseline model with the DCMS estimates, necessary to take into account the inaccuracy of the Cebr model in exactly replicating the DCMS findings on net LBO losses in GGY. (As already noted, this was due to the lack of availability to Cebr of certain restricted data.)
Table 12 summarises the results of our analysis by comparing Cases A-E with the DCMS central estimates. This shows how plausible variations in the key assumptions underlying the DCMS central estimates have the potential to significantly alter the picture. For instance, at a £2 maximum stake, they

27
© Centre for Economics and Business Research
suggest smaller net LBO losses in GGY – ranging from £530 million in Case A to as low as £159 million under the extreme Case E.
While it is not possible to be definitive, the balance of evidence suggests that Case D (or some variation) represents a more likely outcome than that represented by the DCMS central estimates. In Case D, the losses in GGY to the current operators of B2 machines are projected to be a little over half the DCMS central estimate for each corresponding maximum stake option.
Table 12: Comparison between DCMS central estimates of losses in LBO GGY with a range of alternative plausible outcomes, as represented by Cases A to E
Source: Cebr Analysis
Similar breakdowns to those presented in Table 9-11 above are provided for each of the alternative plausible outcomes represented by Cases A to E in Appendix 1.
3.5 Analysis of the likely net impact on macroeconomic indicators
The analysis and results presented in Subsections 3.3 and 3.4 focus on the losses in GGY for LBOs that result from a reduction in the maximum stake on B2 machines. This section seeks to take account of the facts that:
• GGY is not a robust basis for establishing the impact on macroeconomic indicators. GGY is akin to turnover, which includes a range of gambling-specific taxes as well as the cost of intermediate inputs that are produced by suppliers to LBOs – the predominant operators of B2 gaming machines.
• Whilst a large proportion of the anticipated losses in GGY from B2 machines is anticipated to remain within the gambling industry, with some proportion of that being retained by LBOs, there is also the question of what might be lost through attrition from gambling. This section analyses how any losses in industry GGY as a result of attrition could be spent on other goods and services, which could in turn provide a boost to other sectors of the economy. It is necessary to understand these in order to provide a balanced view of net macroeconomic impacts of alternative maximum stake reductions.
• A true picture of net economic impacts must also consider the diversion of LBO GGY from B2 machines back to LBOs through their B3, OTC and online offers, but also the potential for diversion to non-LBO gambling providers – namely alternative providers of B3 gaming content (like Adult Gaming Centres), casinos, bingo halls and non-LBO online providers. The focus of the DCMS IA on losses in GGY to the current operators of B2 machines (LBOs) appears to neglect this facet, but we cannot be certain.

28
© Centre for Economics and Business Research
A robust basis for assessing net macroeconomic impacts
The gambling-specific taxes and external supply chain costs that remain built into GGY and industry revenues require extraction to reveal an estimate of impacts on gross value added (GVA) contributions to GDP.9 This is what matters in terms of the net impact on the macro economy.
Furthermore, in any industry, a significant proportion (usually in excess of 50%) of GVA consists of the remuneration of the employees required to provide the good or service that generates the turnover or, in this case, the GGY. Impacts on GVA can, thus, be expected to have implications for employment.
Taking account of attrition
Losses in B2 GGY as a result of attrition from gambling are assumed to accrue to the sectors identified in Table 13 below.
Table 13: Sectors into which spending attrition from B2 machine gambling could be diverted
SIC Description
93 Sports activities and amusement and recreation activities
90 Creative, arts and entertainment activities
56 Food and beverage service activities
Source: Cebr Analysis
GGY that is lost to attrition from gambling is assumed, for simplicity, to be uniformly distributed amongst the three sectors, SIC 90, 93 and 56. This provides a measure of the boost to turnover in each of these sectors as a direct result of attrition of revenue from the gambling sector. From this, the corresponding increases in the GVA contributions of these sectors to GDP and to employment can be estimated, using industry-specific ratios of GVA-to-turnover and GVA per employee to derive the impacts on these macro indicators.
Results of the assessment of net impacts on macroeconomic indicators
GVA contributions to GDP
The net direct GVA impact increases as the maximum stake decreases. This is a result of the higher GVA-to-turnover ratios of the sectors 56, 90 and 93, meaning that one pound of revenue in these sectors generates more GVA than is observed in the gambling sector. Given that, as the cap decreases, more revenue is expected to flow to these other sectors, a lower maximum stake can be expected to lead to larger net increases in absolute GVA contributions to GDP.
9 GVA, or gross value added, is a measure of the value from production in the national accounts and can be thought of as the
value of industrial output less intermediate consumption. That is, the value of what is produced less the value of the intermediate goods and services used as inputs to produce it. GVA is also commonly known as income from production and is distributed in three directions – to employees, to shareholders and to government. GVA is linked as a measurement to GDP – both being a measure of economic output. That relationship is (GVA + Taxes on products - Subsidies on products = GDP). Because taxes and subsidies on individual product categories are only available at the whole economy level (rather than at the sectoral or regional level), GVA tends to be used for measuring things like gross regional domestic product and other measures of economic output of entities that are smaller than the whole economy.

29
© Centre for Economics and Business Research
This is illustrated in Table 14, which provides estimates of the net impacts on GVA that correspond with the DCMS central estimates, ranging from a £4 million increase at a £50 maximum stake to a £45 million increase at a £2 maximum stake.
Table 14: Economic impacts in terms of net changes in overall GVA contributions to GDP, based on DCMS central estimates
Sources: Cebr Analysis
Table 14 paints a rather different picture to that represented by the rather narrow focus on losses in GGY to the operators of B2 machines. While a £2 maximum stake is expected to result in the largest net losses in GGY to LBOs, it also yields the largest net positive impact on the economy.
We do admit, however, that is equally possible to argue that these net macroeconomic impacts cannot be said to be anything other than negligible and within the bounds of reasonable margins of error. In that case, it is at least possible to conclude that, even if the net macroeconomic impacts are negative, it would still not be possible to conclude that they are anything but negligible in absolute terms.
Employment in the economy
The changes in employment in the economy that correspond with the GVA impacts above are presented in Table 15 below.
Table 15: Economic impacts in terms of net changes in employment, based on DCMS central estimates
Sources: Cebr Analysis
In practice, interpreting the consequences for employment is less straightforward than for GVA. It is not inconceivable, for instance, to envisage an increase in employment in the gambling sector if:

30
© Centre for Economics and Business Research
• LBOs succeed in maintaining their share of the overall gambling market by stimulating demand for forms of gambling that are more labour-intensive (relative to B2 machine gambling) from the LBO’s perspective. Such developments, we note, would reduce the likelihood of so-called ‘single-staffing’ of LBOs continuing to be viable across the board.
• The boost to non-LBO providers of gambling is sufficient to generate sufficient numbers of new jobs to absorb any job losses in LBOs. This would depend again on the labour intensities of these other forms of gambling relative to LBO-based B2 machine gambling. A reasonable expectation might be that online gambling is inherently less labour-intensive than B2 machine gambling in LBOs, in which case this outcome would be less likely.
In interpreting any projections of net job losses in LBOs as a result of maximum stake reductions on B2 machines, it would be vital to consider the existing circumstances of the LBOs in order to ensure robust lines of causality. For instance, if there were LBO closures following the introduction of a new reduced maximum stake on B2 machines, it would be important not to conflate the effects of the reduced B2 maximum stake with the consequences of over-zealous investment in betting shops (the only way for LBOs to increase the number of B2 machines that they can operate) to take advantage of a market that was already approaching saturation in terms of growth. It is straightforward to imagine how such conflation could lead to exaggerated estimates of the number of LBOs that it is claimed will be ‘forced’ to close as a result of a reduced maximum stake on B2 machines.
The gain in jobs in other sectors is likewise uncertain and it would again depend on the wider economic circumstances and the particular circumstances facing the sectors in question. For instance, in a situation in which these sectors already have excess capacity in their ability to supply, any boost in demand is unlikely to result in the creation of many new jobs. In contrast, if the economy and these sectors are operating close to or at capacity, the boost in demand could well require the creation of new jobs.
Comparative analysis of net macroeconomic impacts under alternative attrition assumptions
Due to the paucity of national statistical data that distinguishes between the GVA contributions to GDP per £1 of GGY made through different gambling channels, there is no basis for the net macroeconomic impacts to vary between the DCMS central estimates and, on the one hand, Cebr’s alternative baseline scenarios or, on the other, the alternative Cases A to E. As such, net impacts on GVA contributions to GDP only respond to changes in the assumptions on attrition from gambling in response to a reduction in maximum stakes on B2 machines.
This is illustrated in Table 16, which shows that reductions in the assumed rates of attrition from gambling would mean less B2 GGY being diverted to other sectors that produce more GVA per £1 of turnover than the gambling sector (per £1 of GGY). This reduces the magnitude of the net increases in GVA contributions to GDP that are projected to derive from the baseline central estimates in the DCMS IA of the consequences for GGY of maximum stake reductions on B2 machines.
Specifically, at a new £2 maximum stake on B2 machines, the net impacts are almost halved relative to the DCMS central estimates when the attrition rate itself has been halved. At a 2.5% attrition rate, the net impacts are cut to under a third of what is observed as a result of the DCMS central estimates (Table 14).

31
© Centre for Economics and Business Research
Table 16: Economic impacts in terms of net changes in overall GVA contributions to GDP, DCMS central estimates with alternative attrition assumptions
Sources: Cebr Analysis
The corresponding estimates for net increases in employment are presented in Table 17 below. As is to be expected, with lower assumed levels of attrition from gambling, the estimated net macroeconomic benefits are substantially reduced. However, whereas the GVA impacts were halved under a 5% attrition assumption, the reduction in employment impacts could be less severe. This reflects the relative labour intensities of the sectors to which spend is assumed to be diverted as a consequence of attrition.
Table 17: Economic impacts in terms of net changes in employment, DCMS central estimates with alternative attrition assumptions
Sources: Cebr Analysis

32
© Centre for Economics and Business Research
4 The benefits to society of potential reductions in gambling-related harm
This section provides a review of the existing evidence on the impacts of the social harm that can be caused by problem gambling.10 The studies examined in subsection 4.1 and the evidence they present provide a starting point for Cebr’s assessment, outlined in subsections 4.3 and 4.4, of:
• The potential for maximum stake reductions on B2 gaming machines to reduce problem-gambling; and
• To the extent that they could, the value of the potential benefits to the individual problem gamblers themselves and to wider society associated with the consequent reductions in gambling-related harm.
4.1 Evidence on the cost to society of gambling-related harm
The association between problem gambling and social harm is well-established in the existing literature, with the term “gambling-related harm” most likely coined to summarise this association. The Langham et al (2016) study defines gambling-related harm as: ‘any initial or exacerbated adverse consequence due to an engagement with gambling that leads to a decrement to the health or wellbeing of an individual, family unit, community or population’.
Specifically, connections have been established between addictive gambling and problems such as relationship difficulties, unemployment, and poor job performance in a variety of studies. Here we provide a brief synthesis.
Based on an analysis of problem gambling by the Australian Productivity Commission (APC) in 1999, the Institute for Public Policy Research (IPPR) produced a flow-chart representation showing an exhaustive set of comorbid interactions associated with problem gambling. This is copied below as Figure 4.3 from the IPPR report.
The IPPR report identifies a range of existing evidence supporting the existence of these comorbid interactions. Given how recently this was published (December 2016), a synthesis of this evidence is provided in Appendix 2 to this report, which can be read in conjunction with Figure 3 below (the copy of IPPR Figure 4.3).
Here, we narrow our focus on the conceptual framework developed by IPPR for monetising the impacts of problem gambling on wider society through the excess fiscal cost that it imposes. This provides the starting point for Cebr’s assessment in later subsections.
The IPPR report identifies the statutory and voluntary services available to problem gamblers that exist, the report asserts, in recognition of the extent of comorbid problems associated with problem gambling.
10 Problem gambling is typically defined as gambling to a degree that compromises, disrupts or damages family, personal or
recreational pursuits. Previous gambling studies in Great Britain have screened for problem gambling using scales based on two different measures: the DSM-IV criteria and the Problem Gambling Severity Index (PGSI). The DSM-IV screening instrument is based on criteria from the fourth edition of the Diagnostic and Statistical Manual of the American Psychiatric Association. It was created as a clinical diagnostic tool, and was not intended for use as a screening instrument among the general population. A score of 3 or more is indicative of problem gambling. The PGSI was designed for use among the general population rather than within a clinical context. A score of 8 or more is associated with problem gambling. A score of 1 or more is associated with “at-risk” gambling.

33
© Centre for Economics and Business Research
The four predominant services are the NHS National Problem Gambling Clinic, GamCare, The Gordon Moody Association and Gamblers Anonymous.
Figure 3: Copy of Figure 4.3 from IPPR report
Sources: IPPR analysis of APC (1999)
From eleven separate ‘impacts’ of problem gambling identified from GamCare data, the IPPR identified six comorbidity groupings of impacts of problem gambling, as follows:
• Health problems (alcohol misuse; anxiety/stress; feeling isolated; general health; mental health);
• Housing problems;
• Criminal activity;
• Financial difficulties;
• Work difficulties; and
• Relationship problems (domestic abuse; family/relationship difficulties).
On this basis, health problems (46%), financial difficulties (30%) and relationship problems (19%) are the three predominant categories into which self-reported impacts of problem gambling fall. The evidence

34
© Centre for Economics and Business Research
provided by IPPR in support of the six comorbidity groupings of impacts is, as already noted, synthesised in Appendix 2. But it is important to note here that some of this evidence points specifically to B2 machines. The study by Sharman (2014) found homeless people to be significantly more likely to be problem gamblers and that certain gambling behaviours, such as playing B2 machines and betting on sports and horse racing, were particularly popular among this group. The study also found that having access to a warm environment may be a significant factor in drawing homeless people to high street bookmakers.
The IPPR report is concerned with the excess fiscal costs incurred by problem gamblers, noting that, of the six impact groupings, two will only yield a cost to the state indirectly – relationship problems and financial difficulties – and most likely through the other four impact groupings that can be expected to yield a direct cost to the state – health, housing, criminality and work difficulties. The IPPR analysis is therefore limited to these latter four (sources of direct cost).
The starting point of the IPPR analysis was the population of problem gamblers in Great Britain and, to establish this, the authors use two main data sources: the British Gambling Prevalence Survey (BGPS); and a weighted estimate from the results of the Health Survey England (HSE), the Scottish Health Survey (SHS) and the Welsh Problem Gambling Survey (WPGS). The IPPR estimates a cost associated with individuals who are problem gamblers to be between £260 million and £1.16 billion per year in Great Britain.
This is a wide range and is of course concerned with all problem gambling. Cebr has sought to replicate the IPPR framework and to provide what we hope might be interpreted as more definitive estimates using evidence-based assumptions about the number of B2 machine players and the share of these that might be considered problem gamblers.
However, we also go beyond the IPPR framework of excess fiscal costs, which is limited to only one aspect of the burden on society imposed by problem gambling. Problem gambling also imposes a detrimental impact on the welfare of problem gamblers and of their immediate and wider social networks. In economic theory, welfare is associated with improvements in utility (or satisfaction). In modern policymaking, it can be most closely associated with the idea of wellbeing. The potential value of these impacts is incorporated into Cebr’s assessment. The manner of doing so is the subject of the following subsection.
The most recent report exploring the social impact of problem gambling in Wales comes from the University of South Wales.11 The authors found that individuals who drink at hazardous and harmful levels gamble more frequently, have less control of their gambling and have strong motivations to gamble. The analysis also suggests that gamblers who engage in B2 machine play in LBOs are more likely to have impaired control of their gambling behaviour than individual gambling via other channels.12 This would tend to support the hypothesis that B2 machines can be associated with relatively high risks of problem gambling and of consequential social harm. These issues are explored further in the following subsection.
11 John, Bev, et al. "An Investigation of the Social Impact of Problem Gambling in Wales." (2017). 12 The same was found in the specific case of online betting on sports.

35
© Centre for Economics and Business Research
4.2 The relative risk of problem gambling associated with B2 machines
To explore the link between B2 machines and social harm, it is necessary to consider the nature of B2 machine gambling, the risk profile of other machines and the socioeconomic profile of the B2 machine gambling population. The hypothesis is that the higher staking levels available on B2 machines (relative to other gaming machines) combined with the socioeconomic profile of B2 machine gamblers, raises the risk of either causing or exacerbating problem gambling and the associated social harm.
The appropriate measurement of expected losses
Some parties, such as the Association of British Bookmakers (ABB), argue that relying on the higher potential staking level on B2 machines leads to only a partial view of the associated risk factors. The ABB posits that the focus should instead be on the concept of ‘average loss per minute’. As such, the ABB claims that the average loss per minute of B2 roulette players is £1.59, while on category C machines the average loss per minute is £5.28.13, 14
Reliance on this comparison would suggest that Category C machines entail more risk to players than B2 machines. But the use of an average to analyse patterns of losses across machines hardly seems appropriate, given its potential to conceal incidences of the large losses that it is possible to accumulate on B2 machines, given the significantly higher staking possibilities. Furthermore, most if not all of the social harm that it is possible to link to problem gambling on B2 machines can be expected to be the result of such large losses.
There is limited data to support an assessment of the hypothesis that the average loss per minute is inappropriate in seeking to capture the real risk of harm to B2 machine gamblers.15 However, we did find potentially relevant data on the association between the net expenditures profiles of sessions on different types of machine.16 Figure 4 below shows the share of B2 roulette and B2 slots sessions that occurred between July 2015 and June 2016 for given net expenditure bin ranges.
Those to the left of “Even (£0)” indicate session losses, while those to the right indicate session wins. Comparing the B2 distributions with the other machine categories (B3, C, D and B4) reveals ‘fatter’ tails for B2 sessions. In other words, the occurrence of sessions with extreme outcomes for the gambler is greater for B2 machines. It is therefore noticeable that the incidence of heavy losses is more frequent on B2 machines than on the other types of machine featured.
This can hardly be unexpected given the higher amounts that it is possible to stake on B2 machines and higher potential risk of incurring large losses. This supports the proposition that the average loss per minute conceals the greater frequency and therefore demonstrable risk of accumulating large losses.
13 Based on data provided in the ABB’s submission to the December 2016 Call for Evidence by DCMS as part of its Review of
Gaming Machines and Social Responsibility Measures. 14 Category C machines have a £1 maximum stake and a £100 maximum prize. These machines are mostly played in pubs, bingo
halls and arcades. 15 Due to its confidential nature. 16 Net expenditure is defined as the player session gross win. This is defined as stakes minus returns. A positive value
corresponds to a loss to the player.

36
© Centre for Economics and Business Research
Figure 4: Net expenditure by session type, % of sessions in the bin ranges presented over total session between July 2015 and June 2016
Sources: Gambling commission, Cebr analysis
The socioeconomic profile of B2 machine gamblers
Here is explored the hypothesis that the risk of B2 machine gambling becoming problematic could be disproportionately higher than for other forms of gambling, given the apparent socioeconomic profile of B2 machine players. If B2 players are already relatively disadvantaged in socioeconomic terms, the hypothesis would be that they are more vulnerable to losses that are at harmful levels and that the reduction in the maximum stake on B2 machines could reduce that vulnerability. But it is also vital to note that ‘losses at harmful levels’ is necessarily a relative concept as the real impact of a loss of any given magnitude will depend, for the most part, on the income of the gambler and the consequent extent to which they can absorb such losses. This further highlights the flawed logic in seeking to capture risk through an ‘average loss per minute’ concept.
While data on the socioeconomic profile of B2 players are limited, there are some relevant statistics. According to the Landman Economics analysis of the 2012 Health Survey for England (HSE)17, within the 12 months prior to the survey taking place, 3.6% of respondents who reported being in employment had played a gaming machine at a LBO, compared to 6.6% of respondents who reported being unemployed.
17 Reed, H., 2015. The economic impact of fixed odds betting terminals: 2015 update.
0%
5%
10%
15%
20%
25%
30%
35%
B2 Only (excl slots) B2 Slots only B3 Slots only Other (Cat C, Cat D, Cat B4)
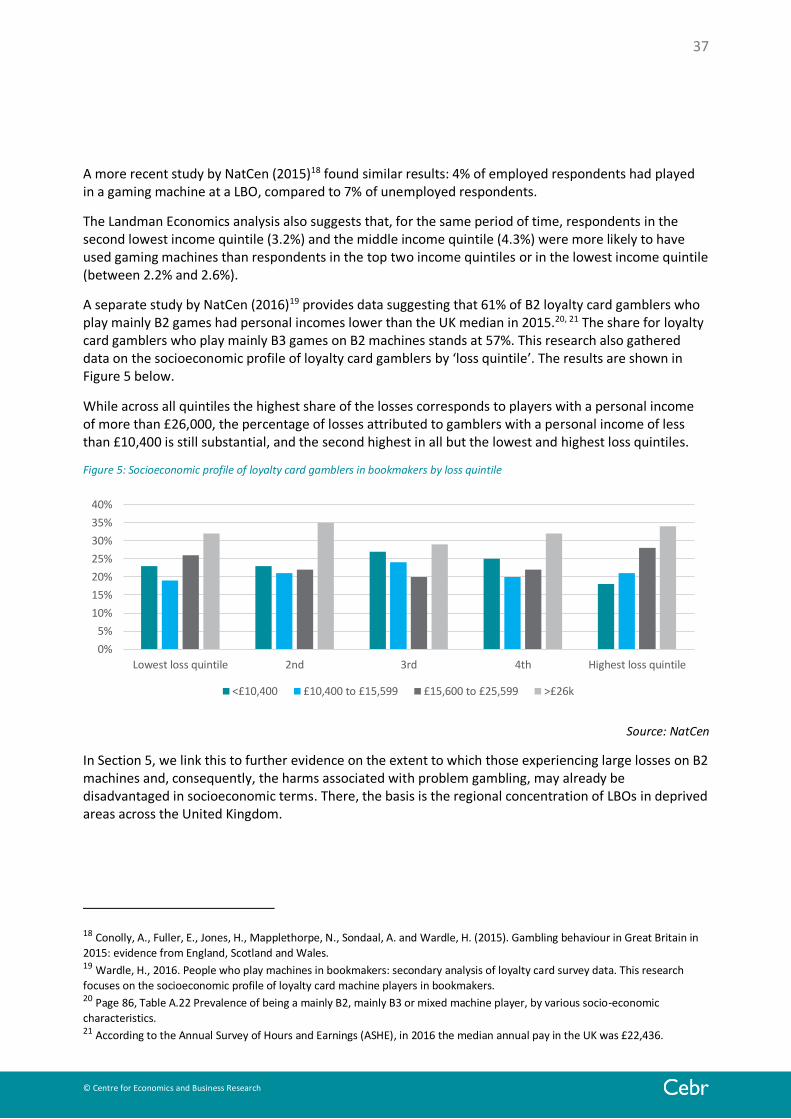
37
© Centre for Economics and Business Research
A more recent study by NatCen (2015)18 found similar results: 4% of employed respondents had played in a gaming machine at a LBO, compared to 7% of unemployed respondents.
The Landman Economics analysis also suggests that, for the same period of time, respondents in the second lowest income quintile (3.2%) and the middle income quintile (4.3%) were more likely to have used gaming machines than respondents in the top two income quintiles or in the lowest income quintile (between 2.2% and 2.6%).
A separate study by NatCen (2016)19 provides data suggesting that 61% of B2 loyalty card gamblers who play mainly B2 games had personal incomes lower than the UK median in 2015.20, 21 The share for loyalty card gamblers who play mainly B3 games on B2 machines stands at 57%. This research also gathered data on the socioeconomic profile of loyalty card gamblers by ‘loss quintile’. The results are shown in Figure 5 below.
While across all quintiles the highest share of the losses corresponds to players with a personal income of more than £26,000, the percentage of losses attributed to gamblers with a personal income of less than £10,400 is still substantial, and the second highest in all but the lowest and highest loss quintiles.
Figure 5: Socioeconomic profile of loyalty card gamblers in bookmakers by loss quintile
Source: NatCen
In Section 5, we link this to further evidence on the extent to which those experiencing large losses on B2 machines and, consequently, the harms associated with problem gambling, may already be disadvantaged in socioeconomic terms. There, the basis is the regional concentration of LBOs in deprived areas across the United Kingdom.
18 Conolly, A., Fuller, E., Jones, H., Mapplethorpe, N., Sondaal, A. and Wardle, H. (2015). Gambling behaviour in Great Britain in
2015: evidence from England, Scotland and Wales. 19 Wardle, H., 2016. People who play machines in bookmakers: secondary analysis of loyalty card survey data. This research
focuses on the socioeconomic profile of loyalty card machine players in bookmakers. 20 Page 86, Table A.22 Prevalence of being a mainly B2, mainly B3 or mixed machine player, by various socio-economic
characteristics. 21 According to the Annual Survey of Hours and Earnings (ASHE), in 2016 the median annual pay in the UK was £22,436.
0%
5%
10%
15%
20%
25%
30%
35%
40%
Lowest loss quintile 2nd 3rd 4th Highest loss quintile
<£10,400 £10,400 to £15,599 £15,600 to £25,599 >£26k

38
© Centre for Economics and Business Research
4.3 Methodology underlying Cebr’s high-level assessment of societal impacts
This section focusses on the methodology used by Cebr to provide indicative estimates of the benefits to society of reduced problem gambling and the potentially ensuing reduction in government expenditure on programmes linked to gambling-related harm, including healthcare (psychological therapy), welfare costs, housing costs and criminal justice costs.
We build on the evidence available in the 2016 IPPR report Cards on the table - The cost to Government associated with people who are problem gamblers in Britain to establish the share of the excess fiscal costs identified by IPPR that could reasonably be associated with problem gambling specifically linked to B2 machines.
This excess fiscal cost is a real financial loss to wider society, but it can also be considered an opportunity cost – the value of the best alternative way to spend the money dedicated to dealing with gambling-related harm. But any decision to reduce the maximum stakes on B2 machines will, if it reduces gambling-related harm, also impact directly on problem gamblers themselves, as well as affecting people in their wider social networks. As such, when problem gamblers change their behaviour, the gamblers themselves and those who were previously negatively impacted by their actions will see an improvement in their welfare. For instance, families will benefit from having a more stable home environment and stronger family relationships.
The real fiscal and welfare gains associated with reductions in gambling-related harm can be understood by turning on their head the fiscal and welfare costs associated with problem gambling. To the extent that problem gambling can be linked to B2 machines, the welfare costs can be considered in terms of the negative impact on the wellbeing of society as a result of B2 machines. This is the basis of our approach.
Monetised estimates of wellbeing impacts
While there is considerable research in the field of assessing the impacts of problem gambling on the wellbeing of individuals, the majority are limited to qualitative approaches. We have sought to fill this gap in the existing research by attempting to estimate the welfare costs of problem gambling that might be associated with B2 machines.
To do so, we have drawn on the Housing Association’s Charitable Trust (HACT) and Simetrica “Community investment and homelessness values form the Social Value Bank” database.22 This resource provides data that can capture the monetary value of impacts that typically occur ‘outside the market’ or that, in other words, go beyond what can be captured through prices, wages or productivity. This allows researchers to account for a wider perception of value, such as the negative implications of problem gambling that can impose a welfare cost on society like:
• Mental health problems, unemployment, homelessness, and crime from the point of view of problem gamblers and other individuals.
• Unstable financial situations, debts, being unable to save, and the feeling of losing control in their life.
22 Source: www.socialvaluebank.org; License: Creative Commons Attribution-NonCommercial-NoDerivatives license
(http://creativecommons.org/licenses/by-nc-nd/4.0/deed.en_GB). See References at the end of this report for an Attribution Notice on the Social Value Bank.

39
© Centre for Economics and Business Research
Next we present a summary of the methodology used to calculate the excess fiscal costs and the welfare costs that gamblers and their social networks face as a result of problem gambling that it is possible to associate with B2 machines.
Estimating the excess fiscal cost associated with problem gambling linked to B2 machines
To produce an estimate of the number of B2 machine players who are problem gamblers we used two data sources. The first was the Gambling Commission’s latest statistics on the proportion of people gambling on virtual gaming machines in bookmakers, which we used to produce an absolute estimate of 1.05 million, based on an estimated 30.5 million gambling population.
The second data source was NatCen’s report Gambling Behaviour in Great Britain in 2015, which reported a prevalence estimate of problem gambling on machines in bookmakers of 11.5%. Combining these two sets of statistics, we were able to derive an indicative estimate of the number of B2 players in the UK who might be considered problem gamblers. This estimate is approximately 121,000 people.23
To guarantee we were incorporating the most recent data in our analysis, we have wherever possible updated the figures used by the IPPR on the cost of public services. The details are provided in Appendix 3, with separate treatment of the six perspectives from which excess fiscal costs are considered.
Estimating the welfare costs associated with problem gambling linked to B2 machines
The same link between problem gambling and mental health complications, financial hardships and work difficulties - amongst other problems individuals might face as a result of gambling addiction - will have an impact on the wellbeing of problem gamblers and of their social network.
Measuring wellbeing (or welfare) is generally a challenging task, as it involves attempting to assess how people value certain intangible factors which affect their lives. The main difficulty is the risk of biased response. On one hand, one has to rely on individuals’ honesty. On the other hand, even when striving to be honest, it can still be difficult to introspectively assess the importance of some factor in one’s life, let alone providing an estimate of the associated monetary value. HACT and Simetrica’s framework for the valuation of wellbeing is based on analysing existing datasets from national surveys which can reveal effects on wellbeing. The surveys are used to isolate the effect of a particular factor on an individual’s wellbeing, which is used to extrapolate measures of the equivalent amount of money that individuals would be willing to pay to achieve a given improvement in wellbeing or the amount by which individuals would need to be compensated to endure an equivalent deterioration in wellbeing.
We rely on the Social Value Bank to obtain the value that the average person attributes to aspects such as employment, financial stability and good health and we assume that these are valued in the same way by B2 problem gamblers as any other member of society. The manner in which we have used the HACT and Simetrica data to produce the quantitative findings in subsection 4.4 below is outlined in Appendix 4 to this report.
23 We understand that this is an average across all machines in bookmakers, where B3 slots are also popular. However, in the
absence of a better data source, it is only possible to say that this is a conservative estimate if the prevalence of problem gambling is higher amongst B2 players than players of B3.
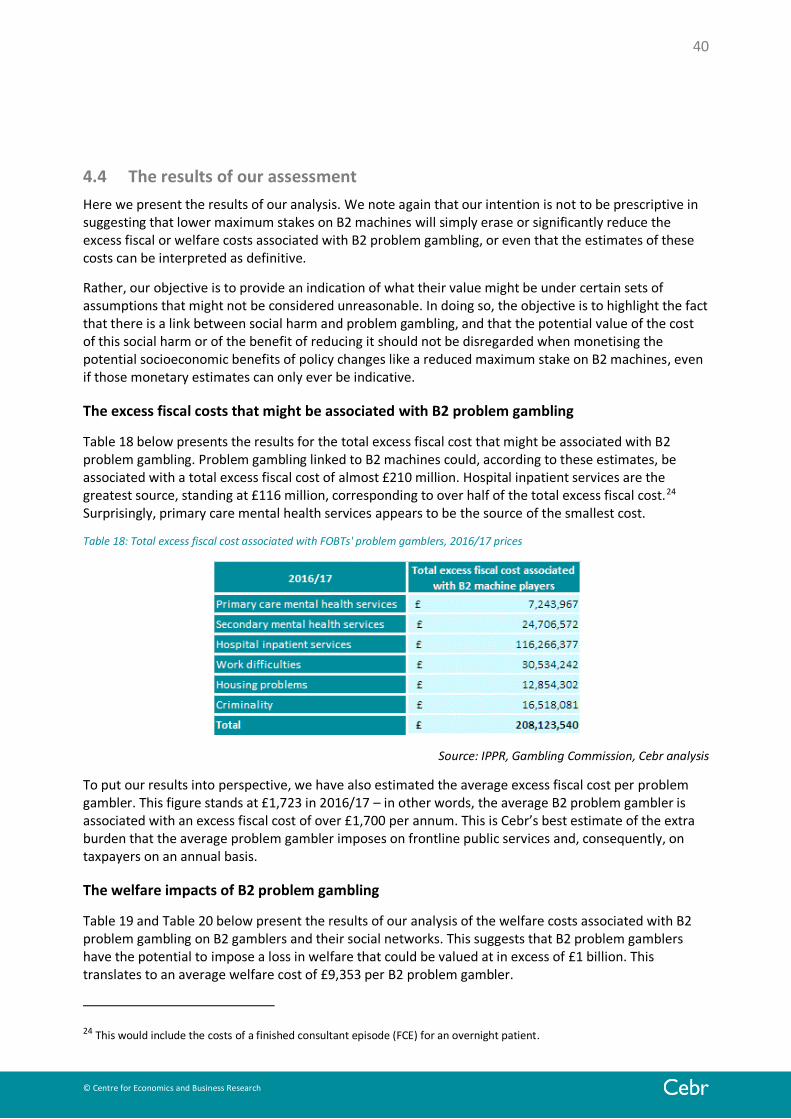
40
© Centre for Economics and Business Research
4.4 The results of our assessment
Here we present the results of our analysis. We note again that our intention is not to be prescriptive in suggesting that lower maximum stakes on B2 machines will simply erase or significantly reduce the excess fiscal or welfare costs associated with B2 problem gambling, or even that the estimates of these costs can be interpreted as definitive.
Rather, our objective is to provide an indication of what their value might be under certain sets of assumptions that might not be considered unreasonable. In doing so, the objective is to highlight the fact that there is a link between social harm and problem gambling, and that the potential value of the cost of this social harm or of the benefit of reducing it should not be disregarded when monetising the potential socioeconomic benefits of policy changes like a reduced maximum stake on B2 machines, even if those monetary estimates can only ever be indicative.
The excess fiscal costs that might be associated with B2 problem gambling
Table 18 below presents the results for the total excess fiscal cost that might be associated with B2 problem gambling. Problem gambling linked to B2 machines could, according to these estimates, be associated with a total excess fiscal cost of almost £210 million. Hospital inpatient services are the greatest source, standing at £116 million, corresponding to over half of the total excess fiscal cost.24 Surprisingly, primary care mental health services appears to be the source of the smallest cost.
Table 18: Total excess fiscal cost associated with FOBTs' problem gamblers, 2016/17 prices
Source: IPPR, Gambling Commission, Cebr analysis
To put our results into perspective, we have also estimated the average excess fiscal cost per problem gambler. This figure stands at £1,723 in 2016/17 – in other words, the average B2 problem gambler is associated with an excess fiscal cost of over £1,700 per annum. This is Cebr’s best estimate of the extra burden that the average problem gambler imposes on frontline public services and, consequently, on taxpayers on an annual basis.
The welfare impacts of B2 problem gambling
Table 19 and Table 20 below present the results of our analysis of the welfare costs associated with B2 problem gambling on B2 gamblers and their social networks. This suggests that B2 problem gamblers have the potential to impose a loss in welfare that could be valued at in excess of £1 billion. This translates to an average welfare cost of £9,353 per B2 problem gambler.
24 This would include the costs of a finished consultant episode (FCE) for an overnight patient.

41
© Centre for Economics and Business Research
Lack of financial stability is the greatest contributor to this reduction in welfare, standing at over £392 million, closely followed by the impact of mental health issues associated with problem gambling on B2 machines at £355 million.
Table 19: Welfare costs across B2 machines problem gamblers, 2016/17
Source: HACT and Simetrica, Gambling Commission, Cebr analysis
In terms of the people affected by problem gamblers’ behaviour, they are estimated to suffer a deterioration in welfare that can be valued at over £372 million in 2016-17 terms. This translates to an average loss per problem gambler equal to £4,430, excluding the productivity impact.
Table 20: Welfare costs across people affected by B2 machines problem gamblers behaviour, 2016/17
Source: HACT and Simetrica, Gambling Commission, Cebr analysis
Similar to what is observed in Table 19, a lack of financial stability is the greatest contributor to this reduction in welfare, standing at over £153 million. This is followed by the impact of a volatile family structure for children, spouses and ex-spouses.
The figure for productivity is the only figure in the table which should be interpreted separately. The £8 million is actually a cost to the entire UK population, while the other rows in the table focus exclusively on the welfare costs for the B2 problem gamblers’ families. The loss in productivity is the result of weakened performance in the workplace, as well as the loss of output arising from problem gamblers tending to be absent from work more often.
Translating reductions in GGY into potential reductions in harmful losses on B2 machines
The estimates in Table 18-Table 20 should be interpreted as indicative estimates of the maximum value of the benefits available or, equivalently, of the benefits that could be realised if problem gambling was
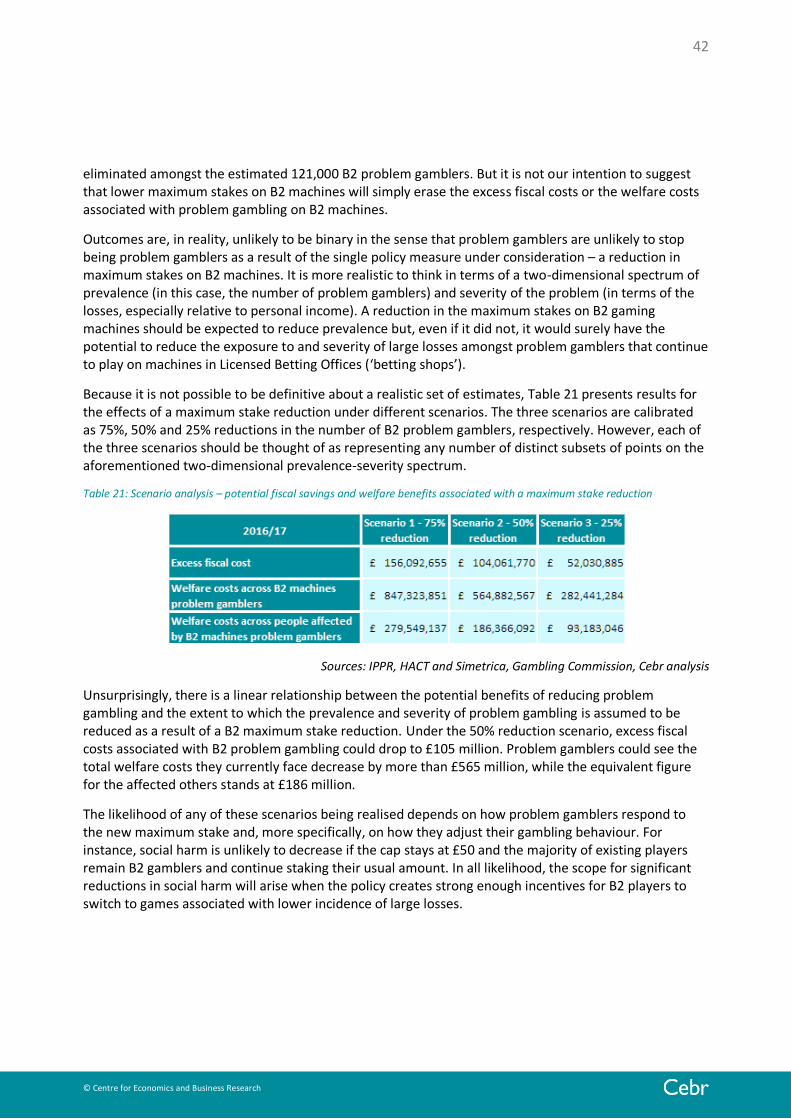
42
© Centre for Economics and Business Research
eliminated amongst the estimated 121,000 B2 problem gamblers. But it is not our intention to suggest that lower maximum stakes on B2 machines will simply erase the excess fiscal costs or the welfare costs associated with problem gambling on B2 machines.
Outcomes are, in reality, unlikely to be binary in the sense that problem gamblers are unlikely to stop being problem gamblers as a result of the single policy measure under consideration – a reduction in maximum stakes on B2 machines. It is more realistic to think in terms of a two-dimensional spectrum of prevalence (in this case, the number of problem gamblers) and severity of the problem (in terms of the losses, especially relative to personal income). A reduction in the maximum stakes on B2 gaming machines should be expected to reduce prevalence but, even if it did not, it would surely have the potential to reduce the exposure to and severity of large losses amongst problem gamblers that continue to play on machines in Licensed Betting Offices (‘betting shops’).
Because it is not possible to be definitive about a realistic set of estimates, Table 21 presents results for the effects of a maximum stake reduction under different scenarios. The three scenarios are calibrated as 75%, 50% and 25% reductions in the number of B2 problem gamblers, respectively. However, each of the three scenarios should be thought of as representing any number of distinct subsets of points on the aforementioned two-dimensional prevalence-severity spectrum.
Table 21: Scenario analysis – potential fiscal savings and welfare benefits associated with a maximum stake reduction
Sources: IPPR, HACT and Simetrica, Gambling Commission, Cebr analysis
Unsurprisingly, there is a linear relationship between the potential benefits of reducing problem gambling and the extent to which the prevalence and severity of problem gambling is assumed to be reduced as a result of a B2 maximum stake reduction. Under the 50% reduction scenario, excess fiscal costs associated with B2 problem gambling could drop to £105 million. Problem gamblers could see the total welfare costs they currently face decrease by more than £565 million, while the equivalent figure for the affected others stands at £186 million.
The likelihood of any of these scenarios being realised depends on how problem gamblers respond to the new maximum stake and, more specifically, on how they adjust their gambling behaviour. For instance, social harm is unlikely to decrease if the cap stays at £50 and the majority of existing players remain B2 gamblers and continue staking their usual amount. In all likelihood, the scope for significant reductions in social harm will arise when the policy creates strong enough incentives for B2 players to switch to games associated with lower incidence of large losses.

43
© Centre for Economics and Business Research
5 Heavier weight on reduced social harm amongst the already deprived
This section explores the potential to attach a higher weighting to the benefits of reducing the social harms associated with problem gambling if the harms are falling disproportionately on those who are already disadvantaged in socioeconomic terms. Having explained the basis for this hypothesis, we assess whether the location of betting shops in the UK suggests that B2 games are likely to be disproportionately affecting the more deprived communities of the UK. The section closes with indicative estimates of how using the Index of Multiple Deprivation to accordingly weight the potential benefits of a reduction in B2 maximum stakes would alter the valuation of those benefits in appraising the policy options.
5.1 The Law of Diminishing Marginal Utility
HM Treasury’s The Green Book: Appraisal and Evaluation in Central Government notes the importance of assessing the distributional implications of the policy options being considered because it “enhances the understanding of the fairness of proposals, their social impacts and their scale”. Paragraph 5.34 goes on to note that:
“The impact of a policy, programme or project on an individual’s well-being will vary according to his or her income; the rationale being that an extra pound will give more benefit to a person who is deprived than to someone who is well off. In economics, this concept is known as the ‘diminishing marginal utility of additional consumption’.”
In other words, each nominal additional £1 of benefit will be worth more in real terms to a person who is poor than to a wealthy person.
This is the underlying basis for the analysis in this section. Specifically, that the monetary estimates of the potential benefits of reducing the social harms associated with problem gambling on B2 machines presented in Section 4 above may not reflect their true value to society if they are likely to benefit disproportionately those who are economically and socially disadvantaged.
We would also note the relevance of this analysis in the context of one of the main arguments being put forward in support of a reduction in maximum stakes – that the government has the duty to protect individuals in precarious situations.
The first step involved mapping the precise locations of LBOs (and, therefore, of B2 machines) against the Index of Multiple Deprivation for each location.
5.2 The location of Licensed Betting Offices in the UK
The Index of Multiple Deprivation (IDM) is produced by the Department for Communities and Local Government. It incorporates indicators across domains like health, education and crime and ranks local authorities (as well as more granular geographic delineations) based on these. The raw IDM data ranks the relevant geographic areas from the least to the most deprived. We converted this into a deprivation index with a range of 0 to 100, with 0 representing the least deprived and 100 representing the most deprived.
Figure 6 maps the Local Authority Districts (LADs) of betting shops against each LAD’s deprivation index score.

44
© Centre for Economics and Business Research
This certainly seems to suggest a positive association between the location of bookmaking offices25 and the deprivation score of the area. This is visible in the trend line presented in Figure 6, which suggests that LADs with the largest number of betting shops tend to also have a higher deprivation score. A similar (and stronger) link was observed when mapping the number of betting shops by LAD with other indicators of deprivation, including unemployment, economic inactivity and claimant count rates.
Figure 6: Number of betting shops by local authority vs. Index of multiple deprivation score
Sources: Indices of multiple deprivation (England, Scotland and Wales), Gambling Commission, Cebr analysis
5.3 Establishing a distribution of gambling-related harm by local authority
This subsection uses the distribution of betting shops by local authority district to provide an indicative allocation of the cost imposed on the societies of local communities by problem gambling associated with B2 machines. This initial allocation is linear, in that each betting shops is attributed, on average, the same amount of social harm. This means, for example, that if Glasgow City has 2% of the betting shops in the UK, 2% of the social harm observed in the UK will be allocated to Glasgow City.26
Figure 7 shows the results for the 20 local authorities with the highest allocations of social harm (which, given the approach, corresponds with the local authorities that have the highest number of betting shops. On this measure, Glasgow City records the highest share of gambling-related social harm associated with B2 machines, both in terms of harm for problem gamblers and for their families. Glasgow
25 Licensed Betting Office (bookies) location data was obtained using the Gambling Commission’s public register which contains a list of premises licensed to be betting shops (https://secure.gamblingcommission.gov.uk/publicregister/home/). The Gambling Commission cannot provide assurances around the completeness or accuracy of the data. As such, some bookies in the list were not included in our analysis due to missing or faulty data in terms of their listed addresses. 26 This is, admittedly, simplistic but was the best that could be achieved given the available data. A more accurate allocation
would require consideration of a wider set of indicators, like different sizes, different footfall rates etc.
-
20
40
60
80
100
120
- 50 100 150 200 250
Ind
ex o
f m
ult
iple
dep
riva
tio
n s
core
Number of LBOs by local authority

45
© Centre for Economics and Business Research
is followed by Birmingham and Liverpool. These three rank particularly high in terms of deprivation, each scoring more than 73 points on the IMD index.
Figure 7: Distribution of gambling-related harm by local authority - top 20, and IMD score (RHS)
Sources: IPPR, HACT and Simetrica, Gambling Commission, Cebr analysis
Figure 8 provides the same data for the 20 local authorities with the lowest allocations of social harm. As before, these correspond to the local authorities with the lowest number of betting shops. Rutland, Na h-Eileanan Siar and the Shetland Islands are, on this measure, the local authority districts with the lowest amount of gambling-related harm in the UK (driven by lower numbers of betting shops). With the exception of Torridge and Melton, all areas score at most 70 on the deprivation ranking. Furthermore, across this group the average IMD score is 49, compared to the average score of 70 observed in the top 20 group presented in Figure 7.
-
10
20
30
40
50
60
70
80
90
-
5
10
15
20
25
30
Val
ue
of
gam
blin
g-re
late
d h
arm
(£m
)
Local Authority DistrictWelfare costs across B2 machines problem gamblersWelfare costs across people affected by B2 machines problem gamblersIMD score

46
© Centre for Economics and Business Research
Figure 8: Distribution of gambling-related harm by local authority - bottom 20, and IMD score
Sources: IPPR, HACT and Simetrica, Gambling Commission, Cebr analysis
5.4 Adjusting the value of reductions in social harm to the already deprived
In this section, we combine the results of Subsections 5.2 and 5.3 to provide adjusted valuations of the welfare benefits associated with the potential declines in gambling-related social harms that could arise from a reduction in the maximum stakes on B2 gaming machines. While it is unclear whether the Index of Multiple Deprivation is the appropriate indicator to use, it at least provides some indication of the impact of an attempt to factor in the distributional implications for policy of the Law of Diminishing Marginal Utility (as outlined in Subsection 5.1 above).
In essence, the approach involves attaching greater value to the indicative estimates of the potential monetised welfare benefits of reducing the maximum stakes on B2 machines. The weighting process involved multiplying the potential benefit (reduced cost of social harm) allocated to each local authority by the ratio of the deprivation index score of that area and a population-weighted average deprivation score across all local authorities. Given a weighted average deprivation score of 59, the approach amounted to assigning weightings in excess of one in local authority districts with a deprivation score above 59, but assigning weightings of less than one to local authority districts with a deprivation score below 59.27
Table 22 presents a summary of the results of the analysis.
27 Arguably, this has some basis in established principles or ‘rules of thumb’ in the poverty and redistribution literature.
Specifically, poverty is generally defined in terms of personal income that is less than 60% of the national median. Whether symmetric opposite treatment of those above and below the IDM score threshold of 59 is appropriate is arguable. But it seems like a sensible starting point if one equates the additional value attached by a poorer person to an additional nominal £1 of benefit with the additional nominal amount of money that would need to be given to a wealthier person to make them ‘feel’ like they have achieved the same benefit.
-
10
20
30
40
50
60
70
80
90
100
0.0
0.1
0.2
0.3
0.4
0.5
0.6
Val
ue
of
gam
blin
g-re
late
d h
arm
£m
Local Authority DistrictWelfare costs across B2 machines problem gamblersWelfare costs across people affected by B2 machines problem gamblersIMD score
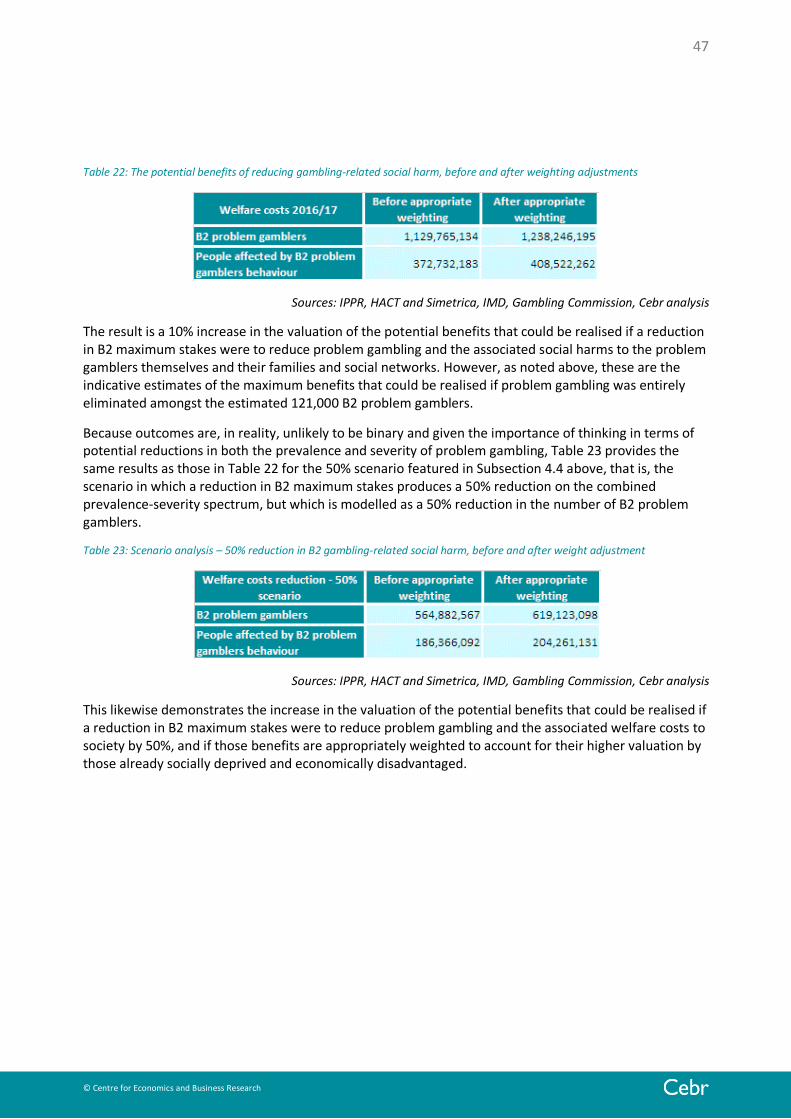
47
© Centre for Economics and Business Research
Table 22: The potential benefits of reducing gambling-related social harm, before and after weighting adjustments
Sources: IPPR, HACT and Simetrica, IMD, Gambling Commission, Cebr analysis
The result is a 10% increase in the valuation of the potential benefits that could be realised if a reduction in B2 maximum stakes were to reduce problem gambling and the associated social harms to the problem gamblers themselves and their families and social networks. However, as noted above, these are the indicative estimates of the maximum benefits that could be realised if problem gambling was entirely eliminated amongst the estimated 121,000 B2 problem gamblers.
Because outcomes are, in reality, unlikely to be binary and given the importance of thinking in terms of potential reductions in both the prevalence and severity of problem gambling, Table 23 provides the same results as those in Table 22 for the 50% scenario featured in Subsection 4.4 above, that is, the scenario in which a reduction in B2 maximum stakes produces a 50% reduction on the combined prevalence-severity spectrum, but which is modelled as a 50% reduction in the number of B2 problem gamblers.
Table 23: Scenario analysis – 50% reduction in B2 gambling-related social harm, before and after weight adjustment
Sources: IPPR, HACT and Simetrica, IMD, Gambling Commission, Cebr analysis
This likewise demonstrates the increase in the valuation of the potential benefits that could be realised if a reduction in B2 maximum stakes were to reduce problem gambling and the associated welfare costs to society by 50%, and if those benefits are appropriately weighted to account for their higher valuation by those already socially deprived and economically disadvantaged.

48
© Centre for Economics and Business Research
References: Attribution notice for the social value bank Below is the complete attribution notice for the social value bank database:
• Title: Community investment and homelessness values from the Social Value Bank
• Authors: HACT and Simetrica (www.hact.org.uk / www.simetrica.co.uk)
• Source: www.socialvaluebank.org
• License: Creative Commons Attribution-NonCommercial-NoDerivatives license (http://creativecommons.org/licenses/by-nc-nd/4.0/deed.en_GB)
Social Value Bank - References
Lizzie Trotter, Jim Vine, Matt Leach, Daniel Fujiwara (March 2014). Measuring the Social Impact of Community Investment: A Guide to using the Wellbeing Valuation Approach. HACT. London. http://www.hact.org.uk/measuring-social-impact-community-investment-guide-using-wellbeing-valuation-approach
Lizzie Trotter, Jim Vine, Daniel Fujiwara (May 2015). The health impacts of housing associations' community investment activities. HACT. London. http://www.hact.org.uk/sites/default/files/uploads/Archives/2015/6/HACT%20Investment%20Activities%20report%202015.pdf
Daniel Fujiwara, Jim Vine (September 2015). The Wellbeing Value of Tackling Homelessness. HACT. London. http://www.hact.org.uk/sites/default/files/uploads/Archives/2015/9/Homelessness%20and%20wellbeing%20analysis.pdf
Jim Vine, Mary-Kathryn Rallings Adams, Christina Knudsen, Ricky Lawton and Daniel Fujiwara. (January 2016) Valuing Housing and Local Environment Improvements using the Wellbeing Valuation method and the English Housing Survey: Results and Guidance Manual. HACT. London.
http://www.hact.org.uk/sites/default/files/uploads/Archives/2017/01/Valuing%20Housing%20and%20Local%20Environment%20Improvements%20-%20Jan%202017.pdf

49
© Centre for Economics and Business Research
Appendix 1: Detailed results for Cases A-E This appendix provides more detailed results of the analysis of alternative Cases A to E. For each case, the tables below uses our estimated retention ratios for each level of new maximum stake to calculate the level of B2 stake revenue that would be expected to be retained after the imposition of the new maximum stake. From this, the level of B2 GGY that would be lost is estimated (second column). The third column captures attrition at 10%, while the next six columns provide estimates of how the lost B2 GGY that remains within the gambling industry is distributed across the various LBO and non-LBO gambling alternatives to B2 games. The ‘net’ loss to LBOs, as given in the final column, is calculated as the sum of attrition and revenue remaining in the gambling industry that does not accrue to LBOs.
Table 24 presents the detailed results for Case A. Likewise, Table 25-13 provide the detailed results for Cases B to E, respectively. The differences between the various cases reflects the different emphasis placed on the various factors relevant in considering appropriate sets of attenuation factors – the extent to which GGY losses to the LBOs (the predominant operator of B2 machines) can be expected to be diverted to alternative gambling channels provided by LBOs, either within betting shops or online.
Table 24: Case A - Total LBO loss in GGY under alternative stake cap assumptions
Source: Cebr Analysis
Table 25: Case B - Total LBO loss in GGY under alternative stake cap assumptions
Source: Cebr Analysis

50
© Centre for Economics and Business Research
Table 26: Case C - Total LBO loss in GGY under alternative stake cap assumptions
Source: Cebr Analysis
Table 27: Case D - Total LBO loss in GGY under alternative stake cap assumptions
Source: Cebr Analysis
Table 28: Case E - Total LBO loss in GGY under alternative stake cap assumptions
Source: Cebr Analysis

51
© Centre for Economics and Business Research
Appendix 2: Synthesis of evidence on gambling-related harm This appendix provides a synthesis of the evidence linking problem gambling and different forms of social harm. It is drawn mainly from the IPPR report.
Problem gambling, employment and productivity
Empirical evidence from the National Opinion Research Centre28 suggests that, of the individuals surveyed who are receiving treatment for problem gambling:
• The majority (61%) reported missing work to gamble;
• The majority (59%) reported experiencing difficulties concentrating on work-related tasks as a result of preoccupations with gambling and with debts accumulated as a result;
• Half reported almost losing their jobs as a result of their gambling and its effects; and
• Over one-third (36%) reported actually losing their jobs as a result of their gambling and its effects.
Problem gambling can thus be associated with further financial difficulties like reduced or lost earnings. Financial difficulties are known to be linked to deleterious impacts on mental health and this, in turn, is linked to work absenteeism. This is another indirect route via which problem gamblers can see their work performance affected.
The cost to employers associated with employees who are suffering these difficulties as a result of problem gambling imposes a loss in productivity. Many employers might have to contend with reduced productivity in the workplace whilst being unable to reduce pay accordingly.29
Problem gambling, financial problems and bankruptcy
Problem gambling can affect the finances of the individuals concerned, with 34% of problem gamblers having reported “severe” financial difficulties as a result of their gambling. 30 This contrasts with 23% for “at-risk” gamblers and 10% for those individuals or households who report not gambling at all. More generally, this evidence suggests that problem gamblers are over three times more likely to report themselves as being in debt than those who do not gamble; 38% for gamblers and 12% for non-gamblers, respectively.
Evidence from a NORC study suggests that approximately 20% of problem gamblers had filed for bankruptcy, significantly higher than the reported 5.5% of low-risk gamblers and 4.2% of non-problem gamblers. A similar percentage – 22% of Gamblers Anonymous members – was reported in a NGISC study as having declared bankruptcy.31
28 See Gerstein et al (1999), “Gambling impact and behaviour study”. National Gambling Impact Study Commission. 29 See Ladouceur, R., Boisvert, J.M., Pépin, M., Loranger, M. and Sylvain, C., 1994. Social cost of pathological gambling. Journal of
gambling studies, 10(4), pp.399-409 30 See Wardle, H., Ireland, E., Sharman, S., Excell, D. and Gonzalez-Ordonez, D., 2014. Patterns of play: analysis of data from
machines in bookmakers. 31 See James KC, Bible WA, Dobson JC, Lanni JT, Leone RC, Loescher RW, et al. National gambling impact study commission final
report. National Gambling Impact Study Commission. 1999,

52
© Centre for Economics and Business Research
Problem gambling and homelessness
Recent evidence suggests that homeless individuals are significantly more likely to be problem gamblers than those who are not homeless32 and that they may even be using betting shops to gain respite from the elements in a warm environment. The same study also presents evidence to suggest that homeless individuals that do gamble have a high propensity for playing FOBTs and gambling on sports activities.
Problem gambling and crime
There is a well-established empirical regularity in the connection between income and criminal activities. Given the link between problem gambling and financial difficulties, it is unsurprising that problem gamblers can be seen as significantly more likely to engage in crime.33 Indeed, evidence from Australia suggests that problem gamblers are up to seven times more likely to be arrested than non-problem gamblers. Furthermore, a study by NORC of 3,481 individuals in the US ascertained that 36% of problem and pathological gamblers had been imprisoned during their lifetime.34
Problem gambling and relationships
Problem gambling affects not only the individuals engaging in the activity themselves, but also those around them. Problem gamblers are likely to experience relationship difficulties with friends, family and colleagues. A complete breakdown in relationships can, in turn, result in isolation for the problem gambler.35
Evidence from the Australian Productivity Commission suggests that, for every problem gambler, there are up to 10 individuals associated with them who can be expected to be negatively impacted by that association. Furthermore, 10% of the sample of problem gamblers in Australia stated that their gambling ultimately resulted in a breakdown in relationships. Of the problem gamblers receiving counselling for problem gambling, 10% admitted that their problem has also resulted in domestic violence.
Problem gambling and physical health
The indirect impacts on mental health that can be caused by problem gambling (as a result of work performance and financial problems) can, in turn, impact on overall health, especially given the established links between mental and physical wellbeing.36 Problem gambling has also been associated with depression and suicide. For example, the Australian Productivity Commission found that almost two-thirds of problem gamblers had suffered depression as a result of their gambling, whilst almost 10% had considered suicide.
32 See Sharman, S., Dreyer, J., Aitken, M., Clark, L. and Bowden-Jones, H., 2015. Rates of problematic gambling in a British homeless sample: A preliminary study. Journal of Gambling Studies, 31(2), pp.525-532. 33 See Doley, R.M., 2000. Want to Make a Bet?: Gambling and Crime in Australasia. Australasian Centre for Policing Research. 34 23% for pathological gamblers and 13% for problem gamblers. See Gerstein et al (1999). 35 See Griffiths, M., Parke, A., Wood, R. and Parke, J., 2006. Internet gambling: An overview of psychosocial impacts. UNLV
Gaming Research & Review Journal, 10(1), p.27. 36 See Wardle et al (2014); and Cowlishaw S and Kessler D (2015) ‘Problem Gambling in the UK: Implications for Health,
Psychosocial Adjustment and Health Care Utilization’, European Addiction Research 22: 90–98.

53
© Centre for Economics and Business Research
Other useful evidence
The IPPR report also considers:
• Health problems: the association between problem gambling and the presence of lifestyle/health risk factors (specifically that rates of problem gambling are higher amongst smokers and heavier drinkers – behaviours that are themselves more prevalent among the more disadvantaged socioeconomic groups). This is claimed by IPPR to be supported by international evidence. There is also evidence of correlations between problem gambling and some types of physical health problems, such as elevated rates of high blood pressure, digestive problems and liver problems. While this could largely be explained by comorbidities such as alcohol addiction and smoking, the authors conclude that problem gambling can reasonably be said to be an exacerbating factor, if not a primary cause of health conditions leading to hospital visits.
• Financial difficulties: IPPR provides evidence on average levels of debt amongst problem gamblers, based on GamCare data for Great Britain.
• Work difficulties: IPPR identifies useful quantitative evidence on the social cost of productivity losses amongst problem gamblers and on the social cost of job changes amongst problem gamblers, both from the Australian Productivity Commission.
• Relationship difficulties: including the social cost of divorce among problem gamblers (APC) and the social cost of familial distress, also from the APC.
Evidence of a correlation between B2 machines and problem gambling
The study from the University of South Wales mentioned in Section 4.1 found that playing in B2 machines in LBOs and using websites and gambling apps for sports events leads to a higher risk for impaired control and problem gambling: 80% of the risk of impaired gambling control is associated with the former and latter gambling channels. The authors also found that problem gambling risk is highly correlated with the factors below:
• Frequency of gambling behaviour;
• Gambling brands recognition;
• Hazardous drinking;
• Intoxicated gambling; and
• Motivation to gamble. In particular, gambling for excitement and as a coping strategy.

54
© Centre for Economics and Business Research
Appendix 3: Updating the evidence used to estimate excess fiscal costs associated with B2 As in the IPPR study, Cebr has sought to explore the potential excess fiscal burden caused by problem gambling can be linked to B2 machines specifically. To do so, we draw on the evidence used by IPPR but, to guarantee we were incorporating the most recent data in our analysis, wherever possible we have updated the assumptions used by the IPPR concerning the cost of the public services. These issues are considered from six perspectives, reflecting the six comorbidity groupings of problem gambling impacts identified by IPPR.
Primary care mental health services
There are several studies supporting the association between problem gambling and mental health illnesses. This suggests that problem gamblers might rely more on medical services to deal with mental health issues than the average individual in the UK population. Cowlishaw and Kessler (2015) found this to be the case. According to this study, problem gamblers are 2.69 times more likely to have visited a GP regarding a mental, nervous or emotional complaint in the previous 12 months.
We assume that this probability does not change when we consider exclusively B2 machine problem gamblers. This is most likely a conservative estimate, if the potential for large losses is exacerbated by B2 machine play.
Using the statistic above we were able to estimate the number of extra GP consultations taken by B2 machine problem gamblers per year relative to the average person in the UK population. The next step was to calculate the cost of these extra GP consultations and to scale up the results to the entire population of B2 machines players who are estimated to be problem gamblers.
Secondary mental health services
There is also evidence that problem gamblers rely more on secondary mental health services than the average person in the UK. According to Cowlishaw and Kessler (2015), problem gamblers are 8.54 times more likely to be accessing counselling or therapy services for mental health problems.
Using this statistic we were able to estimate the extra use of secondary mental health services by B2 machines problem gamblers per year relative to the average person in the UK population. Combining this figure with the average cost of service provision for adults suffering from mental health, and with the number of B2 machines players who are problem gamblers, we are then able to derive the total excess fiscal cost of secondary mental health services associated with B2 problem gamblers.
As in point one, we assumed that the likelihood of accessing counselling or therapy services does not change when we consider exclusively B2 machines problem gamblers. This could again be considered a conservative estimate if the potential for large losses is exacerbated by B2 machine play.
Hospital Inpatient services
Following the same argument as in the two points above, the same study found that problem gamblers are 5.53 times more likely to have been a hospital inpatient in the previous three months than the average person in the UK. As before, we use this figure to estimate the net excess patient discharges by problem gamblers per year relative to average person in the population. We then estimate the cost of these extra inpatient services.
55
© Centre for Economics and Business Research
The last step needed to derive the total excess fiscal cost of hospital inpatient services associated with B2 machines was to combine the figures above with the population of B2 machines players who are problem gamblers.
Work difficulties
The IPPR report found that problem gamblers were 2.65 times more likely to be claiming a jobseekers allowance (JSA) than the average person in the UK population. We assumed this was also the case when we consider B2 machines problem gamblers exclusively.
We used the figure above to estimate the excess propensity to claim a JSA by B2 machines problem gamblers relative to the average person in the UK population. We combined this figure with the cost of an individual claiming a JSA rather than being at work, and with the number of B2 machines problem gamblers in the UK. This produced a final figure for the excess fiscal costs associated with the working difficulties B2 machines problem gamblers face.
Housing problems
It is widely accepted that problem gambling is linked to financial hardships. While being heavily in debt is not directly responsible for the creation of an excess fiscal cost, the potential for homelessness to arise as a result of high levels of debt have the potential to result in one. In this stage, we consider the association between problem gambling and the use of homelessness services. Similar to the methods we have described above, we relied on IPPR’s figure on the likelihood of problem gamblers using homelessness services versus an average person in the UK population, as the relevant statistic for the B2 machines problem gambling population.37 This facilitated a derivation of the excess number of annual homelessness applications that might be attributable to B2 players who are problem gamblers relative to the average person in the UK population. By combining this figure with the fiscal costs associated with a period of statutory homelessness, and with the number of B2 machines problem gamblers, we were able to produce a final figure for the excess fiscal costs associated with housing problems that might be attributable to B2 machine gambling.
Criminality
Problem gambling tends to also be associated with anti-social and criminal behaviour. The IPPR study estimates that the likelihood of problem gamblers spending some time in prison over their lifetime compared with the average member of the population is 4.40. Assuming that this is what we expect to see for B2 problem gamblers, we were able to estimate the excess number of annual prison sentences by B2 machines problem gamblers relative to the average person in the population.
This was combined with the fiscal costs of a prison sentence, and with the number of B2 machines problem gamblers, to derive a figure for the excess fiscal costs associated with criminality issues that can be linked to B2 machines.
37 According to the IPPR study, problem gamblers are 8.70 times more likely to use homelessness services.

56
© Centre for Economics and Business Research
Appendix 4: Further detail on estimation of welfare impacts of reducing maximum B2 stakes As noted in subsection 4.3 of the main report, our welfare estimates rely of data from the HACT and Simetrica “Community investment and homelessness values form the Social Value Bank” on the value attributed by the average person to aspects of their lives such as employment, and financial and health stability. We combined these figures with annual statistics from GamCare on the most common impacts of problem gambling disclosed by callers. These are split between calls by gamblers and calls by affected others, and include the following impacts:
• Alcohol misuse;
• Anxiety/stress;
• Criminal activity;
• Domestic abuse;
• Family/relationship difficulties;
• Feeling isolated;
• General health;
• Housing problems;
• Mental health; and
• Work difficulties.
We used these statistics to derive the number of people affected by problem gambling behaviour associated with B2 machines, including not only problem gamblers themselves, but also their families. We are aware that by using GamCare statistics we are working under the assumption that GamCare callers are a representative sample of B2 problem gamblers and affected others. This is not an unreasonable assumption in the absence of more granular data.
Combining these two resources with the number of B2 machines problem gamblers we were able to estimate the welfare costs of problem gambling for B2 machines players in the following spheres:
• Employment;
• Anti-social behaviour;
• Mental health;
• Physical health;
• Family stability;
• Financial stability; and
• Housing stability.

57
© Centre for Economics and Business Research
In order to measure the welfare costs for the families of the problem gamblers, we estimated the number of affected spouses, ex-spouses and children in the families of B2 problem gamblers. Using the report prepared for the Gambling Commission by Doros Georgiou “Trends in gambling participation, 2000-2014”, we were able to derive the marital status of virtual gaming machines players. As we are not aware of any alternative data, we assumed this statistic applies to B2 machines players. Combining this figure with UK population statistics on marital status, we were able to split B2 machines problem gamblers into three different groups38:
• Single;
• Married; and
• Widowed/divorced/separated.
The overall UK statistics on families and households were then used to derive the number of people affected for each of these groups taking into account what is observed in the UK population. For example, we have assumed that the share of B2 problem gamblers who are married with two dependent children is equal to the share of married households in the UK with two dependent children39. Using this data we were able to estimate the number of B2 machines problem gamblers who have two children. To obtain the number of people affected in the latter group we multiply the number of problem gamblers that belong to this group by three, where three is the number of persons being affected. The first being the spouse and the two others being the two children. We repeat this process in the single and widowed/divorced/separated group to obtain the final number of spouses, ex-spouses and children affected by B2 machines problem gamblers40.
Combining the above estimates on the number of people being affected with the values form the Social Value Bank, we were able to estimate the welfare costs of problem gambling for the family of B2 problem gamblers in the following spheres:
• Anti-social behaviour;
• Family stability;
• Financial stability; and
• Employment stability.
38 As we were not aware of any alternative data, another important assumption was made at this stage. We have assumed that
that the share of B2 machines problem gamblers belonging to each one of the three groups is equal to what you observe in the overall B2 machines players population. There is some qualitative evidence that there is a higher incidence of problem gambling across single people. This would then mean that we will be overestimating the number of spouses and children affected by problem gamblers. However, we are also ignoring all the remaining family members affected by problem gamblers’ behaviour. This will counteract the overestimating effect, and might even completely offset it. 39 As before, the risk of doing this is that we are assuming that the social demographic profile of B2 problem gamblers is the
same as the UK average. Our view is that any overestimation of welfare costs that this might cause has the potential to be completely offset in the same way as explained in footnote 38. For example, we have excluded from our analysis non-dependent children. However, this group will most likely also be affected by the problem gamblers’ behaviour. 40 It is important to add that we have also assumed that if a B2 machines problem gambler was in the
widowed/divorced/separated group only one ex-spouse was being affected. This a conservative assumption (as we are ignoring people with multiple ex-spouses) which can lead to our results being an underestimate of the welfare costs. However, this will also help to counteract any possible overestimation in previous steps, as explained in footnote 38.

58
© Centre for Economics and Business Research
We have also added to this analysis the productivity costs associated with problem gamblers missing work. To do this, we combined the average earnings in the UK with the data from the National Opinion Research Centre at the University of Chicago “Gambling impact and behaviour study” on the number of extra days missed days at work by problem gamblers.
The argument used here is that in an efficient labour market the contribution of an employee should reflect the employer’s valuation of their marginal or average productivity to the business – that is, the value of the output that they should be capable of generating. Therefore, we use earnings as a proxy for productivity. This suggests that the extra days problem gamblers skip at work are hampering the total output and productivity in the UK.