Embed Size (px)
Citation preview
Food Policy 54 (2015) 65–77
Contents lists available at ScienceDirect
Food Policy
journal homepage: www.elsevier .com/locate / foodpol
Assessing the promise of biofortification: A case study of highprovitamin A maize in Zambia
http://dx.doi.org/10.1016/j.foodpol.2015.04.0070306-9192/� 2015 Published by Elsevier Ltd.This is an open access article under the CC BY license (http://creativecommons.org/licenses/by/4.0/).
⇑ Corresponding author. Tel.: +1 202 862 5668.E-mail addresses: [email protected] (K. Lividini), [email protected]
(J.L. Fiedler).
Keith Lividini a,⇑, John L. Fiedler b
a HarvestPlus, International Food Policy Research Institute (IFPRI), 2033 K Street NW, Washington, DC 20006, USAb Poverty Health and Nutrition Division, HarvestPlus, International Food Policy Research Institute (IFPRI), 2033 K Street NW, Washington, DC 20006, USA
a r t i c l e i n f o a b s t r a c t
Article history:Received 11 March 2014Received in revised form 20 March 2015Accepted 26 April 2015
Keywords:NutritionVitamin ABiofortificationCostsCost-effectivenessMicronutrientsMicronutrient deficiencyDALYsHousehold surveysHousehold consumption and expendituresurveys (HCES)Zambia
Introduction: Biofortification is the breeding of new varieties of staple foods for increased micronutrientcontent. It is seen primarily as a complementary, rural-targeted strategy for better reaching remote pop-ulations. This paper presents an ex ante analysis of HarvestPlus’ provitamin A maize (PVAM) in Zambiaand highlights an empirical approach based on the Zambian 2005/06 Living Conditions MonitoringSurvey (LCMS). Because more than 115 countries regularly conduct a Household Consumption andExpenditure Survey (HCES), the approach developed in this LCMS-based study can be applied in manyother countries to analyze varietal adoption and conduct ex ante studies.Methods: Data from the LCMS and health statistics were used to characterize baseline indicators of vita-min A intake and Disability Adjusted Life Years (DALYs) lost. The introduction and scaling up of PVAMwas modeled based on program plans, expert opinion and data on key adoption parameters. An adoptionfunction was specified and expressed in terms of the percent of farmers expected to adopt PVAM over thenext 30 years. A logistic regression adoption function was estimated and used to identify the specificLCMS households adopting, producing and consuming PVAM each year. Information from the IFPRIInternational Model for Policy Analysis of Agricultural Commodities and Trade (IMPACT) of yearly maizeproduction and demand were used to produce annual estimates of PVAM planted, harvested and con-sumed. Taking into account an LCMS-empirically-informed, specified market structure, individuals’ addi-tional vitamin A intake was calculated. The number of DALYs saved were estimated using the change invitamin A intake. Combining these estimates with cost data, the cost-effectiveness of PVAM was calcu-lated.Results: Assuming an adoption ceiling of 20% over 30 years, implementation of PVAM will result in aver-age additional intake of 12% of the Estimated Average Requirement (EAR), a 3 percentage point reductionin the prevalence of inadequate intake, and savings of 23% of total DALYs. Impacts are concentratedamong farming households that have adopted PVAM and consume it from their own production. Theirconsumption will result in an average additional vitamin A intake of 172 lg/day, more than 3 timesthe additional 54 lg/day among the entire population. Among this group, the reduction in the prevalenceof inadequate intake will be more than 5 times the national average (17.5 percentage points). Valuing aDALY at $1000, PVAM’s cumulative value of DALYs saved comes to exceed its cumulative total costs start-ing in 2019. Over 30 years the cost-effectiveness of PVAM in Zambia was estimated to be $24 per DALYsaved, making it very cost-effective.Conclusion: The methodologies employed in this study provide insights and inputs that can be used totarget farmers who are most likely to adopt, to measure their vitamin A intake and to craft messagesto promote adoption. PVAM is a long term investment that shows great promise in becoming a highlycost-effective addition to the public health arsenal for combatting micronutrient deficiencies if the 20%adoption rate can be achieved and maintained. Doing so will require effective marketing strategies,including efforts to couple this nutrition-sensitive intervention with nutrition-specific activities, suchas targeted nutrition messaging and education, in order to increase the likelihood that adopting farmerswill prioritize production for home consumption.� 2015 Published by Elsevier Ltd. This is an open access article under the CC BY license (http://creative-
commons.org/licenses/by/4.0/).
66 K. Lividini, J.L. Fiedler / Food Policy 54 (2015) 65–77
Introduction
Between 1990 and 2010, the global burden of micronutrientdeficiencies fell by more than half (Wang et al., 2012). Among vita-min A, iron and zinc deficiencies, the largest disease burden reduc-tions were in the burden of vitamin A, yet it still accounts for thegreatest disease burden among these three deficiencies. Despitethese positive trends, micronutrient deficiencies remain majorpublic health problems and still rank among the top causes ofdeath and disability, particularly in Sub-Saharan Africa (Limet al., 2012). Globally, the micronutrient disease burden is shoul-dered disproportionately by a highly vulnerable group in the mostvulnerable countries—children under 5 years of age in sub-SaharanAfrica.
Data on Zambian nutrition status, and particularly on vitamin A,is dated. That which is available shows the prevalence of vitamin Adeficiency (VAD) has remained persistently and unacceptably high.According to the most recent nationally representative survey, 53%of children 6–59 months old are VAD (MOST, 2003)—a level wellabove the 20% threshold WHO uses to define when deficienciesconstitute a public health problem—and among non-pregnantwomen of childbearing age (15–49 years) VAD was found to be13.4%. These most recent available data are 12 years old, suggest-ing that there is considerable uncertainty about the currentsituation.
Over the past 15 years, Zambia has made and maintained majorcommitments to a number of nutrition programs. It has been a pio-neer in what have come to be the key programmatic foundations ofnutrition policy in the developing world. In 1998, it became thefirst country in Africa to fortify sugar with vitamin A (Fiedleret al., 2013a), and in 1999 it became the first country in Africa toimplement what has come to be known as Child HealthWeek/Child Health Days (UNICEF, 2011). Child Health Weeks(CHW) are large-scale, mass mobilization-based events undertakensemi-annually to provide an integrated package of high impactchild health and nutrition interventions, including vitamin A sup-plementation, de-worming and vaccinations, growth monitoringand promotion and, intermittently, the distribution of orre-impregnation of insecticide-treated mosquito nets (Fiedleret al., 2012b). From its inception, CHW has been a priority programof the MOH and has achieved high rates of coverage. Still, Zambia’space of progress in improving nutrition status has been slow, par-ticularly among young children among whom the prevalence ratesof VAD is thought to remain high (NFNC, 2010).1 We estimate thatVAD is annually responsible for roughly 3700 lost lives and nearly110,000 disability adjusted life-years (DALYs) in Zambia.
In addition to Zambia’s established portfolio of VAD control pro-grams—which, since 1998, has consisted of CHW and sugar fortifi-cation—the country has other options for combating VAD. Whilenot mandated, wheat flour and maize meal fortification programsare under active consideration by the Zambian government whichhas drafted regulations for their fortification levels (Fiedler et al.,2013a). Vitamin A-fortification of vegetable oil is another possibil-ity, but one that the country has yet to consider. The most recentaddition to Zambia’s VAD control portfolio is biofortification –the production and consumption of varieties of maize that containincreased levels of provitamin A.
1 The only additional data on vitamin A since the 2003 national survey is from a 24HR survey conducted in two districts in 2009. That survey estimated the prevalence ofVAD (based on serum retinol concentration levels) at 57% among 24–59 month olds,roughly the same percentages as the 2003 national survey level estimates reported inTable 2 and 3. After adjusting serum retinol levels for infection, the 24HR surveyfound the VAD level was 48%, and using another methodology (MRDR) to adjust forinfection, it found the prevalence rate was markedly less, 22%, but still above the 20%threshold above which WHO defines VAD as constituting a public health problem(NFNC, 2010).
Biofortification is the breeding of new varieties of staple foodsfor increased macro- and micronutrient content (Bouis et al.,2011). It is seen primarily as a complementary, rural-targetedmicronutrient program strategy for better reaching remote popula-tions, which often comprise the majority of the malnourished.Biofortification is the latest micronutrient intervention strategy,with the first releases of biofortified varieties having begun in justthe last five years (Gilligan, 2012).
HarvestPlus – a global consortium co-led by the InternationalFood Policy Research Institute and the International Center forTropical Agriculture – has promoted and released seven, conven-tionally bred, biofortified crops in 13 countries, and has establishedan accelerating rate of progress in both the number of countriesand the varieties with which it is working (Saltzman et al., 2012).Until 2012, HarvestPlus worked in only Sub-Saharan Africa andSouth Asia. Starting that year, it teamed with AGROSALUD, a pro-gram working to improve the nutrition content of food staples inLatin American and the Caribbean (AgroSalud, 2011). While thereare a number of other organizations working on the developmentof biofortified staples, to date only HarvestPlus has begun actuallydistributing new varieties. Other efforts include four projects thatuse genetic engineering and have targeted bananas, cassava, riceand sorghum: Golden Rice Project (2011), Bio-cassava Plus (Sayreet al., 2011), African Biofortified Sorghum (ABS, 2010) and BetterBananas for Africa (QUT, 2011). In addition, there are three smaller,more specialized projects (INSTAPA, 2011; BAGELS, 2008;HarvestZinc, 2011).2
This paper presents an ex ante analysis of one of the HarvestPlusprojects, Zambia’s provitamin A maize (PVAM). Since the 1960s,over 60% of the total agricultural area planted in major crops(i.e., sugarcane, rice, wheat, cassava, maize, potatoes, sorghum,and soybeans) in Zambia has been planted in maize (JAICAF,2008). Maize dominates the Zambian diet, accounting for morethan half of available dietary energy (FAO, 2012). The biofortifica-tion of maize in Zambia provides an ideal case study for betterunderstanding the potential of biofortification and the key factorsthat condition its impact. The objectives of this ex ante impactstudy are to analyze the costs and health benefits of PVAM in orderto assess its promise as an investment and to estimate itscost-effectiveness to enable readily comparing it to alternativehealth investments.
This study highlights a data-driven, highly contextualizedapproach based on the Zambian 2005/06 Living ConditionsMonitoring Survey (LCMS) (CSO, 2011). The LCMS is a large scale,recurrent, multi-purpose, nationally representative household sur-vey, very similar to a number of other such surveys that are com-monly conducted throughout the world (e.g., household budgetsurveys, integrated household surveys, household income andexpenditure surveys and living conditions monitoring surveys),which together have been referred to as ‘‘household consumptionand expenditure surveys’’ or HCES (Fiedler et al., 2012a). More than115 countries regularly conduct an HCES (Dupreiz et al., 2014). Theapproach developed in this LCMS-based study, therefore—whichfeatures empirically developing many of the program and marketparameters—can be applied in many other countries to analyzevarietal adoption and conduct ex ante studies. To facilitate othersreplicating the approach, we provide considerable detail about sev-eral of the empirical-methodological innovations. It is noteworthythat PVAM is now being introduced in four other countries(Saltzman et al., 2012), each of which has a recent HCES-type ofsurvey available that could be used to conduct a similar study.
2 For a discussion of the political controversies involved in the conventionally bredversus genetically engineered approaches see Pray et al. (2007) and Stein (2014).
K. Lividini, J.L. Fiedler / Food Policy 54 (2015) 65–77 67
Methods
The key database in this study is the Zambian 2005/06 LivingConditions Monitoring Survey (LCMS) data. The LCMS was con-ducted by the Zambian Central Statistical Office. The surveyemployed a two-stage, stratified cluster sample designed to pro-vide reliable estimates at the provincial and national levels. Thesample includes 18,662 households with 97,750 persons. We usedweighted interview data from the 9287 farming households thatwere surveyed in the 2005/06 LCMS to develop estimates for theuniverse of Zambian maize farmers (CSO, 2011).
Overview
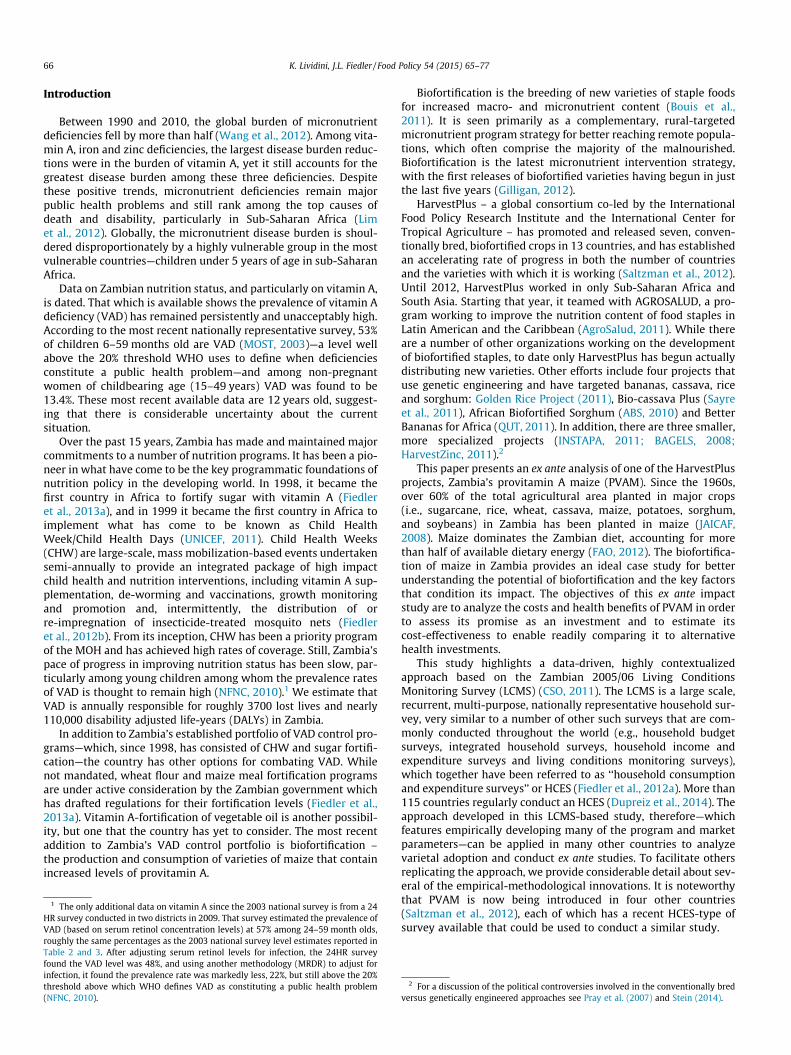
Fig. 1 shows the key methodological components of the studyand its data sources for measuring the project’s enhanced vitaminA-derived health impact. Health statistics together with a proxy forfood consumption data developed from the LCMS were used tocharacterize the ‘‘current situation’’ (or baseline) by estimatingthe usual intake of vitamin A, the prevalence of inadequate vitaminA intake and the burden of vitamin A deficiency (VAD) measuredusing Disability Adjusted Life Years (DALYs).
Next, implementation of the biofortification program was mod-eled using a combination of program plans, expert opinion andgenerated data on key adoption parameters. Usual intake of vita-min A at endline was estimated as baseline vitamin A intake plusthe estimated quantity of PVAM consumed multiplied by the addi-tional vitamin A from biofortification. Using intake estimates atendline and baseline, new incidence rates of VAD-related healthoutcomes were calculated, as were the number of DALYs lost afterthe introduction of PVAM, and the total number of DALYs savedannually. Total health benefits of PVAM were calculated over thelifespan of PVAM as the sum of the annual DALYs saved over thelifespan of PVAM.
4 The model correctly classified 85% of Zambia’s hybrid maize farmers from among
Estimates of Vitamin A Intake and DALYs saved
As already noted, the food consumption module from the LCMSwas used to estimate the prevalence of inadequate vitamin Aintake at baseline as described elsewhere (Fiedler et al., 2013b).The specific way in which DALYs are defined and operationalizedin this study follows directly from earlier HarvestPlus work(Stein et al., 2005b). Drawing on the work of Hallberg et al.(2000) and Zimmerman and Qaim (2004), this methodology cap-tures dose–response effects of the improved functional health sta-tus of the portion of the population whose vitamin A intakeinadequacy gap has been reduced by consuming PVAM, and doesso even if that additional intake does not result in a change inthe prevalence of inadequate intake.3
Vitamin A intake data (baseline and endline) are used in con-junction with age and sex-specific requirements to develop esti-mates of the effectiveness of the intervention. The effectivenessis then averaged over target groups for which clinically-relatedhealth outcomes associated with vitamin A deficiency have beenidentified and quantified, and the averages are used to calculatenew incidence rates for those health outcomes. The new incidencerates are then used to estimate the number of DALYs lost after theintroduction of biofortified PVAM.
3 It is important to point out that in this study, while the analysis of intake levels isin terms of the entire population, the discussion of the adequacy of intake does notinclude children less than 1 year old. They are excluded from the adequacy analysisbecause there are no established vitamin A EARs for this target group.
Supply side estimates
AdoptionPVAM has only been available in Zambia in a limited quantity
since November 2012: there are no data regarding PVAM adoption.PVAM is a hybrid variety of maize. We used LCMS data identifyinghybrid maize growing farmers as a proxy to identify those farmerswho would plant PVAM, and using logistic regression estimatedthe likelihood of farmers planting PVAM. Informed by recentZambian work of Smale and Mason (2012) on the demand formaize seed and a maize seed varietal study (De Groote et al.,2011), the specification of the model included an index of agricul-tural inputs, household labor supply, education, an assets index,identified seed sources and the district of residence.4 The LCMS fileof farmers was then rank-ordered by the farmers’ predicted proba-bilities of adoption, providing a tool for identifying the ordered like-lihood in which specific Zambian maize farmers could be expected toadopt PVAM.
In order to map out the expansion path of adoption of PVAM, anadoption function was specified. The adoption function was alsoinformed by the De Groote et al. (2011) and Smale and Mason(2012) studies, as well as the three most recent Zambian LivingConditions Monitoring Surveys (2003/04, 2005/06 and 2010), theviews and experiences of Zambian public and private sector seedexperts, and Zambian maize value chain experts. The functionwas expressed in terms of the percent of farmers (nationwide)expected to adopt PVAM over the next 30 years and was used withadditional parameters (discussed below) to identify spatial andtemporal dimensions, and to translate the percentage of farmersinto annual estimates of the number of farmers likely to adoptPVAM.
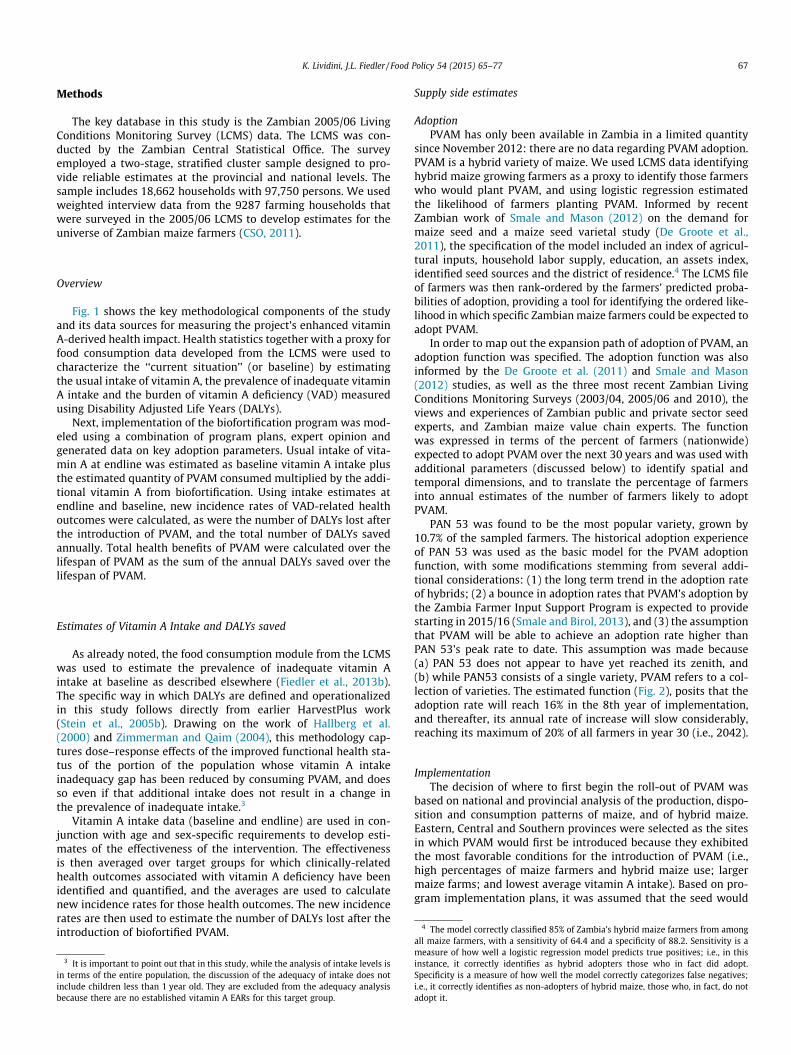
PAN 53 was found to be the most popular variety, grown by10.7% of the sampled farmers. The historical adoption experienceof PAN 53 was used as the basic model for the PVAM adoptionfunction, with some modifications stemming from several addi-tional considerations: (1) the long term trend in the adoption rateof hybrids; (2) a bounce in adoption rates that PVAM’s adoption bythe Zambia Farmer Input Support Program is expected to providestarting in 2015/16 (Smale and Birol, 2013), and (3) the assumptionthat PVAM will be able to achieve an adoption rate higher thanPAN 53’s peak rate to date. This assumption was made because(a) PAN 53 does not appear to have yet reached its zenith, and(b) while PAN53 consists of a single variety, PVAM refers to a col-lection of varieties. The estimated function (Fig. 2), posits that theadoption rate will reach 16% in the 8th year of implementation,and thereafter, its annual rate of increase will slow considerably,reaching its maximum of 20% of all farmers in year 30 (i.e., 2042).
ImplementationThe decision of where to first begin the roll-out of PVAM was
based on national and provincial analysis of the production, dispo-sition and consumption patterns of maize, and of hybrid maize.Eastern, Central and Southern provinces were selected as the sitesin which PVAM would first be introduced because they exhibitedthe most favorable conditions for the introduction of PVAM (i.e.,high percentages of maize farmers and hybrid maize use; largermaize farms; and lowest average vitamin A intake). Based on pro-gram implementation plans, it was assumed that the seed would
all maize farmers, with a sensitivity of 64.4 and a specificity of 88.2. Sensitivity is ameasure of how well a logistic regression model predicts true positives; i.e., in thisinstance, it correctly identifies as hybrid adopters those who in fact did adopt.Specificity is a measure of how well the model correctly categorizes false negatives;i.e., it correctly identifies as non-adopters of hybrid maize, those who, in fact, do notadopt it.
Health Sta�s�csPercent of people
with Vitamin A Deficiency (VAD)
Incidence Rates of Health Outcomes
BASELINE: DALYs Currently
Lost (Without Provitamin A
Maize)
Food Consump�on /
Expenditure Survey Data
Food Consump�on / Expenditure Survey Data
Impact of Provitamin A Maize (DALYs
Averted)
Provitamin A Maize Program
Data and Experts' Es�mates
Bioequivalent Vitamin A Intake
with Provitamin A Maize
Number of People with VA Intake Levels Below
EAR
ENDLINE DALYs lost with Provitamin A
Maize
Percent of Popula�on with Inadequate VA
Intake
New Incidence Rates of Health
Outcomes
Fig. 1. A framework to estimate health benefits of provitamin A maize in Zambia using multiple data sources. Source: Adapted from Stein et al. (2008).
0%
5%
10%
15%
20%
25%
Cumula�ve Percent of Farmers Adop�ngProvitamin A Maize in Zambia
0
100,000
200,000
300,000
400,000
500,000
600,000
700,000
Cumula�ve Number of Farmers Adop�ngProvitamin A Maize in Zambia
0
10,000
20,000
30,000
40,000
50,000
60,000
Annual Number of Farmers Newly Adop�ngProvitamin A Maize in Zambia
Fig. 2. Provitamin A maize adoption parameters, Zambia 2013–2042. Source: Authors’ calculations.
5 IMPACT is a multi-commodity, multi-country, partial equilibrium model thatgenerates projections of global food supply, demand, trade and prices. IMPACTdevelops estimates of 46 crop and livestock commodities and includes 115countries/regions which are each inter-linked through international trade and 281food producing units (grouped according to political boundaries and major riverbasins). Demand is a function of prices, income and population growth. Cropproduction is determined by crop and input prices, the rate of productivity growthand water availability (Rosegrant et al., 2012).
68 K. Lividini, J.L. Fiedler / Food Policy 54 (2015) 65–77
be disseminated to farmers in 3 specific districts in each of the 3provinces initially. To develop the district-specific level estimates,the farmers in the LCMS were rank-ordered within each district bytheir predicted probability of adopting PVAM. The farmers’rank-ordered predicted probabilities of PVAM adoption were usedto identify the specific farmers who would be the first adopters in2013. The specific farmers selected were those whose rank-orderedcumulative number was equal number to the adoptionfunction-estimated number of adopting farmers. The annual num-ber of PVAM adopters in each district in a province were aggre-gated to develop the provincial-level estimated number of PVAMadopters. Similarly, the annual aggregations of the provincial esti-mates provided the total national number of farmers adoptingPVAM. After the initial implementation of PVAM in the first 3 dis-tricts of Central, Eastern and Southern provinces, it was assumedthat implementation would begin in all other districts and pro-vinces in year 2.
ProductionDrawing on recent past experiences and the views of public
extension and private seed company specialists, it was assumedthat each household would receive one 5 kg pack of PVAM seed(this is the standard seed package in Zambia), enough seed to plant0.25 hectares (or what Zambians refer to as 1 lima). Once specificadopters were identified from the rank-ordered LCMS file, the areaplanted in PVAM by each farmer was estimated based on an initialassumption of 0.5 limas (half of the seed pack) and increased by 0.5limas per year up to a farm-specific maximum set equal to each
farm’s maximum amount of area planted in maize as identifiedin the LCMS. The total area planted in PVAM was the sum of theland planted in PVAM by all of the identified, individual PVAMfarmers.
The estimation of annual changes in PVAM production was alsoin part a function of annual changes in total maize production, cul-tivated area and yield. The source of the 2013–2042 annual datawas the IFPRI International Model for Policy Analysis ofAgricultural Commodities and Trade (IMPAACT).5 IMPACT’s esti-mates of the changing total maize area were used in combinationwith the LCMS-provided baseline area to calculate the rate of changeof total maize area planted, allowing each individual farm’s yield andarea to change annually.
In the first year of the analysis it was assumed that PVAM yieldwas equal to that attained in HarvestPlus field trials, 375 kg/lima(1500 tons/Ha). In each subsequent year, PVAM yield was calculatedby multiplying this initial yield by the annual rate of change of (all)maize yields as estimated by IMPACT. For each PVAM producer,multiplying the area planted in PVAM by the IMPACT-estimatedyield provided an estimate of each producer’s PVAM production,
K. Lividini, J.L. Fiedler / Food Policy 54 (2015) 65–77 69
and total PVAM production was calculated as the sum of all individ-ual PVAM producers’ output. Based on information from the AfricanPostharvest Losses Information System (APHLIS, 2012), it wasassumed that all PVAM farmers experience post-harvest losses of15%.
Demand side estimates
Empirical analysis of the production, disposition, marketing andconsumption of maize guided our approach to modeling PVAM.Analysis of the LCMS revealed that 68% of all maize consumed inZambia is maize that the household consuming it has itself pro-duced. With respect to the residual, the Food Security ResearchProject’s 2008 Supplemental Survey of 7825 smallholders revealedthat maize markets in Zambia are very local phenomena (Masonand Jayne, 2009). Only 20–25% of the maize produced in Zambiaenters the market, and a substantial share of that which does issold at local or district markets. Comparing the agriculture/produc-tion and consumption modules from the LCMS revealed that eachprovince has relatively equal quantities of maize production andmaize consumption; each province is, or could be, a largely inde-pendently functioning market.6 Eastern and Central are the onlyexceptions.
These empirical findings about the adoption, production, con-sumption and marketing of maize shaped our approach to model-ing PVAM. It was assumed that all PVAM produced is retained bythe PVAM-producing household to meet its maize consumptionneeds, and is not sold until that need is surfeited. Those PVAMfarmers who produce more PVAM than the maximum quantity ofmaize they annually consume from their own production, sellthe ‘‘excess’’. The PVAM which is sold was assumed to be sold intoa provincial-level market where it is available for purchase by allother households—including farming households that have notadopted PVAM and non-farming households.
In provinces in which the provincial demand for PVAM marketis surfeited, it was assumed that the excess PVAM spills over intoother provinces. In light of the fact that 85% of the maize purchasedin Zambia is purchased either in Lusaka or Copperbelt, theinter-provincial market was defined as consisting of just thesetwo provinces. The proportion of households’ maize consumptionthat was assumed to be purchased in the market was equal tothe ratio of PVAM in the market (i.e., the residual after PVAM farm-ers have met their household’s maize consumption needs) to theamount of maize that is consumed from purchases in the market(including all maize forms, grain and meals).
The average concentration of provitamin A among the three ini-tial varieties released in 2012 was 7.5 lg/g (HarvestPlus, 2013). By2018, it is expected that varieties with 15 lg/g of provitamin A willbe released. Thus in this study, we assumed that the concentrationof provitamin A in PVAM was 7.5 lg/g until 2018, thereafterincreasing to 15 lg/g. In addition, based on studies conducted onthe bioconversion rates of provitamin A to vitamin A whenPVAM is eaten, it was assumed that 6.5 lg of provitamin A wouldyield 1 lg of vitamin A (as retinol activity equivalents or RAE)(HarvestPlus, 2013).
Costs
The value of the resources that will be required to promote,release, monitor and maintain PVAM in Zambia were estimatedusing a combination of HarvestPlus expenditures and budgets,together with information provided by key Zambian partners and
6 We say ‘‘could be’’ because these are net quantities and do not take into accountthe timing or cumulative quantities of households’ total maize sales and total maizepurchases over the course of the year.
stakeholders. It was assumed that costs started being incurred in2010 and that there will be an active ‘‘project-like’’ phase from2010 through 2019, with release occurring in 2013 and promotionand dissemination efforts continuing through 2019. Thereafter, thesignificant costs are those related to monitoring the quality of thePVAM and maintaining the integrity of its seed bank. It wasassumed that this Maintenance & Monitoring (M&M) would con-tinue throughout the remainder of the accounting period afterthe initial release of PVAM. Thus the cost analysis covers a periodof 33 years.
Benefit-cost and cost-effectiveness analysis
The cost-effectiveness of biofortification was estimated usingthe PVAM cost analysis and the PVAM DALYs saved analysis.Three measures commonly used in financial investmentdecision-making were calculated: the cost per DALY saved, thebenefit-cost ratio and the internal rate of return. A value of 3 per-cent (which is generally used for health projects) was used for thediscount rate. The benefit-cost ratio was calculated by assigning afixed value of $1000 per DALY (Meenakshi et al., 2007; Nestel et al.,2006; Stein et al., 2005a). Finally, a breakeven analysis was per-formed in order to examine how long it will take for benefits gen-erated by PVAM to outweigh costs.
Results
Adoption and production
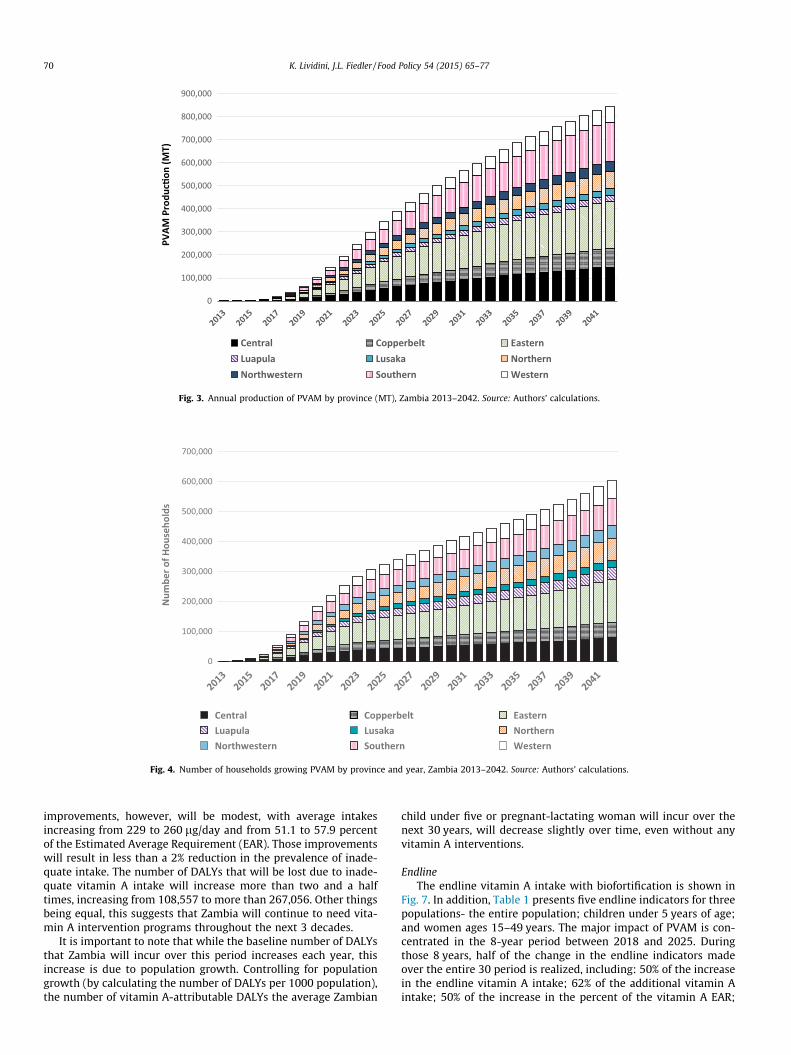
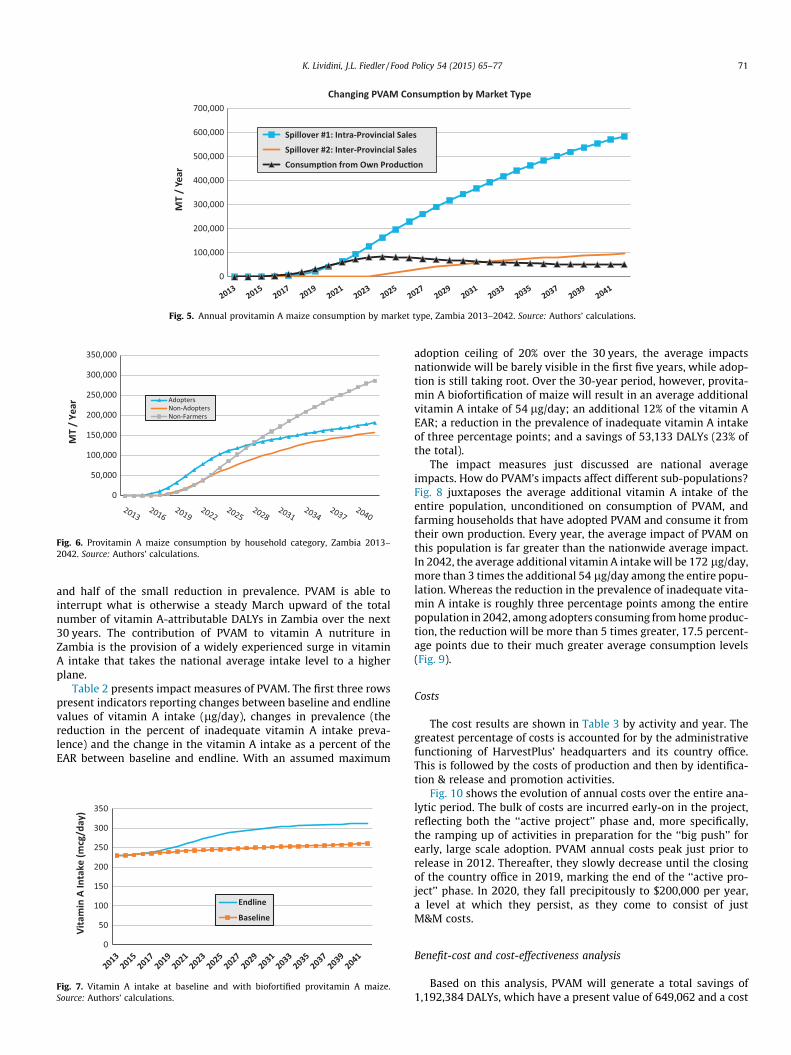
Fig. 2 shows the annual number of new adopters, as well as thecumulative percent and number of adopting farmers over the30-year period. The peak in the annual number of adopters isassumed to happen relatively early, in 2019, when the adoptioncurve is the steepest during the growth phase. Figs. 3 and 4 showthe production of PVAM and the number of households growingPVAM annually over the 2013–2042 period. Production of VAM isdominated by Eastern, Southern and Central provinces.
Marketing and consumption
The size and evolution of the quantities of PVAM involved in theinter-provincial market are shown in Fig. 5. While both intra- andinter-provincial markets grow throughout the analytic period,without question the most dynamic market over time is theintra-provincial one.
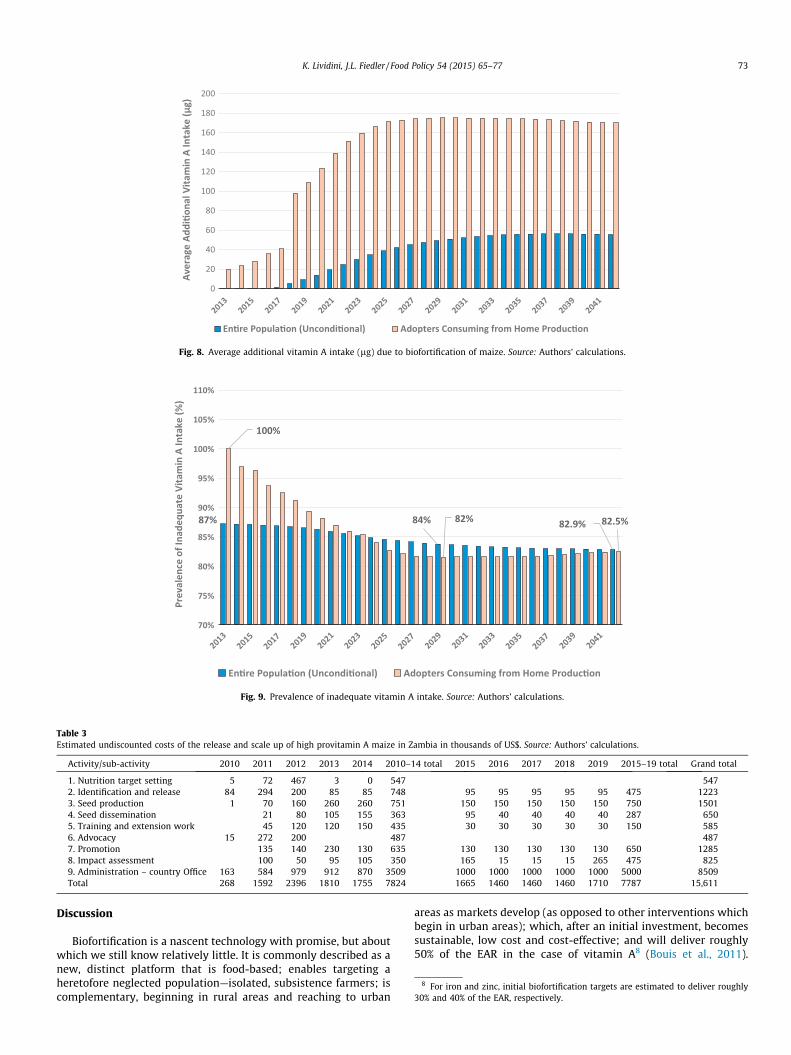
Fig. 6 analyzes households’ consumption levels by their statusas (1) PVAM adopting farmers (Adopter), (2) Non-PVAM Adoptingfarmers (Non-Adopters) or (3) non-farming households. Initially,consumption is concentrated among the PVAM adopters but theirrate of increase in consumption slows in 2022, while the level ofnon-farmers continues to increase. By 2027, the non-farmers’ con-sumption level overtakes that of PVAM adopters. While a largerproportion of the total benefits are garnered by purchasers as agroup, the average level of benefits accruing to adopting farmersare greater due to the farmers’ relatively greater average consump-tion levels.
Vitamin A intake
BaselineBaseline estimates of vitamin A intake in 2013 and their evolu-
tion over time are shown in Fig. 7. The average intake of Zambianswill improve over the next 30 years in the absence of any vitamin Aintervention due simply to increasing general food consumptionpatterns and the changing composition of foods consumed. The
0
100,000
200,000
300,000
400,000
500,000
600,000
700,000
800,000
900,000
PVAM
Pro
duc�
on (M
T)
Central Copperbelt EasternLuapula Lusaka NorthernNorthwestern Southern Western
Fig. 3. Annual production of PVAM by province (MT), Zambia 2013–2042. Source: Authors’ calculations.
0
100,000
200,000
300,000
400,000
500,000
600,000
700,000
Num
ber o
f Hou
seho
lds
Central Copperbelt EasternLuapula Lusaka NorthernNorthwestern Southern Western
Fig. 4. Number of households growing PVAM by province and year, Zambia 2013–2042. Source: Authors’ calculations.
70 K. Lividini, J.L. Fiedler / Food Policy 54 (2015) 65–77
improvements, however, will be modest, with average intakesincreasing from 229 to 260 lg/day and from 51.1 to 57.9 percentof the Estimated Average Requirement (EAR). Those improvementswill result in less than a 2% reduction in the prevalence of inade-quate intake. The number of DALYs that will be lost due to inade-quate vitamin A intake will increase more than two and a halftimes, increasing from 108,557 to more than 267,056. Other thingsbeing equal, this suggests that Zambia will continue to need vita-min A intervention programs throughout the next 3 decades.
It is important to note that while the baseline number of DALYsthat Zambia will incur over this period increases each year, thisincrease is due to population growth. Controlling for populationgrowth (by calculating the number of DALYs per 1000 population),the number of vitamin A-attributable DALYs the average Zambian
child under five or pregnant-lactating woman will incur over thenext 30 years, will decrease slightly over time, even without anyvitamin A interventions.
EndlineThe endline vitamin A intake with biofortification is shown in
Fig. 7. In addition, Table 1 presents five endline indicators for threepopulations- the entire population; children under 5 years of age;and women ages 15–49 years. The major impact of PVAM is con-centrated in the 8-year period between 2018 and 2025. Duringthose 8 years, half of the change in the endline indicators madeover the entire 30 period is realized, including: 50% of the increasein the endline vitamin A intake; 62% of the additional vitamin Aintake; 50% of the increase in the percent of the vitamin A EAR;
0
100,000
200,000
300,000
400,000
500,000
600,000
700,000
MT
/ Ye
ar
Changing PVAM Consump�on by Market Type
Spillover #1: Intra-Provincial Sales
Spillover #2: Inter-Provincial Sales
Consump�on from Own Produc�on
Fig. 5. Annual provitamin A maize consumption by market type, Zambia 2013–2042. Source: Authors’ calculations.
0
50,000
100,000
150,000
200,000
250,000
300,000
350,000
MT
/ Ye
ar
AdoptersNon-AdoptersNon-Farmers
Fig. 6. Provitamin A maize consumption by household category, Zambia 2013–2042. Source: Authors’ calculations.
K. Lividini, J.L. Fiedler / Food Policy 54 (2015) 65–77 71
and half of the small reduction in prevalence. PVAM is able tointerrupt what is otherwise a steady March upward of the totalnumber of vitamin A-attributable DALYs in Zambia over the next30 years. The contribution of PVAM to vitamin A nutriture inZambia is the provision of a widely experienced surge in vitaminA intake that takes the national average intake level to a higherplane.
Table 2 presents impact measures of PVAM. The first three rowspresent indicators reporting changes between baseline and endlinevalues of vitamin A intake (lg/day), changes in prevalence (thereduction in the percent of inadequate vitamin A intake preva-lence) and the change in the vitamin A intake as a percent of theEAR between baseline and endline. With an assumed maximum
0
50
100
150
200
250
300
350
Vita
min
A In
take
(mcg
/day
)
Endline
Baseline
Fig. 7. Vitamin A intake at baseline and with biofortified provitamin A maize.Source: Authors’ calculations.
adoption ceiling of 20% over the 30 years, the average impactsnationwide will be barely visible in the first five years, while adop-tion is still taking root. Over the 30-year period, however, provita-min A biofortification of maize will result in an average additionalvitamin A intake of 54 lg/day; an additional 12% of the vitamin AEAR; a reduction in the prevalence of inadequate vitamin A intakeof three percentage points; and a savings of 53,133 DALYs (23% ofthe total).
The impact measures just discussed are national averageimpacts. How do PVAM’s impacts affect different sub-populations?Fig. 8 juxtaposes the average additional vitamin A intake of theentire population, unconditioned on consumption of PVAM, andfarming households that have adopted PVAM and consume it fromtheir own production. Every year, the average impact of PVAM onthis population is far greater than the nationwide average impact.In 2042, the average additional vitamin A intake will be 172 lg/day,more than 3 times the additional 54 lg/day among the entire popu-lation. Whereas the reduction in the prevalence of inadequate vita-min A intake is roughly three percentage points among the entirepopulation in 2042, among adopters consuming from home produc-tion, the reduction will be more than 5 times greater, 17.5 percent-age points due to their much greater average consumption levels(Fig. 9).
Costs
The cost results are shown in Table 3 by activity and year. Thegreatest percentage of costs is accounted for by the administrativefunctioning of HarvestPlus’ headquarters and its country office.This is followed by the costs of production and then by identifica-tion & release and promotion activities.
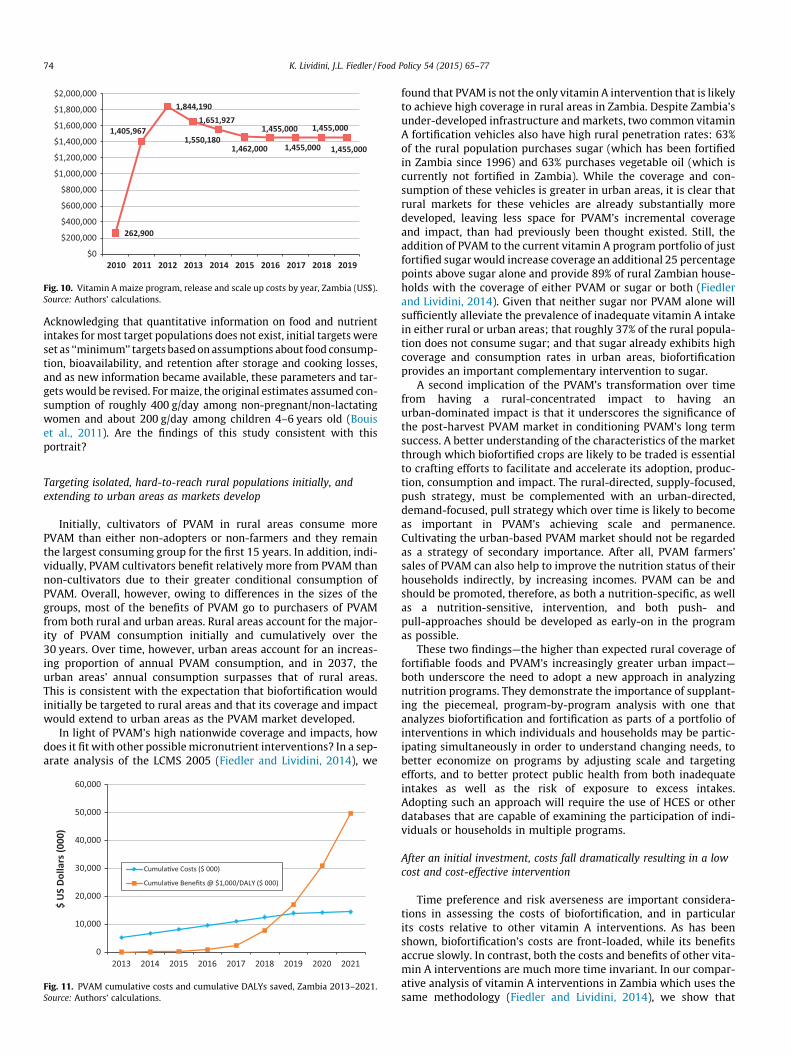
Fig. 10 shows the evolution of annual costs over the entire ana-lytic period. The bulk of costs are incurred early-on in the project,reflecting both the ‘‘active project’’ phase and, more specifically,the ramping up of activities in preparation for the ‘‘big push’’ forearly, large scale adoption. PVAM annual costs peak just prior torelease in 2012. Thereafter, they slowly decrease until the closingof the country office in 2019, marking the end of the ‘‘active pro-ject’’ phase. In 2020, they fall precipitously to $200,000 per year,a level at which they persist, as they come to consist of justM&M costs.
Benefit-cost and cost-effectiveness analysis
Based on this analysis, PVAM will generate a total savings of1,192,384 DALYs, which have a present value of 649,062 and a cost
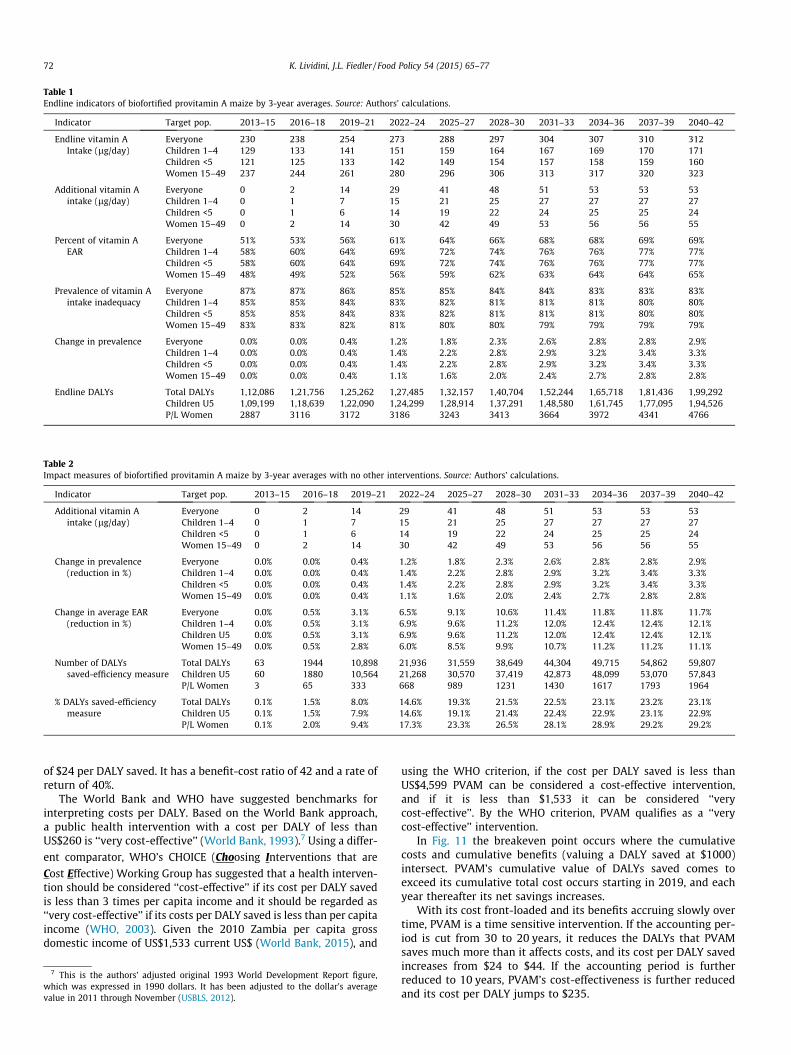
Table 1Endline indicators of biofortified provitamin A maize by 3-year averages. Source: Authors’ calculations.
Indicator Target pop. 2013–15 2016–18 2019–21 2022–24 2025–27 2028–30 2031–33 2034–36 2037–39 2040–42
Endline vitamin AIntake (lg/day)
Everyone 230 238 254 273 288 297 304 307 310 312Children 1–4 129 133 141 151 159 164 167 169 170 171Children <5 121 125 133 142 149 154 157 158 159 160Women 15–49 237 244 261 280 296 306 313 317 320 323
Additional vitamin Aintake (lg/day)
Everyone 0 2 14 29 41 48 51 53 53 53Children 1–4 0 1 7 15 21 25 27 27 27 27Children <5 0 1 6 14 19 22 24 25 25 24Women 15–49 0 2 14 30 42 49 53 56 56 55
Percent of vitamin AEAR
Everyone 51% 53% 56% 61% 64% 66% 68% 68% 69% 69%Children 1–4 58% 60% 64% 69% 72% 74% 76% 76% 77% 77%Children <5 58% 60% 64% 69% 72% 74% 76% 76% 77% 77%Women 15–49 48% 49% 52% 56% 59% 62% 63% 64% 64% 65%
Prevalence of vitamin Aintake inadequacy
Everyone 87% 87% 86% 85% 85% 84% 84% 83% 83% 83%Children 1–4 85% 85% 84% 83% 82% 81% 81% 81% 80% 80%Children <5 85% 85% 84% 83% 82% 81% 81% 81% 80% 80%Women 15–49 83% 83% 82% 81% 80% 80% 79% 79% 79% 79%
Change in prevalence Everyone 0.0% 0.0% 0.4% 1.2% 1.8% 2.3% 2.6% 2.8% 2.8% 2.9%Children 1–4 0.0% 0.0% 0.4% 1.4% 2.2% 2.8% 2.9% 3.2% 3.4% 3.3%Children <5 0.0% 0.0% 0.4% 1.4% 2.2% 2.8% 2.9% 3.2% 3.4% 3.3%Women 15–49 0.0% 0.0% 0.4% 1.1% 1.6% 2.0% 2.4% 2.7% 2.8% 2.8%
Endline DALYs Total DALYs 1,12,086 1,21,756 1,25,262 1,27,485 1,32,157 1,40,704 1,52,244 1,65,718 1,81,436 1,99,292Children U5 1,09,199 1,18,639 1,22,090 1,24,299 1,28,914 1,37,291 1,48,580 1,61,745 1,77,095 1,94,526P/L Women 2887 3116 3172 3186 3243 3413 3664 3972 4341 4766
Table 2Impact measures of biofortified provitamin A maize by 3-year averages with no other interventions. Source: Authors’ calculations.
Indicator Target pop. 2013–15 2016–18 2019–21 2022–24 2025–27 2028–30 2031–33 2034–36 2037–39 2040–42
Additional vitamin Aintake (lg/day)
Everyone 0 2 14 29 41 48 51 53 53 53Children 1–4 0 1 7 15 21 25 27 27 27 27Children <5 0 1 6 14 19 22 24 25 25 24Women 15–49 0 2 14 30 42 49 53 56 56 55
Change in prevalence(reduction in %)
Everyone 0.0% 0.0% 0.4% 1.2% 1.8% 2.3% 2.6% 2.8% 2.8% 2.9%Children 1–4 0.0% 0.0% 0.4% 1.4% 2.2% 2.8% 2.9% 3.2% 3.4% 3.3%Children <5 0.0% 0.0% 0.4% 1.4% 2.2% 2.8% 2.9% 3.2% 3.4% 3.3%Women 15–49 0.0% 0.0% 0.4% 1.1% 1.6% 2.0% 2.4% 2.7% 2.8% 2.8%
Change in average EAR(reduction in %)
Everyone 0.0% 0.5% 3.1% 6.5% 9.1% 10.6% 11.4% 11.8% 11.8% 11.7%Children 1–4 0.0% 0.5% 3.1% 6.9% 9.6% 11.2% 12.0% 12.4% 12.4% 12.1%Children U5 0.0% 0.5% 3.1% 6.9% 9.6% 11.2% 12.0% 12.4% 12.4% 12.1%Women 15–49 0.0% 0.5% 2.8% 6.0% 8.5% 9.9% 10.7% 11.2% 11.2% 11.1%
Number of DALYssaved-efficiency measure
Total DALYs 63 1944 10,898 21,936 31,559 38,649 44,304 49,715 54,862 59,807Children U5 60 1880 10,564 21,268 30,570 37,419 42,873 48,099 53,070 57,843P/L Women 3 65 333 668 989 1231 1430 1617 1793 1964
% DALYs saved-efficiencymeasure
Total DALYs 0.1% 1.5% 8.0% 14.6% 19.3% 21.5% 22.5% 23.1% 23.2% 23.1%Children U5 0.1% 1.5% 7.9% 14.6% 19.1% 21.4% 22.4% 22.9% 23.1% 22.9%P/L Women 0.1% 2.0% 9.4% 17.3% 23.3% 26.5% 28.1% 28.9% 29.2% 29.2%
72 K. Lividini, J.L. Fiedler / Food Policy 54 (2015) 65–77
of $24 per DALY saved. It has a benefit-cost ratio of 42 and a rate ofreturn of 40%.
The World Bank and WHO have suggested benchmarks forinterpreting costs per DALY. Based on the World Bank approach,a public health intervention with a cost per DALY of less thanUS$260 is ‘‘very cost-effective’’ (World Bank, 1993).7 Using a differ-
ent comparator, WHO’s CHOICE (Choosing Interventions that are
Cost Effective) Working Group has suggested that a health interven-tion should be considered ‘‘cost-effective’’ if its cost per DALY savedis less than 3 times per capita income and it should be regarded as‘‘very cost-effective’’ if its costs per DALY saved is less than per capitaincome (WHO, 2003). Given the 2010 Zambia per capita grossdomestic income of US$1,533 current US$ (World Bank, 2015), and
7 This is the authors’ adjusted original 1993 World Development Report figure,which was expressed in 1990 dollars. It has been adjusted to the dollar’s averagevalue in 2011 through November (USBLS, 2012).
using the WHO criterion, if the cost per DALY saved is less thanUS$4,599 PVAM can be considered a cost-effective intervention,and if it is less than $1,533 it can be considered ‘‘verycost-effective’’. By the WHO criterion, PVAM qualifies as a ‘‘verycost-effective’’ intervention.
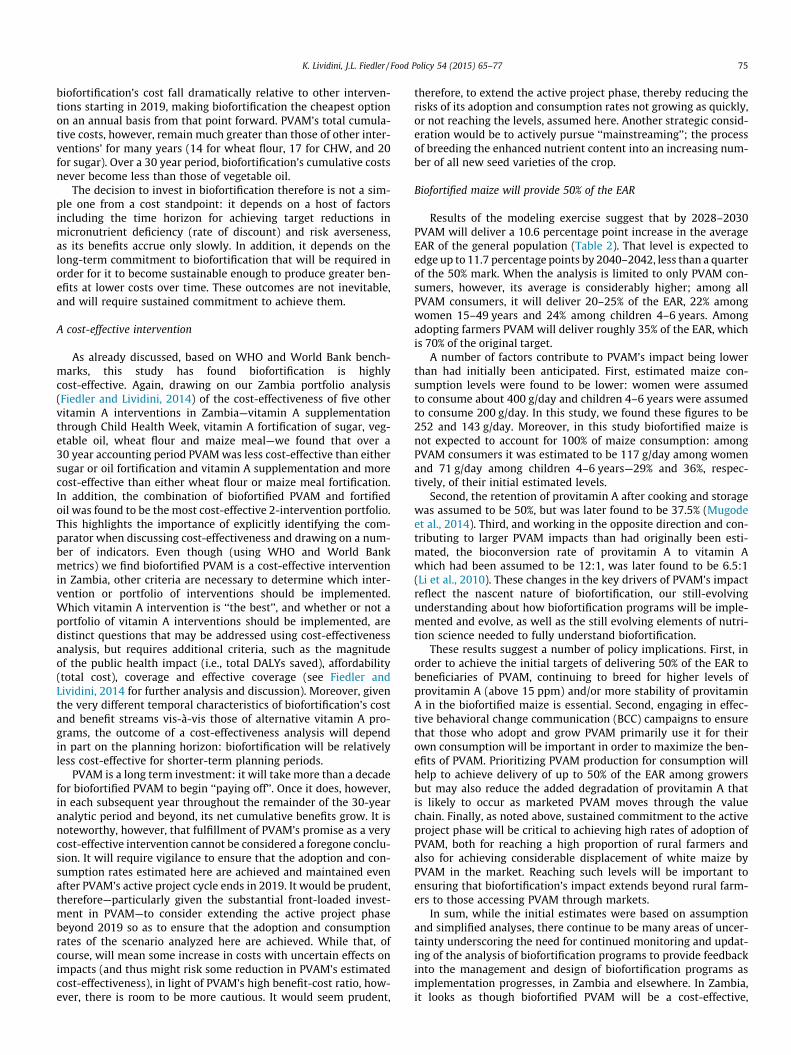
In Fig. 11 the breakeven point occurs where the cumulativecosts and cumulative benefits (valuing a DALY saved at $1000)intersect. PVAM’s cumulative value of DALYs saved comes toexceed its cumulative total cost occurs starting in 2019, and eachyear thereafter its net savings increases.
With its cost front-loaded and its benefits accruing slowly overtime, PVAM is a time sensitive intervention. If the accounting per-iod is cut from 30 to 20 years, it reduces the DALYs that PVAMsaves much more than it affects costs, and its cost per DALY savedincreases from $24 to $44. If the accounting period is furtherreduced to 10 years, PVAM’s cost-effectiveness is further reducedand its cost per DALY jumps to $235.
0
20
40
60
80
100
120
140
160
180
200
Aver
age
Addi
�ona
l Vita
min
A In
take
(μg)
En�re Popula�on (Uncondi�onal) Adopters Consuming from Home Produc�on
Fig. 8. Average additional vitamin A intake (lg) due to biofortification of maize. Source: Authors’ calculations.
87% 84% 82.9%
100%
82% 82.5%
70%
75%
80%
85%
90%
95%
100%
105%
110%
Prev
alen
ce o
f Ina
dequ
ate
Vita
min
A In
take
(%)
En�re Popula�on (Uncondi�onal) Adopters Consuming from Home Produc�on
Fig. 9. Prevalence of inadequate vitamin A intake. Source: Authors’ calculations.
Table 3Estimated undiscounted costs of the release and scale up of high provitamin A maize in Zambia in thousands of US$. Source: Authors’ calculations.
Activity/sub-activity 2010 2011 2012 2013 2014 2010–14 total 2015 2016 2017 2018 2019 2015–19 total Grand total
1. Nutrition target setting 5 72 467 3 0 547 5472. Identification and release 84 294 200 85 85 748 95 95 95 95 95 475 12233. Seed production 1 70 160 260 260 751 150 150 150 150 150 750 15014. Seed dissemination 21 80 105 155 363 95 40 40 40 40 287 6505. Training and extension work 45 120 120 150 435 30 30 30 30 30 150 5856. Advocacy 15 272 200 487 4877. Promotion 135 140 230 130 635 130 130 130 130 130 650 12858. Impact assessment 100 50 95 105 350 165 15 15 15 265 475 8259. Administration – country Office 163 584 979 912 870 3509 1000 1000 1000 1000 1000 5000 8509Total 268 1592 2396 1810 1755 7824 1665 1460 1460 1460 1710 7787 15,611
8 For iron and zinc, initial biofortification targets are estimated to deliver roughly30% and 40% of the EAR, respectively.
K. Lividini, J.L. Fiedler / Food Policy 54 (2015) 65–77 73
Discussion
Biofortification is a nascent technology with promise, but aboutwhich we still know relatively little. It is commonly described as anew, distinct platform that is food-based; enables targeting aheretofore neglected population—isolated, subsistence farmers; iscomplementary, beginning in rural areas and reaching to urban
areas as markets develop (as opposed to other interventions whichbegin in urban areas); which, after an initial investment, becomessustainable, low cost and cost-effective; and will deliver roughly50% of the EAR in the case of vitamin A8 (Bouis et al., 2011).
262,900
1,405,967
1,844,1901,651,927
1,550,1801,462,000
1,455,000
1,455,000
1,455,000
1,455,000
$0
$200,000
$400,000
$600,000
$800,000
$1,000,000
$1,200,000
$1,400,000
$1,600,000
$1,800,000
$2,000,000
2010 2011 2012 2013 2014 2015 2016 2017 2018 2019
Fig. 10. Vitamin A maize program, release and scale up costs by year, Zambia (US$).Source: Authors’ calculations.
74 K. Lividini, J.L. Fiedler / Food Policy 54 (2015) 65–77
Acknowledging that quantitative information on food and nutrientintakes for most target populations does not exist, initial targets wereset as ‘‘minimum’’ targets based on assumptions about food consump-tion, bioavailability, and retention after storage and cooking losses,and as new information became available, these parameters and tar-gets would be revised. For maize, the original estimates assumed con-sumption of roughly 400 g/day among non-pregnant/non-lactatingwomen and about 200 g/day among children 4–6 years old (Bouiset al., 2011). Are the findings of this study consistent with thisportrait?
Targeting isolated, hard-to-reach rural populations initially, andextending to urban areas as markets develop
Initially, cultivators of PVAM in rural areas consume morePVAM than either non-adopters or non-farmers and they remainthe largest consuming group for the first 15 years. In addition, indi-vidually, PVAM cultivators benefit relatively more from PVAM thannon-cultivators due to their greater conditional consumption ofPVAM. Overall, however, owing to differences in the sizes of thegroups, most of the benefits of PVAM go to purchasers of PVAMfrom both rural and urban areas. Rural areas account for the major-ity of PVAM consumption initially and cumulatively over the30 years. Over time, however, urban areas account for an increas-ing proportion of annual PVAM consumption, and in 2037, theurban areas’ annual consumption surpasses that of rural areas.This is consistent with the expectation that biofortification wouldinitially be targeted to rural areas and that its coverage and impactwould extend to urban areas as the PVAM market developed.
In light of PVAM’s high nationwide coverage and impacts, howdoes it fit with other possible micronutrient interventions? In a sep-arate analysis of the LCMS 2005 (Fiedler and Lividini, 2014), we
0
10,000
20,000
30,000
40,000
50,000
60,000
2013 2014 2015 2016 2017 2018 2019 2020 2021
$ U
S Do
llars
(000
)
Cumula�ve Costs ($ 000)
Cumula�ve Benefits @ $1,000/DALY ($ 000)
Fig. 11. PVAM cumulative costs and cumulative DALYs saved, Zambia 2013–2021.Source: Authors’ calculations.
found that PVAM is not the only vitamin A intervention that is likelyto achieve high coverage in rural areas in Zambia. Despite Zambia’sunder-developed infrastructure and markets, two common vitaminA fortification vehicles also have high rural penetration rates: 63%of the rural population purchases sugar (which has been fortifiedin Zambia since 1996) and 63% purchases vegetable oil (which iscurrently not fortified in Zambia). While the coverage and con-sumption of these vehicles is greater in urban areas, it is clear thatrural markets for these vehicles are already substantially moredeveloped, leaving less space for PVAM’s incremental coverageand impact, than had previously been thought existed. Still, theaddition of PVAM to the current vitamin A program portfolio of justfortified sugar would increase coverage an additional 25 percentagepoints above sugar alone and provide 89% of rural Zambian house-holds with the coverage of either PVAM or sugar or both (Fiedlerand Lividini, 2014). Given that neither sugar nor PVAM alone willsufficiently alleviate the prevalence of inadequate vitamin A intakein either rural or urban areas; that roughly 37% of the rural popula-tion does not consume sugar; and that sugar already exhibits highcoverage and consumption rates in urban areas, biofortificationprovides an important complementary intervention to sugar.
A second implication of the PVAM’s transformation over timefrom having a rural-concentrated impact to having anurban-dominated impact is that it underscores the significance ofthe post-harvest PVAM market in conditioning PVAM’s long termsuccess. A better understanding of the characteristics of the marketthrough which biofortified crops are likely to be traded is essentialto crafting efforts to facilitate and accelerate its adoption, produc-tion, consumption and impact. The rural-directed, supply-focused,push strategy, must be complemented with an urban-directed,demand-focused, pull strategy which over time is likely to becomeas important in PVAM’s achieving scale and permanence.Cultivating the urban-based PVAM market should not be regardedas a strategy of secondary importance. After all, PVAM farmers’sales of PVAM can also help to improve the nutrition status of theirhouseholds indirectly, by increasing incomes. PVAM can be andshould be promoted, therefore, as both a nutrition-specific, as wellas a nutrition-sensitive, intervention, and both push- andpull-approaches should be developed as early-on in the programas possible.
These two findings—the higher than expected rural coverage offortifiable foods and PVAM’s increasingly greater urban impact—both underscore the need to adopt a new approach in analyzingnutrition programs. They demonstrate the importance of supplant-ing the piecemeal, program-by-program analysis with one thatanalyzes biofortification and fortification as parts of a portfolio ofinterventions in which individuals and households may be partic-ipating simultaneously in order to understand changing needs, tobetter economize on programs by adjusting scale and targetingefforts, and to better protect public health from both inadequateintakes as well as the risk of exposure to excess intakes.Adopting such an approach will require the use of HCES or otherdatabases that are capable of examining the participation of indi-viduals or households in multiple programs.
After an initial investment, costs fall dramatically resulting in a lowcost and cost-effective intervention
Time preference and risk averseness are important considera-tions in assessing the costs of biofortification, and in particularits costs relative to other vitamin A interventions. As has beenshown, biofortification’s costs are front-loaded, while its benefitsaccrue slowly. In contrast, both the costs and benefits of other vita-min A interventions are much more time invariant. In our compar-ative analysis of vitamin A interventions in Zambia which uses thesame methodology (Fiedler and Lividini, 2014), we show that
K. Lividini, J.L. Fiedler / Food Policy 54 (2015) 65–77 75
biofortification’s cost fall dramatically relative to other interven-tions starting in 2019, making biofortification the cheapest optionon an annual basis from that point forward. PVAM’s total cumula-tive costs, however, remain much greater than those of other inter-ventions’ for many years (14 for wheat flour, 17 for CHW, and 20for sugar). Over a 30 year period, biofortification’s cumulative costsnever become less than those of vegetable oil.
The decision to invest in biofortification therefore is not a sim-ple one from a cost standpoint: it depends on a host of factorsincluding the time horizon for achieving target reductions inmicronutrient deficiency (rate of discount) and risk averseness,as its benefits accrue only slowly. In addition, it depends on thelong-term commitment to biofortification that will be required inorder for it to become sustainable enough to produce greater ben-efits at lower costs over time. These outcomes are not inevitable,and will require sustained commitment to achieve them.
A cost-effective intervention
As already discussed, based on WHO and World Bank bench-marks, this study has found biofortification is highlycost-effective. Again, drawing on our Zambia portfolio analysis(Fiedler and Lividini, 2014) of the cost-effectiveness of five othervitamin A interventions in Zambia—vitamin A supplementationthrough Child Health Week, vitamin A fortification of sugar, veg-etable oil, wheat flour and maize meal—we found that over a30 year accounting period PVAM was less cost-effective than eithersugar or oil fortification and vitamin A supplementation and morecost-effective than either wheat flour or maize meal fortification.In addition, the combination of biofortified PVAM and fortifiedoil was found to be the most cost-effective 2-intervention portfolio.This highlights the importance of explicitly identifying the com-parator when discussing cost-effectiveness and drawing on a num-ber of indicators. Even though (using WHO and World Bankmetrics) we find biofortified PVAM is a cost-effective interventionin Zambia, other criteria are necessary to determine which inter-vention or portfolio of interventions should be implemented.Which vitamin A intervention is ‘‘the best’’, and whether or not aportfolio of vitamin A interventions should be implemented, aredistinct questions that may be addressed using cost-effectivenessanalysis, but requires additional criteria, such as the magnitudeof the public health impact (i.e., total DALYs saved), affordability(total cost), coverage and effective coverage (see Fiedler andLividini, 2014 for further analysis and discussion). Moreover, giventhe very different temporal characteristics of biofortification’s costand benefit streams vis-à-vis those of alternative vitamin A pro-grams, the outcome of a cost-effectiveness analysis will dependin part on the planning horizon: biofortification will be relativelyless cost-effective for shorter-term planning periods.
PVAM is a long term investment: it will take more than a decadefor biofortified PVAM to begin ‘‘paying off’’. Once it does, however,in each subsequent year throughout the remainder of the 30-yearanalytic period and beyond, its net cumulative benefits grow. It isnoteworthy, however, that fulfillment of PVAM’s promise as a verycost-effective intervention cannot be considered a foregone conclu-sion. It will require vigilance to ensure that the adoption and con-sumption rates estimated here are achieved and maintained evenafter PVAM’s active project cycle ends in 2019. It would be prudent,therefore—particularly given the substantial front-loaded invest-ment in PVAM—to consider extending the active project phasebeyond 2019 so as to ensure that the adoption and consumptionrates of the scenario analyzed here are achieved. While that, ofcourse, will mean some increase in costs with uncertain effects onimpacts (and thus might risk some reduction in PVAM’s estimatedcost-effectiveness), in light of PVAM’s high benefit-cost ratio, how-ever, there is room to be more cautious. It would seem prudent,
therefore, to extend the active project phase, thereby reducing therisks of its adoption and consumption rates not growing as quickly,or not reaching the levels, assumed here. Another strategic consid-eration would be to actively pursue ‘‘mainstreaming’’; the processof breeding the enhanced nutrient content into an increasing num-ber of all new seed varieties of the crop.
Biofortified maize will provide 50% of the EAR
Results of the modeling exercise suggest that by 2028–2030PVAM will deliver a 10.6 percentage point increase in the averageEAR of the general population (Table 2). That level is expected toedge up to 11.7 percentage points by 2040–2042, less than a quarterof the 50% mark. When the analysis is limited to only PVAM con-sumers, however, its average is considerably higher; among allPVAM consumers, it will deliver 20–25% of the EAR, 22% amongwomen 15–49 years and 24% among children 4–6 years. Amongadopting farmers PVAM will deliver roughly 35% of the EAR, whichis 70% of the original target.
A number of factors contribute to PVAM’s impact being lowerthan had initially been anticipated. First, estimated maize con-sumption levels were found to be lower: women were assumedto consume about 400 g/day and children 4–6 years were assumedto consume 200 g/day. In this study, we found these figures to be252 and 143 g/day. Moreover, in this study biofortified maize isnot expected to account for 100% of maize consumption: amongPVAM consumers it was estimated to be 117 g/day among womenand 71 g/day among children 4–6 years—29% and 36%, respec-tively, of their initial estimated levels.
Second, the retention of provitamin A after cooking and storagewas assumed to be 50%, but was later found to be 37.5% (Mugodeet al., 2014). Third, and working in the opposite direction and con-tributing to larger PVAM impacts than had originally been esti-mated, the bioconversion rate of provitamin A to vitamin Awhich had been assumed to be 12:1, was later found to be 6.5:1(Li et al., 2010). These changes in the key drivers of PVAM’s impactreflect the nascent nature of biofortification, our still-evolvingunderstanding about how biofortification programs will be imple-mented and evolve, as well as the still evolving elements of nutri-tion science needed to fully understand biofortification.
These results suggest a number of policy implications. First, inorder to achieve the initial targets of delivering 50% of the EAR tobeneficiaries of PVAM, continuing to breed for higher levels ofprovitamin A (above 15 ppm) and/or more stability of provitaminA in the biofortified maize is essential. Second, engaging in effec-tive behavioral change communication (BCC) campaigns to ensurethat those who adopt and grow PVAM primarily use it for theirown consumption will be important in order to maximize the ben-efits of PVAM. Prioritizing PVAM production for consumption willhelp to achieve delivery of up to 50% of the EAR among growersbut may also reduce the added degradation of provitamin A thatis likely to occur as marketed PVAM moves through the valuechain. Finally, as noted above, sustained commitment to the activeproject phase will be critical to achieving high rates of adoption ofPVAM, both for reaching a high proportion of rural farmers andalso for achieving considerable displacement of white maize byPVAM in the market. Reaching such levels will be important toensuring that biofortification’s impact extends beyond rural farm-ers to those accessing PVAM through markets.
In sum, while the initial estimates were based on assumptionand simplified analyses, there continue to be many areas of uncer-tainty underscoring the need for continued monitoring and updat-ing of the analysis of biofortification programs to provide feedbackinto the management and design of biofortification programs asimplementation progresses, in Zambia and elsewhere. In Zambia,it looks as though biofortified PVAM will be a cost-effective,
76 K. Lividini, J.L. Fiedler / Food Policy 54 (2015) 65–77
long-term, complementary vitamin A intervention, that will ini-tially be focused in rural areas, but that over time and with sus-tained commitment will have a spreading affect that will cometo make an important contribution to the vitamin A status ofZambians in rural and urban areas.
Contextualization: The power of HCES in ex ante modeling ofbiofortification
The specific characteristics of biofortification and other micronu-trient interventions, and the specific ways in which they might becombined with the tradeoffs between potential intervention portfo-lios in terms of coverage, cost and impact, is a function of a host ofcountry-specific considerations and underscores the importance ofusing the highly contextualized approach of this study. Thatapproach consists of empirically developing many of the parametersused in this analysis and using these parameters to modelbiofortification.
The central distinguishing feature of this approach is its model-ing the likelihood of PVAM planting (as proxied by cultivatinghybrid maize) and the use of the fitted equation to identify in theLCMS the specific households that are likely to adopt. In most exante adoption studies, these parameters are notempirically-derived. More typically, national-level parameters areassumed (Demont and Stein, 2013). By identifying the specificfarming households that adopt biofortified PVAM, this method pro-vides a better understanding of the likely characteristics of PVAMproducers and consumers, and roots the study within the house-hold level with the constellation of characteristics of actualZambian households. As such, it provides insights into how to iden-tify those households and how to promote their adoption, both ofwhich can be important tools for designing, planning and monitor-ing biofortification interventions and better ensuring its success.
The important contextual considerations we derive from theLCMS agriculture module data include: individual farmer proclivityto adopt modern varieties, individual farm-size, individual farmyield, how much of the biofortified crop is consumed by each house-hold producing it and how much of it is sold. It also incorporatesimportant contextual considerations drawing on aspects of house-holds’ consumption module data, including: whether or not thehousehold purchases the biofortified food, in what quantities andwhat individuals’ apparent vitamin A intake status is before andafter consuming it. The particular strength of this highly contextu-alized approach is that it empirically derives all four of the mostimportant measures in an ex ante analysis of the nutrition impactof a biofortified crop within the same household—viz., the produc-tion and the consumption of the biofortified crop, and the baselineand endline nutrient intakes—rather than assuming their levels orhaving to rely on distribution-free averages which mask importanteffects and relationships.
One part of the contextualization of the study is ourempirically-informed approach to how we defined the marketstructure of PVAM. The comparison of the agriculture/productionand consumption modules revealed that each province is, or couldbe, a largely independently functioning market, with Eastern andCentral Provinces as the only exceptions. We chose to be guidedby these empirical findings about the maize market to determinethe disposition of PVAM once it is produced, rather than adoptingthe more conventional approach of ex ante analyses, which is toassess impact using a single, nation-wide approach. Instead, itwas assumed that maize markets more closely approximateprovincial markets. Adopting this approach we found significantprovincial variations in the quantity of PVAM consumed by house-holds, how PVAM consumers acquired it and how the impact ofbiofortification varies by subpopulation. Given the widespreadavailability of multi-purpose household consumption and
expenditure surveys similar to the LCMS used here (Fiedler et al.,2012a), there is great opportunity for conducting similar studiesin many other countries, and similar types of assessment of biofor-tified crops are underway or have been completed in Bangladesh,India and elsewhere.
Acknowledgements
The authors thank Mark Rosegrant, Simla Tokgoz and PraptiBhandary for providing the IFPRI IMPACT model output data usedin the analysis.
The authors gratefully acknowledge the support of The Bill &Melinda Gates Foundation’s Nutrition and Economic ResearchSupport to HarvestPlus for Grand Challenge #9 Projects GrantOPP52013 and the CGIAR Research Program on Agriculture forNutrition and Health (A4NH).
Appendix A. Key assumptions of PVAM production andconsumption
The Key PVAM Production and Consumption Assumptions
1. Each adopting farming household plants 0.5 lima (1/4 ha) inits first year
2. Average yield for PVAM is 1.5 tons/ha or 375 kg/lima3. Cumulative post-harvest losses of PVAM are estimated to
be 17.9%4. In year 2 and each subsequent year, the farming household
continues planting PVAM. An additional 0.5 lima is plantedin PVAM; the maximum area that a farm may plant inPVAM is the amount of land the farm currently plants inmaize
5. The concentration of provitamin A in PVAM is 7.5 ppm or7.5 lg/g in 2013 and increases to 15 lg/g beginning in 2018
6. Retention of provitamin A in PVAM is 37.5%7. The bioconversion rate of provitamin A carotenoids in
PVAM to vitamin A is assumed to be 6.58. Maize is primarily consumed in the form of nshima, a thick
porridge that is made by first grinding or milling the maize9. Different maize forms have different extraction rates:
breakfast meal = 70%, roller meal = 90%, hammermeal = 90%
10. Initially, all PVAM produced is used for home consumptionand not sold. PVAM producers who produce more PVAMthan the amount of maize they consume from homeproduction, sell the excess PVAM. All PVAM that is sold isassumed to be sold, purchased and consumed within thesame provincial market. Once the provincial marketdemand is surfeited, PVAM is sold to consumers in otherprovinces
References
ABS (Africa Biofortified Sorghum), 2010. The Africa Biofortified Sorghum (ABS)Project. <http://biosorghum.org/abs_prj.php>.
African Postharvest Losses Information System (APHLIS), 2012. <http://www.aphlis.net/index.php?form=about_us_contacts_links> (accessed 31.0714).
AgroSalud, 2011. AgroSalud: The Development and Deployment of BiofortifiedStaple Crops to Reduce Nutrient Deficiencies and Improve Food Security in LatinAmerica and the Caribbean. AgroSalud. <http://www.agrosalud.org/> (accessedAugust 14).
BAGELS (Biofortification through Agronomy and Genotypes to Elevate Levels ofSelenium) Project, 2008. Selenium, Bread and Man. Scottish Crop ResearchInstitute, November 3. <http://www.scri.ac.uk/research/epi/epihighlights/selenium>.
Bouis, H., Hotz, C., McClafferty, B., Meenakshi, J.V., Pfeiffer, W., 2011.Biofortification: a new tool to reduce micronutrient malnutrition. Food Nutr.Bull. 32, S31–S40.
K. Lividini, J.L. Fiedler / Food Policy 54 (2015) 65–77 77
Central Statistical Office (CSO), 2011. Government of the Republic of Zambia. LivingConditions Monitoring Survey Report: 2006 and 2010. Living ConditionsMonitoring Branch, Lusaka, CSO.
De Groote, H., Gitonga, Z., Smale, M., Kasuta, E., Asare-Marfo, D., Sonder, K., Birol, E.2011. Adoption and Diversification of Modern Maize Varieties in Zambia in2011: A Baseline Report Prepared for HarvestPlus. Mimeo, HarvestPlus,Washington, DC.
Demont, M., Stein, A.J., 2013. Global value of GM rice: a review of expectedagronomic and consumer benefits. New Biotechnol. 30 (5), 426–436.
Dupreiz, O., Smith, L.C., Troubat, N., 2014. Assessment of the reliability andrelevance of the food data collected in national household consumption andexpenditure surveys. International Household Survey Network, Food andAgriculture Organization of the United Nations, World Bank. <http://www.ihsn.org/home/sites/default/files/resources/HCES%20food%20data%20assessment%20report_DRAFT_V8_25_02_14.pdf> (accessed 04.08.14).
Fiedler, J.L., Lividini, K., Bermudez O.I., Smitz, M-F., 2012a. Household consumptionand expenditure surveys (HCES): a primer for food and nutrition analysts. FoodNutr. Bull. (Suppl.), September: S170–185.
Fiedler, J.L., Lividini, K., Zulu, R., Kabaghe, G., Tehinse, J., Bermudez, O., 2013a.Identifying Zambia’s Industrial Fortification Options: toward overcoming thefood and nutrition information gap-impasse. Food Nutr. Bull. 34 (4),480–500
Fiedler, J.L., Lividini, K., Zulu, R., Kabaghe, G., Tehinse, J., Bermudez, O., 2013b.Assessing Zambia’s industrial fortification options: getting beyond changes inprevalence and cost-effectiveness. Food Nutr. Bull. 34 (4), 501–519.
Fiedler, J.L., Lividini, K., 2014. Managing the vitamin A program portfolio: a casestudy of Zambia, 2013–2042. Food Nutr. Bull. 35 (1), 105–125.
Fiedler, J.L., Mubanga, F., Siamusantu, W., Musonda, M., Kabwe, K.F., Zulu, C., 2012b.Child health week in Zambia: costs, efficiency, coverage and a reassessment ofneed. Health Policy Plan. 4, 1–18. http://dx.doi.org/10.1093/heapol/czs129.
Food and Agriculture Organization (FAO), 2012. FAOSTAT. <http://faostat.fao.org/site/368/default.aspx#ancor> (accessed 12.11.12).
Gilligan, D., 2012. Biofortification, agricultural technology adoption and nutritionpolicy: some lessons and emerging challenges. CESifo Econ. Stud. 58 (2), 405–421.
Golden Rice Project, 2011. Golden Rice Is Part of the Solution. <http://www.goldenrice.org/> (accessed August 14).
Hallberg, L., Hulthén, L., Garby, L., 2000. Iron stores and hemoglobin iron deficits inmenstruating women. Calculations based on variations in iron requirementsand bioavailability of dietary iron. Eur. J. Clin. Nutr. 54, 650–657.
HarvestPlus, 2013. Provitamin A Maize for Zambia: Strategic Outline, MarketingPlan and Organization of Work. Product Development and Delivery Plan.HarvestPlus, Washington, DC, USA.
HarvestZinc, 2011. HarvestZinc Fertilizer Project. <http://www.harvestzinc.org/index.php> (accessed August 15).
INSTAPA, 2011. Improved Nutrition through Staple Foods in Africa. INSTAPA.<http://www.instapa.org/> (Accessed August 14).
Japan Association for International Collaboration of Agriculture and Forestry(JAICAF), 2008. Maize in Zambia and Malawi. <http://www.jaicaf.or.jp/publications/Zambia.pdf> (accessed 23.02.14).
Li, S., Nugroho, A., Rocheford, T., White, W.S., 2010. Vitamin A equivalence of the b-carotene in b-carotene-biofortified maize porridge consumed by women. Am. J.Clin. Nutr. 92, 1105–1112.
Lim, S.S., Vos, T., Flaxman, A.D., Danaei, G., et al., 2012. A comparative riskassessment of burden of disease and injury attributable to 67 risk factors andrisk factor clusters in 21 regions, 1990–2010: a systematic analysis for theGlobal Burden of Disease Study 2010. Lancet 380, 2224–2260.
Mason, N.M., Jayne, T.S., 2009. Staple food consumption patterns in urban Zambia:Results from the 2007/2008 urban consumption survey. No. 36. Food SecurityResearch Project-Zambia. Ministry of Agriculture and Cooperatives, AgriculturalConsultative Forum and Michigan State University. Lusaka, Zambia: December2009. <http://aec.msu.edu/fs2/zambia/index.htm> (accessed 25.06.12).
Meenakshi et al. 2007. How cost-effective is biofortification in combatingmicronutrient malnutrition? An ex-ante assessment. 2007. HarvestPlusWorking Paper # 2. HarvestPlus, Washington, DC, USA. <http://www.ifpri.org/sites/default/files/publications/hpwp02.pdf>.
Micronutrient Operational Strategies and Technologies (MOST), 2003. UNICEF,Centers for Disease Control and Prevention, Food and Nutrition Commission ofZambia, University of Zambia. Report of the national survery to evaluate theimpact of vitamin A interventions in Zambia, July and November 2003. Zambia,Micronutrient Operational Strategies and Technologies, United States Agencyfor International Development (USAID) Micronutrient Program, 2003.
Mugode, L., Ha, B., Kaunda, A., Sikombe, T., Phiri, S., Mutale, R., Davis, C.,Tanumihardjo, S., De Moura, F.F., 2014. Carotenoid retention of biofortifiedprovitamin A maize (Zea mays L,) after Zambia traditional methods of milling,cooking and storage. J. Agric. Food Chem. 62 (27), 6317–6325 (July 9).
National Food and Nutrition Commission (NFNC) of Zambia, Tropical DiseasesResearch Centre (TDRC), Zambia, HarvestPlus, 2010. Nutrition survey in centraland eastern provinces, Zambia, 2009: Focus on vitamin A and maize intakes andvitamin A status among women and children. NFNC, Lusaka.
Nestel, P., Bouis, H., Meenakshi, J.V., Pfieffer, W., 2006. Biofortification of Staple FoodCrops. J. Nutr. 136 (4), 1064–1067.
Pray, C., Paarlberg, R., Unnevehr, L., 2007. Patterns of political response tobiofortified varieties of crops produced with different breeding techniquesand agronomic traits. AgBioForum 10, 135–143, <http://www.agbioforum.org/v10n3/v10n3a02-pray.htm>.
QUT (Queensland University of Technology), 2011. Better Bananas for Africa.Queensland University of Technology. <http://www.challengingboundaries.qut.edu.au/projects/bananas.jsp> (accessed August 14).
Rosegrant, M.W., Tokgoz, S., Bhandary, P., 2012. The new normal? A tighter globalagricultural supply and demand relation and its implications for food security.Am. J. Ag Econ. 1–7. http://dx.doi.org/10.1093/1j13/112041.
Saltzman, A., Birol, E., Bouis, H.E., Boy, E., DeMoura, F.F., Islam, Y., Pfeiffer, W.H.,2012. Biofortification: progress towards a more nourishing future. Global FoodSecur. http://dx.doi.org/10.1016/j/gfs.2012.12.003.
Sayre, R., Beeching, J.R., Cahoon, E.B., Egesi, C., Fauquet, C., Fellman, J., Fregene, M.,et al., 2011. The BioCassava plus program: biofortification of cassava for Sub-Saharan Africa. Annu. Rev. Plant Biol. 62, 251–272. http://dx.doi.org/10.1146/annurev-arplant-042110-103751.
Smale, M., Birol, E., 2013. Smallholder Demand for Maize Hybrids and Selective SeedSubsidies in Zambia. HarvestPlus Working Paper #9. <http://www.harvestplus.org/sites/default/files/Working_Paper_9_web_2.pdf> (accessed 21.06.14)).
Smale, M., Mason, N., 2012. Demand for Maize Hybrids, Seed Subsidies, and SeedDecision-makers in Zambia. Technical Monograph No. 8. International FoodPolicy Research Institute and the International Center for Tropical Agriculture:Washington DC and Cali, Colombia. <http://www.harvestplus.org/content/demand-maize-hybrids-seed-subsidies-and-seed-decisionmakers-zambia>(accessed 21.06.14).
Stein, A.J., 2014. The poor, malnutrition, biofortification, and biotechnology. In:Herring, R. (Ed.), The Oxford Handbook of Food, Politics and Society OxfordUniversity Press, New York.
Stein, A.J., Meenakshi, J.V., Qaim, M., Nestel, P., Sachdev, H.P.S., Bhutta, Z.A., 2005a.Health benefits of biofortification- an ex-ante analysis of iron-rich rice andwheat in India. American Agricultural Economics Association Annual Meeting.<http://core.kmi.open.ac.uk/download/pdf/6457555.pdf>.
Stein, A.J., Meenakshi, J.V., Qaim, M., Nestel, P., Sachdev, H.P.S., Bhutta, Z.A., 2005b.Analyzing the health benefits of biofortified staples crops by means of thedisability-adjusted life years approach. HarvestPlus Technical Monograph No. 4.International Food Policy Research Institute and the International Center forTropical Agriculture: Washington DC and Cali, Colombia. <http://www.harvestplus.org/content/analyzing-health-benefits-biofortified-staple-crops-means-disability-adjusted-life-years-app> (accessed 21.06.14).
Stein, A., Meenakshi, J.V., Qaim, M., Nestel, P., Sachdev, H.P.S., Bhutta, Z.A., 2008.Potential impacts of iron biofortification in India. Social Science and Medicine66 (8), 1797–1808.
UNICEF, 2011. Child Health Days 1999–2009: Key Achievements and the WayForward. A Report Prepared for the UNICEF Joint Working Group on ChildHealth Days. UNICEF, New York, 2011.
United States Bureau of Labor Statistics, 2012. Inflation Calculator. <http://data.bls.gov/cgi-bin/cpicalc.pl> (accessed 05.12.12).
Wang, H., Wang, H., Swyer-Lindgren, L., Lofgren, K.T., Rajaratnam, J.K., Marcus, J.R.,Levin-Rector, A., Levitz, C.D., Lopez, A.D., Murray, C.J.L., 2012. Age-specific andsex-specific mortality in 187 countries, 1970–2010: a systematic analysis of theGlobal Burden of Disease Study 2010. Lancet 380, 2071–2094.
World Bank, 1993. World Development Report: Investing in Health. World Bank,Washington DC.
World Bank, 2015. World Development Indicators: Zambia. <http://data.worldbank.org/country/zambia#cp_wdi> (accessed on May 5, 2015).
World Health Organization (WHO), 2003. Making choices in health: WHO guide tocost-effectiveness analysis. In: Tan-Torres Edejer, T., Baltussen, R., Adam, T.,Hutubessy, R., Acharya, A., Evans, D.B., Murray, C.J.L. (Eds.), World HealthOrganization, Geneva.
Zimmerman, R., Qaim, M., 2004. Potential health benefits of Golden Rice: aPhilippines case study. Food Policy 29, 147–168.