Embed Size (px)
Citation preview

Assessing the pumpability of concrete with the slump and pressure bleeding test
Research on suitable test methods for assessing the pumpability of concrete W.M. Draijer Bachelor student University of Twente – The Netherlands 20-12-2007
Prof. Z. Shui Wuhan University of Technology Wuhan, P.R. China
Prof. H.J.H. Brouwers University of Twente
Enschede, The Netherlands

Preface 2
Preface
In several weeks knowledge can improve. From only knowing what a concrete pump looks like, to understanding more of the pumpability and even working on the development of a test method. This has resulted in a report which can be the start of the finding of a testing method for assessing the pumpability of concrete. These weeks were very valuable to me, not only because of improved knowledge, but also because of personal development. Living and working in a different culture was sometimes hard. It caused certain miscommunications due to cultural differences, but after all this was a valuable experience certainly not only for me but also for several Chinese students. All this has happened at Wuhan University of Technology (China) where they offered me the possibility to work there; I would like to thank professor Shui for that. Besides offering the possibility, they also helped me during my bachelor thesis with their knowledge and experience. I especially would like to thank Dr. Chen, Xuan Dongxing and Sun Tao for that. Their experience and comments certainly contributed in this research. Furthermore I would like to thank all students who helped me with executing my experiments and arranging all practical affairs. Besides help out of China, help also came out of The Netherlands. Therefore I would like to thank my supervisor professor Brouwers for his comments and fast replies on my questions. Hopefully this research can contribute in the development for prior quality management and will it be a successful finish of my bachelor Civil Engineering at the University of Twente, The Netherlands. Wessel Draijer Wuhan, December 20th, 2007

Management summary 3
Management summary
Problems with the pumpability of concrete result in delays, increased costs and more labor. Therefore it is useful to use a test method which can predict if these problems would occur with a batch of concrete. Hereby this batch can be rejected preventing these problems. For this research there will be sought for a test method which can help solving the problems which are present in China. This test method should be useable in-field to assess the pumpability of concrete on the building site. The search for this test method will be done by an analysis of the current problems in China regarding to the pumpability and by creating insights in test methods for the pumpability of concrete. The pumpability of concrete can be described by the consistency and the cohesiveness of this mix. The consistency is the relative ability to flow and in China this is measured by the slump test. The cohesiveness is the resistance to segregation and bleeding. In China this is only measured on request by the normal bleeding test; a time consuming test. Most of the problems which occur in China are not directly related to the consistency or cohesiveness, but to management problems which will finally influence the consistency and cohesiveness of the mix. The management problems causes delays resulting in setting and bleeding of the mix in the truck or the hopper. This results in a change of both the consistency and cohesiveness. Another problem which was met during a visit on the building site was a broken pipe. Combined with high temperatures and a human error this is the last category of problems, ‘other problems’. The problem with high temperatures is that it increases the slump loss and bleeding and thus affects the consistency and cohesiveness of the mix. By the search for a suitable test methods which measure the consistency and cohesiveness all these problems can be dealt with. The test method which shows to be most useful is the combination of the slump- and slump-flow test combined with the pressure bleeding test. These methods are able to measure both the consistency and cohesiveness of different types of concrete. This means that these methods can predict the pumpability of the concrete, independent of the type of problems, and thus prevent blockades from occurring. When slump- and slump-flow test and the pressure bleeding test were tested it appeared that these test methods are reliable test methods. They can measure if recipes are different or identical. Differences in w/b-ratio, sand ratio and a change in the amount of super-plasticizer will give a change in results. These changes showed results as expected. It can be concluded that the slump- and slump-flow test and the pressure bleeding test are useful methods for assessing the consistency and cohesiveness. This means that these methods can be used for assessing the pumpability of concrete. Further improvements for these test methods must be sought in practical improvements. This will make the pressure bleeding test a test method which will be easy and even more reliable to execute. Because of the high future perspective of these tests further development of the tests and research on their correlation to the pumpability of concrete is recommended.

Table of Contents 4
Table of Contents
Preface ............................................................................................................ 2
Management summary ........................................................................................... 3
List with figures and tables ..................................................................................... 6
Introduction ............................................................................................................. 7
Chapter 1: Plan of research ................................................................................ 8
1.1 Introduction........................................................................................................ 8
1.2 Scope of Research ............................................................................................... 8
1.3 Problem posing and objectives ........................................................................... 8
1.4 Research questions ............................................................................................. 9
1.5 Research strategy ............................................................................................... 9
1.6 Importance of research ..................................................................................... 10
Chapter 2: Understanding the pumpability ..................................................... 11
2.1 Introduction...................................................................................................... 11
2.2 Basic knowledge about pumping concrete ........................................................ 11
2.3 Describing the pumpability ............................................................................... 12 2.3.1 Cohesiveness ............................................................................................... 12 2.3.2 Consistency ................................................................................................. 13
2.4 Concrete characteristics influencing the pumpability ........................................ 14 2.4.1 Fines & Aggregates ...................................................................................... 14 2.4.2 Cement content ........................................................................................... 15 2.4.3 Water content ............................................................................................. 15 2.4.4 Admixtures & Additives ............................................................................... 15 2.4.5 Time & Temperature ................................................................................... 16
2.5 Summary .......................................................................................................... 16
Chapter 3: Current situation in China .............................................................. 18
3.1 Introduction...................................................................................................... 18
3.2 Which problems can occur ................................................................................ 18 3.2.1 Types of problems ....................................................................................... 18 3.2.2 Problems in pumping phases ....................................................................... 19
3.3 Which problems occur in China ......................................................................... 20
3.4 Summary .......................................................................................................... 22
Chapter 4: Test methods ................................................................................... 23
4.1 Introduction...................................................................................................... 23
4.2 Requirements for testing methods .................................................................... 23
4.3 Tests for assessing the pumpability ................................................................... 24 4.3.1 Slump test ................................................................................................... 24 4.3.2 Visual inspection .......................................................................................... 25 4.3.3 K-slump tester ............................................................................................. 25 4.3.4 Pressure bleeding test ................................................................................. 26 4.3.5 BT RHEOM ................................................................................................... 27 4.3.6 Segregation cylinder .................................................................................... 27
4.4 Summary .......................................................................................................... 28

Table of Contents 5
Chapter 5: Evaluation of test methods ............................................................ 29
5.1 Introduction...................................................................................................... 29
5.2 Test procedure ................................................................................................. 29 5.2.1 Concrete recipe ........................................................................................... 29 5.2.2 Experiments ................................................................................................ 30 5.2.3 Analyzing method ........................................................................................ 30
5.3 Reliability of the test methods .......................................................................... 32 5.3.1 Pressure bleeding test ................................................................................. 32 5.3.2 Slump test & Slump-flow test ....................................................................... 33
5.4 Recipes influencing the cohesiveness ................................................................ 34 5.4.1 Influence of water binder ratio .................................................................... 34 5.4.2 Influence of sand ratio ................................................................................. 35 5.4.3 Influence of super plasticizer ....................................................................... 37
5.5 Improvements of the test methods ................................................................... 38
5.6 Summary .......................................................................................................... 39
Conclusion & Recommendations .......................................................................... 41
References .......................................................................................................... 43
Nomenclature ........................................................................................................ 44
Appendix A: Comparison China and The Netherlands ..................................... 45
Appendix B: Fresh Concrete Test ........................................................................ 46
Appendix C: Concrete recipes ...............................................................................47
Appendix D: Visual inspection of the slump test ............................................... 48

List with figures and tables 6
List with figures and tables
List with figures Figure 1: Plug flow ................................................................................................................ 11 Figure 2: Blockade due to particle interlock .......................................................................... 12 Figure 3: Flow friction ........................................................................................................... 12 Figure 5: Samples of blocked and flowing concrete ............................................................... 19 Figure 6: Setting in pipe ........................................................................................................ 20 Figure 7: K-slump tester ........................................................................................................ 25 Figure 8: Pressure Bleeding Test ........................................................................................... 26 Figure 9: BT RHEOM ............................................................................................................. 27 Figure 10: Segregation cylinder ............................................................................................. 27 Figure 11: Typical result of the PBT ....................................................................................... 31 Figure 12: Test results – bleeding results for equal recipes ................................................... 32 Figure 13: Test results – small change in recipe..................................................................... 33 Figure 14: Test results – Bleeding results due to changed water binder ratio ........................ 34 Figure 15: Test results – Bleeding due to changed sand ratio ................................................ 36 Figure 16: Test results – Bleeding results due to changed amount of super plasticizer .......... 37 Figure 17: Fresh Concrete Test.............................................................................................. 46
List with tables Table 1: Requirements for test methods ............................................................................... 24 Table 2: Visual Stability Index rating ..................................................................................... 25 Table 3: Changes in slump and slump-flow due to changed w/b ratio ................................... 33 Table 4: Test results – Slump results due to changed water binder ratio ............................... 34 Table 5: Test results – Changed water binder ratio compared to ratio of water emitted ....... 35 Table 6: Test results – Changed sand ratio compared to ratio of water emitted .................... 36 Table 7: Test results – Slump results due to changed sand ratio ............................................ 37 Table 8: Test results – Slump results due to changed amount of super plasticizer ................. 37 Table 9: Test results – Changed amount of SP compared to ratio of water emitted ............... 38 Table 10: Concrete recipes – changes in water binder ratio .................................................. 47 Table 11: Concrete recipes – changes in sand ratio ............................................................... 47 Table 12: Concrete recipes – changes in amount of super plasticizer .................................... 47

Introduction 7
Introduction
In the last decades the speed of concrete placement has improved due to pumping of concrete. The advantages of pumping concrete can be seen by the number of concrete pumps which are used nowadays. Sadly this advantage also comes with disadvantages such as blockades. These blockades are unwanted, resulting in a research on improvement of assessing the pumpability of concrete. This research is done in China, the country with the highest concrete production and placement, to prevent delays from interfering with the high speed development. The final result of this research program should be the development of a testing method to assess the pumpability. The prediction of the pumpability will prevent blockades and thus reduce delays and costs, and furthermore improve the durability of the structure due to the continuous and homogenous concrete flow. To reach this goal several steps are taken; the first steps were choosing a testing method and improving it. The next step is verifying, calibrating and validating this test method resulting in a useable test method. This report will focus on the first step, the choice and improvement of the test method. This will firstly be done by a more detailed description of the plan of research which will be covered by chapter 1. The second step is finding out which factors are important for assessing the pumpability. Descriptions of the pumpability, flow patterns and which factors influence the pumpability can be found in chapter 2. With this theoretical background there will be looked at the situation in China. This will be done by describing the current situation and pointing at the problems and their cause; all this can be found in the third chapter. In chapter 4 attention will be paid to finding a solution for these problems. This chapter will be devoted to several potential test methods. These methods will be described, resulting in a suggestion which test methods can be used best. In chapter 5 the best test methods will be tested in the laboratory. This will result in a clear description of the reliability and insight in the change in results by a changed pumpability. The end of this chapter will show possible improvements of the test methods to improve the quality of the test method. Based on this information conclusions and recommendations are put forward resulting in test methods which can be useful for assessing the pumpability of concrete and recommendations on how to continue with this research.

Chapter 1: Plan of research 8
Chapter 1: Plan of research
1.1 Introduction In this chapter the outlining of this research will be discussed. There is attention for the problems which are met in China. Based on these problems the objective and research questions will be formulated. The following chapters of this report will focus on these research questions. The last paragraphs will focus on the research strategy and the benefits of this research which are less delays, lower costs and a higher durability of the structure.
1.2 Scope of Research The economic situation in China is changing rapidly. Concrete and steel are used to create buildings, bridges and other objects. This results in an increased demand for concrete and a high workload. To build as fast as possible concrete is being pumped through pipes to make it easily arrive at its final destination. In this pumping stage some problems occur which can cause delays and problems which are difficult to overcome. It can happen that the concrete is not suitable for pumping or that is was suitable but due to setting it is not pumpable anymore. This will cause a blockade in the pipes. This problem can be prevented by the implementation of prior quality management on fresh concrete. The major idea of prior quality management is the usage of the concrete recipe and other properties of concrete to predict the long-term properties. Nowadays this prior quality management majorly consists of the slump test; a fast test with immediate results and an acceptable precision. The disadvantage of this test is that it only measures the consistency while the pumpability of concrete also depends on the cohesiveness. According to the assignment description this is also experienced at the building site because “it appears that concrete that has passed the slump test can still cause problems during pumping”. This explains that using only the slump test for assessing the pumpability is not satisfying. It needs to be replaced by or combined with other test methods. (Koehler & Fowler, 2003) In this research the prior quality management program will be improved. This will be done by assessing properties of normal fresh concrete which influence the pumpability. This means that SCC or other advanced concretes are outside the scope of this research. When the test method can be used to assess the pumpability of normal concrete it can probably be adjusted to assess the pumpability of more advanced types of concrete as well.
1.3 Problem posing and objectives
1.3.1 Problem posing
As said in the former paragraph “it appears that concrete that has passed the slump test can still cause problems during pumping”. According to this sentence there is a difference between expected and experienced behavior during the pumping process. This difference can exist because of several reasons, for example that the required knowledge for predicting the pumpability is not available, is applied in a different way or the knowledge is not used in practice.
1.3.2 Objectives
The objective of this research is to determine which tests can be used in-field to assess the pumpability of normal concrete. This will be done by an analysis of the current problems in China regarding to the pumpability and by creating insights in test methods for the pumpability of fresh concrete.

Chapter 1: Plan of research 9
1.4 Research questions Based on the problem posing and objectives the following research questions can be formulated.
1. Which factors influence the pumpability of concrete? a. How can the pumpability be described? b. Which characteristics influence the pumpability of concrete?
2. What is the current situation in China regarding to pumping concrete?
a. Which problems occur? b. What is the cause of these problems?
3. Which test methods can be used best to assess the pumpability of concrete? a. What are the requirements for the test methods? b. Which test methods can be executed? c. Which test methods can be executed best?
4. To what degree can the ‘best tests’ be used in practice and how can they be improved?
1.5 Research strategy The first research question is about getting knowledge on the pumpability of concrete. This research question acts as a base for the other questions. To answer this question there will be done a literature study on what the pumpability of concrete is and how it can be described. Furthermore, the correlation between properties of the recipe and the pumpability will be discussed. With this information there is enough knowledge to continue to the next research questions. The second research question focuses on the situation in China. The problems and their cause will be observed by a visit of several days to a building site. During this visit there will be interviews with several people who have experience with the pumpability of concrete. A questionnaire will be made to make sure that all possible problems will come forward. The retrieved information will be combined with the information about the pumpability. This will result in discovering the cause of the problems. Based on the result of this research question there will be determined which type of tests could be useful to minimize the problems on the building site. The third research question is about the available test methods. Firstly requirements for the usage of the test methods at the building site will be identified. Secondly, with these requirement there will be looked at test which can be useful to minimize the problems on the building site. This includes test methods from other types of concrete such as SCC; these test methods might be useful after some adjustments. The test methods which have a future perspective will be discussed with their advantages and disadvantages. This will finally result in a proposal which test methods could be used best to assess the pumpability. The fourth research question is about validating the proposed tests. The test methods will be used in the laboratory to test the quality of these tests. Testing the quality will be done by keeping the recipe constant and by varying the concrete recipe with small and big steps. These results will be analyzed in two ways; firstly to see how good the test method is in measuring identical and different recipes; secondly what the results tell about mix design. This research question will be closed with information on how the test methods can be improved. These improvements will mainly focus on some practical improvements to create a test which is easier to handle and thus more suitable for in-field use.

Chapter 1: Plan of research 10
1.6 Importance of research This research can lead to several improvements on the building site which can cause lower costs and an increased building speed, both in China and abroad. These advantages can be gained by a better prediction of the pumpability. If the pumpability is known before the pumping process starts a pump blockade can be prevented. This means that there will not be unexpected delays and management will become easier. Furthermore the working speed will be increased due to less time consuming blockades; this will reduce the cost of building projects. Beside cost- and speed advantages the quality of the concrete will also be improved due to a continuous and homogeneous concrete flow. This will prevent setting in the bottom layer before the top layer is poured on top. This will result in a good cohesion which will result in a higher durability of the structure. Besides these advantages there will also be more information available about the influence of the recipe on the pumpability. This means that designing a pumpable recipe will become easier and more reliable. These arguments explain why predicting the pumpability is an important factor which can reduce the problems and increase the building speed. Recommendations on how to predict the pumpability will be presented in this report.

Chapter 2: Understanding the pumpability 11
Chapter 2: Understanding the pumpability
2.1 Introduction As cited in the Plan of research there is are often problems with assessing the pumpability of concrete. To solve this problem the background of the pumpability of concrete needs to be more clear. In this chapter this backgrounds will be discussed starting with the pumping equipment. This will be continued by the behavior of concrete in the pipes. How the pumpability of concrete can be described will be discussed followed by the recipe characteristics which influence the pumpability of concrete. With this information the research question which will be answered is as follows.
1. Which factors influence the pumpability of concrete? a. How can the pumpability be described? b. Which characteristics influence the pumpability of concrete?
2.2 Basic knowledge about pumping concrete For the pumping process different types of equipment are available. There are variations in the pipes and the pump used. These variations can influence the pumpability of the concrete because it influences the circumstances of the pumping process. In this paragraph first the equipment which is used to get the concrete in the pipe will be discussed, after that how the concrete behaves inside the pipes during the pumping process is addressed. The most important part of the equipment is the pump. The pump which is most commonly used is the piston pump. This type of pump works by pushing a piston back- and forward. While going backward it creates a vacuum which draws the concrete in the pipe, while going forward it pushes the concrete through the pipe. When selecting the pump important factors are the maximum pressure, the length of a stroke, and the duration of a stroke. The last two factors are important because they determine the speed of the concrete when it leaves the hopper. The maximum pressure is important because it determines which friction can be overcome with the pumping equipment. The pressures used for pumping can vary from 4 MPa till 22 MPa. For comparison, one atmosphere is 0,10 MPa. The factor which is important for the pipes is the pipe diameter. Pipes commonly have a diameter of 150 till 200 mm. The difference in diameter is important because it is one of the factors which influence the speed of the concrete in the pipes. A smaller pipe will result in higher speeds; higher speeds will result in a higher friction which will make it more difficult to pump. To understand more of the pumping process it is important to focus on how the concrete behaves during the pumping process. Although a direct observation is impossible there is some understanding of the flow of concrete in the pipes. In stationary flow the concrete flow consists of two parts, a plug and a lubricating layer as can be seen in Figure 1. The middle part, the plug, consists of aggregate, sand, cement and water. Important to notice is that the velocity over the full width of the plug is equal. This means that there is no relative velocity within the plug which means that the forces acting within this plug are small. The outer part, the lubricating layer, has a thickness of 1 to 2,5 mm and consists of water, cement and fine sand particles. What should be noted is the velocity profile which drops from flow speed to zero at the pipe wall. This means that in this layer some particles are moving faster then other particles and that there are several forces acting within this layer.
Figure 1: Plug flow (Browne & Bamforth, 1977)

Chapter 2: Understanding the pumpability 12
This behavior of concrete is only correct in a stationary flow, this means in a pipe without bends, narrowing’s or bad connections. The flow pattern in non-straight situations will be turbulent which means changes in the flow pattern and the velocity profile. These changes results in a higher sensitivity for a blockade. (Browne & Bamforth, 1977), (Neville, 1997)
2.3 Describing the pumpability The characteristic of concrete which mainly determines if concrete is pumpable is the workability. According to Neville (1997) the definition of the workability of ACI is “that property of freshly mixed concrete or mortar which determines the ease and homogeneity with which it can be mixed, placed, consolidated, and finished”. This means that the workability is not a fundamental property, but it is related to the method of placing, consolidating and finishing. This makes it difficult to measure the workability of concrete. When the definition of the workability is read again it becomes clear that it is a composite property. The two main components are the consistency and the cohesiveness of the concrete which are described by the ‘ease’ and the’ homogeneity’. If both the consistency and the cohesiveness are good the workability will be good and thus the pumpability as well. For a better understanding of the pumpability the consistency and cohesiveness will be discussed in the following paragraphs. (Mehta & Monteiro, 2006), (Neville, 1997)
2.3.1 Cohesiveness
The cohesiveness, or the stability, of the concrete is the resistance to bleeding and segregation. This property is important because it is a measure on how good the concrete will stick together. Bleeding of the concrete is an important property because water is the only material in concrete which can be pumped in natural state. This means that water needs to transfer the forces to the other materials in the concrete. If the cohesiveness is not good enough these forces cannot be transferred to the other materials and bleeding will occur. The process of bleeding is illustrated in Figure 2. Due to particle interlock a high friction occurs, and because of a lack of cohesiveness the forces on the water cannot be transfer to the other materials. This results in water passing the aggregate leaving a mix in unsaturated state. The bleeding of the concrete is a problem because a concrete in unsaturated state will result in a high friction flow as can be seen in Figure 3. According to Browne & Bamforth (1977) concrete in saturated state has a linear pressure loss which can be defined by the following expression which shows the flow friction in saturated state.
𝑃(𝑥) = 𝑃0 −4𝑅𝑥
𝐷
In this expression P is the pressure at a distance x from the pump, P0 the pressure at the pump end of the line, D the internal pipe diameter and R the flow resistance.
Figure 2: Blockade due to particle interlock (Browne & Bamforth, 1977)
Figure 3: Flow friction (Browne & Bamforth, 1977)

Chapter 2: Understanding the pumpability 13
For concrete in unsaturated the expression is different. For calculating the flow friction the following expression is used: 𝑅 = 𝐴 + 𝜇𝑃𝑟 In this expression A is the adhesion resistance and R is equal to A when the radial pressure is zero. The coefficient µ is the friction between the concrete and the pipe wall. These expressions show the difference in flow friction in saturated and unsaturated state which can be seen in Figure 3 as well. The high friction of concrete in unsaturated state will certainly be higher than the pumping pressure which will result in a blockade. Until now there is spoken about one part of the cohesiveness namely bleeding, the other part of the cohesiveness is the resistance to segregation. Segregation means that aggregate would leave the mix. This can occur when the bounding of the concrete is not high enough. What will happen is that the aggregate will move forward due to its higher mass inertia; the aggregate tries to keep its speed equal between the different strokes. If the cohesiveness is not high enough this will result in the aggregate moving to the front of the concrete and finally the aggregate will escape and form a plug in front. This plug will have a high friction which can result in a blockade. To prevent segregation from happening the pumping pressure must be lower than the pressure which ‘breaks’ the bounding. This means that a higher pumping pressure requires a better bounding of the concrete. Measurement of the cohesiveness does not happen often. If it is measured, it is measured by the normal bleeding test or visual inspection of the slump test. The normal bleeding test is a time consuming test, this test takes several hours, and visual inspection is very subjective. The last test method will give a result which mainly depends on the experience of the operator. Another test which can be used is the pressure bleeding test, more information on this test methods can be found in paragraph 4.3.4. (Mehta & Monteiro, 2006), (Neville, 1997)
2.3.2 Consistency
The consistency is the ability to flow; this means the effort which is needed to let the concrete flow. A concrete with a good consistency has a low viscosity, this is a viscosity which is close to the viscosity of water. The consistency is an important property for the pumpability because it is a measure for the friction in the pipes. Nowadays the consistency is measured by the slump test; this test is easy to perform and for the consistency a fairly good measure. According to Neville (1997) the slump needs to be between 50 and 150 mm to be pumpable. This is if the pumpability will be assessed by usage of only the slump test. If the slump value will be lower the mix will be too harsh; this means that the coarse aggregate will graze the wall which will cause a high friction flow. A high friction does not immediately mean that the concrete will not be pumpable, what it means is that it will be more difficult. A higher pressure is needed to push the concrete through the pipes which will increase the risk for bleeding or segregation. If the slump value will be higher than 150 mm this does not mean that it is not pumpable, it means that there is a bigger chance on bleeding or segregation. If the cohesiveness is tested for assessing the pumpability this upper border is determined by the cohesiveness instead of this 150mm. To create a recipe which will result in a good consistency special attention must be paid to the grading curve. When there will be a high amount of coarse aggregate the aggregate can graze the pipe wall if the consistency will be too low. When there will be too many fines present the flow friction will be high as well. As said above, the fine sand particles are part of the lubricating layer in the pipe. When there are more fines present there will be more fines
Chapter 2: Understanding the pumpability 14
which are grazing the pipe wall which will increase the friction flow. (Anderson, 1977), (Neville, 1997)
2.4 Concrete characteristics influencing the pumpability The consistency and the cohesiveness of the mix are influenced by the ingredients which are used. The most important ingredients which influence the consistency and cohesiveness are the fines and aggregate, cement content, water content and admixtures and additives. These factors will be discussed in the following paragraphs to get a better understanding in how to influence the pumpability of concrete. Furthermore several problems can be avoided by following some basic rules; these rules are discussed as well.
2.4.1 Fines & Aggregates
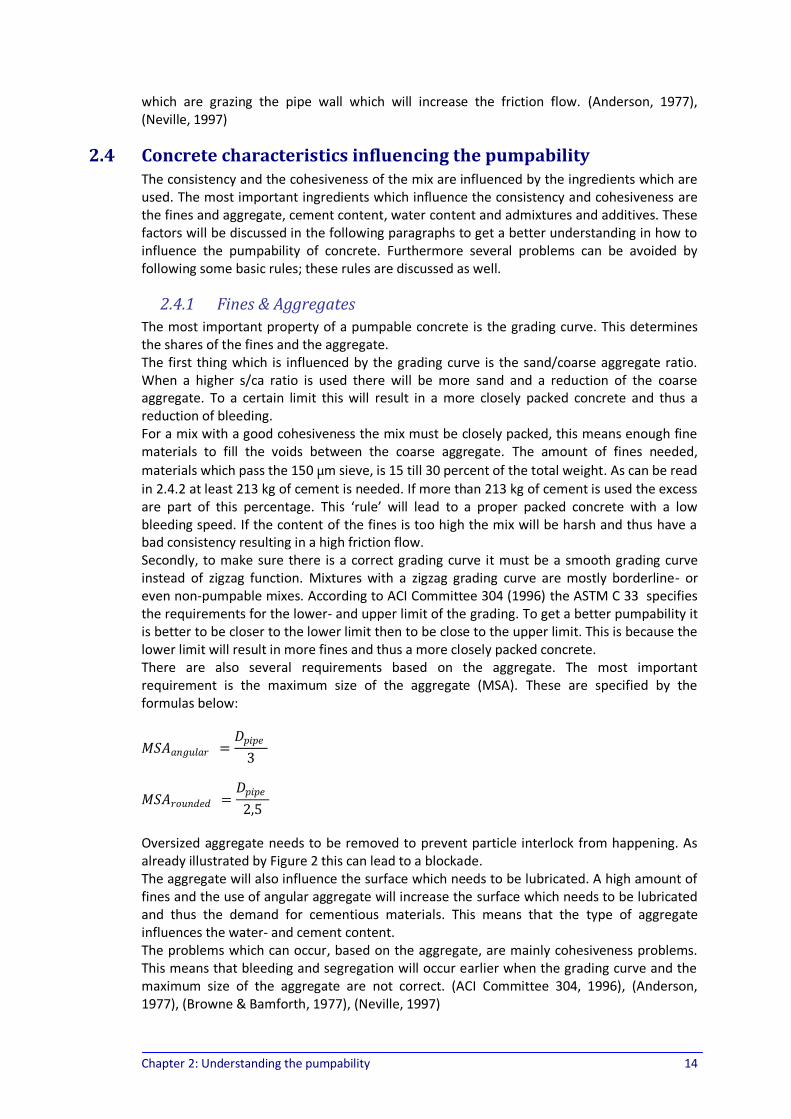
The most important property of a pumpable concrete is the grading curve. This determines the shares of the fines and the aggregate. The first thing which is influenced by the grading curve is the sand/coarse aggregate ratio. When a higher s/ca ratio is used there will be more sand and a reduction of the coarse aggregate. To a certain limit this will result in a more closely packed concrete and thus a reduction of bleeding. For a mix with a good cohesiveness the mix must be closely packed, this means enough fine materials to fill the voids between the coarse aggregate. The amount of fines needed,
materials which pass the 150 µm sieve, is 15 till 30 percent of the total weight. As can be read
in 2.4.2 at least 213 kg of cement is needed. If more than 213 kg of cement is used the excess are part of this percentage. This ‘rule’ will lead to a proper packed concrete with a low bleeding speed. If the content of the fines is too high the mix will be harsh and thus have a bad consistency resulting in a high friction flow. Secondly, to make sure there is a correct grading curve it must be a smooth grading curve instead of zigzag function. Mixtures with a zigzag grading curve are mostly borderline- or even non-pumpable mixes. According to ACI Committee 304 (1996) the ASTM C 33 specifies the requirements for the lower- and upper limit of the grading. To get a better pumpability it is better to be closer to the lower limit then to be close to the upper limit. This is because the lower limit will result in more fines and thus a more closely packed concrete. There are also several requirements based on the aggregate. The most important requirement is the maximum size of the aggregate (MSA). These are specified by the formulas below:
𝑀𝑆𝐴𝑎𝑛𝑔𝑢𝑙𝑎𝑟 =𝐷𝑝𝑖𝑝𝑒
3
𝑀𝑆𝐴𝑟𝑜𝑢𝑛𝑑𝑒𝑑 =𝐷𝑝𝑖𝑝𝑒
2,5
Oversized aggregate needs to be removed to prevent particle interlock from happening. As already illustrated by Figure 2 this can lead to a blockade. The aggregate will also influence the surface which needs to be lubricated. A high amount of fines and the use of angular aggregate will increase the surface which needs to be lubricated and thus the demand for cementious materials. This means that the type of aggregate influences the water- and cement content. The problems which can occur, based on the aggregate, are mainly cohesiveness problems. This means that bleeding and segregation will occur earlier when the grading curve and the maximum size of the aggregate are not correct. (ACI Committee 304, 1996), (Anderson, 1977), (Browne & Bamforth, 1977), (Neville, 1997)

Chapter 2: Understanding the pumpability 15
2.4.2 Cement content
Together with filler the cement content is the only component of concrete which can cause bounding. If the cement is not able to fulfill its function as it should, the bounding of the concrete will be insufficient. This lack of bounding will influence the consistency and cohesiveness. Besides this bounding function the cement will also act as a fine material. This means that the cement content is part of the grading curve. When there is a good grading curve the fine materials will fill the voids between the coarse aggregate and create a packed concrete. This will result in a good cohesiveness. It can be concluded that the cement content fulfills three functions. Firstly the bounding function, secondly the fine-fine material function and thirdly the lubricating function as explained in paragraph 2.2. According to Anderson (1977) at least 213 kg/m3 cement needs to be used to fulfill these functions properly . A part of this content can be replaced by other fine materials such as fly ash. These materials cause less friction as they are more spherical and are therefore an advantage for the pumpability of the concrete. (Anderson, 1977), (Browne & Bamforth, 1977), (Mehta & Monteiro, 2006)
2.4.3 Water content
It can be said that the water content is one of the most critical factors in concrete. Several tables are available for prediction of the water content. For a correct prediction of the water content several factors must be taken into account such as the size of aggregate, the shape of the aggregate (rounded or angular) and the desired slump value. The aggregate will adsorb a part of the water; this adsorption of water will be even higher when angular aggregate is used due to the larger surface which needs to be lubricated. This explains why the water content is dependent on the cement- aggregate ratio. Furthermore, the water content also depends on the w/c-ratio which influences the compressive strength of the concrete and several other properties of concrete. This makes the water content an important and a critical factor for the pumpability of fresh concrete. When there is a lack of water the concrete will be too harsh and thus have a bad consistency. When the mix is too wet there is a higher sensitivity for bleeding or segregation. This means that the water content influences both the consistency and the cohesiveness of the mix. (Browne & Bamforth, 1977), (Mehta & Monteiro, 2006), (Neville, 1997)
2.4.4 Admixtures & Additives
The use of admixtures and additives will influence the characteristics of concrete. Any admixture that increases the workability will usually improve pumpability. A water-reducing admixture will reduce the free water in the concrete and thus the distance between the powder materials. This decrease in distance will cause a higher cohesiveness which will reduce the sensitivity to bleeding or segregation. If the cement content is partly replaced by additives like fly ash or finely ground blast-furnace the adsorption of water will be higher. This means that there is less free water in the concrete and the particles are closer together. As with a water reducing admixture this will lead to a better cohesiveness and thus reduce the sensitivity to bleeding or segregation. The choice of type of admixture or additives and the advantages gained depends on the characteristics of the mixture. For all admixtures which improve workability there is a certain amount which could be used best to optimize the workability and thus the pumpability of concrete. However, in this paragraph only entrained air will be discussed because this is used in every mix. The use of air results in a higher volume, a better consistency and a better cohesiveness. The air content which could be used best is between 3 and 5 percent; this will lead to the best workability and thus pumpability. A higher air content could lead to compression of the

Chapter 2: Understanding the pumpability 16
concrete during pumping. This compressing can lead to a change in air content and thus in a change of characteristics. According to ACI Committee 304 (1996) the air content can increase, decrease or being unaffected as a result of pumping. (Anderson, 1977), (Khayat, Assaad, & Daczko, 2004), (Mehta & Monteiro, 2006)
2.4.5 Time & Temperature
The time and temperature are not real characteristics of a concrete recipe, but are important factors influencing the pumpability. Workability and thus pumpability decreases with time as water evaporates and reacts with cement. Time is an important factor because the evaporation and stiffening of concrete depends on it. The more time it takes before the concrete is pumped the more the concrete will stiffen. This increased stiffening influences the consistency which makes it more difficult to pump the concrete. The temperature is an important factor because hot weather will accelerate the bleeding which will cause a change in the cohesiveness. Furthermore the slump loss will increase due to high temperatures. This means that high temperatures influence both the consistency and the cohesiveness. The temperature should not be higher than 32 °C. (Neville, 1997)
2.5 Summary For pumping concrete different types of equipment are available. The variations mainly exist in the pipe diameter and the pump used. Important factors are the maximum pressure, number of strokes, duration of a stroke and the pipe diameter. Last three factors determine the speed of the concrete in the pipe which influences the friction flow. The maximum pressure is important because it tells which flow friction can be overcome. When the concrete is being pumped the concrete flow consist of two parts; a center plug and a lubricating layer. The center plug consists of aggregate, sand, cement and water. The velocity profile within the plug is constant. This means that there is no relative velocity and the forces acting within the plug are small. The lubricating layer consists of water, cement and other fine sand particles and has a thickness of 1 to 2,5 mm. In this layer there is a difference in flow speed which varies from the flow speed to zero at the pipe wall. This means that several forces are acting within the layer. The described behavior of concrete in the pipes is only correct in a steady flow without bends or narrowing’s. If the flow passes a bend the concrete flow will be more turbulent which means that there are several forces acting within the concrete. This explains that blockades mostly happen close to changing situations such as bends or narrowing’s. For describing the pumpability of concrete the workability is important. The workability and pumpability are closely related which makes that the pumpability can be described by the consistency and the cohesiveness. The consistency is the ability to flow and is successfully measured by the slump test. The cohesiveness is the resistance to segregation and bleeding. This property is measured by the normal bleeding test or the visual inspection of the slump test. The first method is time consuming, because the duration is more than one hour, the second method is subjective. Currently no suitable test methods are used to assess the cohesiveness of the fresh concrete. The consistency and cohesiveness are mainly influenced by the grading curve, cement content, water content and the use of additives and admixtures. The grading curve is the best when it is continuous and a straight line. For the cement content there needs to be at least 213 kg/m3 used, but it can partly be replaced by other fine materials such as fly ash. The water content is the most critical factor and is dependent on the aggregate and the cement. For assessing the estimated amount which is needed several tables are available for a prediction of the water content. Additives and admixtures which improve the workability of

Chapter 2: Understanding the pumpability 17
concrete also improve the pumpability of concrete. With most admixtures there is an optimum amount which should be used to improve the consistency and the cohesiveness. For entrained air this is between 3 and 5 percent. Another important factor is the time and temperature. These are no concrete characteristics, but are important as well due to slump loss and bleeding of the concrete.

Chapter 3: Current situation in China 18
Chapter 3: Current situation in China
3.1 Introduction With the background of pumpability discussed, here can be focused on China. As said in the Plan of research there are some problems with assessing the pumpability of concrete in practice. To understand more of the situation there will be looked at what type of problems can occur and what their cause is. After that there will be looked specifically at the situation in China to see which of these problems occur in China. With this information the following research question can be answered. Besides that there can also be made a comparison between China and The Netherlands, this will be done in appendix A. The research question which will be answered is:
2. What is the current situation in China regarding to pumping concrete? a. Which problems occur? b. What is the cause of these problems?
3.2 Which problems can occur To give a clear description of the situation in China it first needs to be clear what can happen during the pumping process. This means that first the different types of problems will be discussed and after that which problem can occur in which pumping phase. With this knowledge the problems in China will be discussed in paragraph 3.3.
3.2.1 Types of problems
The whole pumping process can be divided into different phases which all have their problems. These problems can be divided in the following categories: 1) consistency problems, 2) cohesiveness problems, 3) management problems and 4) other problems. The consistency- and cohesiveness problems are already discussed in paragraph 2.3. In this paragraph the management- and other problems will be discussed to get a clear background of all the problems. To prevent problems from happening management is an important aspect. The main management problem is a truck mixer which needs to wait before it can unload or no truck mixer present for unloading. When these situations happen setting of concrete in the hopper or in the truck can occur which influences the concrete characteristics. Both the consistency and the cohesiveness are influenced by this which can give difficulties or a blockade during the pumping process. This explains why management is an important factor for problem prevention. Proper management does not only result in fewer problems, but also in smaller problems. When problems occur it is necessary to take immediate action, not only by solving the problem but also to prevent the problem from happening again. This means that if there is a blockade, workers will solve this problems and the manager has to contact the concrete plant to make sure that the concrete comes slower or faster to the building site. Otherwise the problem can happen again with the next truckload. Good management depends on the experience of the manager. This means that training is an important factor so that the manager can easier predict how much time it will cost to solve a problem. This makes management problem prevention which is important during the pumping process.

Chapter 3: Current situation in China 19
Besides these problems there are also problems which are beyond any of the former categories. The first of these problems are problems with the pipes. This means if they are connected properly and if the quality is high enough. Pipes with a high wear will influence the flow pattern of the concrete. This change in flow pattern can result in a blockade of the concrete. Another problem is a bad connection of the pipes which can result in leaking of mortar. The shortage of mortar inside the pipe will cause a decreased cohesiveness and can result in a blockade. (Kaplan, Larrard, & Sedran, 2005) There are also problems which are based on the weather circumstances. High temperatures will cause a higher slump loss and an increased bleeding. This means that hot weather will decrease both the consistency and the cohesiveness and will change the characteristics of concrete. (Neville, 1997) The last problem is the human error. The pump operator is a human being who is always capable of making mistakes. Besides this operator lot of other people could cause problems. The use of well-trained personnel can reduce this problem, but never eliminate it.
3.2.2 Problems in pumping phases
From the beginning till the end of the pumping process several problems can occur. The whole pumping process can be described by the following phases: priming, pumping, stopping/restarting and cleaning of the pump. All of the problems during these phases can be divided into one of the following categories: consistency problems, cohesiveness problems, management problems or other problems. The first phase during the pumping process is the priming phase. During this phase the pipes will be lubricated with grout, a mixture of water and cement and filled with concrete. After the pipes are lubricated they will be filled with concrete. During this filling of the pipes several problems can occur which, in most cases, are easy to resolve. The main problem during this phase is segregation, a cohesiveness problem. The coarse aggregate will interlock and form a plug in front of the concrete. In most cases the problem is caused by changing situations. This means that most problems will occur when the pipe is tampered, bended or when there is an increased wear in comparison to the other pipes which are used. In Figure 4 the result of a blockade can be seen. The left sample is one from a blockade, the right one from a normal flow. What can be seen is that the left sample has a higher coarse aggregate concentration and a lower cement- and sand content. Furthermore, there is no lubricating layer visible in the blocked sample. This indicates that the coarse aggregate generated a high friction. (Kaplan, Larrard, & Sedran, 2005) The second phase, the pumping phase, is a phase with fewer problems because of the steady flow of concrete. Only changing situations can cause problems in this phase. A situation which was not mentioned yet is an increase of the working speed, which will cause a higher friction along the pipe wall. When the flow friction is higher than the pumping pressure a blockade will occur. This means that increasing the pumping speed could result in a blockade. The problem of increased friction is a consistency problem and will be more difficult to resolve. (Browne & Bamforth, 1977) Complete different problems in this phase are the problems which can occur in the hopper. The first problem is a problem of cohesiveness. When segregation in the hopper will occur it
Figure 4: Samples of blocked and flowing concrete (Kaplan, Larrard, & Sedran, 2005)

Chapter 3: Current situation in China 20
will change the characteristics, this change in characteristics can cause a blockade. The second problem is that the coarse aggregate can form a bridge which can prevent concrete to be drawn into the pump. Instead of concrete air will be drawn in which will lead to uncontrolled situations in the pipes which can cause a blockade. (Kaplan, Larrard, & Sedran, 2005) Due to several circumstances it can be necessary to stop or restart the pump. Examples of these problems are redirecting the placing boom or no truck mixer present. When stopping of the pump occurs, time is an important factor. The time the pump stops need to be as short as possible because setting can occur in the hopper or in the pipes. In most cases there is a system in the hopper which keeps the concrete fluid, but even then segregation can occur which makes it difficult to restart the pumping process. An even bigger problem is it when setting occurred in the pipes. Setting will cause the coarse aggregate to come into contact with the pipe wall, resulting in a high friction flow which is difficult to overcome. The described problems can be management- or cohesiveness problems. It is a management problem when these problems occur because of waiting; it is a cohesiveness problem because concrete with a good cohesiveness would decrease the setting and thus give enough time for redirecting the placing boom. The last phase of the pumping process is cleaning. This can be done by either water or compressed air. Cleaning with compressed air rarely results in blockages but often causes safety problems. It is considered that beyond lengths of 100 to 200 meter water cleaning should be used, because this technique is safer and the same pump can be used. Unfortunately, cleaning with water can lead to blockages. When the pipes are cleaned with water a plug is inserted in the pipes which will be pushed forward by the water. When the plug is not good the water will pass the plug and form a blockade with the concrete left. When a blockade occurs it is difficult to resolve because further cleaning leads to further compaction of the concrete. To avoid blockades the plug used needs to be of a high quality so the water and concrete keep separated. The problems in this phase are different from the problems in the former phases. That is why the problems are part of the other problems. (Kaplan, Larrard, & Sedran, 2005)
3.3 Which problems occur in China To problems described in the paragraphs above are all based on literature. To see which problems are real problems in China the building site of the fourth bridge over the Yangtze River1 is visited. On the building site the author has spoken to Li Ru Lin, an old pump operator
1 Executed by Jing Yue Yangtze River Bridge Construction Headquarter of Hubei Province.
(www.jydq.gov.cn)
Figure 5: Setting in pipe (Kaplan, Larrard, & Sedran, 2005)

Chapter 3: Current situation in China 21
with a lot of experience, Zhao Yuan, the laboratory director of the headquarter of the whole building project and Zhang Yong, the laboratory director of the construction company. Based on these interviews it can be said that the biggest problems are management problems, but also some other problems are present. All the problem categories will be discussed so it becomes clear what the size of the problems is. The consistency problems occur rarely in China. This is as expected because the slump test, a reliable test method, is executed on the building site. When problems do occur it is because of a high amount of fines. These fines cause a high friction which can be higher than the available pumping pressure. But, as said, this happens rarely. The cohesiveness problems are also rare, but less rare then the consistency problems. The cohesiveness is commonly not tested in the building site. Only when it is requested by the project manager it will be tested with the pressure bleeding test in the laboratory and also by visual inspection of the slump test. On the building site the slump test is executed, but it depends on the experience of the personnel how well they can predict the cohesiveness based on the visual inspection of the slump test. When cohesiveness problems occur this is in most situations because of the vibration of the pump. This influences the stability of the concrete which can results in an unstable situation and thus segregation or bleeding. As said, the management problem is the biggest problem. Due to delays the concrete will start setting in the truck mixer or in the hopper. Based on the interviews it can be said that this causes approximately three blockades in 24 hours. During the one-day stay on the building site the problems were also three times met. Two times setting in the hopper occurred and one time a truck was redirected because the concrete was too stiff. This decision was made by visual inspection of the concrete. The setting influences both the consistency and the cohesiveness of the concrete. Because these properties are influenced these problems can occur. To prevent these problems more attention needs to be paid to management and the concrete needs to be tested on the building site to see how the consistency and cohesiveness has changed. The ‘other problems’ in China can vary much. One of the problems which were met on the building site was the quality of the pipes. A burst of the pipe was discovered which delayed the pumping process. Another problem is bad connecting of the pipes; this can cause mortar to leak from the pipe which causes a change of characteristics. According to the pump operator most of these problems can be prevented by good preparation of the pumping process. A completely different problem is the weather circumstances in China. During the summer the temperatures can be over 35 °C which causes an increased slump loss and bleeding. These circumstances will thus influence both the consistency and cohesiveness. The last problem seen in China is the quality control of the concrete mixing plant. Because the components of the mix are stored outside their water content depends on the weather circumstances. This makes it more difficult to predict the quality of the mix. Furthermore, the coarse aggregate can contain a high amount of mud; this increases the consistency, but also increases the demand for water and thus decreases the consistency. If not enough water is used this will lead to a concrete in unsaturated state which will cause a blockade.

Chapter 3: Current situation in China 22
3.4 Summary The problems which can occur can be divided into four categories which are consistency-, cohesiveness-, management- and other problems. Problems purely based on consistency happen rarely. This is as expected because it is tested with the slump test. A problem which could occur is a high friction flow due to many fines. The second category is based on cohesiveness problems which happen rarely as well. A problem which can occur is water or aggregate escaping from the mix. This will result in a mix in unsaturated state or in a plug of aggregate in front of the concrete causing a high friction which can result in a blockade. The cohesiveness is only tested on request. The third category consists of the management problems. These are the problems which occur most in China and influence the consistency and the cohesiveness. Due to waiting times the concrete will start setting or bleeding which will make it more difficult to pump. The last category consists of other problems such as human error, high temperatures and a broken pipe. Many of these problems can be prevented by good preparation. The high temperature is an important problem because it increases slump loss and bleeding. This means that the consistency and cohesiveness are affected. To prevent these problems of occurring it is important to develop a method which measures the consistency and the cohesiveness. By testing these properties not only consistency- and cohesiveness problems can be prevented, but also the management- and other problems which influence these properties. Which test methods could be used will be discussed in the next chapter.

Chapter 4: Test methods 23
Chapter 4: Test methods
4.1 Introduction This chapter will start with finding a test method which can help preventing the problems which occur in China. To find a suitable test method requirements will be discussed and based on these requirements, which test methods can be useful. After a description of these tests there will be a conclusion about which test methods can be used best for assessing the pumpability of concrete. Hence, the research question which will be answered is:
3. Which test methods can best be used to assess the pumpability of concrete? a. What are the requirements for the test methods? b. Which test methods can be executed? c. Which test methods can be executed best?
4.2 Requirements for testing methods As said the pumpability can be assessed by the consistency and the cohesiveness. These properties and the factors which influence it are discussed in chapter 2. To assess the pumpability the test methods needs to measure the consistency or the cohesiveness. These test methods need to comply with requirements for in-field testing. This is important because there are several test methods available, but they cannot be used on the building site because of the requirements as discussed below. First of all the test needs to be fast, this means a result must be retrieved within 10 minutes after the test sample is taken. Besides being fast the test also needs to be reliable. High scatters in the results indicate a test which is sensitive to the circumstances. Furthermore, the test equipment needs to be of a high quality. This means that it can handle some damage, because this will happen on the building site. Besides being insensitive for damage it should also be able to handle dust and water. A computer or other electric equipment cannot be used unless it is adjusted for use on the building site. The last argument based on the quality of the equipment is that it can handle extra weight due to bad cleaning. This means that critical testing equipment cannot be used on the building site. Because the test will be performed by a worker some extra requirements are present. First of all the test needs to be simple. This has two meanings; the test is easy to handle and the calculations which need to be performed are simple, otherwise extra skills of the operator are required. Secondly, the test cannot weight over 30 kg; this is including the weight of the concrete. A test which is heavier will be difficult to transport on the building site and thus more difficult to use. Thirdly, the test has a maximum size of 0,5m x 0,5m x 0,5m. These dimensions are based on personal experience with transporting equipment. If the equipment will be larger it will be difficult to transport with all cars. Because most building sites are visited by car this is an important precondition of the test equipment.

Chapter 4: Test methods 24
The summarization of these requirements can be seen in the table below. Requirements
Measures consistency or cohesiveness
Fast Within 10 minutes
Reliable Comparable results every test
Insensitive to damage
Insensitive to dust and water Few electronics
Insensitive to extra weight Due to bad cleaning
Easy to handle Not 2 tasks at the same time
Easy calculations
Not too heavy Below 30 kg
Not too big Smaller than 0,5m x 0,5m x 0,5m Table 1: Requirements for test methods
These requirements are too strict for this research. In this assignment there will be looked for a test method which measures the consistency or the cohesiveness. Furthermore it needs to have potential for the future. This means that it needs to be possible to evolve the test into a suitable test which complies with these requirements. Determining if a test has this potential will be done by discussing which things needs to be changed to make it a good test for the future.
4.3 Tests for assessing the pumpability Several test methods are available to assess characteristics which influence the pumpability. These test methods mainly focus on the consistency and the cohesiveness. As said in paragraph 2.3.2 the slump test is a reliable test for the consistency. Furthermore, consistency problems are not the main problem in China. This explains why most attention will be paid to tests which assess the cohesiveness of the mix. Testing of the cohesiveness is mainly done by testing the segregation. Several test methods, such as the column segregation test and the settlement column, are using the gravity to get segregation. These methods will result in long testing times of approximately 20 minutes which is too long for an on-site test. A possible method for shortening this time is the use of a vibrating machine, but that will not be covered in this report. The tests which will be discussed are the slump- and the slump-flow test for the consistency. For the cohesiveness the K-slump tester, pressure bleeding test, BT RHEOM, segregation cylinder and the visual inspection of the slump test will be discussed. Most tests have the potential to develop into a useable test for assessing important pumpability characteristics. A new test method, with the use of the fresh concrete test (FCT) will be discussing in appendix B. The ideas about this test method are new and can evolve in a suitable test after several adjustments. Because this test method is not useful for this research, but can be interesting for further research, it is discussed in Appendix B.
4.3.1 Slump test
The slump test is the most well-known and widely used test method to characterize the consistency of fresh concrete. This inexpensive test is used on building sites to determine rapidly whether a concrete batch should be accepted or rejected. In most cases the slump value is seen as the workability of the concrete, this assumption is incorrect because the slump is influenced by the consistency; more explicitly by the yield stress. The result of the slump test is reliable and can explain why the problems regarding the pumpability of concrete are mostly not related to the consistency. For a good pumpability the slump value needs to be more than 50 mm. The upper limit of 150 mm is only useful when no test on the

Chapter 4: Test methods 25
cohesiveness is used because this limit is based on the sensitivity to segregation. (Koehler & Fowler, 2003), (Neville, 1997), (Pashias, Boger, Summers, & Glenister, 1996) A disadvantage of the slump test which needs to be mentioned is that it is less suitable for the more advanced types of concrete. For the more advanced types of concrete a new test method for the consistency needs to be sought. A possible method is the use of the slump-flow test. This test is used for SCC and measures the fluidity of the concrete which is also part of the consistency of the mix. What is measured is the diameter of the concrete after the cone is lifted. The diameter gives information about the fluidity and thus the consistency of the concrete.
4.3.2 Visual inspection
The information which can be retrieved from the slump-flow test can be increased by doing a visual inspection. This inspection can give information about the cohesiveness of the mix. The visual inspection can be done by comparing the concrete with the criteria as described in Table 2. A higher rating means a worse cohesiveness and thus sensitive to segregation.
Rating Criteria
0 No evidence of segregation in slump-flow patty, mixer drum, or wheelbarrow
1 No mortar halo in slump-flow patty, but some slight bleeding on surface of concrete in mixer drum and/or wheelbarrow
2 Slight mortar halo (<10 mm) in slump-flow patty and noticeable layer of mortar on surface of testing concrete in mixer drum and wheelbarrow
3 Clearly segregating by evidence of large mortar halo (>10 mm) and thick layer of mortar and/or bleed water on surface of testing concrete in mixer drum or wheelbarrow.
Table 2: Visual Stability Index rating (Khayat, Assaad, & Daczko, 2004)
What should be noted is that this information can only be used in addition to another test because visual inspection is too subjective. The result strongly depends on the experience of the operator. This means that the reliability of the test depends also on the operator. This explains that it can only be used as an addition to other test methods.
4.3.3 K-slump tester
The K-slump tester became a standard in 1997, but was already widely used before. The length of the equipment is 35 cm and the diameters is 4 cm. The holes have a diameter of 9,4 mm. The test is used by inserting the tube in the concrete until it contacts the flat plate which is a depth of 16,5 cm. What will happen is that the mortar of the concrete will flow through the holes into the tube. After 60 seconds the depth of the concrete is measured by the plunger on top of the device. This value is called the K-slump and is linear related to the slump value; this means that the K-slump tester measures the consistency of the mix. After this measurement the tube is pulled up so the mortar can flow out. After the mortar flowed out the mortar depth will be measured again. According to Koehler & Fowler (2003) the last result is considered to be the workability. The difference between the K-slump and
Figure 6: K-slump tester (Ferraris, 1999)

Chapter 4: Test methods 26
the workability is an indication of the susceptibility of a mixture to segregation. This means that the K-slump tester measures both the consistency and the cohesiveness. Based on this information the K-slump tester looks like the ideal test for pumpability measurements. A disadvantage of this test method is that it is sensitive to aggregate, the most important factor for the pumpability of concrete. The aggregate could block the holes in the tube and thus keep the concrete out of the tube. This results in a high scatter of results. Furthermore, the test can only be used on medium and high workability mixes. This is because the tube is not inserted deep into the concrete. Thereby the pressure is low and thus the force on the concrete as well. Only a small yield stress can be overcome which will only happen with medium and high workability mixes. Because of these arguments the K slump tester is not useful in its current state. If this test method is adjusted so it becomes more reliable and is useable on more types of concrete, then it can be a good measurement. (Ferraris, 1999), (Koehler & Fowler, 2003)
4.3.4 Pressure bleeding test
The pressure bleeding test (PBT), as shown in Figure 7, measures the ability to retain water. This means that the PBT measures the stability and thus the cohesiveness of the concrete and other mixtures such as coal- water paste. During the test a high pressure is put on the concrete and it is measured how much water will emit from the concrete. The pressure used is 500 psi (3,45 MPa) and the test takes 140 seconds, almost 2,5 minutes. When preparation and cleaning are included it takes approximately 10 minutes to execute the test. The volume which is emitted from the sample depends on several factors including the permeability and the grading of the concrete. When the concrete is permeable the water will flow out easily. When there is a good grading the concrete will be closely packed which will result in slower bleeding which means a better cohesiveness. In 1977 Browne and Bamforth have already combined the PBT with the slump test to predict the pumpability. A problem with their results is that it was done with plain concrete and their results are not suitable for use with concrete which is used nowadays. This means that their results need to be updated for a reliable prediction of the pumpability. Due to the different types of concrete, comparison can be difficult. An analyzing method which can be useful is the method used by Zhang (2003), which is also seen in other literature. This analyzing method uses the seeping ratio S(t), the ratio of water emitted to the total water emitted. This method makes it possible to compare different types of concrete. Further explanation of this method can be read in paragraph 5.2.3. What might be interesting is that for a coal- water paste the seeping ratio after 10 seconds, S10 ≤ 40% with a total bleeding volume of 70 – 110 mL to be pumpable. This can probably serve as a guide in finding the ratio which is suitable for concrete. (Browne & Bamforth, 1977), (Khayat, Assaad, & Daczko, 2004), (ZHANG, 2003)
Figure 7: Pressure Bleeding Test (Browne & Bamforth, 1977)

Chapter 4: Test methods 27
4.3.5 BT RHEOM
The BT RHEOM is a torsional rheometer; it measures properties of concrete by measuring the torque to turn the cylinder. The test is used by inserting concrete in the inner cylinder. Consolidating of the concrete will be done by a vibrator which is in the bottom part of the equipment. After the cylinder is filled with concrete, the top blade will start rotating to measure the torque. By measuring this torque the yield stress and plastic viscosity can be calculated within 4 minutes. This is done by software which is developed for the BT RHEOM. Preparing the test method will approximately take 20 minutes; this makes this test especially suitable for a large number of tests. As said by Koehler & Fowler (2003) the accuracy of the test method is validated in numerical and experimental ways by Hu in 1996. As can be expected this equipment will be expensive. This is why there are doubts if this equipment is useful for everyday use on the building site. Furthermore, some seals needs to be replaced frequently, which will lead to re-calibrating the test because of the different friction of the seals. Another disadvantage of the BT RHEOM is that it can only measure concretes with a slump larger than approximately 100 mm. Because a concrete with a slump value above 50 mm is pumpable, a part of the pumpable concretes cannot be measured with this equipment. Summarized it can be said that this equipment gives valuable results for the laboratory, but in the current state it is not suitable for use on the building site. With some modifications which will make the equipment less expensive, require less maintenance and measure also the harsher mixers will make this equipment useful for the building site. (Koehler & Fowler, 2003), (Larrard, et al., 1997)
4.3.6 Segregation cylinder
The segregation cylinder, as shown in Figure 9, is a test method used for lightweight aggregate concrete (LWAC). The test principle is based on measuring the density in the upper and lower part of the cylinder after heavy vibration. The difference in density is interesting because it tells how sensitive the concrete is to external forces such as the pumping pressure. The test is used in the following way. The two cylinders are placed on top of each other and hinged together. After the cylinder is filled with concrete it is vibrated for approximately two minutes at 50 Hz and an amplitude of 0,5 mm. When vibrating is finished the steel plate, as shown in the image, is inserted to separate the two parts. Two specimens will be taken from the top- and bottom layer which are used to calculate the fresh density of the concrete. When the density of the top layer is divided by the density of the bottom layer the result will be called the Segregation Index (SI). For LWAC this index is around 0,9. When this test method will be used for ‘normal’ concrete the index will probably be smaller because the coarse aggregate will settle in the bottom layer. Thereby the bottom layer will have a higher density which will result in a smaller segregation index.
Figure 8: BT RHEOM (Larrard, et al., 1997)
Figure 9: Segregation cylinder (EuroLightCon, 2000)

Chapter 4: Test methods 28
This test method looks suitable for measuring the cohesiveness of the concrete. The main problem is that it is developed for LWAC and the information available is only suitable for this concrete type. When it will be used for ‘normal’ concrete is first needs to be re-calibrated to find the correlation between the segregation index and the segregation. After this correlation is found it needs to be correlated with the pumpability of concrete. Another disadvantage of this method is that it uses a vibration table. In most situations this is not available on a building site which means that in its current state it is not suitable for use in practice. Summarizing can it be said that this test method is a valuable method. How it is in its current state is not suitable for the building site, but if it can be combined with a scale for weighing and a vibration table can be integrated, as is done with the BT RHEOM, it could be a very promising method. (EuroLightCon, 2000)
4.4 Summary The pumpability of concrete can be assessed by measuring both the consistency and the cohesiveness of the mix. As expected there is no equipment available which measures both factors and thereby it is necessary to combine test methods. These test methods should be useable on the building site or have a potential to develop into a suitable test in the future. Requirements for the test method are based on the possibility for use in the environment of the building site by one person and it must be reliable and fast. For assessing the consistency the slump test and the slump-flow test are methods which reliable, simple and commonly used. This makes these tests suitable for assessing the consistency. For the cohesiveness there is no equipment available yet which can relate the cohesiveness with the pumpability. Therefore a test method needs to be selected to measure the cohesiveness which can be related to the pumpability in a later research. The test methods which have the highest potential are the pressure bleeding test and the segregation cylinder. Other tests can be useful, but are unreliable, very expensive or need several improvements before they can be used. This explains why tests, such as the K-slump, BT RHEOM and the FCT, have a lower potential for usage on the building site. For the pressure bleeding test it can be said that it is was related to the pumpability in 1977. Disadvantage is that these results are old and retrieved on less advanced concrete. This use of the PBT explains that it is useable for testing the cohesiveness without major adjustments, but those results are not useable for the concrete which is used nowadays. The segregation cylinder can also be a useful method in measuring the cohesiveness of the concrete, but was added late in this research due to a change in the requirements. At that moment the experiments were already running and it was not useful to add this testing method. Furthermore the improvements which need to be made are more difficult than what is needed for the PBT. Usage of a vibrating table or including a vibrating table are more difficult to realize which gives the pressure bleeding test a higher potential for the future. The combination of test methods which can be used best is the combination of the slump- and slump-flow test and the pressure bleeding test. The slump- and slump-flow test can be used to measure the consistency and the pressure bleeding test for measuring the cohesiveness. Because visual inspection can be undertaken easily when the slump test is performed this can be done as well. This combination will be reported in the next chapter to give more detailed information about the quality of the test methods.

Chapter 5: Evaluation of test methods 29
Chapter 5: Evaluation of test methods
5.1 Introduction The former chapter dealt with which test methods can be used best; in this chapter these test methods will be tested. This will result in more information about the test methods to find out how reliable, suitable and usable they are for assessing the pumpability of concrete. The research question which will be answered is as follows.
4. To what degree can the ‘best tests’ be used in practice and how can they be improved?
Answering this research question will be done by viewing the results in two different ways. Firstly, what the test results tell about the test and secondly what they tell about the recipe. This chapter will be closed with some improvements of the test which are based on practical experience with the testing equipment. These improvements will mainly focus on the pressure bleeding test.
5.2 Test procedure The test procedure consists of creating recipes and executing the tests. First the creation of the concrete recipes will be discussed to be followed by how the experiments where executed.
5.2.1 Concrete recipe
The recipe which is taken as the basic recipe is a recipe from the visited building site. This recipe is for a C35/45 concrete and is used for the main column of the bridge. An important property of this concrete is that it is pumpable. For conducting the experiments several adjustments were made to this recipe. The applied changes concern the w/b-ratio, the sand ratio and the amount of super plasticizer. These components are changed because these are important properties for the concrete recipe. All the recipes can be found in appendix C. For the w/b-ratio five recipes will be executed with a step size of 0,02. They will vary from 0,311 to 0,391 and the basic recipe, with a w/b-ratio of 0,351, is in the middle. The step size and the upper- and lower limit are based on talks with people who have experience with creating concrete. The changes are made by adjusting only the water content. If the changes were made by changing the binders then the grading curve would be affected as well. By changing only the water content only one property is affected which will make it easier to analyze the results for a change in the w/b-ratio. For the sand ratio (s-ratio) three recipes will be created with a step size of 0,02. They will vary from 0,345 to 0,385 where the basic recipe has a sand ratio of 0,385. When the sand content is reduced the reduction in weight is compensated by the weight of the coarse aggregate. By doing this the grading curve will be influenced and the total weight per m3 will be equal which will make the results from these recipes better comparable. For the amount of super plasticizer (SP) also three recipes will be executed. The basic recipe uses 0,9% super plasticizer based on the weight of cement and fly ash. This amount will be reduce with two steps of 0,3 percent giving a recipe with 0,6 and 0,3 percent SP. After creating the recipes all the materials where prepared. Preparing the materials was important because they were stored outside. This means that the materials were subjected to weather circumstances which can explain why the water content of the materials could vary. By preparing the materials these problems were minimized which is important because small differences in materials can have a large effect on the fresh concrete properties.

Chapter 5: Evaluation of test methods 30
5.2.2 Experiments
How all recipes will be tested is handled in this paragraph. On certain recipes the tests were executed twice to see if the results will be comparable. This was done to verify the reliability of the pressure bleeding test. The other recipes are executed to discover a trend in the change of the cohesiveness when a certain component of the recipe is changed. For executing all the experiments the following program was executed. Before the first batch of concrete the mixer was prepared. This was done by mixing half of the first mix or by moistening it with a wet piece of cloth. Moistening the mixer was important because the size of the batch was only 10 liter which was the smallest amount which could be mixed. A good preparation of the mixer is more important while mixing small quantities because water adsorption on the mixer will have a large influence on the test results. After preparing the mixer the first batch of concrete was mixed. Immediately after this mixing, the slump and the slump-flow test were executed; this took approximately five minutes. In most cases a picture was taken of the slump-flow test so a visual inspection could be undertaken as well. After finishing the slump test the whole mix was stirred again with a spade and the prepared pressure bleeding test (PBT) was filled with concrete. It was prepared by inserting a filter in the bottom of the PBT to prevent fine particles from blocking the tap. The PBT was filled in two layers and a tamping rod was used to consolidate the concrete. When the surface of the concrete was not smooth it was made smooth so the piston could easily be placed on top of it. After closing the vessel the pressure on the concrete was increased to 500 psi (3,45 MPa), the tap opened and the time starts. Normally the test would take 140 seconds, but with the experiments the samples did not emit all its water within 140 seconds. This is possible because of the recipe which is used. The super plasticizer and the fly ash are both increasing the cohesiveness of the mix which explains why bleeding goes slowly compared to less advanced mixes. To get all valuable information the duration of the test was increases till emitting of water stops or when 300 seconds has passed.
5.2.3 Analyzing method
The results retrieved from the slump- and slump-flow test will be used as guidance on the quality of the results. These results will be watched for a certain pattern and for explaining unexpected behavior of concrete. The visual inspection of the slump test will be used for comparison with the pressure bleeding test. What will be looked at is a corona of water around the slump and the homogenous spreading of the aggregate. A corona of water around the slump expresses an ease to bleeding. A non-homogenous spreading of aggregate means there is a sense for segregation. The results will be used to explain if the pressure bleeding test showed the results which can be expected based on visual inspection.

Chapter 5: Evaluation of test methods 31
The results retrieved from the pressure bleeding test will be analyzed in the following way. The starting point for analyzing is the typical results shown in Figure 10. What should be noticed is that the pumpable line is closer to a straight line than the non-pumpable line. This means that a better cohesiveness results in a straighter line. This assumption was underlined by the test results which showed lines which did not show this ‘logarithmic shape’. The difference can be explained by the admixtures and additives which are used nowadays. These will be more effective in influencing the cohesiveness then the chemicals which were used in 1977. The method of analyzing used by Browne & Bamforth (1977) focus on the volume of water emitted. For comparison of different concrete recipes it would be better to focus on the ratio of water emitted to the total water emitted. It can be expected that a recipe which has a lower water content will bleed less and thus have a lower curve. This will make it more difficult to compare it with other results which makes it better to use a ratio. The ratio which is commonly used is the ratio of water emitted to the total volume of water emitted which was discussed in paragraph 4.3.4. Zhang (2003) is expressing this as the seeping-ratio (SR); in formula it looks as follows.
SR(t) =𝑉(𝑡)
𝑉(𝑡 ,𝑙𝑎𝑠𝑡 )∙ 100%
In this formula V stands for the volume of water emitted. The denominator volume is the total volume of water which is emitted and thus a fixed value for a test. The other volume changes over time and is the volume of water emitted at time t. For coal-water paste the seeping-ratio needs to be below 40% in combination with a slump from 80 to 240 mm to be pumpable. If these values are also applicable for concrete is unknown, but these values can be useful as a guide for assessing the pumpability of concrete. For analyzing the results the two discussed methods will be used. Furthermore these results will be evaluated at three specific points. Firstly the gradient of the graph in the first 25 seconds; during this period a difference between curves will be visible which shows the sensitivity to bleeding. A curve with a large gradient will emit the water easily showing a mixture which is sensitive to bleeding. Secondly the ‘stop time’ will be analyzed; the time that the bleeding stops. The shorter this time is the better. When bleeding stops the concrete can withstand the applied pressure and can retain the rest of the water inside the mix. This means that the cohesiveness of the mix is good because no water will be emitted anymore. The last point is the total volume of water emitted which will be used in two ways. Firstly the absolute total volume will be used. Secondly this volume will be expressed as the ratio of water emitted to water used in the mixture. This ratio is more important because it is using the available water which can be emitted as well. By using this ratio more can be said about recipes with different water contents. This is done because it can be expected that less water in the mixture will result in less bleeding. A concrete with a good cohesiveness will have a
Figure 10: Typical result of the PBT (Browne & Bamforth, 1977)

Chapter 5: Evaluation of test methods 32
low ratio, because only a small portion of the water is emitted and most is still in the mixture. This means that it is not sensitive to the pressure applied. Combining this information means that the ideal graph of the pressure bleeding test is a graph which has a small gradient in the beginning, stops fast and has a small total volume of bleeding. If this information is used for the best graph of the seeping ratio (SR) it is a graph which starts as low as possible and then increases to 100 percent in a short period of time. It will climb till 100 percent because the volume of water emitted will become equal to the total water emitted after a certain period of time.
5.3 Reliability of the test methods Here the results of the experiments will be discussed. The first thing which will be analyzed is the quality of the testing equipment. This will be done by showing some of the results and analyzing them. This will explain how reliable the testing equipment is.
5.3.1 Pressure bleeding test
The reliability of equipment can be determined by examining it with the same and with different recipes. The results of the same recipe will confirm if the PBT will give constant results, different recipes will show if it can recognize differences. Two recipes were executed twice, firstly the basic recipe end secondly the recipe with a sand ratio of 0,345. The results of these tests can be seen in Figure 11. The left graph is the absolute volume of water emitted and the right graph the ratio of water emitted to total water emitted.
Figure 11: Test results – bleeding results for equal recipes
At the time the basic recipe was executed the time limit was still 140 seconds instead of 300 seconds which was used later on. This explains why the time-axis are different, but this does not make it less useable for testing the reliability of the pressure bleeding test. What the results show is that the pressure bleeding test gives similar results with the same recipe. The bleeding graph shows that the gradient of the lines is near equal. When the seeping graph is discussed the lines are even closer, especially with the sand ratio of 0,345. Based on the literature, which are mostly analyzing the results with the seeping-graph, it can be concluded that the pressure bleeding test shows comparable results for concrete with the same recipe.

Chapter 5: Evaluation of test methods 33
For a small change in the recipe the results of the changes in w/b-ratio can be used. The recipes used have w/b-ratios of 0,351 and 0,371.
Figure 12: Test results – small change in recipe
What can be seen in these results is that the pressure bleeding test will give different results when using different recipes. The results from the PBT are in agreement with the results of visual inspection. The concrete with a w/b-ratio of 0,371 showed a corona of approximately 10 mm of water around the slump test; the w/b-ratio of 0,351 showed almost no corona of water. The photographs of this comparison are shown in appendix D. The change in cohesiveness which can be seen by visual inspection was also measured by the pressure bleeding test. Based on the results shown in this paragraph it can be concluded that the pressure bleeding test is able to distinguishing recipes. For recipes which vary from a good to a worse cohesiveness the pressure bleeding test was able to measure differences between all the recipes. This makes the pressure bleeding test a reliable test which does measure the cohesiveness with equal recipes and with small- and big changes in the recipe.
5.3.2 Slump test & Slump-flow test
The reliability of the slump test is discussed in several articles. As said in paragraph 2.3.2, the slump test is a useful, reliable and simple test method for assessing the consistency. Furthermore it is said that for more advanced concretes the slump-flow test could be useful, because the slump test has difficulties with these types of concrete. It was discovered that this was a good idea because it seemed that the slump test has reached an ‘upper border’ during the experiments; this is shown in Table 3. These results are the results of a change in the w/b-ratio. B1 has a w/b-ratio of 0,311 which is increasing with steps of 0,02 till w/b-ratio of 0,371 which is recipe B3. What is shown in this table is the slump value which reaches the ‘upper border’ of approximately 22 cm, while the slump-flow keeps increasing. This gives the assumption that the mixes which have a high fluidity were too fluid for measurement with the slump test.
Recipe B1 B2 B B3
Slump (cm) 3 12 22 21
Slump-flow (cm) - 22 51 57
Table 3: Changes in slump and slump-flow due to changed w/b ratio
For the reliability of the results there will always be looked at both the slump and the slump-flow results. This will give guidance on the reliability and the quality of the results.

Chapter 5: Evaluation of test methods 34
5.4 Recipes influencing the cohesiveness
5.4.1 Influence of water binder ratio
The recipes with a change in w/b-ratio are shown below. The changes which were made in the w/b-ratio are based on experience of several people. What is changed is only the water content because otherwise the grading curve would be affected as well. This makes it easier to analyze the results because now only one factor can influence the results and otherwise two factors. The amount of super plasticizer is computed based on the weight of the binders, thus the weight of cement and fly ash.
The results are shown in Figure 13 with the bleeding graph and the seeping ratio. The result which is surprising is the seeping-ratio of B4. This graph was expected to be the lowest graph with the seeping ratio, but due to a smaller total amount of water emitted it shifted upwards.
Figure 13: Test results – Bleeding results due to changed water binder ratio
This smaller volume of bleeding can be explained by the fact that this mix was the first mix of the day. This means that it is possible that the mixer had adsorbed some water. Because the amount of concrete which is produced, only 10 L, is small, some adsorption of water would influence the results noticeable. If this assumption of water adsorption is compared with the results of the slump- and slump-flow test this assumption is confirmed.
Recipe B1 B2 B B3 B4
Slump (cm) 3 12 22 21 20
Slump-flow (cm) - 22 51 57 49
Table 4: Test results – Slump results due to changed water binder ratio
The slump value stops at 22cm. As said in paragraph 5.3.2 this can be explained by the ‘upper border’ of the slump test. This means that the slump value is not suitable for this comparison, but the slump-flow is. The slump-flow is increasing with every recipe, but when it reaches B4 (w/b-ratio = 0,391) it suddenly decreases. Based on these unexpected results
Water (kg)
Cement (kg)
w/b Sand (kg)
CA (kg)
s ratio FA (kg)
SP (kg)
SP (%)
B1 126,0 265,0 0,311 722,0 1153,0 0,385 140,0 3,645 0,9
B2 134,1 265,0 0,331 722,0 1153,0 0,385 140,0 3,645 0,9
B 142,0 265,0 0,351 722,0 1153,0 0,385 140,0 3,645 0,9
B3 150,3 265,0 0,371 722,0 1153,0 0,385 140,0 3,645 0,9
B4 158,4 265,0 0,391 722,0 1153,0 0,385 140,0 3,645 0,9

Chapter 5: Evaluation of test methods 35
for both the consistency and cohesiveness, in combination with the first mix of the day, makes B4 an outlier. Therefore this result will not be used for further analyses. The results will be analyzed at three points which are (1) the gradient in the beginning, (2) the ‘stop time’ and (3) the total volume of water which is emitted. What can be seen in the bleeding graph is an increasing gradient when the w/b-ratio increases. This can also be seen in the seeping graph which shows an increased gradient when the w/b-ratio decreases. This means that the mix is becoming more sensitive to bleeding which is as expected. Due to more water in the mix the distance between the solids will become bigger and thus the cohesiveness is decreased. For the ‘stop time’ a comparable trend can be found. The ‘stop time’ of the mix becomes longer when the w/b-ratio increases. This can best be noticed in the graph of the seeping ratio. As expected the total volume of water emitted is also influenced by bleeding. The total volume increases when the w/b-ratio is increasing. This was as expected, but the ratio of total water emitted to total water used is increasing faster than the w/b-ratio is increasing as can be seen in Table 5. When the w/b-ratio is multiplied by 1,2 the ratio can be multiplied by 4,6. This is comparable to the results shown by Powers (1939) with a normal bleeding test where 7% more water than necessary increases bleeding with 30%. This means that the volume is not only increasing due to more water which is available, but also due to a decreased cohesiveness.
Recipe B1 B2 B B3
w/b ratio 0,311 0,331 0,351 0,371
Ratio of water emitted 0,64% 1,64% 1,83% 2,93% Table 5: Test results – Changed water binder ratio compared to ratio of water emitted
Based on these results it can be concluded that both the consistency and the cohesiveness of the concrete are influenced by the w/b-ratio. With a low w/b ratio the slump decreases dramatically and with a high ratio the slump value becomes constant. There must be said that the slump-flow will keep increasing which explains that the consistency of the concrete is increasing. The cohesiveness is affected in several ways. A higher w/b-ratio will result in an increased speed of bleeding, longer bleeding and a bigger volume. Furthermore the ratio of volume emitted to volume used is increasing faster than the total water used.
5.4.2 Influence of sand ratio
The changes which were made to the sand ratio are shown in the table below. These changes will affect the whole gradient curve, because the reduction in sand content is compensated by an identical increase in the amount of coarse aggregate.
Water (kg)
Cement (kg)
w/b Sand (kg)
CA (kg)
s ratio FA (kg)
SP (kg)
SP (%)
B 142,0 265,0 0,351 722,0 1153,0 0,385 140,0 3,645 0,9
S1 142,0 265,0 0,351 684,0 1191,0 0,365 140,0 3,645 0,9
S2 142,0 265,0 0,351 647,0 1228,0 0,345 140,0 3,645 0,9
The results are shown in Figure 14 with the bleeding and the seeping ratio. What is surprising in the bleeding graph is that the curve S1 is higher than both the S2- and B-curve. This is probably due to an optimum sand ratio.

Chapter 5: Evaluation of test methods 36
Figure 14: Test results – Bleeding due to changed sand ratio
What can be seen in the bleeding graph is that the B-curve, with a sand ratio of 0,385, shows a lower gradient than both S1 and S2. This means that recipe B shows a lower sensitivity to bleeding which can be explained by the optimum sand ratio. In paragraph 2.3.2 there was already mentioned that there is an optimum sand ratio which results in a continuous and smooth grading curve. This grading curve results in a properly packed concrete which shows a good cohesiveness. Based on these three recipes the basic recipe has the optimum sand ratio and therefore shows a better cohesiveness and thus a lower bleeding gradient. The two other recipes will show a more erratic grading curve which therefore has a worse cohesiveness. This is also shown by the ‘stop time’. The recipe with the optimum sand ratio shows the shortest bleeding time which can easiest be seen in the seeping graph. The basic recipe stops bleeding after 180 seconds while the two other recipes continue bleeding for over more than 80 seconds. This means that a better cohesiveness also becomes visual in the end time of the bleeding process. Based on the total volume which is emitted the same can be concluded. The graph with the optimum sand ratio will show the lowest volume. It comes forward that this is the B-curve. This recipe shows properly packed concrete which results in small distances between all the materials and therefore a good cohesion. When considering the ratio of bleeding in Table 6 it can be seen that there is a big difference between B and S1 and S2. This can be explained by the optimum sand ratio which shows the best cohesiveness.
Recipe B S1 S2
sand ratio 0,385 0,365 0,345
Ratio of water emitted 1,83% 4,23% 4,09% Table 6: Test results – Changed sand ratio compared to ratio of water emitted
Based on these results it can be concluded that for these three recipes a sand ratio of 0,385 is the best sand ratio. This best sand ratio results in concrete which is best packed and therefore shows the best cohesiveness. That the sand ratio does not only affect the cohesiveness, but also the consistency is affected can be seen in Table 7. The slump test does not show large differences, but the slump-flow is slightly increasing when the sand ratio is reduced. This increase of the consistency will cause a higher friction flow during the pumping process which can make it more difficult to pump.
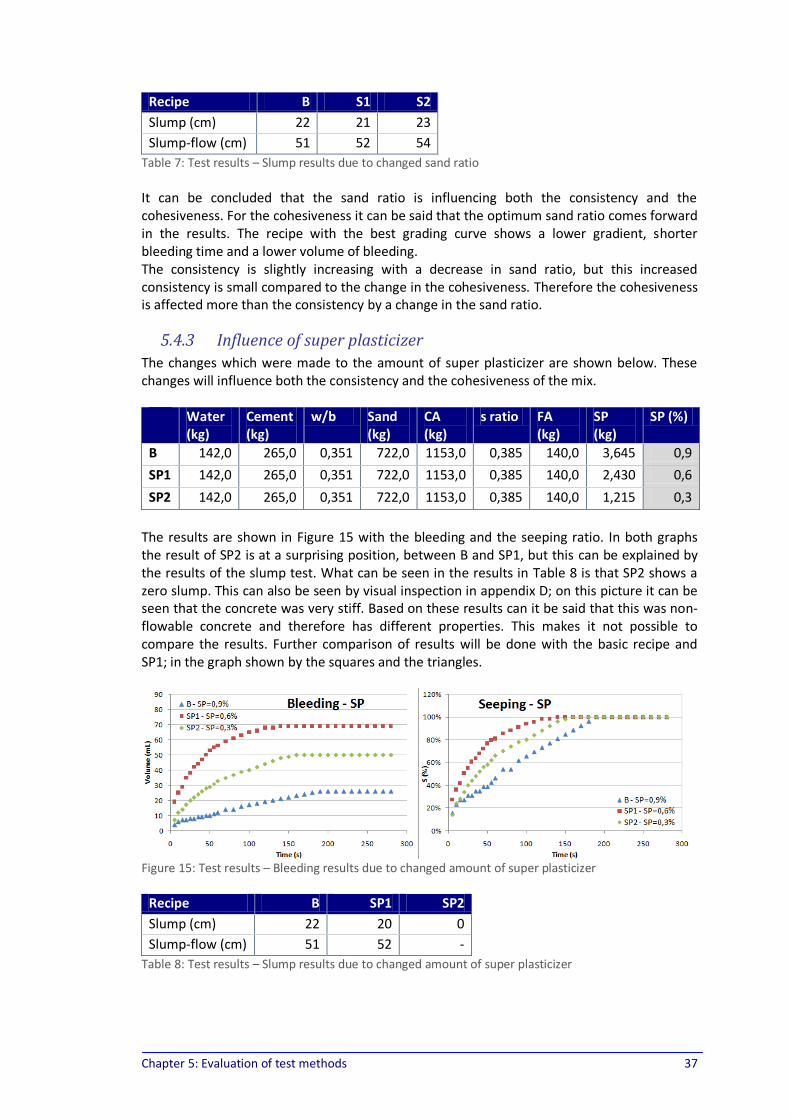
Chapter 5: Evaluation of test methods 37
Recipe B S1 S2
Slump (cm) 22 21 23
Slump-flow (cm) 51 52 54
Table 7: Test results – Slump results due to changed sand ratio
It can be concluded that the sand ratio is influencing both the consistency and the cohesiveness. For the cohesiveness it can be said that the optimum sand ratio comes forward in the results. The recipe with the best grading curve shows a lower gradient, shorter bleeding time and a lower volume of bleeding. The consistency is slightly increasing with a decrease in sand ratio, but this increased consistency is small compared to the change in the cohesiveness. Therefore the cohesiveness is affected more than the consistency by a change in the sand ratio.
5.4.3 Influence of super plasticizer
The changes which were made to the amount of super plasticizer are shown below. These changes will influence both the consistency and the cohesiveness of the mix.
Water (kg)
Cement (kg)
w/b Sand (kg)
CA (kg)
s ratio FA (kg)
SP (kg)
SP (%)
B 142,0 265,0 0,351 722,0 1153,0 0,385 140,0 3,645 0,9
SP1 142,0 265,0 0,351 722,0 1153,0 0,385 140,0 2,430 0,6
SP2 142,0 265,0 0,351 722,0 1153,0 0,385 140,0 1,215 0,3
The results are shown in Figure 15 with the bleeding and the seeping ratio. In both graphs the result of SP2 is at a surprising position, between B and SP1, but this can be explained by the results of the slump test. What can be seen in the results in Table 8 is that SP2 shows a zero slump. This can also be seen by visual inspection in appendix D; on this picture it can be seen that the concrete was very stiff. Based on these results can it be said that this was non-flowable concrete and therefore has different properties. This makes it not possible to compare the results. Further comparison of results will be done with the basic recipe and SP1; in the graph shown by the squares and the triangles.
Figure 15: Test results – Bleeding results due to changed amount of super plasticizer
Recipe B SP1 SP2
Slump (cm) 22 20 0
Slump-flow (cm) 51 52 -
Table 8: Test results – Slump results due to changed amount of super plasticizer

Chapter 5: Evaluation of test methods 38
The results are different from the other changes in the recipe. The other results all showed curves which were comparable with a straight line, a change in super plasticizer will show a more logarithmic curve. The meaning of a logarithmic curve is that the mix is emitting water fast in the beginning and after a while it runs out of water. This can be explained by the effect of super plasticizer. Super plasticizer will change the chemical structure of the mixing water, but the other recipes only changed the amount of water or the grading curve. Therefore a change in super plasticizer will show different behavior of the mixing water and thus different results from non-chemical changes. For a more detailed analysis of the curve the beginning of the curve is analyzed. The gradient of the bleeding graph in the first 25 seconds is different, a high amount of SP will decrease the gradient and thus make it less sensitive to emitting water. When attention is paid to the ‘stop time’ of the graphs something happens which is the opposite of the other results. A higher amount of SP will result in a longer time of emitting water. This can be explained by super plasticizer changing the chemical structure of the water. Therefore it is a change based on chemicals instead of properties of the recipe. The last part of the graph is the total volume of water emitted. A high amount of SP results in a lower volume of water emitted. This is as expected because SP will increase the cohesiveness. When the same volume of water is used this means that there is more SP to retain the water and thus decrease the total volume which can be emitted. This is also shown in the ratios of water emitted, which doubles if the amount is reduced from 0,9 to 0,6 percent.
Recipe B SP1
Amount of SP 0,9% 0,6%
Ratio of water emitted 1,83% 4,86% Table 9: Test results – Changed amount of SP compared to ratio of water emitted
Based on the results of B and SP1 it can be concluded that both the consistency and the cohesiveness are affected by a change in the amount of super plasticizer. The consistency will be slightly reduced as can be seen in the slump test results. The cohesiveness will be affected in several ways. A higher amount of SP will result in a lower gradient during the first seconds, the stop time increases and the total volume decreases. This shows that chemicals such as super plasticizer are influencing the cohesiveness in a different way than the ‘natural’ changes do, but it does not mean that more super plasticizer is better, because there is an optimum dosage for super plasticizer.
5.5 Improvements of the test methods The slump- and slump-flow test are methods which are reliable and easy to perform. Therefore it is not necessary to spend effort in improving the usability of these test methods. But if this usability is compared with the pressure bleeding test it will be noticed that the PBT is more difficult to handle. During the experiments three people where needed to execute the experiment. One to increase the pressure and keeping it stable, one for opening the tap and keeping the measurement cylinder in the right place to collect the water and the last one is watching the time and writing the results. With some improvements the number of operators could be reduced to one or two. An easy improvement is the shape of the tap. In the current design it is pointed forward. Especially during the first seconds of the test the water flows out fast. If it is not collected it squirts several meters far. This means that the measurement cylinder must be kept in front of the tap. By pointing the tap downwards no movement of the cylinder is necessary the

Chapter 5: Evaluation of test methods 39
collect the water. The only thing which must be thought of is a cover on top of the measurement cylinder to prevent the water from flowing out on that side. An improvement more difficult to implement is a compressor which can keep the pressure stable. The pressure drops slowly so even a smaller compressor should be able to handle this. If the compressor and the new tap are implemented the machine can be operated by one person who first increases the pressure by hand, after that turns on the compressor and starts the measurement. To improve the test even further it would be good to include a scale within the PBT. This scale should measure the difference in weight of the cylinder and thus the weight of the water emitted. By doing this the measurement cylinder does not have to be used anymore and a chance for a measurement error will be reduced. Besides decreasing the measurement error will it also make the improvement of the tap not necessary. After these improvements the pressure bleeding test will be a test which is easier to operate and have a higher reliability and thus will have a better future perspective. When the pressure bleeding test is combined with the slump- and slump-flow test this can result in a good test method for assessing the pumpability.
5.6 Summary In this chapter the reliability of the test methods is discussed. For measurement of the consistency the slump- and slump-flow test are reliable test methods. For the more advanced types of concrete it is good to execute the slump-flow because this method is capable of measuring the more fluid concretes as well. For measurement of the cohesiveness the pressure bleeding test is examined. Based on the results it can be concluded that the PBT is able to make a distinction between different recipes. This means that the PBT can recognize recipes which can be useful to know if different batches are having an equal quality. Furthermore is can measure differences in cohesiveness which are caused by changes in the recipe. If these changes concern changes of the w/b-ratio, a higher w/b-ratio will result in an increased speed of bleeding, longer bleeding and a larger bleeding volume. Furthermore the ratio of volume emitted to volume used is increasing faster than the total water used. This means that a higher w/b-ratio will reduce the cohesiveness of the mix. Based on the slump- and slump-flow test it can be said that the consistency is becoming more flowable when the w/b-ratio increases. Changes in the sand ratio will influence both the consistency and cohesiveness. For the cohesiveness it can be said that the optimum sand ratio comes forward in the results. The recipe with the best grading curve shows a lower gradient, shorter bleeding time and a lower volume of bleeding. The consistency is influenced slightly. It will increase with a decrease in sand ratio, but this increased consistency is small compared to the change in the cohesiveness. Therefore the cohesiveness is affected more than the consistency by a change in the sand ratio. Changes in the amount of super plasticizer will influence both the consistency and cohesiveness. The cohesiveness will be affected in several ways; a higher amount of SP will result in a smaller gradient during the first seconds, the stop time increases and the total volume decreases. This means that an increase of super plasticizer increases the cohesiveness of the mix. The consistency of the mix will become more fluid as well when the amount of super plasticizer is increased. What has to be noted with changes in the amount of super plasticizer is that one recipe cannot be explained and the two other recipes showed an equal seeping ratio during the first 15 seconds. Because these two tests were comparable, it looks like there is a certain relation. Further experiments should make clear if the seeping ratio is also equal with other amount of super plasticizer or that it is only for these recipes.

Chapter 5: Evaluation of test methods 40
Based on this information the slump- and slump-flow and the pressure bleeding test can be seen as reliable test methods for assessing the pumpability. Improvements on the pressure bleeding test can be made by changing the shape of the tap, combining it with a small compressor and incorporating a scale. The other test methods do not have to be improved because their simplicity is their strength.
Conclusion & Recommendations 41
Conclusion & Recommendations
Conclusion During the pumping process the concrete flow consists of two parts; a center plug and a lubricating layer. The center plug consists of aggregate, sand, cement, filler and water and has a constant velocity profile. The lubricating layer has a thickness of 1 to 2,5 mm and consists of water, cement, filler and other fine sand particles. In this layer there is a difference in flow speed and thus several forces are acting within this layer. This flow behavior is only correct in a steady flow. Bends and narrowing’s will result in a more turbulent flow and thus a higher chance on blockades. The pumpability of concrete can be described by the consistency and cohesiveness. They are respectively the ability to flow and the resistance to segregation and bleeding. Influencing these factors can mainly be done by changing the grading curve, cement content, water content and the additives and admixtures. Next, with this information the problems in China are categorized. The main problems are not only based on consistency- or cohesiveness problems, but also on management problems. These problems will cause delays which will influence the consistency and cohesiveness. This means that by measurement of the consistency and cohesiveness on the building site also most management problems can be prevented. Nowadays only the slump test is executed and the normal bleeding test on request. The problems which cannot be tested are the ‘other problems’; problems which are mostly based on bad preparation, for example pipes which are badly connected or have an increased wear. For preventing the problems which are met a combination of a consistency- and cohesiveness test must be sought. These tests must be reliable, useable on the building site and useable by one person. In the current state most tests are not useable, but future perspective is also important. Test methods which have the highest future perspective are the slump- and slump-flow test for the consistency and the pressure bleeding test for the cohesiveness. This was also proven in practice. During testing the tests showed to be reliable. Equal and different recipes were executed and successfully measured by the testing methods. This means that the pressure bleeding test can also be used to determine if two batches of concrete are equal. Furthermore it can measure differences in cohesiveness which are caused by changes in the recipe. The changes which were applied are changes in the w/b-ratio, sand ratio and the amount of super plasticizer. What should be noted is that for the changes in the w/b-ratio the ratio of water emitted to total water used is increasing faster than the increase of the w/b-ratio. This means that a higher w/b-ratio will reduce the cohesiveness of the mix faster than the water content is increasing. For a change in the sand ratio the optimum recipe shows the best cohesiveness. This is shown by slower bleeding, shorter bleeding time and a lower volume. The consistency is only slightly affected. Changes in super plasticizer will show different results then non-chemical changes. An increase of the amount of super plasticizer will increase the consistency and cohesiveness. Improvements on the pressure bleeding test can be made by changing the shape of the tap, combining it with a small compressor and incorporate a scale. The other test methods do not have to be improved because their simplicity is their strength.

Conclusion & Recommendations 42
Recommendations It is shown that the pressure bleeding test is capable of measuring the cohesiveness of the mix. Combining this with the slump- and slump-flow test can be useful for assessing the pumpability of concrete. Before these test methods reach this stage more research need to be performed. The pressure bleeding test can be improved in a practical way by using the suggested improvements. For an extension of the usability the PBT can be improved firstly by some more laboratory experiments. These experiments should be about the sand ratio to find out if the optimum ratio can be found by usage of the pressure bleeding test. Furthermore would it be good to research the influence of additives such as fly ash because this could not be captured in this research. When the correlation between recipe and water emitted is clear it is time for practical testing. This needs to be done with a concrete pump to establish the correlation between the test results and the pumpability of concrete. With these experiments not only the pressure bleeding test can be improved but also the combination of pressure bleeding test and the slump- and slump-flow test. This research will cost some more time, but finally this can result in a testing method to assess the pumpability of fresh concrete. Therefore it can contribute to prior quality management.

References 43
References
ACI Committee 304. (1996, January). Placing Concrete by Pumping Methods. Retrieved September 26, 2007, from ACI - American Concrete Institute: www.concrete.org
Anderson, W. G. (1977). Analyzing Concrete Mixtures for Pumpability. ACI Journal 74-42 , 447-451.
Browne, R. D., & Bamforth, P. B. (1977). Tests to Establish Concrete Pumpability. ACI Journal, 74-19 , 193-203.
EuroLightCon. (2000). Stability and pumpability of lightweight aggregate concrete test methods.
Ferraris, C. F. (1999). Measurement of the Rheological Properties of High Performance Concrete: State of the Art Report. Journal of Research of the National Institute of Standards and Technology , 461-478.
Kaplan, D., Larrard, F. d., & Sedran, T. (2005). Avoidance of Blockages in Concrete Pumping Process. ACI Materials Journal, 102-M21 , 183-191.
Khayat, K. H., Assaad, J., & Daczko, J. (2004, March-April). Comparison of Field-Oriented Test Methods to Assess Dynamic Stability of SCC. ACI Materials Journal , 168-176.
Koehler, E. P., & Fowler, D. W. (2003, August). Summary of Concrete Workability Test Methods. Retrieved August 22, 2007, from ICAR - International Center for Aggregates Research: http://www.icar.utexas.edu/publications/105/105_1.pdf
Larrard, F. d., Hu, C., Sedran, T., Szitkar, J. C., Joly, M., Claux, F., et al. (1997). A New Rheometer for Soft-to-Fluid Fresh Concrete. ACI Materials Journal , 234-243.
Mehta, P. K., & Monteiro, P. J. (2006). Concrete - Microstructures, Properties and Materials. New York: McGraw-Hill.
Neville, A. (1997). Properties of Concrete. New York: John Wiley & Sons, Inc.
Pashias, N., Boger, D. V., Summers, J., & Glenister, D. J. (1996). A fifty cent rheometer for yield stress measurement. Journal of Rheology , 1179-1189.
Powers, T. C., & Dahl, L. A. (1939). The bleeding of portland cement paste, mortar and concrete treated as a special case of sedimentation. Chicago: Portland Cement Association. Bulletin 2.
ZHANG, M. y. (2003). Coal-water paste water-seeping properties under pressure and its pumpability. Journal of Engineering for Thermal Energy & Power , 78-81 (Chinese version).
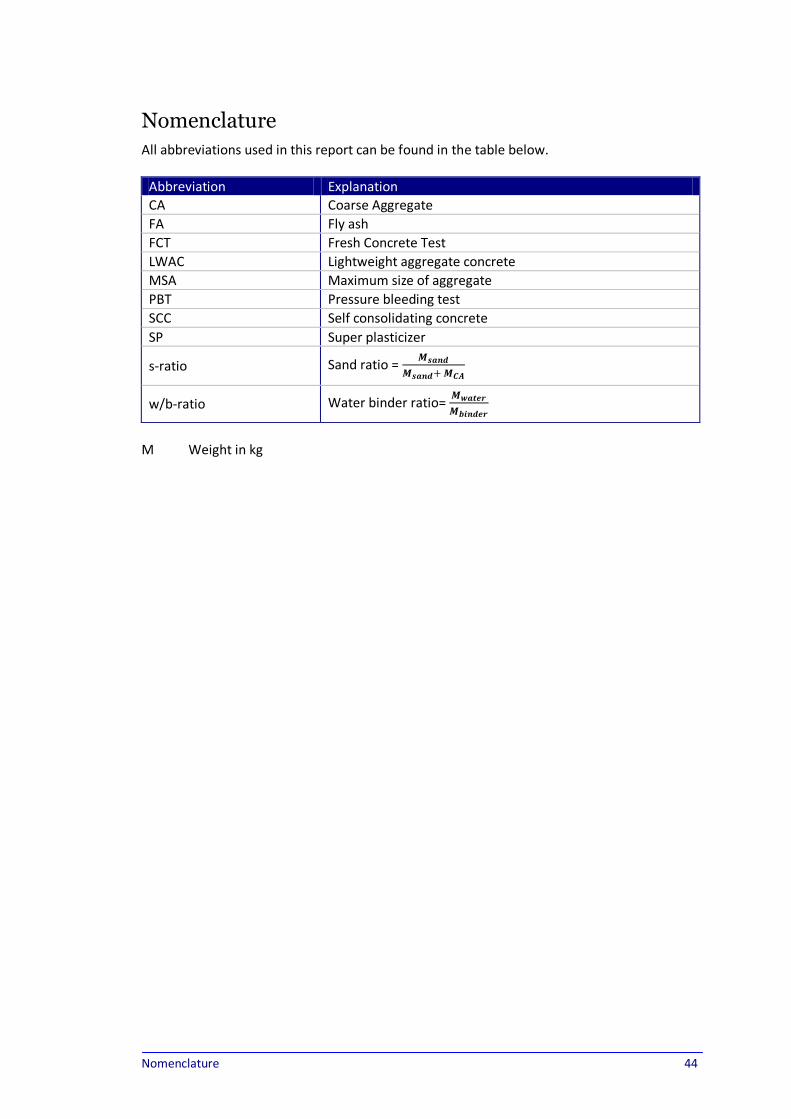
Nomenclature 44
Nomenclature
All abbreviations used in this report can be found in the table below.
Abbreviation Explanation
CA Coarse Aggregate
FA Fly ash
FCT Fresh Concrete Test
LWAC Lightweight aggregate concrete
MSA Maximum size of aggregate
PBT Pressure bleeding test
SCC Self consolidating concrete
SP Super plasticizer
s-ratio Sand ratio = 𝑴𝒔𝒂𝒏𝒅
𝑴𝒔𝒂𝒏𝒅+ 𝑴𝑪𝑨
w/b-ratio Water binder ratio= 𝑴𝒘𝒂𝒕𝒆𝒓
𝑴𝒃𝒊𝒏𝒅𝒆𝒓
M Weight in kg

Appendix A: Comparison China and The Netherlands 45
Appendix A: Comparison China and The Netherlands
A.1 Introduction The situation between China and The Netherlands differs at certain points. These differences will be discussed in the following paragraph. This will give both countries the opportunity to learn from each other by exchanging experience. But, it must be said that the differences are quite small.
A.2 Comparison The differences between China and The Netherlands are not as big as expected. Focusing on the test methods it appears that the same tests are carried out. The tests in The Netherlands are mainly carried out in the concrete factory and in special situations on the building site. The tests which are executed are test which determine the slump, w/c-ratio, compressive strength and air content. The information from these tests are compared with the recipe of the concrete. The same tests are carried out in China. The only difference in China is that they use newer equipment, but this can also be explained because the equipment came from Wuhan University of Technology instead of a concrete factory. When the whole concrete process is reviewed there is a difference in the way the concrete factories operate. In China most components are stored outside, vulnerable for weather circumstances; in The Netherlands all the components are stored inside. The difference between these storage methods is that the quality of the components in The Netherlands can be better controlled. Another difference is the shape of the aggregate, The Netherlands uses rounded aggregate and China in most situations angular aggregate. Besides these differences related to concrete there are also some other differences which influence the pumping process. Firstly the weather circumstances; the weather circumstances in China are different from The Netherlands, in the summer the temperatures can rise till 35 °C. As said before these temperatures influence the bleeding and slump loss in a negative way. It is a challenge to invent a method to control the quality of the concrete even though there are high temperatures which will influence the properties of concrete. Secondly the size of the building projects is different. The building projects in China are much bigger than what is happening in The Netherlands. This can be explained by China as a fast developing and a bigger country. A difference related to the size of the building project is management problems. In The Netherlands management is an important issue which explains why more attention is paid to management. The explanation for the smaller management problems in The Netherlands can be found in both smaller building project and the management aspect which is an important issue in The Netherlands. Other differences on the building site were experienced as well, but these do not influence the quality of concrete. These differences are based in different safety regulations in these countries.

Appendix B: Fresh Concrete Test 46
Appendix B: Fresh Concrete Test
The fresh concrete test (FCT) as shown in Figure 16 is normally used for assessing the consistency of the mix. It works by measuring the torque which is needed to rotate the tip which is inserted in the concrete. This test will take several minutes to estimate the consistency of the mix. The idea for usage of this test is not to use it in the normal way, but to change this method. Normally the tip is inserted at a depth of 80 mm to measure the consistency. Probably this test will measure a difference in torque when this measurement is performed at different depths. Maybe this change in results can be related to the segregation and thus the cohesiveness of the mix. During exploring this idea the problem which came forward was the size of the bucket which was needed for this measurement. The width of the bucket need would result in approximately 30 cm. This can be explained by the size of the tip and the space needed between the tip and the wall of the bucket. From the side of the spheres to the wall of the bucket a distance of three times the MSA needs to be present. Otherwise the wall of the bucket would influence the force which is needed for rotation. The needed distance is set at three times the MSA because this is also the diameter necessary to prevent particle interlock during the pumping process. When using a MSA of 30 mm this results in a distance of 90 mm on both sides of the spheres. Combining this with the size of the tip, results in a diameter of approximately 30 cm. For measurement at different depths the depth needs to be at least 30 cm, but preferably more so it can be measured in more than two layers. With this depth the measurement can take place at a depth of 10 and 20 cm of the bucket. With these sizes the volume of concrete which is needed is 21 liter resulting in a weight of approximately 50 kg. The usage and the weight of concrete are high which makes this test in the current state less interesting. If this testing method can be further developed resulting in a lower weight this testing method can have a high potential due to its simplicity. But, before further development takes place their first needs to done research if the fresh concrete test will measure different torques at different depths which have a trend. If a trend is shown further development of this test method can be interesting.
Figure 16: Fresh Concrete Test

Appendix C: Concrete recipes 47
Appendix C: Concrete recipes
C.1 Changes in water binder ratio The first changes which are made are changes in the w/b-ratio. The recipes with the adjustments can be seen in the table below, Table 10. What should be noticed is that the binder materials are kept equal and only the water content is changed. This is done because this will only influence the w/b-ratio, otherwise the grading curve would be influenced as well. This would make analyzing the results more difficult which explains why these changes are preferred. All weights in the recipe are expressed as kg/m3 and fly ash is expressed as FA. The amount of super plasticizer is shown in both the weight and the percentage. The recipe from the building site is the basic recipe which has the name ‘B’. This C35/45 concrete is proven to be pumpable because it was pumped on the building site.
Water (kg)
Cement (kg)
w/b Sand (kg)
CA (kg)
s ratio s/ca FA (kg)
SP (kg)
SP (%)
B1 126,0 265,0 0,311 722,0 1153,0 0,385 0,626 140,0 3,645 0,9
B2 134,1 265,0 0,331 722,0 1153,0 0,385 0,626 140,0 3,645 0,9
B 142,0 265,0 0,351 722,0 1153,0 0,385 0,626 140,0 3,645 0,9
B3 150,3 265,0 0,371 722,0 1153,0 0,385 0,626 140,0 3,645 0,9
B4 158,4 265,0 0,391 722,0 1153,0 0,385 0,626 140,0 3,645 0,9
Table 10: Concrete recipes – changes in water binder ratio
C.2 Changes in sand ratio For the sand ratio (s-ratio) three recipes will be executed with a step size of 0,02. They will vary from 0,345 to 0,385 where the basic recipe has a sand ratio of 0,385. These recipes can be seen in the table below, Table 11. When the sand content is reduced the reduction in weight is compensated by the weight of the coarse aggregate. By doing this the grading curve will be influenced and the total weight per m3 will be equal which will make the results from these recipes better comparable.
Water (kg)
Cement (kg)
w/b Sand (kg)
CA (kg)
s ratio s/ca FA (kg)
SP (kg)
SP (%)
B 142,0 265,0 0,351 722,0 1153,0 0,385 0,626 140,0 3,645 0,9
S1 142,0 265,0 0,351 684,0 1191,0 0,365 0,574 140,0 3,645 0,9
S2 142,0 265,0 0,351 647,0 1228,0 0,345 0,527 140,0 3,645 0,9 Table 11: Concrete recipes – changes in sand ratio
C.3 Changes in amount of super plasticizer For the amount of super plasticizer three recipes will be executed. The basic recipe uses 0,9% super plasticizer. This amount will be reduced with two steps of 0,3% giving a recipe with 0,6 and 0,3 percent super plasticizer. These recipes can be seen in the table below, Table 12.
Water (kg)
Cement (kg)
w/b Sand (kg)
CA (kg)
s ratio s/ca FA (kg)
SP (kg)
SP (%)
B 142,0 265,0 0,351 722,0 1153,0 0,385 0,626 140,0 3,645 0,9
SP1 142,0 265,0 0,351 722,0 1153,0 0,385 0,626 140,0 2,430 0,6
SP2 142,0 265,0 0,351 722,0 1153,0 0,385 0,626 140,0 1,215 0,3
Table 12: Concrete recipes – changes in amount of super plasticizer

Appendix D: Visual inspection of the slump test 48
Appendix D: Visual inspection of the slump test
D.1 Water binder ratio of 0,371
D.2 Water binder ratio of 0,351

Appendix D: Visual inspection of the slump test 49
D.3 Super plasticizer of 0,3%