Embed Size (px)
Citation preview
Working Papers in Economics Department of Economics, Rensselaer Polytechnic Institute, 110 8th Street, Troy, NY, 12180-3590, USA. Tel: +1-518-276-6387; Fax: +1-518-276-2235; URL: http://www.rpi.edu/dept/economics/; E-Mail: [email protected]
Assessing the Returns to Collaborative Research: Firm-Level Evidence from Italy Guiseppe Medda University of Cagliari Claudio Piga University of Nottingham Donald S. Siegel Rensselaer Polytechnic Institute
Number 0416
June 2004
______________________________________________________________________________
For more information and to browse and download further Rensselaer Working Papers in
Economics, please visit: http://www.rpi.edu/dept/economics/www/workingpapers/
1
Assessing the Returns to Collaborative Research: Firm-Level Evidence from Italy
Giuseppe Medda University of Cagliari
Viale Fra’ Ignazio, Cagliari, 09100 Italy
Claudio Piga Nottingham University Business School Wollaton Road, Nottingham NG8 1BB
United Kingdom Tel: (44) 115-9515484 Fax: (44) 115-8466667
Donald S. Siegel* Department of Economics
Rensselaer Polytechnic Institute 3502 Russell Sage
110 8th Street Troy, NY 12180-3590
United States Tel: (518) 276-2049 Fax: (518) 276-2235
June 2004
*contact author
2
Assessing the Returns to Collaborative Research: Firm-Level Evidence from Italy
Abstract
We use firm-level data from Italian manufacturing firms to assess the relationship between various types of R&D and total factor productivity growth, including collaborative research with other firms and universities. A novel twist to our empirical analysis is that we estimate a treatment effects model, which enables us to treat the decision to conduct R&D as endogenous. We find strong evidence of positive returns to collaborative research with companies, while collaborative research with universities does not appear to enhance productivity. This result implies that firms may conduct R&D with universities when appropriability conditions are weak and the outcomes of such research projects do not yield direct strategic benefits.
Key Words: R&D, Collaborative Research, Total Factor Productivity, Sample Selection Bias JEL Classification: C21, C80, D24, O30.
3
I. INTRODUCTION Technological progress is a central focus of the burgeoning literature on endogenous or
“new” growth. Romer (1986, 1990), Grossman and Helpman (1991), and Aghion and Howitt
(1998) have developed highly stylized theoretical models in which economic agents intentionally
create new products or processes. These models are an extension of the “old” growth theoretical
and empirical literature on the relationship between R&D and productivity growth, pioneered by
Zvi Griliches and his disciples (Griliches (1998))1 The empirical literature on the link between productivity and R&D is vast. There have
been numerous studies at the plant, firm, industry, and national levels. As reported in Link and
Siegel (2003), much of the firm-level evidence suggests that there are positive returns to R&D.
It is important to note, however, that most of these studies do attempt to directly measure the
impact of external, collaborative research on firm productivity. Catherine Morrison Paul (2002)
has argued that limitations of existing cost or production function models have precluded the
consideration of such spillover effects, which might arise from temporal, spatial and sectoral
linkages. She asserts that this is unfortunate, since these linkages could have a substantial impact
on economic performance.2 Although it has been widely recognized that spillovers arise when
firms are engaged in research activities with external partners (see, e.g., Cassiman and
Veugelers, 2002), there is little direct empirical evidence on this phenomenon.
This article uses firm level data from two detailed surveys (conducted in 1995 and 1998)
of Italian manufacturing firms to examine the relationship between R&D and productivity
growth. More precisely, we use the R&D Capital Stock model developed by Griliches (1979) to
assess the contributions of various types of R&D (product, process, internal, external in
collaboration with universities, research centers and other firms) to total factor productivity
(TFP).
In contrast to most econometric studies of the connection between R&D and productivity,
our empirical analysis includes adjustments for selection into R&D, in the sense that firms must
first decide whether to engage in R&D at all. This is potentially a major problem, since many
companies report zero R&D expenditure. Most empirical studies of the returns to R&D have
1 See Link and Siegel (2003) for a review of the old and new growth literatures relating to investment in
technology.
4
been based only on firms that conduct R&D. We conjecture that a failure to take account of the
determinants of the decision to engage in innovation might result in overestimation of the returns
to R&D (for the representative firm).3 Given that our data include firms that report zero R&D
expenditure, we can estimate a treatment effects model, using sample selection procedures
developed by Heckman (1979). This approach has been suggested and implemented in Crepon,
Duguet and Mairesse (1998).
The remainder of the article is organized as follows. In the following section, we outline
our theoretical model and estimation strategy. Section III describes the data. Empirical results
are presented in Section IV. Conclusions and suggestions for additional research are presented
in the final section.
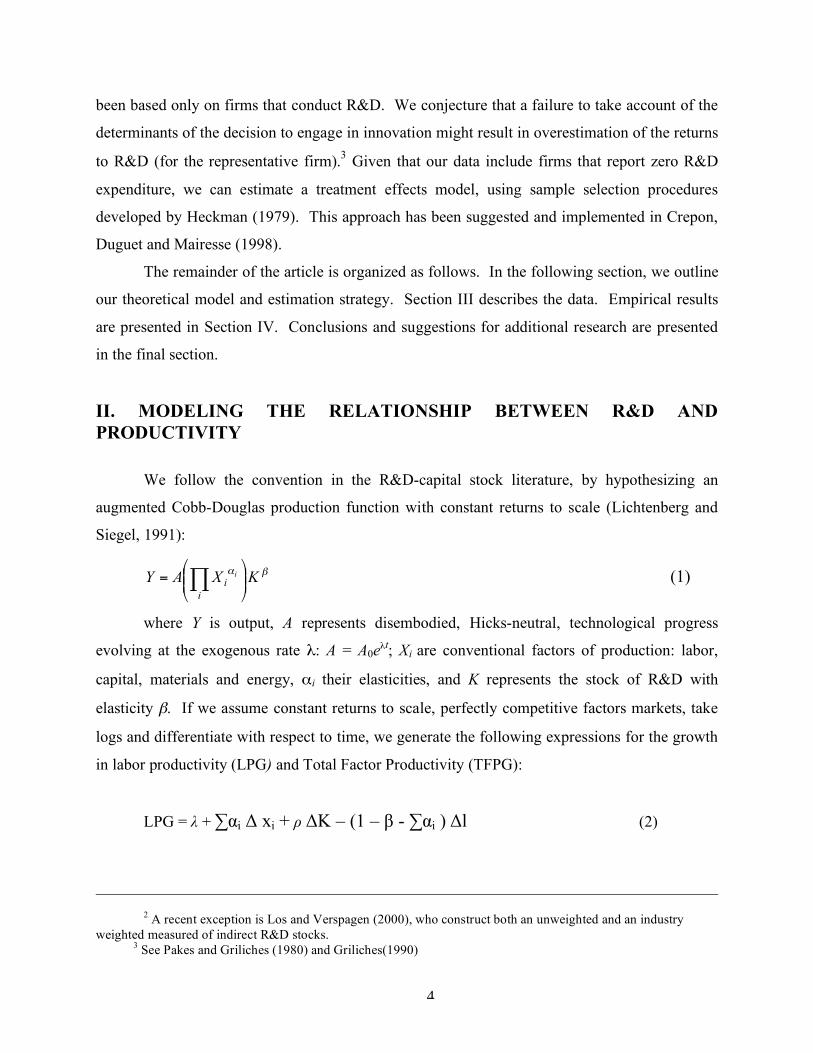
II. MODELING THE RELATIONSHIP BETWEEN R&D AND PRODUCTIVITY
We follow the convention in the R&D-capital stock literature, by hypothesizing an
augmented Cobb-Douglas production function with constant returns to scale (Lichtenberg and
Siegel, 1991):
!"KXAY
i
i
i
##$
%&&'
(= ) (1)
where Y is output, A represents disembodied, Hicks-neutral, technological progress
evolving at the exogenous rate λ: A = A0eλt; Xi are conventional factors of production: labor,
capital, materials and energy, αi their elasticities, and K represents the stock of R&D with
elasticity β. If we assume constant returns to scale, perfectly competitive factors markets, take
logs and differentiate with respect to time, we generate the following expressions for the growth
in labor productivity (LPG) and Total Factor Productivity (TFPG):
LPG = λ + ∑αi Δ xi + ρ ΔK – (1 – β - ∑αi ) Δl (2)
2 A recent exception is Los and Verspagen (2000), who construct both an unweighted and an industry
weighted measured of indirect R&D stocks. 3 See Pakes and Griliches (1980) and Griliches(1990)
5
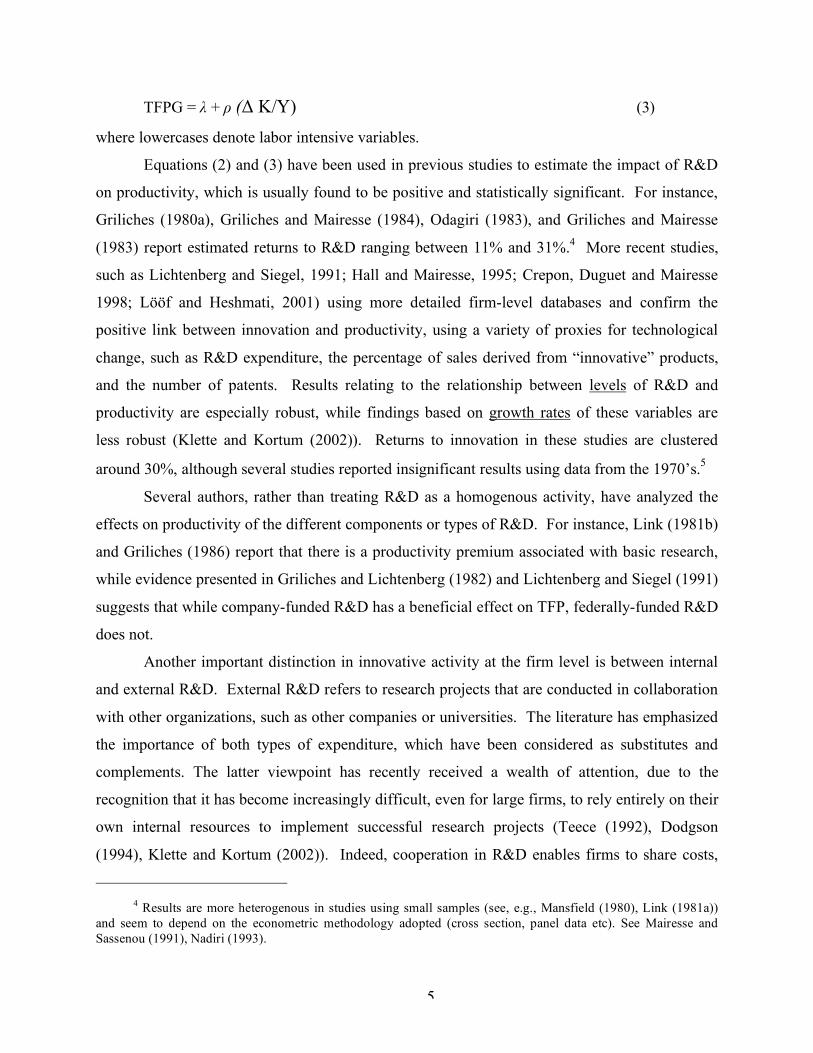
TFPG = λ + ρ (Δ K/Y) (3)
where lowercases denote labor intensive variables.
Equations (2) and (3) have been used in previous studies to estimate the impact of R&D
on productivity, which is usually found to be positive and statistically significant. For instance,
Griliches (1980a), Griliches and Mairesse (1984), Odagiri (1983), and Griliches and Mairesse
(1983) report estimated returns to R&D ranging between 11% and 31%.4 More recent studies,
such as Lichtenberg and Siegel, 1991; Hall and Mairesse, 1995; Crepon, Duguet and Mairesse
1998; Lööf and Heshmati, 2001) using more detailed firm-level databases and confirm the
positive link between innovation and productivity, using a variety of proxies for technological
change, such as R&D expenditure, the percentage of sales derived from “innovative” products,
and the number of patents. Results relating to the relationship between levels of R&D and
productivity are especially robust, while findings based on growth rates of these variables are
less robust (Klette and Kortum (2002)). Returns to innovation in these studies are clustered
around 30%, although several studies reported insignificant results using data from the 1970’s.5
Several authors, rather than treating R&D as a homogenous activity, have analyzed the
effects on productivity of the different components or types of R&D. For instance, Link (1981b)
and Griliches (1986) report that there is a productivity premium associated with basic research,
while evidence presented in Griliches and Lichtenberg (1982) and Lichtenberg and Siegel (1991)
suggests that while company-funded R&D has a beneficial effect on TFP, federally-funded R&D
does not.
Another important distinction in innovative activity at the firm level is between internal
and external R&D. External R&D refers to research projects that are conducted in collaboration
with other organizations, such as other companies or universities. The literature has emphasized
the importance of both types of expenditure, which have been considered as substitutes and
complements. The latter viewpoint has recently received a wealth of attention, due to the
recognition that it has become increasingly difficult, even for large firms, to rely entirely on their
own internal resources to implement successful research projects (Teece (1992), Dodgson
(1994), Klette and Kortum (2002)). Indeed, cooperation in R&D enables firms to share costs,
4 Results are more heterogenous in studies using small samples (see, e.g., Mansfield (1980), Link (1981a))
and seem to depend on the econometric methodology adopted (cross section, panel data etc). See Mairesse and Sassenou (1991), Nadiri (1993).
6
reduce risk, and exploit economies of scale and scope. More generally, it could allow firms to
exchange complementary assets that often have a tacit nature to them (Freeman (1991),
Veugelers (1997)). External R&D expenditure might also be useful in helping the firm enhance
its “absorptive capacity”. This refers to the efforts that a firm undertakes to enhance its ability to
make use of the research results obtained by rivals through beneficial spillovers (Cohen and
Levinthal (1989), Kamien and Zang, 2000).
Maintaining internal research activity could also attract other innovative firms who are
seeking partners for their projects (Tether (2002)). However, as the foregoing discussion
indicates, the choice of the type of research partner generally depends on firm’s objectives. As
noted in Hall, Link, and Scott (2001), partnerships with universities are typically established for
long-term basic research projects. These initiatives are often subsidized both at the national level
(Siegel, Wessner, Binks, and Lockett (2003), Tidd, Bessant and Pavitt (1997), Tether (2002)).
Such subsidization may create perverse effects, as firms are cognizant that cooperation with
public partners will reduce their ability to fully appropriate the benefits of the research efforts.
Hence, they may opt to enter into the cooperative relationship, as it enhances, at a low cost, their
ability to keep abreast of the technological changes that occur in their line of business, but they
may also be induced to both exert the minimum effort possible and select projects whose
objectives have a low probability to change drastically their industry’s market structure. This
may explain the evidence from many existing studies according to which publicly funded R&D
did not have any significant impact on productivity.
Finally, as Paul (2002) documents, several authors have found that knowledge spillovers
are primarily intra-national, thereby suggesting the importance of opportunities available at the
local level. This is particularly important for Italy, where evidence has been found for the
existence of “regional systems of innovation” (RSI). These are defined as “the localized network
of actors and institutions in the public and private sectors whose activities and interactions
generate, import, modify and diffuse new technologies” (Evangelista et al., 2002). In particular,
these authors find that the cluster of R&D-based innovative regions is made up of firms from the
North West regions and from Lazio, where a large section of the Italian public R&D
infrastructure is concentrated. These regions are characterized by a good scientific and
technological infrastructure due to the high concentration of universities and public and private
5 See Lichtenberg and Siegel (1991) and Nadiri (1993).
7
research institutions. Moreover, there is another innovative cluster including the regions of
Emilia-Romagna and Tuscany, where the industrial structure is dominated by small and medium
sized firms in the textile and apparel, mechanical, and electronics industries. In this region, the
rate of innovation is positively affected by favorable context-specific conditions, such as
specialized business services, government-supported local agencies, technology-transfer
agencies, private business associations etc. Although in this study we do not directly measure
any positive spillover due to research activity conducted within a given region, we indirectly
control for regional effects when we analyze the determinants of a firm’s decision to conduct
R&D.
Our estimation strategy is based on the R&D Capital Stock model from Griliches (1979),
as further developed in Griliches (1990). From equation (3) and the hypothesis that R&D has a
negligible depreciation rate (as suggested in Griliches and Lichtenberg (1984)), we have:
(dK/dt) = ΔK = R&D (4)
TFPG = λ + ρ (R&D//Y) (5)
where the TFP, expressed in terms of average annual growth, is given by:
TFPG = (ΔY /Y) - ∑αi (ΔXi /Xi) (6) Equation (5) lends itself to be immediately estimated. However, the presence of a number
of firms reporting zero expenditure in R&D creates an econometric problem, i.e., sample
selection bias. Indeed, the choice of conducting R&D is endogenous at the firm level. A failure
to take account of this might lead to an upward bias in the estimates of the effects of R&D on
productivity.
To address this concern, we estimate a treatment effects model that consists of two
stages. In the first stage, a Probit selection equation is estimated using the dummy variable “DR,”
which is equal to 1 if firm i reports positive R&D expenditure; 0 otherwise:
iiiuWDR += '! (7)
8
where W is a vector of variables that drive firm i’s decision to invest in R&D and
u∼N(0,1). Thus, equation (5) becomes:
TFPGi = β′Xi + εi (8)
where ε∼N(σε,1); Xi is a vector of regressors comprising different measures of R&S plus
a number of dummy variables that captures firm’s specific characteristics, namely dimension and
geographical location. In the subsequent analysis, ρ denotes the correlation between u and ε.
When u and ε are correlated, in the second stage the following model is estimated:
TFPGi = β′Xi + βλλi (γWi) (9)
where βλ = ρσε, and )ˆ(/)ˆ(
iiiWW !!"# $= is the inverse Mill’s ratio that is added to the
structural equation. Therefore, this procedure, which was adapted by Barnow, Cain and
Goldberger (1981) to the treatment effect case, deals with the sample selection problem as one of
an omitted variable. It is therefore analogous to that proposed by Heckman (1979), although the
latter, in the second stage, only considers the sub-sample of cases that report a positive value of
the dependent, rather than of an independent, variable. Therefore, in the treatment effect model,
all cases are included in the second stage. The estimation procedure can be summarized as
follows (Verbeek, 2000):
TFPGi = [β′Xi|DRi = 1]*Pr[DRi =1| Wi ] + }[β′Xi|DRi = 0]*Pr[DRi =0| Wi ] (10)
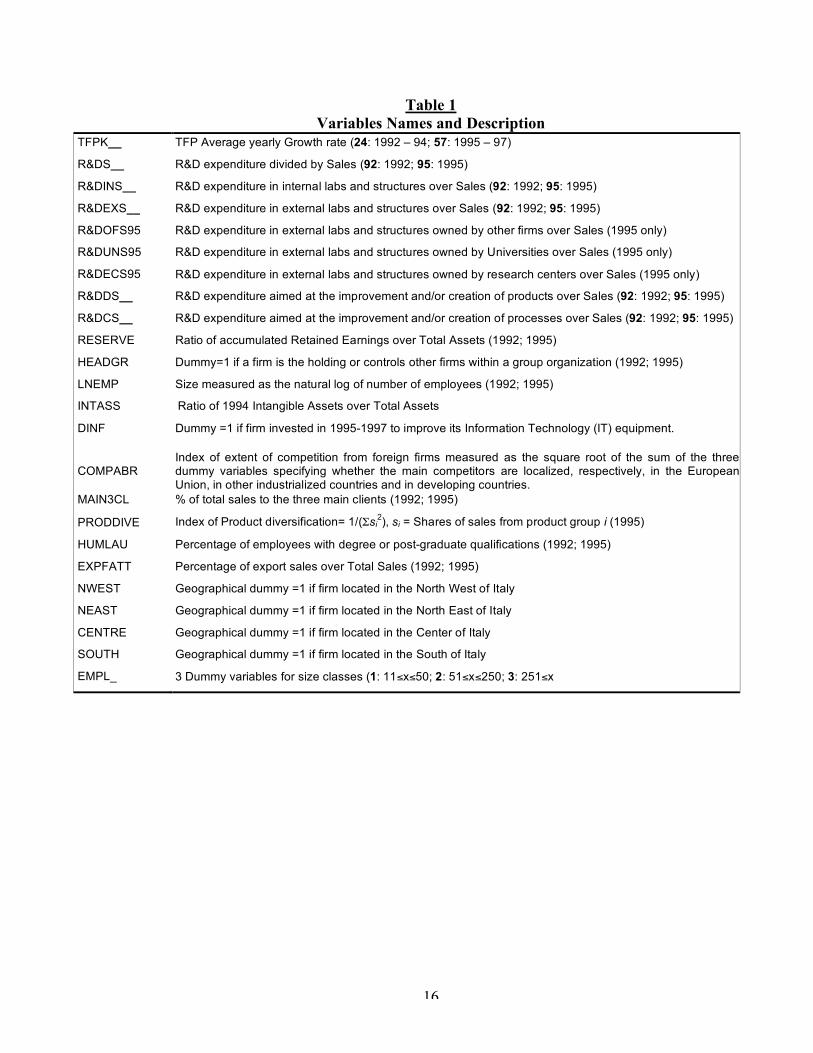
Table 1 presents a list of the variables used in the empirical analysis. The econometric
procedure presented above constitutes a reduced version of the model proposed by Crepon,
Duguet and Mairesse (1998) and Lööf and Heshmati (2001), who used a multiple equations
model developed by Pakes and Griliches (1980). In these papers, a measure of R&D output (e.g.
number of innovative products or patents) is used instead of R&D expenditure. However, it
must be stressed that not all research activity results in a patent, partly because the firms may
want to maintain their know-how secret and partly because certain innovations are not
patentable, although they may significantly contribute to productivity enhancements.6
6 See Siegel, Waldman, and Link (2003) for further discussion of this issue.
9
III. DATA Our data are derived from surveys conducted by Mediocredito Centrale (www.mcc.it), an
Italian investment bank, in 1995 and 1998, respectively. Both surveys requested information on
the firms’ innovative activity for the three years prior to their implementation, that is, 1992-94
and 1995-97. The Mediocredito Centrale surveys consist of three types of data: 1) balance sheet
data 2) conventional input and output data, such as sales, employment, capital investment, and
R&D expenditure, and 3) qualitative and scaled response data regarding the firm’s competitive
environment, group membership and position within the group, and industry characteristics. Firms
with fewer than 500 employees were selected using a stratification procedure based on size,
industry and geographical location. All firms with more than 500 employees were included in the
survey. That is, we have the entire universe of large firms and our final sample represents a very
large percentage of overall economic activity in the manufacturing sector.
For each firm, we have more than 500 variables, with balance sheet data for up to nine
years (1989-1997) for the 1998 survey and up to six years (1989-1994) for the 1995 wave.
Unfortunately, R&D expenditures were available only for three years (1995-97 and 1992-1994) in
each survey. Furthermore, only a limited number of firms were present in both surveys, which
resulted in our decision to conduct our econometric analysis on the two samples separately.7
To compute average growth in TFP, we used a long difference approach where we
consider the change between the years 1997 and 1995 for the sample from the 1998 survey, and
the years 1994-1992 for the sample from the 1995 survey. Firms with a TFP growth rate
measure outside the interval ±30% were considered outliers and eliminated from the sample. To
reduce potential simultaneity problems, we used R&D expenditures only from the first year of
the period under analysis, that is, 1995 and 1992. Overall, after accounting for missing values,
we obtained a sample size of 2268 firms for the period 1992-94 and 2215 for the period 1995-
1997.
With respect to the calculation of TFP from (6), Gullikson (1995) suggests that when
firm level data are used, Y is better represented by sales than by such other measures as value
7 Data from the first survey were used by Piga (2002) to study the strategic use of debt in vertical
relationships, while the decision to conduct cooperative R&D and its antecedent decision to engage in R&D are jointly studied in Piga and Vivarelli (2003) using the 1998 survey.
10
added.8 Capital, labor and materials and energy are the three factor inputs. The growth of
capital was calculated as the growth rate of tangible assets net of depreciation; the items
considered for the evaluation of the costs for material and energy were the costs for materials, for
services and other costs; for labor, we calculated the variation in the number of non-R&D
employees, weighted by the number of part-time workers, to avoid the double counting problem.
Indeed, as suggested in Griliches and Mairesse (1984), in evaluating TFP, factor inputs
should be considered net of any R&D cost, because failing to do so leads to underestimation of
the R&D returns. Unfortunately, we do not have this information for the amount of tangible
assets, materials and energy that were used specifically for R&D purposes. Thus, the coefficient
ρ in (5) will be considered as a return in excess to the average remuneration of the traditional
production inputs. Furthermore, in the evaluation of TFP in (6), the αi coefficients represent
each factor’s elasticity of production. Note that under the assumption of perfectly competitive
markets for factor inputs, these elasticities are equal to the respective cost shares. To work these
out, for each firm in the two samples, the shares of labor costs and materials and energy costs
over total costs were calculated for the initial and the final year, and then their average value was
considered. Following Lichtenberg and Siegel (1991), the cost share of capital was calculated as
a residual. All variables expressing monetary values from both the 1998 and the 1995 survey
were deflated using, respectively, the 1995 and the 1990 indexes of inputs prices. The deflators
for nine different industries were used: these were also disaggregated by geographical location to
take into account differences between the input prices in the North West, North East, the Centre
and the South of Italy.
Definitions of all the regressors used in our empirical analysis are reported in Table 1.
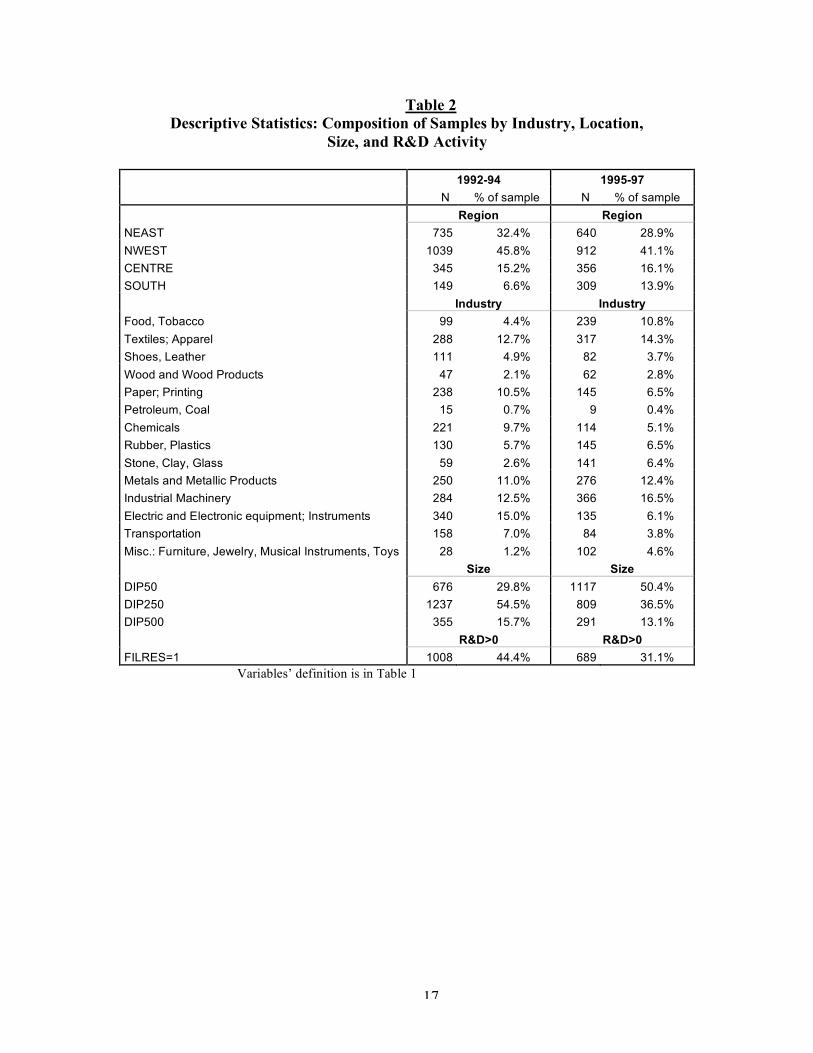
Table 2 provides a summary description of the composition of the statistical samples derived
from the two waves of the survey. This table reveals that our sample consists of many firms in
sectors K (Industrial Machinery), L (Electric and Electronic equipment; Instruments), J (metals
and metallic products) and B (textiles and apparel). Taken together, these four industries account
for 40.2% of all the firms in the 1992-94 sample, and 36.8% in the 1998 sample. More than 40%
8 Sales was also used as a measure of output in Los and Verspagen (2000).
11
of firms in both samples are based in the North West of Italy.9 However, the 1995 survey
includes more than 50% of firms in the 51-250 class size, while the second survey includes a
majority of small firms with 50 or less employees.
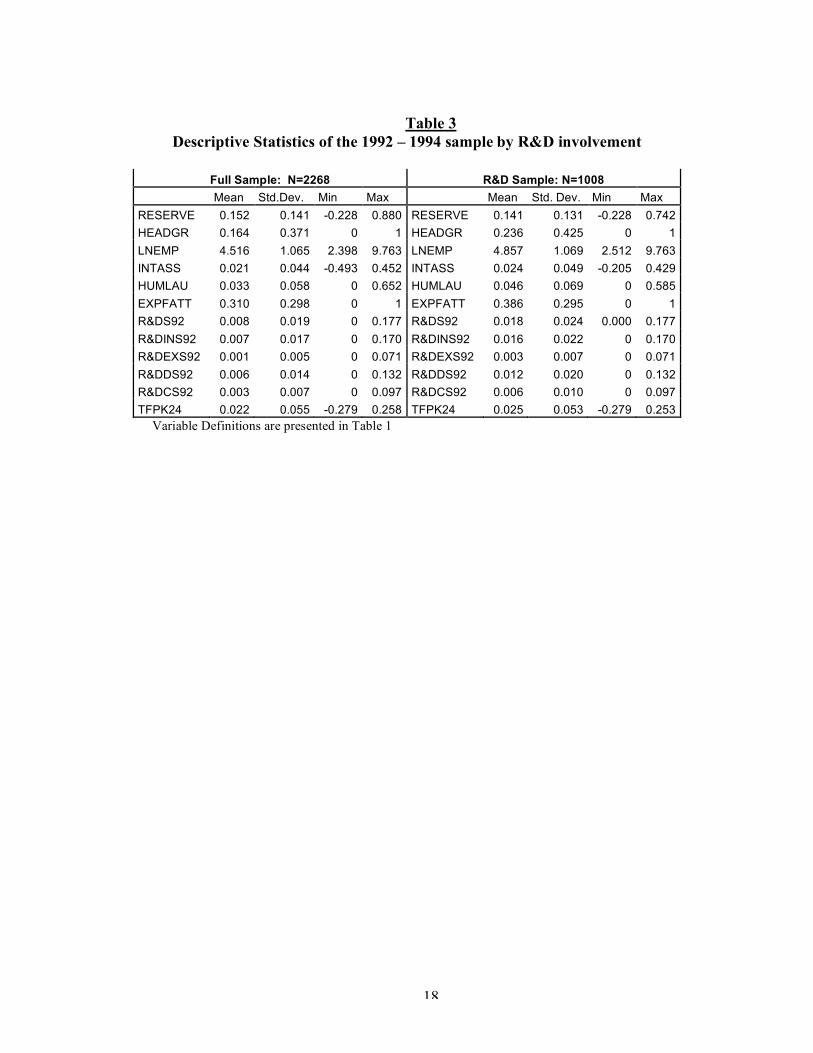
Descriptive statistics for the variables used in both stages of the estimation are reported,
for the two samples, in Table 2 and 3 respectively. Table 3 shows that 1008 firms out of 2268
(44.4%) have reported strictly positive R&D expenditures, amounting to 1.84% of total sales.
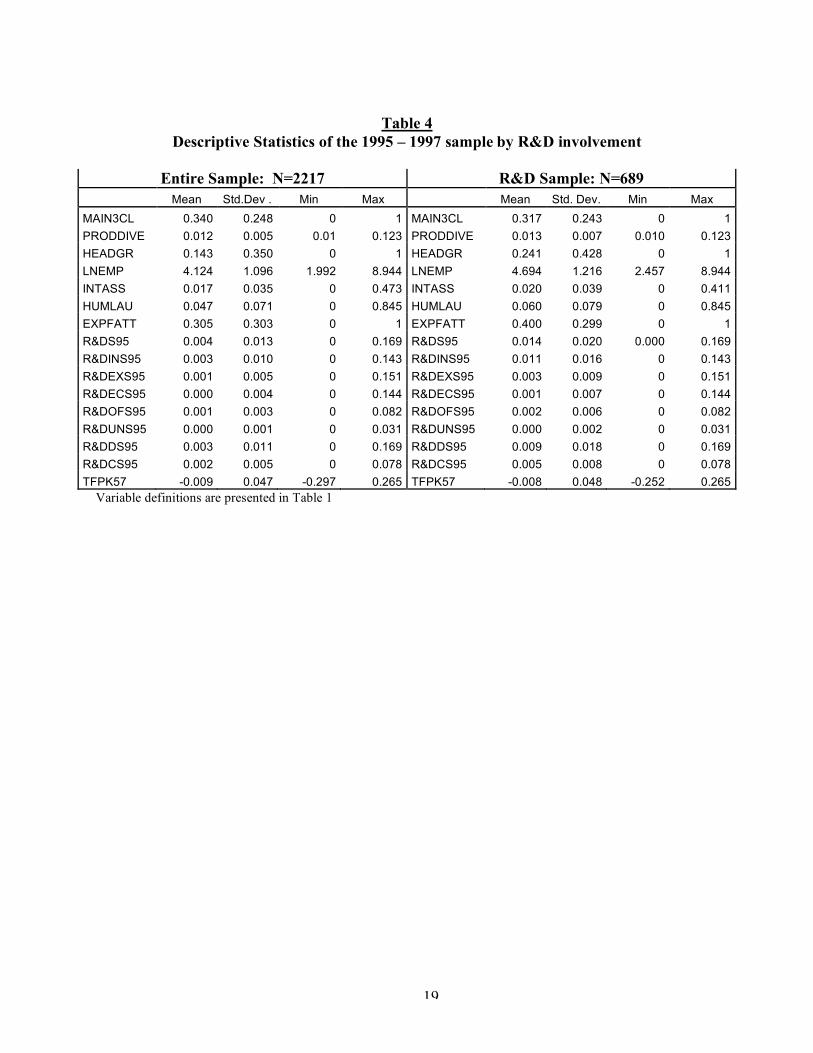
Table 4 indicates that in the 1998 survey the number of firms engaged in R&D fell to 689
(31.1% of total), each investing on average 1.41% of their 1995 total sales. In the first period, the
most R&D intensive sector is that of electrical and optical machines (2.49%), immediately
followed by the mechanical machinery (2.2%) and the transportation industry (2.08%). In the
second period the most R&D intensive sector is the chemical one (2.13%), followed by the
previously mentioned sectors. Internal R&D expenditure is predominant in the mechanical
machinery industry (over 70%) while the chemical and plastic product sector reports the highest
level of external R&D expenditures. The less R&D intensive sectors are the traditional sectors of
food and tobacco, shoes and leather, stone, clay and glass, and petroleum with less than 1.0% of
total sales invested in R&D.
In the 1998 survey, we can disaggregate external R&D expenditure into three categories:
expenditure on research with universities, other research centers, and other companies.
Collaboration with universities is particularly intense in the electrical machines and optical
sectors, and practically absent in the wood products, in the petroleum and in the stone, clay and
glass industries. In the chemical sector collaboration is mostly made together with research
centers. Cooperation with other firms is important in the chemical, the transportation and the
industrial machinery sectors.
Product R&D generally exceeds its process counterpart by a factor of 1.7, although it has
to be noticed that the food and tobacco and the petroleum industries invest more in process
R&D. In both samples, the firms in the North-East and in the Centre are the most R&D intensive,
while those in the South lag behind. However, the latter tend to seek the collaboration of
universities, although the firms in the Centre of Italy spend more than the others in external
9 The geographical compositions in the two samples is similar to the one reported in Evangelista et al.
(2002) who use the Italian data collected for the European project known as the “Community Innovation Survey” comprising 22787 firms.
12
collaborations, especially with other firms. No significant difference can be noticed with regards
to the relationship between firm’s size and R&D intensity, although small firms tend to invest
more in external R&D, especially with other firms.
We now turn to our descriptive statistics on productivity, which reveal distinct
differences in performance. In 1992-94, the average annual growth in TFP was 2.2%, while the
corresponding figure for 1995-97 was -0.94%. Among the industries that record results in
contrast with the periods’ average trend, the stone, clay and glass sectors registered a slow down
in the first period (-3.1%) while the chemical (+1.6%), the petroleum (+0.5%) and shoes and
leather (+0.3%) sectors are the only ones to record an increase in productivity in the second
period. In both periods, the firms located in the North West of the country are associated with the
best performance in terms of TFP, while small firms with less than 50 employees under-
performed relative to their medium and large counterparts.
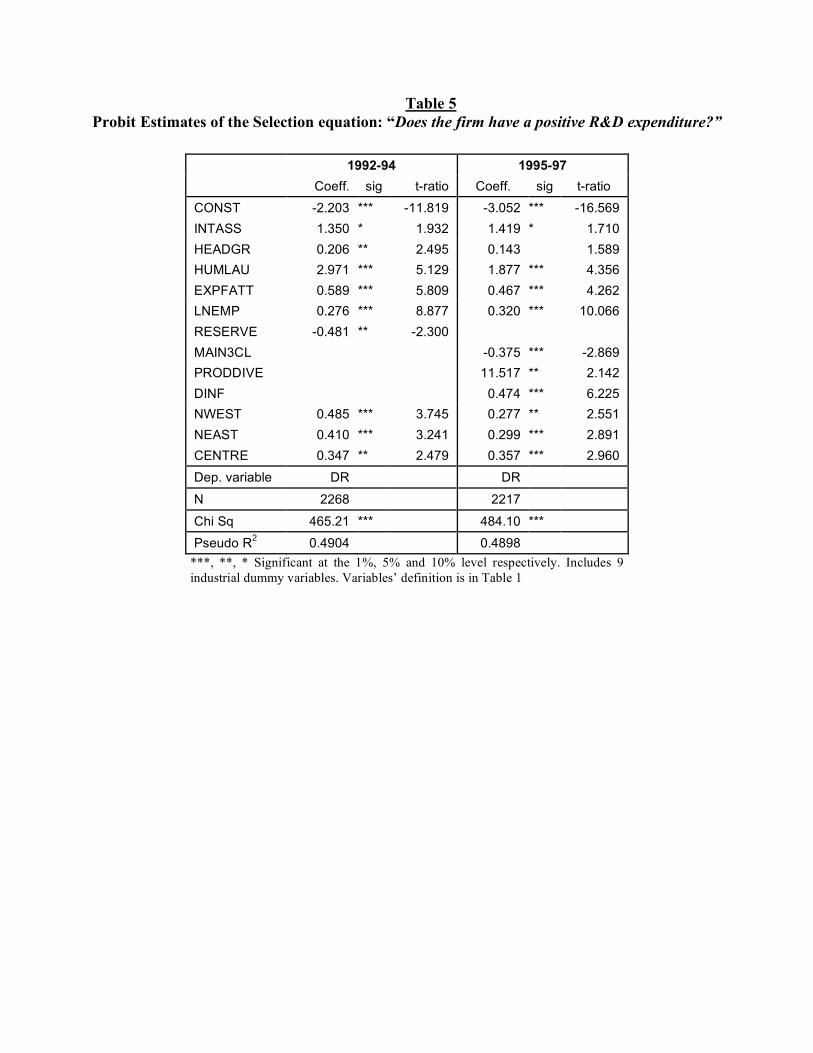
IV. RESULTS Table 5 reports the estimates from the selection regressions for both samples. We use the
same variables in the selection equation (eq. (7)) as Piga and Vivarelli (2003). The estimates are
generally consistent in both regressions and carry the expected signs. The negative and highly
significant constants indicate that small firms located in the South of Italy operating in the Food
and Drinks industry are less likely to report positive R&D expenditure. Export intensity is
positively associated with the probability of engaging in R&D. The findings also suggest that
formal innovative activity is more likely to occur in large, multiproduct firms and those that have
a greater proportion of intangible assets and employees with a degree. The opposite seems to
occur in those firms that concentrate their sales on the three main clients. Finally, the evidence
suggests a tendency, for those firms belonging to a group, to concentrate their research at the
holding firm level.
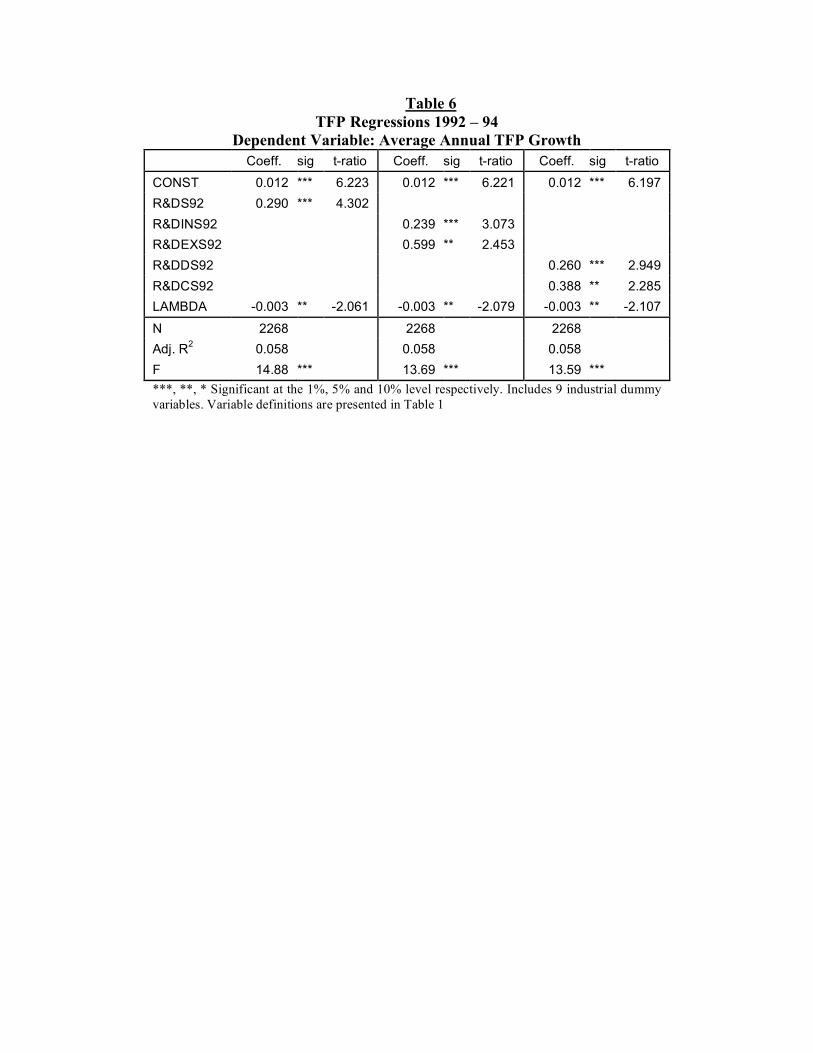
Parameter estimates of the TFP treatment effect model for the 92-94 sample are reported
in Table 6. As expected, there is a positive association between R&D and productivity growth.
Note that our estimate of a 29% “return” to R&D is fairly consistent with previous studies. The
results presented in the second column of Table 6 suggest that internal and external R&D
activities both have a positive and significant impact on productivity. However, it appears as
though the returns to external R&D are higher than those associated with internal R&D. This
13
difference is statistically significant. The third set of findings implies that process R&D yields
higher returns than product R&D, although this difference is not statistically significant.
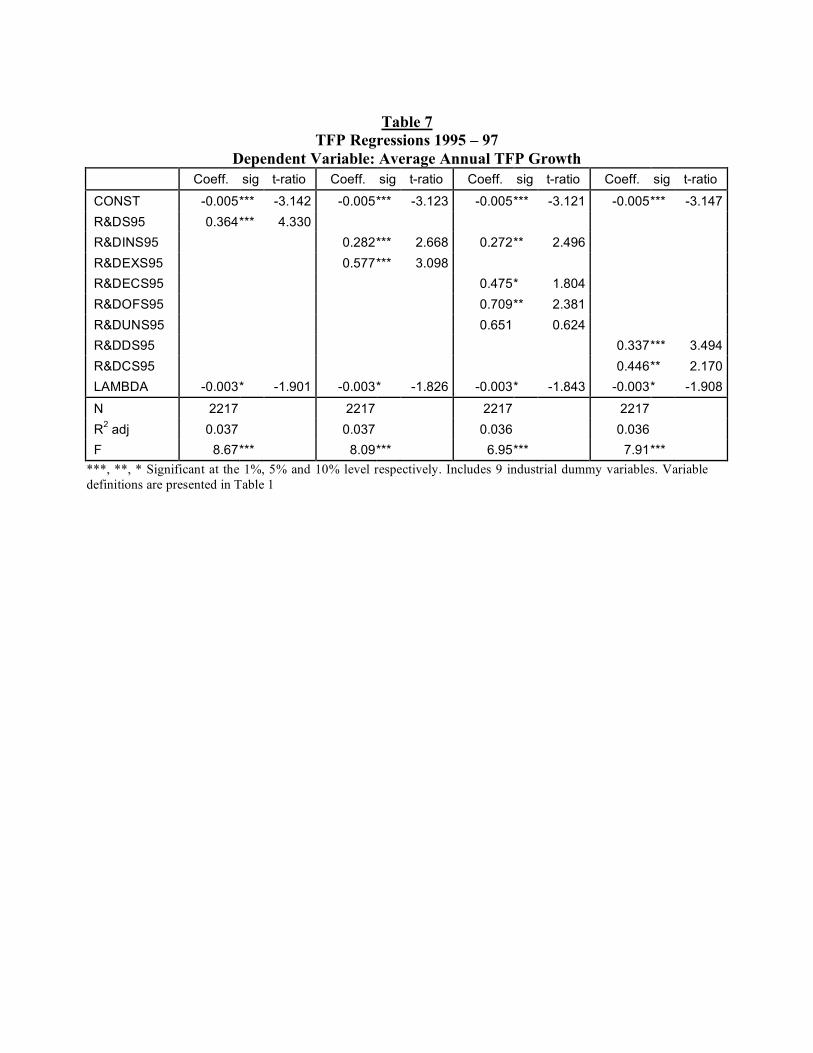
Similar patterns emerge when we estimate the TFP treatment effects model using data
from the later period (95-97). These findings are presented in Table 7. Once again, we find that
the returns to external R&D greatly exceed those resulting from investment in internal R&D.
More importantly, the estimates in the third column of Table 7 reveal that the impact of external
R&D depends on the nature of the research partner or collaborator. Indeed, the results suggest
that engaging in external research projects with other firms significantly enhances productivity,
while collaboration with universities does not. Between these two extremes lies the impact of
R&D expenditures within private or public research centers, whose coefficient is positive and
significant at the 10% level.
These results are consistent with the view that firms allocate their external R&D in a
manner that maximizes the private return on investment. That is, strategic research projects are
shared with other private firms, since this reduces the risk that the research results will be
appropriated by competitors. More basic research that is unlikely to yield marketable products or
more efficient processes in the near future, but that may be nonetheless useful for maintaining a
firm’s absorptive capacity, is conducted with universities. The incentives for research centers,
even public institutions, to disseminate the results of their research activity is weaker than in
universities, as they can exploit them for commercial purposes. Thus, firms are more willing to
collaborate and share resources with research centers, as spillovers may be more easily
internalized. From a more general viewpoint, our findings support the notion that spillovers
arising from a firm’s spatial and sectoral linkages may enhance a firm’s productivity growth
(Paul, 2002).
As a final empirical point, we stress that the unobserved characteristics included in εi in
equation (9) may be correlated with the firm’s decision to invest in R&D. This correlation could
introduce sample selection bias in conventional econometric estimation of the reduced form
R&D-productivity equation. This seems to be the case in our two samples. Indeed, we could
reject the null hypothesis of no selectivity bias in all our models, as the coefficients on
LAMBDA are significant in both periods. The negative sign indicates the existence of
unobservable characteristics that positively (negatively) influences a firm’s decision to engage in
R&D, but that negatively (positively) affects its productivity. Thus, the evidence from both
14
surveys lends some support to our methodological choice to analyze the relationship between
R&D and TFP using a treatment effects model.
V. CONCLUSIONS AND SUGGESTIONS FOR ADDITIONAL RESEARCH We have investigated the link between a firm’s productivity growth and its innovative
activity, as identified by various measures of R&D expenditures (internal, external in partnership
with other firms, universities and/or research centers, process and product). Our findings yield
several preliminary conclusions. First, sample selection issues are found to be important when
R&D is used to explain changes in productivity. Because many firms do not conduct R&D, it is
necessary to explain the process by which firms choose to invest funds in formal research. Thus,
a two-stage treatment effect model was used in our empirical analysis. In the first stage, we
estimated a Probit regression of the selection process. In the second stage, we estimate reduced
form equations from the R&D capital stock model, in order to assess the relationship between
TFP and R&D. A failure to take account of selection effects may result in biased estimates of
the returns to R&D. Note that we still find that R&D has a positive and significant impact on
productivity, even after controlling for sample selection bias.
Another key preliminary conclusion is that external R&D generates a significantly higher
return than internal R&D. However, these positive returns appear to be driven primarily by
external research projects with other companies and research centers. On the other hand,
investment in external collaborative research with universities does not appear to generate a
direct positive return to the firm.
There are several possible interpretations of this result. One interpretation is that firms
use universities as research partners when the research outcomes do not have important strategic
consequences. For instance, firms may delegate to universities the implementation of quality
controls that guarantee their products’ compliance with minimum regulatory safety standards.
However, the usual intellectual property rights and appropriability difficulties seem to indicate
that for the firms in our samples, external R&D with universities is a particularly unattractive
strategy to acquire a strategic advantage (Love and Roper, 2002).
It is important to bear in mind that this finding may be due to the limited time span over
which we have analyzed changes in TFP. That is, firms are likely to engage in applied research
with other firms and this research may generate benefits within a few years. If firms are mostly
15
engaged in basic research projects with universities (Hall, Link, and Scott (2003)), marketable
outcomes resulting from this research may fail to materialize for many years. However, research
with universities has been found to increase a firm’s internal “absorptive capacity” (Cockburn
and Henderson (1998) and (Hall, Link, and Scott (2003)). Thus, it may contribute to a firm’s
long-run viability because it enables a firm to keep abreast of scientific developments, thereby
enhancing its possibility to take advantage of the technological opportunities available at the
geographical and/or sectoral level.
In future empirical research, we hope to estimate a longer time series, in order to
discriminate between these alternative interpretations of a zero (private) return to collaborative
research with universities.
16
Table 1 Variables Names and Description
TFPK__ TFP Average yearly Growth rate (24: 1992 – 94; 57: 1995 – 97)
R&DS__ R&D expenditure divided by Sales (92: 1992; 95: 1995)
R&DINS__ R&D expenditure in internal labs and structures over Sales (92: 1992; 95: 1995)
R&DEXS__ R&D expenditure in external labs and structures over Sales (92: 1992; 95: 1995)
R&DOFS95 R&D expenditure in external labs and structures owned by other firms over Sales (1995 only)
R&DUNS95 R&D expenditure in external labs and structures owned by Universities over Sales (1995 only)
R&DECS95 R&D expenditure in external labs and structures owned by research centers over Sales (1995 only)
R&DDS__ R&D expenditure aimed at the improvement and/or creation of products over Sales (92: 1992; 95: 1995)
R&DCS__ R&D expenditure aimed at the improvement and/or creation of processes over Sales (92: 1992; 95: 1995)
RESERVE Ratio of accumulated Retained Earnings over Total Assets (1992; 1995)
HEADGR Dummy=1 if a firm is the holding or controls other firms within a group organization (1992; 1995)
LNEMP Size measured as the natural log of number of employees (1992; 1995)
INTASS Ratio of 1994 Intangible Assets over Total Assets
DINF Dummy =1 if firm invested in 1995-1997 to improve its Information Technology (IT) equipment.
COMPABR Index of extent of competition from foreign firms measured as the square root of the sum of the three dummy variables specifying whether the main competitors are localized, respectively, in the European Union, in other industrialized countries and in developing countries.
MAIN3CL % of total sales to the three main clients (1992; 1995)
PRODDIVE Index of Product diversification= 1/(Σsi2), si = Shares of sales from product group i (1995)
HUMLAU Percentage of employees with degree or post-graduate qualifications (1992; 1995)
EXPFATT Percentage of export sales over Total Sales (1992; 1995)
NWEST Geographical dummy =1 if firm located in the North West of Italy
NEAST Geographical dummy =1 if firm located in the North East of Italy
CENTRE Geographical dummy =1 if firm located in the Center of Italy
SOUTH Geographical dummy =1 if firm located in the South of Italy
EMPL_ 3 Dummy variables for size classes (1: 11≤x≤50; 2: 51≤x≤250; 3: 251≤x
17
Table 2 Descriptive Statistics: Composition of Samples by Industry, Location,
Size, and R&D Activity
1992-94 1995-97 N % of sample N % of sample Region Region NEAST 735 32.4% 640 28.9% NWEST 1039 45.8% 912 41.1% CENTRE 345 15.2% 356 16.1% SOUTH 149 6.6% 309 13.9% Industry Industry Food, Tobacco 99 4.4% 239 10.8% Textiles; Apparel 288 12.7% 317 14.3% Shoes, Leather 111 4.9% 82 3.7% Wood and Wood Products 47 2.1% 62 2.8% Paper; Printing 238 10.5% 145 6.5% Petroleum, Coal 15 0.7% 9 0.4% Chemicals 221 9.7% 114 5.1% Rubber, Plastics 130 5.7% 145 6.5% Stone, Clay, Glass 59 2.6% 141 6.4% Metals and Metallic Products 250 11.0% 276 12.4% Industrial Machinery 284 12.5% 366 16.5% Electric and Electronic equipment; Instruments 340 15.0% 135 6.1% Transportation 158 7.0% 84 3.8% Misc.: Furniture, Jewelry, Musical Instruments, Toys 28 1.2% 102 4.6% Size Size DIP50 676 29.8% 1117 50.4% DIP250 1237 54.5% 809 36.5% DIP500 355 15.7% 291 13.1% R&D>0 R&D>0 FILRES=1 1008 44.4% 689 31.1%
Variables’ definition is in Table 1
18
Table 3 Descriptive Statistics of the 1992 – 1994 sample by R&D involvement
Full Sample: N=2268 R&D Sample: N=1008
Mean Std.Dev. Min Max Mean Std. Dev. Min Max RESERVE 0.152 0.141 -0.228 0.880 RESERVE 0.141 0.131 -0.228 0.742 HEADGR 0.164 0.371 0 1 HEADGR 0.236 0.425 0 1 LNEMP 4.516 1.065 2.398 9.763 LNEMP 4.857 1.069 2.512 9.763 INTASS 0.021 0.044 -0.493 0.452 INTASS 0.024 0.049 -0.205 0.429 HUMLAU 0.033 0.058 0 0.652 HUMLAU 0.046 0.069 0 0.585 EXPFATT 0.310 0.298 0 1 EXPFATT 0.386 0.295 0 1 R&DS92 0.008 0.019 0 0.177 R&DS92 0.018 0.024 0.000 0.177 R&DINS92 0.007 0.017 0 0.170 R&DINS92 0.016 0.022 0 0.170 R&DEXS92 0.001 0.005 0 0.071 R&DEXS92 0.003 0.007 0 0.071 R&DDS92 0.006 0.014 0 0.132 R&DDS92 0.012 0.020 0 0.132 R&DCS92 0.003 0.007 0 0.097 R&DCS92 0.006 0.010 0 0.097 TFPK24 0.022 0.055 -0.279 0.258 TFPK24 0.025 0.053 -0.279 0.253
Variable Definitions are presented in Table 1
19
Table 4 Descriptive Statistics of the 1995 – 1997 sample by R&D involvement
Entire Sample: N=2217 R&D Sample: N=689
Mean Std.Dev . Min Max Mean Std. Dev. Min Max MAIN3CL 0.340 0.248 0 1 MAIN3CL 0.317 0.243 0 1 PRODDIVE 0.012 0.005 0.01 0.123 PRODDIVE 0.013 0.007 0.010 0.123 HEADGR 0.143 0.350 0 1 HEADGR 0.241 0.428 0 1 LNEMP 4.124 1.096 1.992 8.944 LNEMP 4.694 1.216 2.457 8.944 INTASS 0.017 0.035 0 0.473 INTASS 0.020 0.039 0 0.411 HUMLAU 0.047 0.071 0 0.845 HUMLAU 0.060 0.079 0 0.845 EXPFATT 0.305 0.303 0 1 EXPFATT 0.400 0.299 0 1 R&DS95 0.004 0.013 0 0.169 R&DS95 0.014 0.020 0.000 0.169 R&DINS95 0.003 0.010 0 0.143 R&DINS95 0.011 0.016 0 0.143 R&DEXS95 0.001 0.005 0 0.151 R&DEXS95 0.003 0.009 0 0.151 R&DECS95 0.000 0.004 0 0.144 R&DECS95 0.001 0.007 0 0.144 R&DOFS95 0.001 0.003 0 0.082 R&DOFS95 0.002 0.006 0 0.082 R&DUNS95 0.000 0.001 0 0.031 R&DUNS95 0.000 0.002 0 0.031 R&DDS95 0.003 0.011 0 0.169 R&DDS95 0.009 0.018 0 0.169 R&DCS95 0.002 0.005 0 0.078 R&DCS95 0.005 0.008 0 0.078 TFPK57 -0.009 0.047 -0.297 0.265 TFPK57 -0.008 0.048 -0.252 0.265
Variable definitions are presented in Table 1
20
Table 5 Probit Estimates of the Selection equation: “Does the firm have a positive R&D expenditure?”
1992-94 1995-97 Coeff. sig t-ratio Coeff. sig t-ratio
CONST -2.203 *** -11.819 -3.052 *** -16.569 INTASS 1.350 * 1.932 1.419 * 1.710 HEADGR 0.206 ** 2.495 0.143 1.589 HUMLAU 2.971 *** 5.129 1.877 *** 4.356 EXPFATT 0.589 *** 5.809 0.467 *** 4.262 LNEMP 0.276 *** 8.877 0.320 *** 10.066 RESERVE -0.481 ** -2.300 MAIN3CL -0.375 *** -2.869 PRODDIVE 11.517 ** 2.142 DINF 0.474 *** 6.225 NWEST 0.485 *** 3.745 0.277 ** 2.551 NEAST 0.410 *** 3.241 0.299 *** 2.891 CENTRE 0.347 ** 2.479 0.357 *** 2.960 Dep. variable DR DR
N 2268 2217
Chi Sq 465.21 *** 484.10 *** Pseudo R2 0.4904 0.4898
***, **, * Significant at the 1%, 5% and 10% level respectively. Includes 9 industrial dummy variables. Variables’ definition is in Table 1
21
Table 6 TFP Regressions 1992 – 94
Dependent Variable: Average Annual TFP Growth Coeff. sig t-ratio Coeff. sig t-ratio Coeff. sig t-ratio
CONST 0.012 *** 6.223 0.012 *** 6.221 0.012 *** 6.197 R&DS92 0.290 *** 4.302 R&DINS92 0.239 *** 3.073 R&DEXS92 0.599 ** 2.453 R&DDS92 0.260 *** 2.949 R&DCS92 0.388 ** 2.285 LAMBDA -0.003 ** -2.061 -0.003 ** -2.079 -0.003 ** -2.107
N 2268 2268 2268 Adj. R2 0.058 0.058 0.058 F 14.88 *** 13.69 *** 13.59 *** ***, **, * Significant at the 1%, 5% and 10% level respectively. Includes 9 industrial dummy variables. Variable definitions are presented in Table 1
22
Table 7
TFP Regressions 1995 – 97 Dependent Variable: Average Annual TFP Growth
Coeff. sig t-ratio Coeff. sig t-ratio Coeff. sig t-ratio Coeff. sig t-ratio
CONST -0.005 *** -3.142 -0.005 *** -3.123 -0.005 *** -3.121 -0.005 *** -3.147 R&DS95 0.364 *** 4.330 R&DINS95 0.282 *** 2.668 0.272 ** 2.496 R&DEXS95 0.577 *** 3.098 R&DECS95 0.475 * 1.804 R&DOFS95 0.709 ** 2.381 R&DUNS95 0.651 0.624 R&DDS95 0.337 *** 3.494 R&DCS95 0.446 ** 2.170 LAMBDA -0.003 * -1.901 -0.003 * -1.826 -0.003 * -1.843 -0.003 * -1.908
N 2217 2217 2217 2217 R2 adj 0.037 0.037 0.036 0.036 F 8.67 *** 8.09 *** 6.95 *** 7.91 ***
***, **, * Significant at the 1%, 5% and 10% level respectively. Includes 9 industrial dummy variables. Variable definitions are presented in Table 1
23
References Aghion, P. and P. Howitt (1998). Endogenous Growth Theory, Cambridge MA, MIT Press. Barnow, B. S., G. G. Cain and A. S. Goldberger (1981). “Issues in the Analysis of Selection Bias,” Evaluation Studies Review, Ann. 5, ed. by E. Stromsdorfer and G. Farkas, San Francisco, Sage, 43-59. Brynjolfsson, E. and L.M. Hitt (2000). “Beyond Computation: Information Technology, Organizational Transformation and Business Performance,” Journal of Economic Perspectives, 14 (4), Fall, 23-48. Cassiman B. and Veugelers, R. (2002), “Cooperation in R&D and Spillovers: Some empirical Evidence from Belgium,” American Economic Review, 92, 1169—1184. Cockburn, I. M. and Henderson, R. M. (1998), “Absorptive Capacity, Coauthoring Behavior, and the Organization of Research in Drug Discovery”, Journal of Industrial Economics, 46, 157-181. Cohen, W. M. and Levinthal, D. A. (1989). “Innovation and Learning: The Two Faces of R&D,” The Economic Journal, 99, 3 (September), 569-596. Crepon B., E. Duguet and J. Mairesse (1998). “Research, Innovation and Productivity: An Econometric Analysis at the Firm Level,” NBER Working Paper No. 6696. Dodgson, M. (1994). “Technological Collaboration and Innovation,” in Dodgson, M and Rothwell, R. (eds.), The Handbook of Industrial Innovation, Cheltenham, Edward Elgar. Evangelista, R., S. Iammarino, V. Mastrostefano and A. Silvani (2002). “Looking for Regional Systems of Innovation: Evidence from the Italian Innovation Survey,” Regional Studies, 36, 173-186. Freeman, C. (1991). “Networks of Innovators: A Synthesis of Research Issues,” Research Policy, 20, 5 (October), 499-514. Griliches, Z. (1979), “Issues in Assessing the Contribution of Research and Development to Productivity Growth,” The Bell Journal of Economics, 10, 1 (Spring), 92-116. Griliches, Z. (1980), “Returns to research and development expenditures in the private sector,” in New Development in Productivity Measurement and Analysis, J. Kendrick and B. Vaccara (eds), Chicago University of Chicago Press. Griliches, Z. (1986), “Productivity, R&D and Basic Research at the Firm Level in the 1970’s,“ American Economic Review, 76, 1 (March), 141-154. Griliches, Z. (1990), “Patent Statistics as Economic Indicators: A Survey,” Journal of Economic Literature, 28, 4, 1661-1797. Griliches, Z. (1998). R&D and Productivity, Chicago, University of Chicago Press,
24
Griliches, Z. and F. Lichtenberg (1984), “R&D and Productivity at the Industry Level: Is there Still A Relationship?,” in Z. Griliches (ed.), R&D, Patents, and Productivity, Chicago: University of Chicago Press. Griliches, Z. and J. Mairesse (1983), “Comparing Productivity Growth : An Exploration of French and US Industrial and Firm Data,” European Economic Review, 21, 89-119. Griliches, Z. and J. Mairesse (1984), “Productivity and R&D at the Firm Level”, in Z. Griliches (ed.), R&D, Patents, and Productivity, Chicago: University of Chicago Press. Grossman, G. M. and E. Helpman (1991). Innovation and Growth in the Global Economy, Cambridge MA, MIT Press. Gullickson, W. (1995). “Multifactor Productivity in Manufacturing Industries,” Monthly Labor Review, October, 20−32. Hall, B. H., A. N. Link, and J. T. Scott. (2001) “Barriers Inhibiting Industry from Partnering with Universities: Evidence from the Advanced Technology Program,” Journal of Technology Transfer, 26, 87-98. Hall, B. H., A.N. Link, and J. T. Scott. (2003) “Universities as Research Partners,” Review of Economics and Statistics, 85(2), 485-491.. Hall, B. H. and J. Mairesse (1995). “Exploring the Relationship Between R&D and Productivity in French Manufacturing Firms,” Journal of Econometrics, 65, 1 (January), 263-293. Heckman, J. J. (1979). “Sample Selection Bias as a Specification Error,” Econometrica, 47, 153−161. Kamien, M. and I. Zang (2000). “Meet me halfway: research joint ventures and absorptive capacity,” International Journal of Industrial Organization, 18 (7), pp.995-1012. Klette, T. J. and S. Kortum (2002). “Innovating Firms and Aggregate Innovation,” NBER Working Paper No. 8819. Lichtenberg, F. and D. Siegel (1991), “The Impact of R&D Investment on Productivity – New Evidence Using R&D – LRD Data,” Economic Inquiry 29 (2), 203-228. Link, A. N. (1981a). Research and Development Activity in U.S. Manufacturing, New York, Proger Publishers. Link, A. N. (1981b). “Basic Research and Productivity Increase in Manufacturing: Additional Evidence,” American Economic Review, 71, 5 (December), 1111-1112. Link, A. N. and D. S. Siegel (2003). Technological Change and Economic Performance, London and New York: Routledge. Lööf, H. and A. Heshmati (2001). “Knowledge Capital and Performance Heterogeneity: A Firm-Level Innovation Study, International Journal of Production Economics, 76, 1 (March), 61-85.
25
Los, B. and B. Verspagen (2000). “R&D Spillovers and Productivity: Evidence from U.S. Manufacturing Microdata,” Empirical Economics, 25, 127-148. Love, J. H. and S. Roper (2002). “Internal Versus External R&D: A Study of R&D Choice with Sample Selection,” International Journal of the Economics of Business, 9, 2 (July), 239-255. Mairesse, J. and M. Sassenou (1991). “R&D and Productivity: A Survey of Econometric Studies at the Firm Level,” NBER Working Paper No. 3666. Mansfield, E. (1980), “Industrial R&D in Japan and the United States: A comparative study,” American Economic Review, Papers and Proceedings, 78, pp. 223-228. Nadiri, M. I. (1993). “Innovations and Technological Spillovers,” NBER Working Paper, 4423. Odagiri, H (1983). “R&D Expenditures, Royalty Payments, and Sales Growth in Japanese Manufacturing Corporations,” Journal of Industrial Economics, 32 (1), 61-71. Pakes, A. and Z. Griliches (1980). “Patents and R&D at the Firm Level: A First Look,” NBER Working Paper No. 561. Paul, C. J. M. (2002). “Supply and Demand-Driven Spillovers and Productivity Growth,” Japan and the World Economy, 14, 285—304. Paul, C.J.M. and Siegel, D.S. (2001) ‘The Impacts of Technology, Trade, and Outsourcing on Employment and Labor Composition’, Scandinavian Journal of Economics, 103: 241-264. Piga, C. (2002), “Debt and Firms’ Relationship: the Italian Evidence,” Review of Industrial Organization, 20, 267—282. Piga, C. and M. Vivarelli (2003). “Sample Selection in Estimating the Determinants of Cooperative R&D”, Applied Economic Letters, 10, 243-246. Romer, P. M. (1986). “Increasing Returns and Long-Run Growth,” Journal of Political Economy, 94, 5 (October), 1002-1037. Romer, P. M. (1990). “Endogenous Technological Change,” Journal of Political Economy, 98, 5 part 2 (October), 71-102. Siegel, D. (1997), “The Impact of Computers on Manufacturing Productivity Growth: A Multiple-Indicators, Multiple-Causes Approach,” Review of Economics and Statistics, 79(1), 68-78. Siegel, D. S., D. Waldman, and A. N. Link (2003). “Assessing the Impact of Organizational Practices on the Relative Productivity of University Technology Transfer Offices: An Exploratory Study,” Research Policy, 32(1), 27-48. Siegel, D. S., C. Wessner, M. Binks, and A. Lockett (2003). “Policies Promoting Innovation in Small Firms: Evidence From the U.S. and U.K.,” Small Business Economics, 20(2), 121-127.
Teece, D. J. (1992) “Competition, Cooperation and Innovation: Organisational Arrangements for Regimes of Rapid Technological Progress”, Journal of Economic Behaviour and Organization, 18, 1 (June), 1-25.
26
Tether, B. S. (2002). “Who Co-operates for Innovation, and Why. An Empirical Analysis,” Research Policy, 31, 6 (August), 947-967. Tidd, J., J. Bessant, and K. Pavitt (1997). Managing Innovation: Integrating Technological, Market and Organisational Change, Chichester, John Wiley & Sons. Verbeek, M. (2000). A Guide to Modern Econometrics, Chichester, John Wiley & Sons Ltd. Veugelers, R. (1997). “Internal R&D Expenditures and External Technology Sourcing,” Research Policy, 26, 3, 303-316.


![Collaborative IQ - Assessing Company Culture for Social Business Transformation [INFOGRAPHIC]](https://img.pdfslide.net/doc/110x75/5482649db4af9f84578b45b1/collaborative-iq-assessing-company-culture-for-social-business-transformation-infographic.jpg)