Embed Size (px)
Citation preview

AACL Bioflux, 2018, Volume 11, Issue 3. http://www.bioflux.com.ro/aacl 782
Assessing the suitability of different carbon sources for Nile tilapia, Oreochromis niloticus culture in BFT system 1Mohamed H. M. El-Shafiey, 1Rania S. Mabroke, 2Hesham R. A. Mola, 2Mohamed S. Hassaan, 1Ashraf Suloma
1 Fish Nutrition Laboratory (FNL), Animal Production Department, Faculty of Agriculture, Cairo University, Giza 12613, Egypt; 2 National Institute of Oceanography and Fisheries
(NIOF), Cairo 11516, Egypt. Corresponding author: M. H. M. El-Shafiey, [email protected]
Abstract. Four carbon sources of different complexity (glucose, starch, molasses and cellulose) were evaluated for their effects on the integrity of biofloc system. The experiment lasted for 30 days where 12 circular plastic tanks (55 L) were used as experimental units for different treatments in triplicate. Each tank was stocked with 10 Nile tilapia fingerlings with average body weight of 9.14±0.06 g corresponding to the densities of 1.66 kg m-3 and were aerated by air stones. Dissolved oxygen (DO), pH, temperature, total ammonia-nitrogen (TAN), nitrite, water alkalinity, total suspended solids (TSS) and floc volume values in the rearing tanks were within normal limits for fish culture. Cellulose treatment showed significantly the highest average final body weight and the best feed conversion ratio (FCR). Complexity of carbon sources had no effect on the fatty acids (FA) profile. Cellulose recorded the lowest zooplankton count with no significant differences among treatments. Rotifers dominated the zooplankton over the experiment time with species identified like Philodina and Lecane bulla species. It could be concluded that cellulose may be considered as efficient carbon source in terms of water parameters stability and fish growth performance under biofloc system conditions. Key Words: biofloc carbon sources, molasses, cellulose, starch, glucose.
Introduction. Fish has been considered as one of the main concerns globally to overcome world hunger and provide a sustainable source of protein for the world growing population (Godfray et al 2010). To accomplish hunger elimination in the near future, intensifying aquaculture production is a must (FAO 2014). Conventional farming applies high water exchange rate which causes environment pollution due to the aquaculture effluent and provides unsustainable fish product under condition of world water shortage (Tidwell 2012). New techniques were introduced to avoid all the disadvantages of conventional aquaculture and even made great advantages (Crab 2010).
Biofloc technology is one of the eco-friendly systems which includes the activation of heterotrophic bacteria via carbon source in the aquaculture ponds. In presence of carbon nitrogen ratio starting from 10:1 the bacteria consume nitrogen and increase the bacterial population (Avnimelech 1999). Biofloc system has a major advantage of being a nearly zero water exchange system and applying no stress on fish due to water exchange (Crab et al 2007; De Schryver et al 2008; Crab et al 2009; Crab et al 2012; Nevejan et al 2018). Flocs of bacteria and zooplankton organisms together with feed residuals are considered as a secondary feed source with high protein content. In addition, the biofloc contributes to the overall protein percentage delivered in the feed which lowers the cost of the feed formula (Burford et al 2004; Wasielesky et al 2006; Hatem et al 2013; Wasielesky et al 2013; Khalil et al 2016; Zidan et al 2017; El-Husseiny et al 2017). Many researches discussed the use of different carbon sources and their effect on water quality and performance of both fish and shrimp culture in biofloc system. Black tiger shrimp (Penaeus monodon) exhibited

AACL Bioflux, 2018, Volume 11, Issue 3. http://www.bioflux.com.ro/aacl 783
better growth performance and immune responses in biofloc system supplemented with rice flour compared to beet molasses (Kumar et al 2017). Highly degradable carbon sources as molasses and dextrose had better effect on biofloc water quality compared to low degradable ones as rice bran in both nursery and grow out phases of Litopenaeus vannamei (Serra et al 2015). Biofloc grown on glycerol inoculated with Bacillus spores showed better protein content than the one grown in glycerol and glucose treatments and resulted in better survival rates and biochemical analysis of Macrobrachium rosenbergii (Crab et al 2010). Wang et al (2016) found that a combination of different carbon sources (molasses 60% + corn flour 20% + wheat bran 20%) achieved better enzymatic activity and growth performance in L. vannamei juveniles under biofloc system. Despite that sweet potato resulted in lower total ammonia-nitrogen (TAN), NO2, NO3 in a study of Caipang et al (2015), a better feed conversion ratio (FCR) was noticed for tilapia reared under wheat flour treatment. Different carbon sources; molasses, sugar or cassava starch had no influence on tilapia growth performance cultured under biofloc systems. However, molasses and sugar promoted better microbial floc formation (Silva et al 2017).
More research is required to clarify the effect of carbon sources of different complexity on zooplankton community, fatty acid profile and tilapia performance. Therefore, the current study aimed to investigate the effect of simple carbon sources (glucose, starch and molasses) versus more complex ones (cellulose) on water quality analysis, zooplankton communities and the fatty acid profile of microbial flocs.
Material and Method Fish and experimental conditions. The present study was carried out in October- November 2014 at the Fish Nutrition Laboratory (FNL), Department of Animal Production, Faculty of Agriculture, Cairo University, Egypt. Nile tilapia (Oreochromis niloticus) fingerlings were obtained from a commercial hatchery located in Kafr El-Sheikh Governorate, Egypt, and were adapted to the experimental conditions. After acclimation period, 120 Nile tilapia fingerlings with an average body weight of 9.14±0.06 g were randomly distributed. Twelve circular plastic tanks (55 L) were used as an experimental unit for different treatment in triplicate representing four treatments. Each tank was stocked with 10 fish corresponding to the density of 1.66 kg m-3 and were supplied with well water and aerated with air stones for the experiment duration of 30 days. Experimental design. The experimental design was completely randomized, where four carbon sources; glucose, starch, molasses and cellulose were examined for their effect on water quality, zooplankton communities and the fatty acid profile of biofloc. Fish were fed according to their body weight 4% twice daily (9:00 h and 17:00 h) on a basal diet (302 g kg-1 crude protein and 4560.70 Kcal kg-1 gross energy) (Table 1). Water quality. Dissolved oxygen (DO), water temperature and pH were measured daily using Lovibond® Tintometer® water testing device and Milwaukee ph600 digital pocket pen. Total suspended solids, ammonia nitrogen (NH3-N), nitrite (NO2-N) and nitrate (NO3-N) values were determined weekly using Lovibond® Multidirect device. Biofloc volume was measured weekly after 15-20 minutes of sedimentation using Imhoff cone (Avnimelech & Kochba 2009). Alkalinity was measured at the end of the experiment by titration with sulphuric acid (0.02%) to sample solution (50 mL) till the pH value reaches 4.5 (Boyd & Tucker 1992).
AACL Bioflux, 2018, Volume 11, Issue 3. http://www.bioflux.com.ro/aacl 784
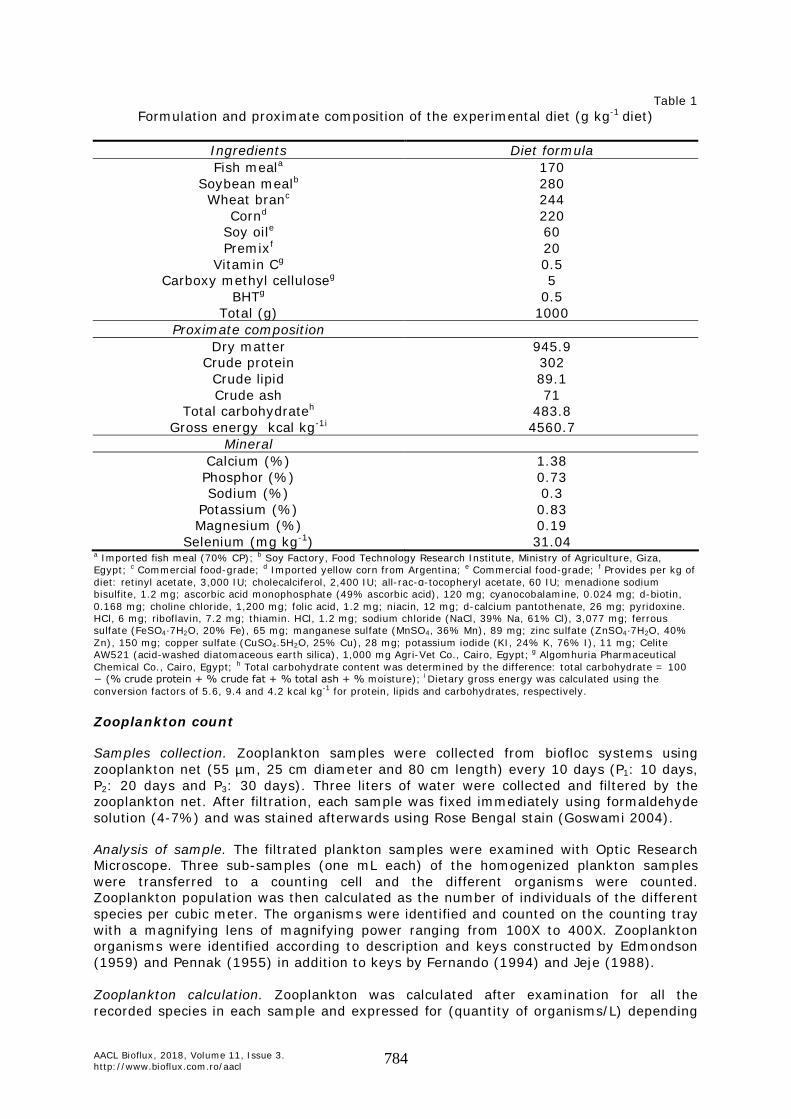
Table 1 Formulation and proximate composition of the experimental diet (g kg-1 diet)
Ingredients Diet formula Fish meala 170
Soybean mealb 280 Wheat branc 244
Cornd 220 Soy oile 60 Premixf 20
Vitamin Cg 0.5 Carboxy methyl celluloseg 5
BHTg 0.5 Total (g) 1000
Proximate composition Dry matter 945.9
Crude protein 302 Crude lipid 89.1 Crude ash 71
Total carbohydrateh 483.8 Gross energy kcal kg-1i 4560.7
Mineral Calcium (%) 1.38 Phosphor (%) 0.73 Sodium (%) 0.3
Potassium (%) 0.83 Magnesium (%) 0.19
Selenium (mg kg-1) 31.04 a Imported fish meal (70% CP); b Soy Factory, Food Technology Research Institute, Ministry of Agriculture, Giza, Egypt; c Commercial food-grade; d Imported yellow corn from Argentina; e Commercial food-grade; f Provides per kg of diet: retinyl acetate, 3,000 IU; cholecalciferol, 2,400 IU; all-rac-α-tocopheryl acetate, 60 IU; menadione sodium bisulfite, 1.2 mg; ascorbic acid monophosphate (49% ascorbic acid), 120 mg; cyanocobalamine, 0.024 mg; d-biotin, 0.168 mg; choline chloride, 1,200 mg; folic acid, 1.2 mg; niacin, 12 mg; d-calcium pantothenate, 26 mg; pyridoxine. HCl, 6 mg; riboflavin, 7.2 mg; thiamin. HCl, 1.2 mg; sodium chloride (NaCl, 39% Na, 61% Cl), 3,077 mg; ferrous sulfate (FeSO4·7H2O, 20% Fe), 65 mg; manganese sulfate (MnSO4, 36% Mn), 89 mg; zinc sulfate (ZnSO4·7H2O, 40% Zn), 150 mg; copper sulfate (CuSO4.5H2O, 25% Cu), 28 mg; potassium iodide (KI, 24% K, 76% I), 11 mg; Celite AW521 (acid-washed diatomaceous earth silica), 1,000 mg Agri-Vet Co., Cairo, Egypt; g Algomhuria Pharmaceutical Chemical Co., Cairo, Egypt; h Total carbohydrate content was determined by the difference: total carbohydrate = 100 − (% crude protein + % crude fat + % total ash + % moisture); i Dietary gross energy was calculated using the conversion factors of 5.6, 9.4 and 4.2 kcal kg-1 for protein, lipids and carbohydrates, respectively. Zooplankton count Samples collection. Zooplankton samples were collected from biofloc systems using zooplankton net (55 µm, 25 cm diameter and 80 cm length) every 10 days (P1: 10 days, P2: 20 days and P3: 30 days). Three liters of water were collected and filtered by the zooplankton net. After filtration, each sample was fixed immediately using formaldehyde solution (4-7%) and was stained afterwards using Rose Bengal stain (Goswami 2004). Analysis of sample. The filtrated plankton samples were examined with Optic Research Microscope. Three sub-samples (one mL each) of the homogenized plankton samples were transferred to a counting cell and the different organisms were counted. Zooplankton population was then calculated as the number of individuals of the different species per cubic meter. The organisms were identified and counted on the counting tray with a magnifying lens of magnifying power ranging from 100X to 400X. Zooplankton organisms were identified according to description and keys constructed by Edmondson (1959) and Pennak (1955) in addition to keys by Fernando (1994) and Jeje (1988). Zooplankton calculation. Zooplankton was calculated after examination for all the recorded species in each sample and expressed for (quantity of organisms/L) depending
AACL Bioflux, 2018, Volume 11, Issue 3. http://www.bioflux.com.ro/aacl 785
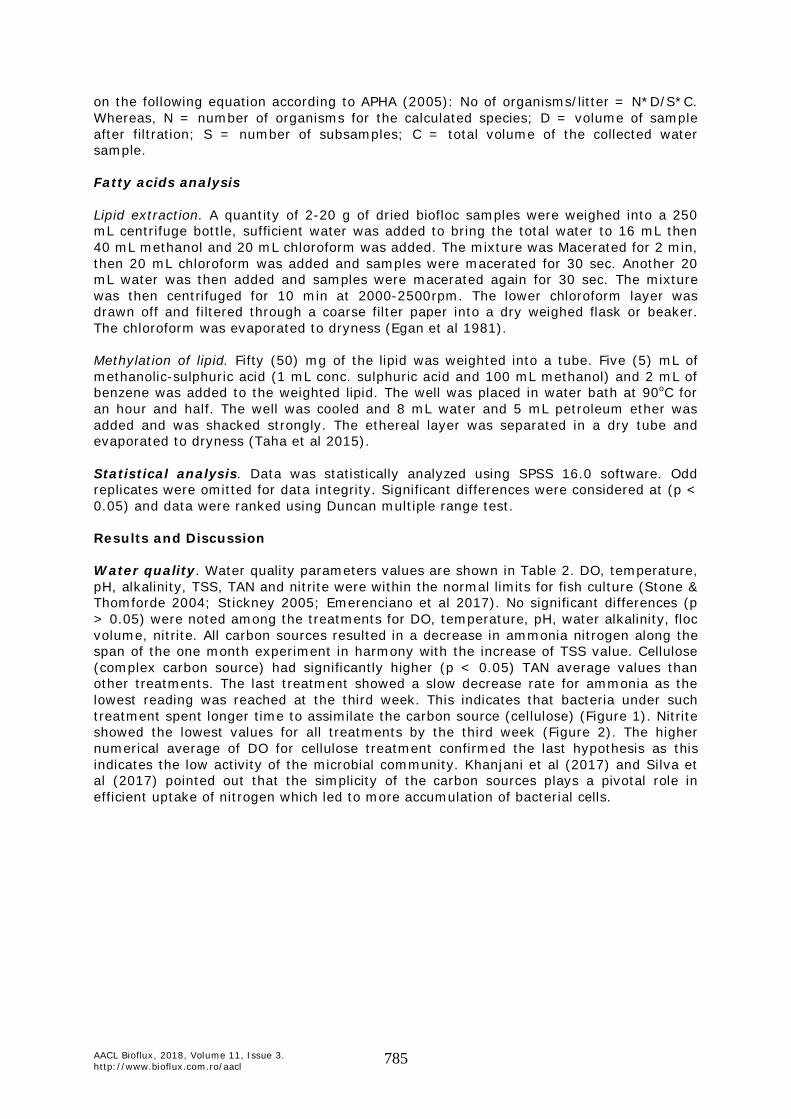
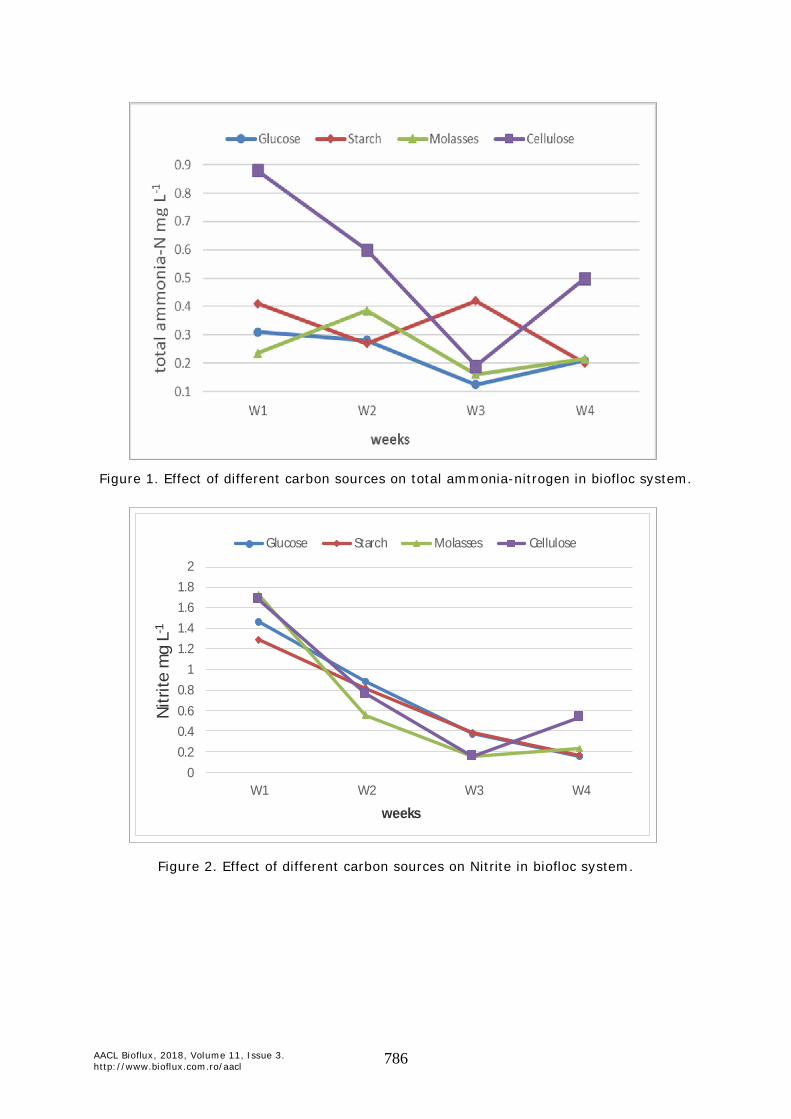
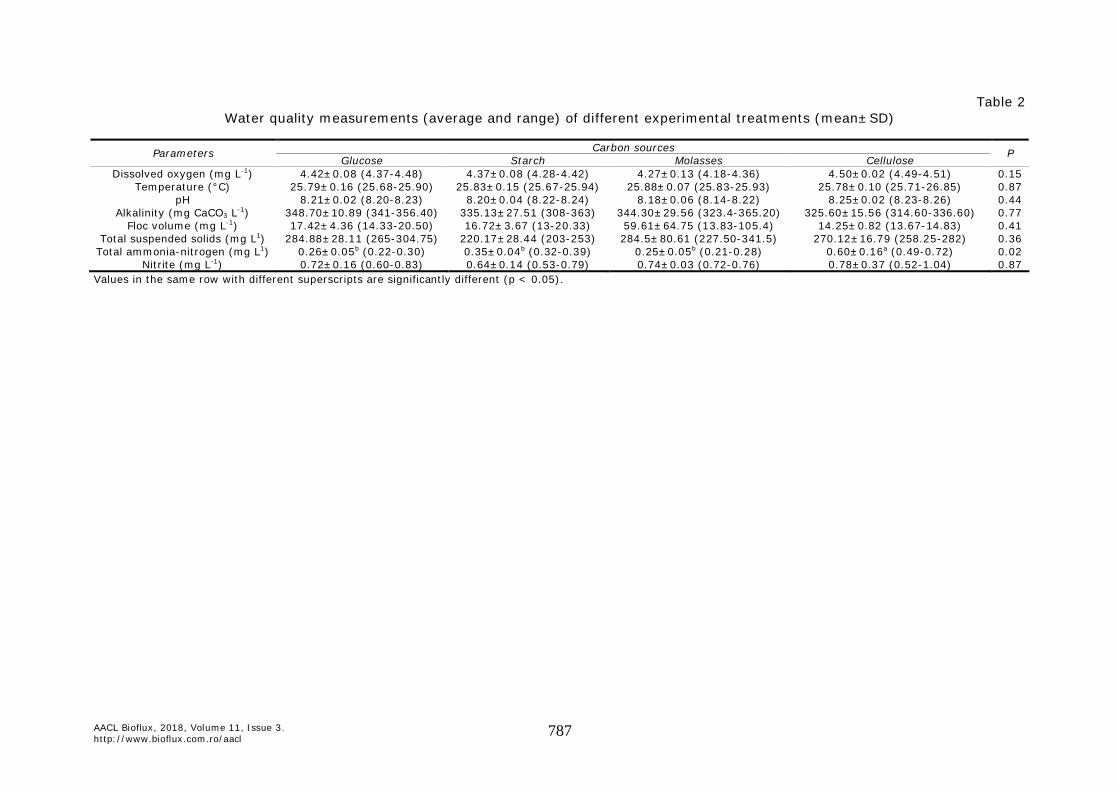
on the following equation according to APHA (2005): No of organisms/litter = N*D/S*C. Whereas, N = number of organisms for the calculated species; D = volume of sample after filtration; S = number of subsamples; C = total volume of the collected water sample. Fatty acids analysis Lipid extraction. A quantity of 2-20 g of dried biofloc samples were weighed into a 250 mL centrifuge bottle, sufficient water was added to bring the total water to 16 mL then 40 mL methanol and 20 mL chloroform was added. The mixture was Macerated for 2 min, then 20 mL chloroform was added and samples were macerated for 30 sec. Another 20 mL water was then added and samples were macerated again for 30 sec. The mixture was then centrifuged for 10 min at 2000-2500rpm. The lower chloroform layer was drawn off and filtered through a coarse filter paper into a dry weighed flask or beaker. The chloroform was evaporated to dryness (Egan et al 1981). Methylation of lipid. Fifty (50) mg of the lipid was weighted into a tube. Five (5) mL of methanolic-sulphuric acid (1 mL conc. sulphuric acid and 100 mL methanol) and 2 mL of benzene was added to the weighted lipid. The well was placed in water bath at 90oC for an hour and half. The well was cooled and 8 mL water and 5 mL petroleum ether was added and was shacked strongly. The ethereal layer was separated in a dry tube and evaporated to dryness (Taha et al 2015). Statistical analysis. Data was statistically analyzed using SPSS 16.0 software. Odd replicates were omitted for data integrity. Significant differences were considered at (p < 0.05) and data were ranked using Duncan multiple range test. Results and Discussion Water quality. Water quality parameters values are shown in Table 2. DO, temperature, pH, alkalinity, TSS, TAN and nitrite were within the normal limits for fish culture (Stone & Thomforde 2004; Stickney 2005; Emerenciano et al 2017). No significant differences (p > 0.05) were noted among the treatments for DO, temperature, pH, water alkalinity, floc volume, nitrite. All carbon sources resulted in a decrease in ammonia nitrogen along the span of the one month experiment in harmony with the increase of TSS value. Cellulose (complex carbon source) had significantly higher (p < 0.05) TAN average values than other treatments. The last treatment showed a slow decrease rate for ammonia as the lowest reading was reached at the third week. This indicates that bacteria under such treatment spent longer time to assimilate the carbon source (cellulose) (Figure 1). Nitrite showed the lowest values for all treatments by the third week (Figure 2). The higher numerical average of DO for cellulose treatment confirmed the last hypothesis as this indicates the low activity of the microbial community. Khanjani et al (2017) and Silva et al (2017) pointed out that the simplicity of the carbon sources plays a pivotal role in efficient uptake of nitrogen which led to more accumulation of bacterial cells.
AACL Bioflux, 2018, Volume 11, Issue 3. http://www.bioflux.com.ro/aacl 786
Figure 1. Effect of different carbon sources on total ammonia-nitrogen in biofloc system.
Figure 2. Effect of different carbon sources on Nitrite in biofloc system.
00.20.40.60.8
11.21.41.61.8
2
W1 W2 W3 W4
Nitr
ite m
g L-1
weeks
Glucose Starch Molasses Cellulose
AACL Bioflux, 2018, Volume 11, Issue 3. http://www.bioflux.com.ro/aacl 787
Table 2 Water quality measurements (average and range) of different experimental treatments (mean±SD)
Carbon sources Parameters
Glucose Starch Molasses Cellulose P
Dissolved oxygen (mg L-1) 4.42±0.08 (4.37-4.48) 4.37±0.08 (4.28-4.42) 4.27±0.13 (4.18-4.36) 4.50±0.02 (4.49-4.51) 0.15 Temperature (°C) 25.79±0.16 (25.68-25.90) 25.83±0.15 (25.67-25.94) 25.88±0.07 (25.83-25.93) 25.78±0.10 (25.71-26.85) 0.87
pH 8.21±0.02 (8.20-8.23) 8.20±0.04 (8.22-8.24) 8.18±0.06 (8.14-8.22) 8.25±0.02 (8.23-8.26) 0.44 Alkalinity (mg CaCO3 L-1) 348.70±10.89 (341-356.40) 335.13±27.51 (308-363) 344.30±29.56 (323.4-365.20) 325.60±15.56 (314.60-336.60) 0.77
Floc volume (mg L-1) 17.42±4.36 (14.33-20.50) 16.72±3.67 (13-20.33) 59.61±64.75 (13.83-105.4) 14.25±0.82 (13.67-14.83) 0.41 Total suspended solids (mg L1) 284.88±28.11 (265-304.75) 220.17±28.44 (203-253) 284.5±80.61 (227.50-341.5) 270.12±16.79 (258.25-282) 0.36
Total ammonia-nitrogen (mg L1) 0.26±0.05b (0.22-0.30) 0.35±0.04b (0.32-0.39) 0.25±0.05b (0.21-0.28) 0.60±0.16a (0.49-0.72) 0.02 Nitrite (mg L-1) 0.72±0.16 (0.60-0.83) 0.64±0.14 (0.53-0.79) 0.74±0.03 (0.72-0.76) 0.78±0.37 (0.52-1.04) 0.87
Values in the same row with different superscripts are significantly different (p < 0.05).

AACL Bioflux, 2018, Volume 11, Issue 3. http://www.bioflux.com.ro/aacl 788
Growth performance. Growth performances, survival rate and feed utilization results are shown in Table 3. The best growth and feed conversion values were recorded for Nile tilapia in cellulose treatment. While the worst values for the last parameters were noted for Nile tilapia under molasses treatment. No significant (p > 0.05) differences were detected in feed intake and survival rate value among the treatments. It was suggested by many authors that fertilizing biofloc system with different carbon sources had no effect on tilapia or shrimp growth performance. Addition of molasses, sugar or cassava starch showed no effect on the growth performance of tilapia cultured under biofloc system, while a positive effect on microbial floc formation was recorded for both molasses and sugar (Silva et al 2017). The same was suggested by Serra et al (2015) for shrimp cultured under biofloc system where different carbon sources were examined (molasses, sugar, dextrose and rice bran). Supplementing biofloc system with molasses, starch, wheat flour or a mixture of them had no significant effect on shrimp growth Khanjani et al (2017). On the other hand, growth performance of Peneus monodon was higher with addition of jaggery in biofloc system than other carbon sources like cane sugar and molasses (Sakkaravarthi & Sankar 2015). In another study on the same species, rice flour improved growth performance and immune response compared with molasses under biofloc system (Kumar et al 2017). While, Litopenaeus schmitti (white shrimp) had the significant highest growth performance after utilizing brewery residues as a carbon source compared to other carbon sources like sugar cane molasses and cassava flour (Fugimura et al 2015). Meanwhile, mixture of different carbon sources (60% molasses + 20% corn flour + 20% wheat bran) positively affected the growth of L. vannamei in comparison with molasses as a single carbon source (Wang et al 2016).
Table 3 Effect of different treatments on growth performance, feed intake and survival rate (Mean±SE)
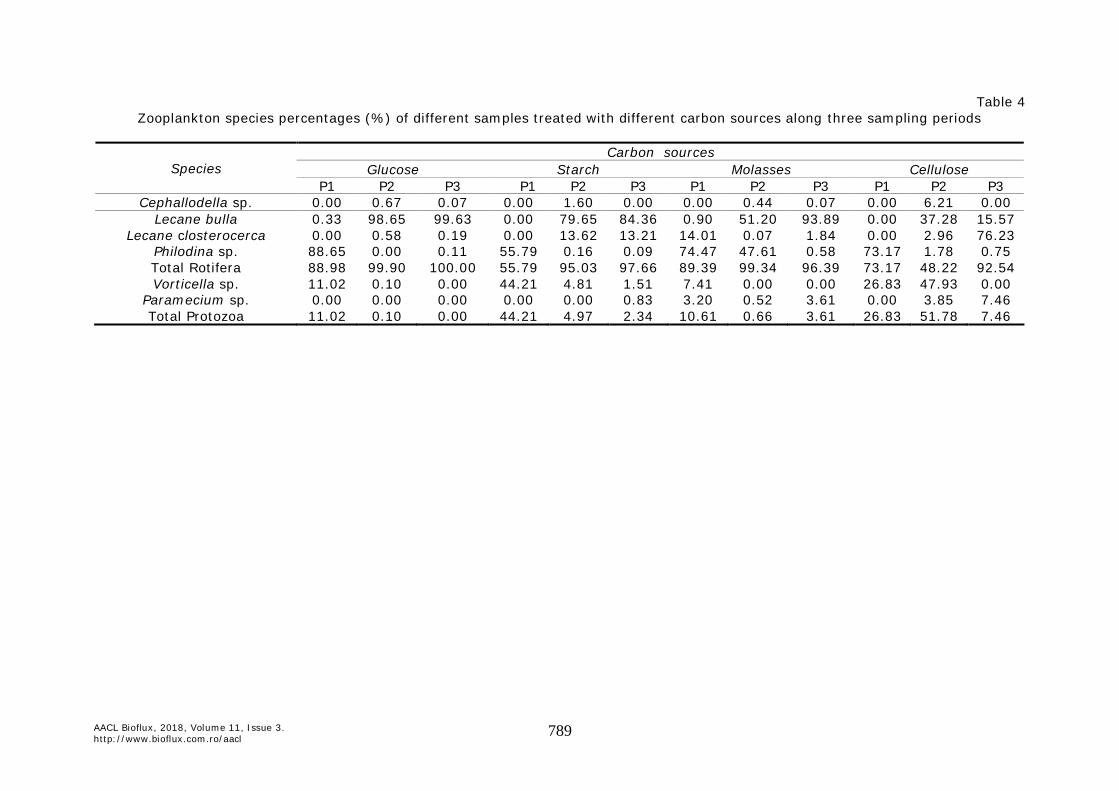
Means in the same row with different superscripts are significantly different (p < 0.05); 1FI - feed intake; 2FCR - feed conversion ratio = feed intake/weight gain. Taxonomical identification of biofloc zooplankton community. The zooplanktons taxonomical distributions of biofloc treatments with different carbon sources were detected along the experimental periods (10, 20 and 30 days) and the results are represented in Table 4 and Figures 3-9. The groups identified were mainly rotifers and protozoa while no nematodes, copepods and other species were discovered in the experiment samples unlike many other studies (Azim & Little 2008; Sakkaravarthi 2015; Rajkumar et al 2016; Manan et al 2016, 2017). This less variety compared to other studies may be related to the short culture period (30 days) and condition. Total zooplankton count increased in all treatments over the experiment time with no significant differences among treatments (Figure 3). Generally, rotifer group (mainly Lecane bulla and Philodina species) dominated the biofloc medium with exception of cellulose treatment value at P2, where protozoa showed higher values (Table 4). The rotifers are grazing species (Manan et al 2017), that consume protozoa which may be an explanation for the current experiment results as protozoa percentage was mostly lower than rotifer in biofloc composition (Table 4). A poor correlation was noticed among total zooplankton count and the biofloc TSS, which suggest that TSS had no effect on the zooplankton count during the experimental periods (P1, P2 and P3) (r2 = 0.13, -0.18 and 0.35, respectively).
Carbon sources Parameters Glucose Starch Molasses cellulose
P
Average final body weight (g) 12.57±0.44b 11.85±0.20b 11.12±0.46b 14.24±0.68a 0.41 FI1 (average feed intake) (g) 8.70±0.06 8.82±0.10 9.33±0.71 9.63±0.59 0.02
FCR2 2.61±0.40b 3.32±0.35b 6.50±1.16a 2.13±0.05b 0.01 Survival rate (%) 100±0 100±00 95±5 95±5 0.49
AACL Bioflux, 2018, Volume 11, Issue 3. http://www.bioflux.com.ro/aacl 789
Table 4 Zooplankton species percentages (%) of different samples treated with different carbon sources along three sampling periods
Carbon sources
Glucose Starch Molasses Cellulose
Species P1 P2 P3 P1 P2 P3 P1 P2 P3 P1 P2 P3
Cephallodella sp. 0.00 0.67 0.07 0.00 1.60 0.00 0.00 0.44 0.07 0.00 6.21 0.00 Lecane bulla 0.33 98.65 99.63 0.00 79.65 84.36 0.90 51.20 93.89 0.00 37.28 15.57
Lecane closterocerca 0.00 0.58 0.19 0.00 13.62 13.21 14.01 0.07 1.84 0.00 2.96 76.23 Philodina sp. 88.65 0.00 0.11 55.79 0.16 0.09 74.47 47.61 0.58 73.17 1.78 0.75 Total Rotifera 88.98 99.90 100.00 55.79 95.03 97.66 89.39 99.34 96.39 73.17 48.22 92.54 Vorticella sp. 11.02 0.10 0.00 44.21 4.81 1.51 7.41 0.00 0.00 26.83 47.93 0.00
Paramecium sp. 0.00 0.00 0.00 0.00 0.00 0.83 3.20 0.52 3.61 0.00 3.85 7.46 Total Protozoa 11.02 0.10 0.00 44.21 4.97 2.34 10.61 0.66 3.61 26.83 51.78 7.46

AACL Bioflux, 2018, Volume 11, Issue 3. http://www.bioflux.com.ro/aacl 790
Figure 3. Total zooplankton count of different carbon sources in biofloc system for different periods.
Figure 4. Philodina sp. count of different carbon sources in biofloc system for different periods.
Figure 5. Lecane bulla count of different carbon sources in biofloc system for different periods.
0
50000
100000
150000
200000
250000
period 1 period 2 period 3
Org
anis
ms/
Lite
r
Glucose Starch Molasses Cellulose
0
5000
10000
15000
20000
25000
30000
35000
40000
45000
50000
P1 P2 P3
Org
anis
ms/
Lite
r
Glucose Starch Molasses Cellulose
0
20000
40000
60000
80000
100000
120000
140000
160000
180000
200000
period 1 period 2 period 3
Org
anis
ms/
Lite
r
Glucose Starch Molasses Cellulose

AACL Bioflux, 2018, Volume 11, Issue 3. http://www.bioflux.com.ro/aacl 791
Fatty acids analysis. Fatty acids profiles of different biofloc samples are presented in Table 5. No significant differences were recorded between glucose (simple carbon source) and cellulose (complex carbon source), which is in contrast with the findings of Crab et al (2010) and Ekasari et al (2010). They described that biofloc fatty acids profile richness depended on the carbon source applied. Total saturated fatty acids showed higher ranges (41.6-51.4%) in comparison with the value (10.76%) recorded by Ekasari et al (2010) who grown biofloc on glucose. Azim & Little (2008) used wheat flour (complex carbon source) and showed lower values for total saturated fatty acids (30.2%). As for mono saturated fatty acids, our results (27.41-30.43%) were similar to that recorded by Azim & Little (2008). Total n-6 fatty acids percentages were lower in our study than previous authors which may be due to the richness of their biofloc as it was pre-inoculated from a tilapia farm source in a study of Ekasari et al (2010) and longer experimental period (12 weeks) in the case of Azim & Little (2008) study. Short experimental period in our case may resulted in low zooplankton biodiversity, subsequently poor biofloc fatty acids profile. Protozoa, Rotifera, Oligochaeta, Paramecium, Tetrahymena and Petalomonas were identified in the aforementioned study (Azim & Little 2008), while Rotifera and Protozoa represented the zooplankton community in our case.
Figure 6. Percentage of total rotifer and protozoa in glucose treatment.
Figure 7. Percentage of total rotifer and protozoa in starch treatment.
Figure 8. Percentage of total rotifer and protozoa in molasses treatment.
Figure 9. Percentage of total rotifer and protozoa of cellulose treatment.

AACL Bioflux, 2018, Volume 11, Issue 3. http://www.bioflux.com.ro/aacl 792
Table 5 Fatty acids percentage profile of biofloc samples acquired from four different carbon
sources (values are mean±SE)
Carbon sources Fatty acid (%) Glucose *Starch *Molasses Cellulose
P
C6:0 0.11±0.11 ND ND 0.08±0.08 0.86 C8:0 0.03±0.03 0.06 ND 0.05±0.01 0.62 C11:0 0.17±0.17 ND ND 0.29±0.02 0.60 C12:0 2.79±0.12 2.77 3.64 2.48±0.11 0.21 C13:0 6.68±0.27 5.99 8.64 6.25±0.21 0.34 C14:0 9.31±0.75 8.19 13.77 9.76±1.48 0.81 C14:1 7.05±4.88 2.23 14.92 6.37±4.41 0.93 C15:0 16.28±0.64 14.28 19.67 16.94±0.68 0.55 C15:1 9.51±0.45 7.97 11.68 9.60±0.23 0.87 C16:0 11.72±2.12 10.32 ND 12.30±0.79 0.82 C16:1 4.50±0.69 3.62 3.3 4.71±0.41 0.81 C18:0 4.30±4.30 ND ND ND 0.42
C18:1n7 2.09±2.09 10.88 ND 5.00±0.67 0.32 C18:1n9 4.27±0.09 5.73 ND 3.32±0.24 0.07 C18:2n6 1.20±1.20 4.36 ND 1.31±1.30 0.96 C18:3n3 2.18 ± 2.18 ND ND ND 0.42 ∑ Sat. 51.41±3.64 41.6 45.72 48.17±1.59 0.50
∑ Mono-Unsat. 27.41±3.84 30.43 29.91 29.01±4.14 0.80 ∑ Poly-Unsat. 3.39±1.38 4.36 ND 1.31±1.31 0.33
∑ ω 6 1.20±1.20 4.36 ND 1.31±1.31 0.96 ∑ ω 3 2.18±2.18 ND ND ND 0.42 ∑ ω 9 4.27±0.09 5.73 ND 3.32±0.24 0.07
*Data obtained from one replicate of the treatment; ND = not detected. Conclusions. According to the present study, cellulose as an organic carbon source showed efficiency in contributing to the stability of water quality parameters and the fish performance. This suggests the ability of using agricultural by-products as a carbon sources for biofloc system which is more economical and eco-friendly. Acknowledgments. This study was included in the project “Development of a biofloc technology for high intensive and organic production of tilapia, mullet and freshwater shrimp under desert conditions” funded by Science & Technology Development Fund (STDF), Egypt, no. 5671. References American Public Health Association (APHA), 2005 Standard methods for the
examination of water and wastewater. 20th edition, American Public Health Association (APHA), Washington, DC, USA, 2671 pp.
Avnimelech Y., 1999 Carbon/nitrogen ratio as a control element in aquaculture systems. Aquaculture 176(3-4):227-235.
Avnimelech Y., Kochba M., 2009 Evaluation of nitrogen uptake and excretion by tilapia in bio floc tanks, using 15N tracing. Aquaculture 287(1-2):163-168.
Azim M. E., Little D. C., 2008 The biofloc technology (BFT) in indoor tanks: water quality, biofloc composition, and growth and welfare of Nile tilapia (Oreochromis niloticus). Aquaculture 283(1-4):29-35.
Boyd C. E., Tucker C. S., 1992 Water quality and pond soil analyses for aquaculture. Alabama Agricultural Experiment Station, Auburn University, 183 pp.
AACL Bioflux, 2018, Volume 11, Issue 3. http://www.bioflux.com.ro/aacl 793
Burford M. A., Thompson P. J., McIntosh R. P., Bauman R. H., Pearson D. C., 2004 The contribution of flocculated material to shrimp (Litopenaeus vannamei) nutrition in a high-intensity, zero-exchange system. Aquaculture 232(1-4):525-537.
Caipang C. M. A., Choo H. X., Bai Z., Huang H., Lay-yag C. M., 2015 Viability of sweet potato flour as carbon source for the production of biofloc in freshwater culture of tilapia, Oreochromis sp. International Aquatic Research 7(4):329-336.
Crab R., 2010 Bioflocs technology: an integrated system for the removal of nutrients and simultaneous production of feed in aquaculture. Doctoral dissertation, Faculty of Bioscience Engineering, Ghent University, 178 pp.
Crab R., Avnimelech Y., Defoirdt T., Bossier P., Verstraete W., 2007 Nitrogen removal techniques in aquaculture for a sustainable production. Aquaculture 270(1-4):1-14.
Crab R., Kochva M., Verstraete W., Avnimelech Y., 2009 Bio-flocs technology application in over-wintering of tilapia. Aquacultural Engineering 40:105-112.
Crab R., Chielens B., Wille M., Bossier P., Verstraete W., 2010 The effect of different carbon sources on the nutritional value of bioflocs, a feed for Macrobrachium rosenbergii postlarvae. Aquaculture Research 41(4):559-567.
Crab R., Defoirdt T., Bossier P., Verstraete W., 2012 Biofloc technology in aquaculture: beneficial effects and future challenges. Aquaculture 356-357:351-356.
De Schryver P., Crab R., Defoirdt T., Boon N., Verstraete W., 2008 The basics of bio-flocs technology: the added value for aquaculture. Aquaculture 277(3-4):125-137.
Edmondson W. T., 1966 Fresh water biology. 2nd edition, John Wiley & Sons Inc., New York & London, 1248 pp.
Egan H., Kirk R. S., Sawyer R., 1981 Pearson's chemical analysis of foods. 8th edition, Churchill Livingstone, New York, 591 pp.
Ekasari J., Crab R., Verstraete W., 2010 Primary nutritional content of bio-flocs cultured with different organic carbon sources and salinity. HAYATI Journal of Biosciences 17(3):125-130.
El-Husseiny O. M., Wassef E. A., Aboseif A. M., Suloma A., 2017 Manipulating diet composition to develop and maintain the zooplankton for Nile tilapia under biofloc condition. African J Biol Sci 13(1):147-154.
Emerenciano M. G. C., Martínez-Córdova L. R., Martínez-Porchas M., Miranda-Baeza A., 2017 Biofloc technology (BFT): a tool for water quality management in aquaculture. In: Water quality. InTech, pp. 91-109.
Food and Agriculture Organization of The United Nation (FAO), 2014 The State of World Fisheries and Aquaculture 2014. Sofia, ISBN: 978-92-5-108275-1, 243 pp.
Fernando C. H., 1994 Zooplankton, fish and fisheries in tropical freshwaters. Hydrobiologia 272(1-3):105-123.
Fugimura M. M. S., dos Reis Flor H., de Melo E. P., da Costa T. V., Wasielesky W., Oshiro L. M. Y., 2015 Brewery residues as a source of organic carbon in Litopenaeus schmitti white shrimp farms with BFT systems. Aquaculture International 23(2):509-522.
Godfray H. C., Beddington J. R., Crute I. R., Haddad L., Lawrence D., Muir J. F., Pretty J., Robinson S., Thomas S. M., Toulmin C., 2010 Food security: the challenge of feeding 9 billion people. Science 327(5967):812-818.
Goswami S. C., 2004 Zooplankton methodology, collection and identyification - a field manual. Dhargalkar V. K., Verlecar X. N. (eds), National Institute of Oceanography, Dona Paula, Goa - 403 004, 26 pp.
Hatem M. H., Abdelhay Y. B., Alayafi A. H., Suloma A., 2013 Application of new strategies to reduce suspended solids in zero-exchange system: I. Histological alterations in the gills of Nile tilapia. Journal of Applied Sciences Research 9(2): 1186-1192.
Jeje C. Y., 1988 A revision of the Nigerian species of the genera Mesocyclops Sars, 1914 and Thermocyclops Kiefer, 1927 (Copepoda: Cyclopoida). Hydrobiologia 164(2):171-184.

AACL Bioflux, 2018, Volume 11, Issue 3. http://www.bioflux.com.ro/aacl 794
Khalil M. T., Mohamed R. A. R., El-Deeb R., Suloma A., Abd-alatty B. S., Henish S. A., 2016 Eco-friendly cultivation of Keeled mullet (Liza carinata) in biofloc system. Egyptian Journal of Aquatic Biology and Fisheries 20(2):23-35.
Khanjani M. H., Sajjadi M. M., Alizadeh M., Sourinejad I., 2017 Nursery performance of Pacific white shrimp (Litopenaeus vannamei Boone, 1931) cultivated in a biofloc system: the effect of adding different carbon sources. Aquaculture Research 48(4):1491-1501.
Kumar S., Anand P. S. S., De D., Deo A. D., Ghoshal T. K., Sundaray J. K., Ponniah A. G., Jithendran K. P., Raja R. A., Biswas G., Lalitha N., 2017 Effects of biofloc under different carbon sources and protein levels on water quality, growth performance and immune responses in black tiger shrimp Penaeus monodon (Fabricius, 1978). Aquaculture Research 48(3):1168-1182.
Manan H., Moh J. H. Z., Kasan N. A., Mhd I., 2016 Biofloc application in closed hatchery culture system of Pacific white shrimp, Penaeus vannamei in sustaining the good water quality management. Journal of Fisheries and Aquatic Science 11(4):278-286.
Manan H., Moh J. H. Z., Kasan N. A., Suratman S., Mhd I., 2017 Identification of biofloc microscopic composition as the natural bioremediation in zero water exchange of Pacific white shrimp, Penaeus vannamei, culture in closed hatchery system. Applied Water Science 7(5):2437-2446.
Nevejan N., De Schryver P., Wille M., Dierckens K., Baruah K., Van Stappen G., 2018 Bacteria as food in aquaculture: do they make a difference? Reviews in Aquaculture 10(1):180-212.
Pennak R. W., 1955 Fresh-water invertebrates of the United States. Hydrobiologia 7(1):126-126.
Rajkumar M., Pandey P. K., Aravind R., Vennila A., Bharti V., Purushothaman C. S., 2016 Effect of different biofloc system on water quality, biofloc composition and growth performance in Litopenaeus vannamei (Boone, 1931). Aquaculture Research 47(11):3432-3444.
Sakkaravarthi K., 2015 Determination of effective microbial community for biofloc shrimp culture system. International Journal of Fisheries and Aquatic Studies 3(1):276-281.
Sakkaravarthi K., Sankar G., 2015 Identification of effective organic carbon for biofloc shrimp culture system. Journal of Biological Sciences 15:144-149.
Serra F. P., Gaona C. A. P., Furtado P. S., Poersch L. H., Wasielesky W., 2015 Use of different carbon sources for the biofloc system adopted during the nursery and grow-out culture of Litopenaeus vannamei. Aquaculture International 23(6):1325-1339.
Silva U. L., Falcon D. R., Da Cruz Pessoa M. N., Correia E. D. S., 2017 Carbon sources and C:N ratios on water quality for Nile tilapia farming in biofloc system. Revista Caatinga 30(4):1017-1027.
Stickney R. R., 2005 Aquaculture: an introductory text. CABI Publishing, 265 pp. Stone N. M., Thomforde H. K., 2004 Understanding your fish pond water analysis
report. Cooperative Extension Program, University of Arkansas at Pine Bluff, US Department of Agriculture and county governments cooperating, 4 pp.
Taha N. M., Mandour A. E. W. A., Lebda M. A., Abo Hashem R. M., El Houshy S. M., 2015 Biochemical study on lipid profile and lipid peroxidation in frozen meat. Alexandria Journal for Veterinary Sciences 44(1):59-66.
Tidwell J. H., 2012 Aquaculture production systems. Wiley-Blackwell, 440 pp. Wang C., Pan L., Zhang K., Xu W., Zhao D., Mei L., 2016 Effects of different carbon
sources addition on nutrition composition and extracellular enzymes activity of bioflocs, and digestive enzymes activity and growth performance of Litopenaeus vannamei in zero-exchange culture tanks. Aquaculture Research 47(10):3307-3318.

AACL Bioflux, 2018, Volume 11, Issue 3. http://www.bioflux.com.ro/aacl 795
Wasielesky Jr. W., Atwood H., Stokes A., Browdy C. L., 2006 Effect of natural production in a zero exchange suspended microbial floc based super-intensive culture system for white shrimp Litopenaeus vannamei. Aquaculture 258(1-4):396-403.
Wasielesky Jr. W., Froes C., Fóes G., Krummenauer D., Lara G., Poersch L., 2013 Nursery of Litopenaeus vannamei reared in a biofloc system: the effect of stocking densities and compensatory growth. Journal of Shellfish Research 32(3):799-806.
Zidan A. E. N. F. A., Mola H. R. A., El-Husseiny O. M., Suloma A., Mabroke R. S., 2017 Inclusion of biofloc meal in tilapia diets and its effect on the structure of zooplankton community under biofloc system condition. Journal of Egyptian Academic Society for Environmental Development 18(1):47-57.
Received: 29 March 2018. Accepted: 31 May 2018. Published online: 17 June 2018. Authors: Mohamed Hamdy M. El-Shafiey, Faculty of Agriculture, Cairo University, Giza 12613, Egypt, e-mail: [email protected] Rania Said Mabroke, Faculty of Agriculture, Cairo University, Giza 12613, Egypt, e-mail: [email protected] Hesham Reda Abdel Mola, National Institute of Oceanography and Fisheries (NIOF), Cairo 11516, Egypt, e-mail: [email protected] Mohamed Shaban Hassaan, National Institute of Oceanography and Fisheries (NIOF), Cairo 11516, Egypt, e-mail: [email protected] Ashraf Suloma, Faculty of Agriculture, Cairo University, Giza 12613, Egypt, e-mail: [email protected] This is an open-access article distributed under the terms of the Creative Commons Attribution License, which permits unrestricted use, distribution and reproduction in any medium, provided the original author and source are credited. How to cite this article: El-Shafiey M. H. M., Mabroke R. S., Mola H. R. A., Hassaan M. S., Suloma A., 2018 Assessing the suitability of different carbon sources for Nile tilapia, Oreochromis niloticus culture in BFT system. AACL Bioflux 11(3):782-795.