Embed Size (px)
Citation preview

Zhang and Carciofo BMC Psychol (2021) 9:69 https://doi.org/10.1186/s40359-021-00569-8
RESEARCH ARTICLE
Assessing the wellbeing of Chinese university students: validation of a Chinese version of the college student subjective wellbeing questionnaireYan Zhang and Richard Carciofo*
Abstract
Background: In response to the rising concern with promoting the wellbeing of university students and relative lack of domain-specific wellbeing measurement instruments in China, the current study aimed to validate a Chinese version of the College Student Subjective Wellbeing Questionnaire (CSSWQ), a 16-item self-report English-language rating scale assessing four aspects of wellbeing (academic satisfaction, academic efficacy, school connectedness, and college gratitude).
Methods: The Chinese translation of the CSSWQ, the Students’ Life Satisfaction Scale, the Positive and Negative Affect Schedule, the 10-Item Big Five Personality Inventory, and demographic questions were completed by 252 Chinese students at a university in Suzhou, China.
Results: Exploratory factor analysis found four factors each with the same four items as in the original English scale. Each subscale showed good internal consistency. Test–retest for a one-month interval showed generally moderate reliability. As predicted, Pearson correlational analysis found positive correlations between the Chinese CSSWQ and life satisfaction, positive affect, extraversion, and GPA, and negative correlations with neuroticism and negative affect. Monthly income had small negative correlations with academic satisfaction and academic efficacy, smoking had a small positive correlation with school connectedness, and exercise had a small positive correlation with academic efficacy.
Conclusion: Data for the Chinese CSSWQ in the current study showed validity and reliability, supporting the use of this instrument as a measurement of college student wellbeing in China.
Keywords: Chinese students, Student wellbeing, Questionnaire validation, Determinants of wellbeing, Positive psychology, Subjective happiness
© The Author(s) 2021. Open Access This article is licensed under a Creative Commons Attribution 4.0 International License, which permits use, sharing, adaptation, distribution and reproduction in any medium or format, as long as you give appropriate credit to the original author(s) and the source, provide a link to the Creative Commons licence, and indicate if changes were made. The images or other third party material in this article are included in the article’s Creative Commons licence, unless indicated otherwise in a credit line to the material. If material is not included in the article’s Creative Commons licence and your intended use is not permitted by statutory regulation or exceeds the permitted use, you will need to obtain permission directly from the copyright holder. To view a copy of this licence, visit http:// creat iveco mmons. org/ licen ses/ by/4. 0/. The Creative Commons Public Domain Dedication waiver (http:// creat iveco mmons. org/ publi cdoma in/ zero/1. 0/) applies to the data made available in this article, unless otherwise stated in a credit line to the data.
IntroductionMental health problems are an increasing global burden. Using disability adjusted life years (DALYs) as measure-ment of the burden of disease, in 1990, all mental and
behavioural disorders accounted for 5.7% of the global DALYs, while in 2010, their share increased up to 7.4% of the global DALYs [36]. This increase may be due to the diagnosis of newly classified disorders such as childhood disorders and eating disorders, together with historically underestimated disorders such as major depressive disor-der [36], and also related to societal transitions as people
Open Access
*Correspondence: [email protected] of Health and Environmental Sciences, Xi’an Jiaotong-Liverpool University, 111 Ren’ai Road, Suzhou 215123, China

Page 2 of 10Zhang and Carciofo BMC Psychol (2021) 9:69
today face a wider variety of challenges compared to those in the past [21].
For adolescents and young adults aged 15–39, mental and behavioural disorders are one of the main causes of DALYs [36], and attendance at college/university may have an influence on wellbeing. Bewick, Koutsopoulou, Miles, Slaa, and Barkham [3] found that students experi-ence lifetime highest levels of distress after they register at university, which peaks during the first semester and remains stably higher than pre-university levels. College time predominantly features anxiety, while depressive symptoms are less dominant in the beginning and reach their zenith during the final year of study [1, 3, 7]. Major life transitions (e.g., first time far from home, job seek-ing), social challenges (e.g., making friends), and aca-demic challenges (e.g., different teaching/learning styles) may be some influencing factors [28, 40, 48].
Students with mental illnesses show less engage-ment in class and poorer social relationships, which are associated with lower graduation rates [48]. Typically, depression relates to students’ poorer sleep quality, less willingness to do physical activities, higher chance of alcohol abuse, and increased rates of daily cigarette smoking [5, 14, 54], which would increase the risk of cardiovascular diseases, cancer, neurological diseases, etc. [10, 41]. Likewise, the physical health consequences may in turn aggravate one’s psychological problems. Due to such severe potential outcomes, monitoring students’ wellbeing and developing suitable interventions should be included in university planning [30, 43], which should consider external factors (e. g., financial status, social support, and professional help) and internal factors (e. g., personality) [20, 24, 31]. For instance, extraversion pre-dicts more wellbeing [31], and neuroticism predicts less wellbeing [12, 26].
In recent years, with increased concern with promoting mental health, more emphasis has been put on positive aspects of psychology [16]. Commonly used question-naires that investigate people’s wellbeing, focusing on positive feelings and experiences, include the Warwick-Edinburgh Mental Wellbeing Scale (WEMWBS) [52], the Subjective Happiness Scale (SHS) [32], the Personal Growth Initiative Scale (PGIS) [47], and the Students’ Life Satisfaction Scale (SLSS) [23]. Similar to the func-tion of the WEMWBS described by Tennant et al. [52], all of these scales can be useful for monitoring the well-being of groups, investigating determinants of wellbeing at the population level, evaluating programmes and pro-jects which potentially affect wellbeing, and enabling self-reflection before health interventions.
However, there has also been an increasing focus on developing domain-specific measures of wellbeing, rather than relying on more domain-general measures. For
measuring the wellbeing of college students, researchers in the US [45] developed and validated a 15-item, four-subscale self-report rating questionnaire, the College Student Subjective Wellbeing Questionnaire (CSSWQ). Renshaw [44] later developed a 16-item version of the CSSWQ, which includes four categories (academic sat-isfaction, academic efficacy, school connectedness, and college gratitude) in four subscales, which, through wording adaptation, were developed from general life satisfaction, self-efficacy, gratitude, and social connect-edness scales. Renshaw [44] found strong convergent validity with several other domain-general measure-ments, including the Positive and Negative Affect Sched-ule (PANAS), and several additional validity measures, including grade point average (GPA).
The CSSWQ could be a useful instrument in China as well if validated in the Chinese context. Although Chi-nese researchers have translated and validated several scales related to wellbeing, including the Chinese WEM-WBS [11], SHS [37], PGIS [55], SLSS [25], and PANAS [22], none focuses specifically on college students’ wellbeing.
Therefore, the aim of the present study was to translate and validate a Chinese version of the CSSWQ. Validation involved factor analysis of the scale structure, and cor-relations with theoretically related variables. Specifically, it was predicted that CSSWQ scores would correlate positively with life satisfaction, positive affect, extraver-sion and GPA, and negatively with negative affect and neuroticism. Reliability was tested by measures of inter-nal consistency and test–retest reliability. In addition, associations between CSSWQ scores and agreeableness, openness, and conscientiousness were also explored, as were associations with exercise, alcohol drinking, ciga-rette smoking, and money received monthly from family.
MethodologySampleStudents were recruited at a university in Suzhou, China by convenience sampling (N = 252, year 1 = 48.0%, year 2 = 16.7%, year 3 = 21.4%, year 4 = 12.7%, Master = 1.2%); 171 females (67.9%) and 81 males (32.1%). Inclusion criteria were being a Chinese student of the univer-sity, aged at least 18 years. The age range of the partici-pants was from 18 to 27 (mean = 19.49, SD = 1.449). The average age was 19.63 (SD = 1.771) for males and 19.42 (SD = 1.269) for females (t = 0.951, p = 0.344). The sample size was adequate to establish moderate-size correlations with 80% power at the 5% significance level [6].
MaterialsThe cross-sectional survey consisted of the following Chinese-language questionnaires. Considering that the
Page 3 of 10Zhang and Carciofo BMC Psychol (2021) 9:69
topic of an earlier questionnaire might influence/bias how participants respond to a later one [29], all four questionnaires were counter-balanced and 24 different versions of the survey were utilised to give some varia-tion and reduce order effects.
1. The College Student Subjective Wellbeing Question-naire (CSSWQ) [44, 45]
This has 16 items, each scored from 1 (strongly dis-agree) to 7 (strongly agree). The translation of the CSSWQ into Chinese was done by a native Chinese who speaks proficient English. Considering that a matter may be expressed differently in different cul-tures, several wordings were slightly adjusted for better understanding in Chinese sentences while retaining the original meaning, e. g., item 5 replaced “I am a hard worker” in English with “I work hard” in Chinese, and item 12 replaced “like me the way I am” with “like the real me”. Back translation was then done by another native Chinese-speaker with high English proficiency, and then examined and verified by a native English-speaker. The result indicated that the Chinese version conveys the same meanings as the original. In addition, pilot tests of the CSSWQ-Chinese were done on native Chinese-speakers who checked the wording of the CSSWQ-Chinese and suggested that the context is meaningful.
2. The Students’ Life Satisfaction Scale (SLSS) [23],Chi-nese version: [25]
The SLSS contains 5 items scored from 1 (strongly disagree) to 6 (strongly agree). The wording of an item which includes reference to “most kids”, was changed from ‘kids’ to ‘people’.
3. The Positive and Negative Affect Schedule (PANAS) [53],Chinese version: [22]
The PANAS consists of 10 items for positive affect and 10 items for negative affect, each scored from 1 (very slightly or not at all) to 5 (extremely).
4. The 10-Item Big Five Personality Inventory (BFI-10)[42],Chinese version: [4]
The BFI-10 consists of two items for each big five dimension (extraversion, agreeableness, conscien-tiousness, neuroticism, and openness), scored from 1 (disagree strongly) to 5 (agree strongly), with 5 items reverse-scored.
5. Demographic questions
These included self-reported GPA, frequency of exer-cise, frequency of drinking alcohol, frequency of smok-ing, and money received monthly from family. Response options for GPA ranged from “bad” to “excellent”, scored 1–5. Response options for exercise and drinking ranged
from “never” to “almost every day”, scored 1–5. Response options for smoking ranged from “never” to “on aver-age > 10 per day”, scored 1–5. Response options for money ranged from < 500rmb (Chinese Yuan, approxi-mately 76 US dollars) to > 5500rmb (approximately 840 US dollars), in 500rmb intervals, scored from 1 to 16.
ProcedurePotential participants were approached on the university campus. Paper copies of the questionnaire began with a briefing which explained the aims of the study, and that: participation was voluntary; participation could be with-drawn at any time; the questionnaires would be kept con-fidential, and the data would be anonymised. Students who agreed to do the retest provided an email address for this purpose, and received a retest email 4 weeks after the first survey. All participants gave signed informed consent, and 71 participants completed the retest. The study protocol was reviewed and approved by the fac-ulty supervisor in accordance with research policies of Xi’an Jiaotong-Liverpool University, and in accordance with the guidelines of the university’s Research Ethics Sub-Committee.
Data analysisAll questionnaires had complete responses except for one participant missing a response for monthly money received from family, and one participant with multiple responses for this item. These two cases were excluded from analysis for this item. Also, one participant had a single missing response for one of the PANAS items. The participant’s mean score for the corresponding subscale was used as a substitute value for the missing response. Finally, one participant failed to complete any PANAS items (leaving N = 251 for the PANAS). Exploratory fac-tor analysis (EFA) was used to check the structure of the CSSWQ-Chinese, using maximum likelihood estimation and Promax rotation, as used in the original CSSWQ study [45]. Testing new translations of scales with EFA may reveal culture-specific differences in the scale struc-ture, or differences due to the translation process [38]. Descriptive statistics (mean, standard deviation, range, skewness, kurtosis, and Cronbach’s alpha) are provided for each scale and subscale. Pearson correlational analy-sis was conducted to check the construct validity of the CSSWQ-Chinese by assessing whether the CSSWQ scores correlate with PANAS, SLSS, BFI-10, and GPA as expected. Incremental validity of the CSSWQ in pre-dicting GPA was tested with hierarchical linear regres-sion. Test–retest reliability of CSSWQ scores over four weeks was tested with Pearson correlations; for compari-son, intra-class correlations (single-measurement, two-way mixed-effects model, for absolute agreement) were

Page 4 of 10Zhang and Carciofo BMC Psychol (2021) 9:69
also calculated. Pearson correlations were conducted to explore associations between student wellbeing and other variables including frequency of drinking alcohol, smoking, and exercising, and financial situation. Analysis was conducted using SPSS (version 24).
ResultsStructural validityEFA was conducted using maximum likelihood estima-tion and Promax (oblique) rotation, consistent with the original CSSWQ study [45]. The factorability was sup-ported by the Kaiser–Meyer–Olkin measure of sam-pling adequacy (0.867), and Bartlett’s test of sphericity (Chi-square = 2828.749, df = 120, p ≤ 0.001), and the anti-image correlations were all > 0.7 [15]. Based on the criteria of eigenvalues greater than 1, four initial factors were extracted explaining 74.636% of the variance. Factor 1 had an initial eigenvalue of 6.857 and explained 42.856% of the total variance, factor 2 had an initial eigenvalue of 2.918 and explained 18.238% of the variance, factor 3 had an initial eigenvalue of 1.115 and explained 6.970% of the variance, and factor 4 had an initial eigenvalue of 1.052 and explained 6.573% of the variance. Factor 5 had an initial eigenvalue of 0.635 and explained 3.969% of the variance.
However, for the four extracted factors the values were: 6.346 (39.661% of variance), 2.701 (16.879% of vari-ance), 0.841 (5.258% of variance), and 0.848 (5.300% of
variance), and either two or four factors could be identi-fied from the scree plot. As noted above, factors 1 and 2 explained much more of the variance than factors 3 and 4. So, to rule out one possibility, it was assumed that there were two factors and the number of factors to extract was fixed as two. Under this circumstance, according to the pattern matrix (showing each item’s regression coeffi-cient on each factor) and structure matrix (showing cor-relations between items and factors) [15], items 2, 3, 4, 5, 6, 7 and 8 had higher loadings on factor 1, while items 1, 9, 10, 11, 12, 13, 14, 15 and 16 had higher loadings on factor 2.
However, reviewing the items did not show a clear way to categorize them into two factors. The structure would involve combining the original factors 1 and 2 (except for item 1), and combining the original factors 3 and 4 (plus item 1). However, the concepts in the original factors 1 and 2 (academic satisfaction and academic efficacy), and in factors 3 and 4 (school connectedness and college gratitude) are distinguishable, and distinguishing them was not problematic in the translation process.
In contrast, the pattern of loadings for four factors was easier to interpret as it exactly matched the revised CSSWQ [44]. In this case, in the pattern matrix (see Table 1), the four factors each involved the same four items as identified in the original study, with all loadings being > 0.4: factor 1 (items 5–8) being academic efficacy, factor 2 (items 13–16) being college gratitude, factor 3
Table 1 Pattern matrix and structure matrix of the CSSWQ (four factors)
Maximum likelihood extraction, with Promax rotation (with Kaiser Normalization); factor loadings > .4 are in bold
Item Pattern matrix Structure matrix
Factor Factor
1 2 3 4 1 2 3 4
1 − .147 .121 .889 − .086 .376 .458 .813 .4252 .306 − .026 .527 − .050 .597 .254 .668 .313
3 .339 − .091 .630 − .026 .684 .258 .773 .365
4 .050 − .018 .770 .078 .523 .397 .834 .5025 .974 .081 − .078 − .071 .924 .201 .495 .221
6 1.035 .037 − .149 − .031 .946 .160 .462 .216
7 .744 − .073 .058 .092 .790 .158 .512 .301
8 .656 .017 .245 .016 .809 .274 .648 .353
9 .112 .014 .323 .419 .429 .430 .624 .63710 − .125 .195 .080 .479 .103 .483 .358 .59811 .007 − .053 − .035 .985 .267 .501 .482 .93812 .008 .125 − .107 .614 .152 .431 .291 .63113 .004 .608 .094 .091 .210 .705 .430 .49414 .060 .915 − .042 − .016 .217 .899 .413 .50815 − .068 .886 .179 − .071 .196 .914 .514 .51816 .068 .773 − .137 .134 .184 .800 .338 .526
Page 5 of 10Zhang and Carciofo BMC Psychol (2021) 9:69
(items 1–4) being academic satisfaction, and factor 4 (items 9–12) being school connectedness [44]. The high-est loadings in the structure matrix supported the same four factors as well (see Table 1). However, there were also some high cross-loadings, indicating that the factors are moderately/strongly correlated, which was also found in the original study [44].
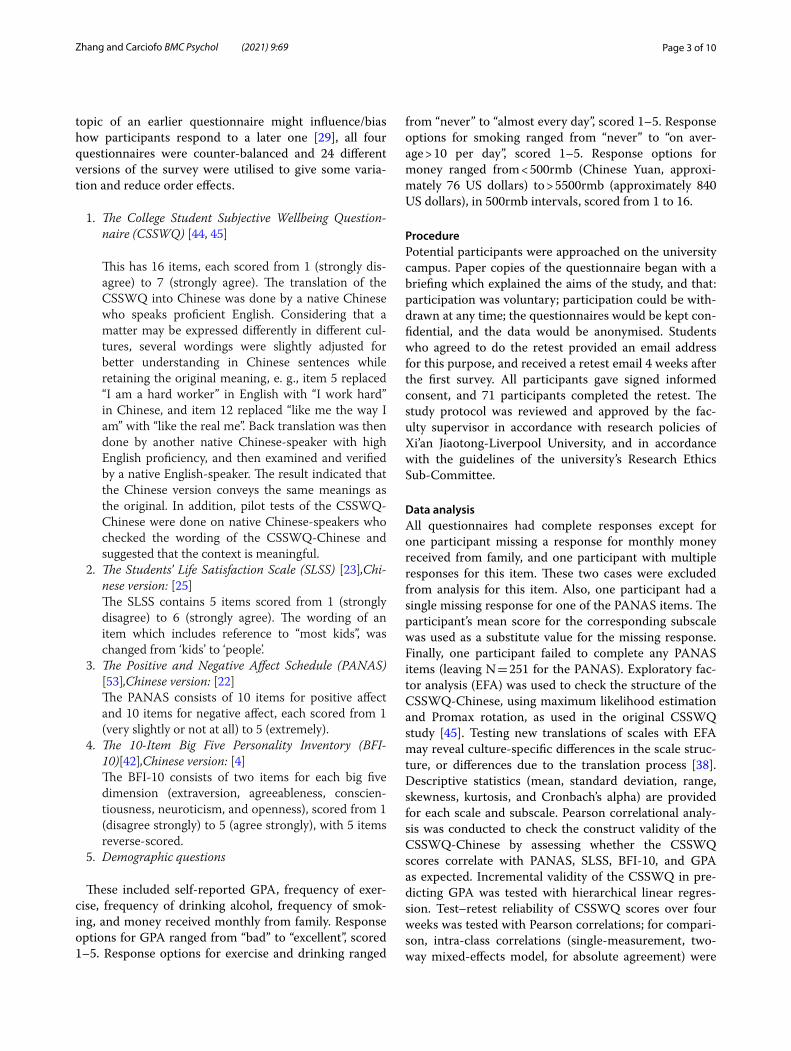
Descriptive statisticsTable 2 shows the descriptive statistics of the CSSWQ, including skewness and kurtosis. All of the values of skewness and kurtosis were within an acceptable range ( <|1|), indicating approximate normality [35]. The mean of college gratitude was quite high in the scale range compared with other aspects of wellbeing, indicating that for this sample at least, there were generally high scores for gratitude. Cronbach’s alpha coefficients, which were calculated to examine the internal consistency of the CSSWQ-Chinese data, were all > 0.7 and mostly > 0.8, largely consistent with results for the English CSSWQ for which Cronbach’s alphas were no less than 0.79 [44]. The ranges of corrected item-total correlations for each subscale were: academic satisfaction, 0.637 to 0.750, aca-demic efficacy, 0.774 to 0.882; school connectedness, 0.516 to 0.759; college gratitude, 0.661 to 0.843.
The four identified subscales showed moderate to strong correlations, the coefficients ranging from 0.252 (academic efficacy and college gratitude) to 0.652 (aca-demic satisfaction and academic efficacy), similar to the subscale inter-correlations found in the original CSSWQ study [45] which ranged 0.24 (academic efficacy and school connectedness) to 0.56 (academic efficacy and academic satisfaction). Test–retest Pearson correlations also showed moderate to strong correlations, and the intra-class correlations generally indicated moderate reli-ability (values between 0.5 and 0.75), with the confidence
intervals including some poor (< 0.5) and some good (> 0.75/ < 0.9) values [27] (see Table 2).
Additionally, there was also a trend for males to score higher in all aspects of wellbeing, but none of the dif-ferences were statistically significant (all ps > 0.1); female/male means (SD) were: academic satisfac-tion, 18.19 (4.149)/19.01 (4.504); academic efficacy, 17.32 (4.593)/17.95 (5.203); school connectedness, 20.74 (3.796)/21.14 (3.431); college gratitude, 23.50 (3.591)/23.65 (3.799); total student wellbeing, 79.74 (12.196)/81.75 (13.602). The correlations with age were also all non-significant: academic satisfaction, − 0.093; academic efficacy, − 0.025; school connectedness, 0.104; college gratitude, 0.016; total student wellbeing, − 0.006 (all ps > 0.1).
Table 3 presents the descriptive statistics for the other questionnaire scales, and for GPA. Each value of skew-ness ( <|1|) indicated an approximately normal distri-bution. The alpha coefficients for the SLSS and PANAS positive and negative affect were all good (> 0.8). The alpha coefficients for the big five dimensions in the BFI-10 ranged from 0.294 to 0.672. The relatively low values of alpha may be due to the shortness of the subscales (each included only two items), and these values are simi-lar to those found in previous research [4].
Construct validity: nomological networkPearson correlational analysis indicated that the total CSSWQ-Chinese and all four subscales were moderately/strongly positively correlated with SLSS and with PANAS positive affect, and had small/moderate correlations with BFI-10 extraversion (positive), with PANAS negative affect (negative), and with BFI-10 neuroticism (nega-tive) (see Table 4). These correlations were as expected. Also, BFI-10 agreeableness was positively correlated with academic satisfaction, school connectedness, college
Table 2 Descriptive statistics for the CSSWQ
CSSWQ = College Student Subjective Wellbeing Questionnaire; SE = standard error. N = 252; for the retest N = 71
***p ≤ .001
CSSWQ Range (possible) Mean (SD) Skewness (SE) Kurtosis (SE) Cronbach’s alpha
Test–retest Pearson correlation (intra-class correlation with 95% confidence interval)
AcademicSatisfaction
8–28(4–28)
18.45(4.275)
− .036(.153)
− .073(.306)
.854 .746*** (.731; CI = .600 to .824)
AcademicEfficacy
4–28(4–28)
17.52(4.797)
− .081(.153)
− .196(.306)
.922 .695*** (.687; CI = .541 to .792)
SchoolConnectedness
12–28(4–28)
20.87(3.680)
− .191(.153)
− .493(.306)
.784 .533*** (.516; CI = .322 to .669)
CollegeGratitude
11–28(4–28)
23.55(3.652)
− .569(.153)
− .243(.306)
.882 .482*** (.461; CI = .256 to .627)
Total studentwellbeing
46–112(16–112)
80.39(12.672)
.112(.153)
− .073(.306)
.909 .666*** (.642; CI = .483 to .760)

Page 6 of 10Zhang and Carciofo BMC Psychol (2021) 9:69
gratitude, and the total CSSWQ. BFI-10 conscientious-ness was positively correlated with the total scale and each subscale, the strongest correlation being with aca-demic efficacy. BFI-10 openness had small positive corre-lations with college gratitude and the total CSSWQ score. GPA had moderate positive correlations with academic satisfaction, academic efficacy, and the total CSSWQ score.
Incremental validityTo test if domain-specific student wellbeing has incre-mental validity in predicting GPA, in comparison with measures of global wellbeing, hierarchical linear regres-sion was undertaken in which step 1 included the PANAS positive and negative affect subscales, the SLSS, and also the Big Five personality dimensions, and gender (females tend to have higher GPA; [46]. This first model showed
R = 0.326, R2 = 0.106, F(9, 241) = 3.186 (p = 0.001). The CSSWQ total score was then added in step 2, and this produced a significant change in the model, with R = 0.386, R2 = 0.149; change in R2 = 0.043, p = 0.001; F(10, 240) = 4.212 (p < 0.001). Standardised betas for the final model are shown in Table 5. This analysis was independently repeated for each of the four subscales of the CSSWQ. This showed that academic efficacy was the strongest subscale predictor for GPA (β = 0.385, p < 0.001), followed by academic satisfaction (β = 0.274; p < 0.001), school connectedness (β = 0.051; p > 0.1), and college gratitude (β = -0.018; p > 0.1).
Demographic variablesThe distributions of responses for exercise (skewness = − 0.026), and money received monthly from family
Table 3 Descriptive Statistics for SLSS, PANAS, BFI-10, and GPA
SLSS = Students’ Life Satisfaction Scale; PANAS = Positive and Negative Affect Schedule; BFI-10 = 10-Item Big Five Personality Inventory; GPA = grade point average; SE = standard error. N = 252, except for PANAS, N = 251
Range (possible) Mean (SD) Skewness (SE) Kurtosis (SE) Cronbach’s alpha
SLSS 5–30 (5–30) 21.94 (4.327) − .656 (.153) 1.068 (.306) .881
PANAS
Positive affect 10–50 (10–50) 32.72 (5.917) .178 (.154) .901 (.306) .846
Negative affect 10–46 (10–50) 23.54 (6.748) .403 (.154) − .043 (.306) .863
BFI-10
Extraversion 2–10 (2–10) 6.38 (1.878) − .051 (.153) − .534 (.306) .672
Agreeableness 3–10 (2–10) 7.33 (1.474) − .402 (.153) .353 (.306) .294
Conscientiousness 2–10 (2–10) 6.40 (1.539) − .073 (.153) .031 (.306) .397
Neuroticism 2–10 (2–10) 5.94 (1.753) .116 (.153) − .233 (.306) .502
Openness 3–10 (2–10) 7.94 (1.615) − .725 (.153) .158 (.306) .469
GPA 1–5 (1–5) 3.37 (.810) − .499 (.153) 1.184 (.306) −
Table 4 Pearson correlations between the CSSWQ-Chinese and SLSS, PANAS, BFI-10, and GPA
CSSWQ = College Student Subjective Wellbeing Questionnaire; SLSS = Students’ Life Satisfaction Scale; PANAS = Positive and Negative Affect Schedule; BFI-10 = 10-Item Big Five Personality Inventory; GPA = self-reported grade point average. N = 252, except for PANAS, N = 251
*p ≤ .05; **p ≤ .01; ***p ≤ .001
CSSWQ SLSS PANAS positive affect
PANAS negative affect
BFI-10 extravert BFI-10 agreeable BFI-10 conscientious
BFI-10 neurotic BFI-10 open GPA
AcademicSatisfaction
.346*** .443*** − .113 .112 .265*** .235*** − .103 .086 .282***
AcademicEfficacy
.316*** .500*** − .072 .113 .089 .487*** − .023 .059 .372***
SchoolConnectedness
.467*** .304*** − .264*** .256*** .293*** .166** − .256*** .106 .090
CollegeGratitude
.348*** .207*** − .145* .114 .284*** .175** − .088 .147* .051
Total studentWellbeing
.473*** .488*** − .184** .188** .290*** .362*** − .143* .124* .277***

Page 7 of 10Zhang and Carciofo BMC Psychol (2021) 9:69
(skewness = 0.640) were approximately normal, while for smoking (skewness = 4.682) and alcohol drinking (skew-ness = 1.292), the distributions were strongly positively skewed. 55% (n = 139) of the participants had never drank, and 45% (n = 113) had drank before at different frequencies. Over 90% (n = 229) of the participants had never smoked before (only 23 participants had).
Pearson correlational analysis was conducted between the CSSWQ-Chinese (including the subscales) and demographic questions. The results are shown in Table 6. In general, there was little correlation between each aspect of students’ wellbeing and each of the other variables. Exercise had a small positive correlation with academic efficacy. In this study, drinking had weak cor-relations with all aspects of wellbeing, while smoking had a small positive correlation with school connectedness. Money had small negative correlations with academic satisfaction and academic efficacy.
DiscussionThe aim of the current study was to develop and vali-date a Chinese version of the College Student Subjective Wellbeing Questionnaire (CSSWQ). Although the results of the exploratory factor analysis had some degree of ambiguity, the four-factor structure was the most clear and logical. The loadings in the pattern matrix showed a structure that was identical with the original English CSSWQ [44]. The four CSSWQ subscales showed mod-erate/strong inter-correlations, as also found with the English CSSWQ [44, 45].
The means for each aspect of the CSSWQ-Chinese were above the midpoint of the ranges, indicating rela-tively high levels of subjective wellbeing. However, in general, the students in the current study had lower lev-els of wellbeing in all aspects compared to American col-lege students in the original revised CSSWQ study. The means of academic satisfaction (AS = 18.45 ± 4.275), academic efficacy (AE = 17.52 ± 4.797), col-lege gratitude (CG = 23.55 ± 3.652), school con-nectedness (SC = 20.87 ± 3.680), and total student wellbeing (TSW = 80.39 ± 12.672) were all smaller than the counterparts in the original study (AS = 21.65 ± 4.84; AE = 23.04 ± 3.88; CG = 25.80 ± 2.45; SC = 22.27 ± 4.09; TSW = 92.76 ± 12.24) [44]. Scores of college gratitude ranked the highest in the subscales in both countries. These results are consistent with the wellbeing of the two countries’ general population. According to the World Happiness Report 2019, the overall happiness of main-land Chinese ranked 93 out of the 156 countries in the list, while the overall happiness of Americans ranked 19 out of 156 [19]. Among the factors considered to measure the happiness level of a nation (e. g., individual life evalu-ation, positive affect, negative affect), China was reported to have higher levels of happiness evaluation and social support, but lower levels of happiness equity and free-dom of choice compared to America [19].
In the revised English CSSWQ study [44], approxi-mately normal distributions were shown in most sub-scales (skewness and kurtosis <|2|), except for the college
Table 5 Linear regression predicting student grade point average (GPA)
Gender was coded as 0 for female and 1 for male. N = 251
*p ≤ .05; **p ≤ .01; ***p ≤ .001
Standardized beta
t-value
Students’ Life Satisfaction Scale (SLSS) − .138 − 1.921
Positive and Negative Affect Schedule (PANAS)
Positive affect .118 1.561
Negative affect − .208 − 2.599**
Big Five Inventory (10-item)
Extraversion − .064 − 1.002
Agreeableness − .104 − 1.590
Conscientiousness .065 .988
Neuroticism .137 1.822
Openness .083 1.359
Gender − .154 − 2.518*
College Student Subjective Wellbeing Ques-tionnaire (CSSWQ), total score
.272 3.483***
Table 6 Pearson Correlations between the CSSWQ-Chinese and Demographics
CSSWQ = College Student Subjective Wellbeing Questionnaire; N = 252, except for Money, N = 250. *p ≤ .05
Exercise Drink alcohol Smoke Monthly money received from family
Academic satisfaction .063 .028 − .015 − .132*
Academic efficacy .135* − .027 − .032 − .120
School connectedness − .021 .081 .130* .030
College gratitude .048 − .068 .058 .035
Total Student wellbeing .080 .003 .037 − .071
Page 8 of 10Zhang and Carciofo BMC Psychol (2021) 9:69
gratitude subscale which had a skewness of − 2.23 and a kurtosis of 9.80. In the current study, college grati-tude also had the highest value of skewness (− 0.569), although within an acceptable range. Cronbach’s alpha coefficients for the total CSSWQ-Chinese score and the scores of each of its subscales met the generally accepted minimal value of > 0.7, and were largely consist-ent with the original study [44], indicating adequate to strong internal consistency. Test–retest Pearson correla-tions showed moderate to strong correlations between the two tests, while the intra-class correlations gener-ally indicated moderate reliability. Wellbeing dimen-sions may be expected to remain relatively stable, at least over relatively short intervals. Among all the aspects of the CSSWQ-Chinese, academic satisfaction scores were relatively the most stable with a test–retest Pearson cor-relation of 0.746, while college gratitude scores were relatively the least stable, with a test–retest Pearson correlation of 0.482. It is possible that these aspects of wellbeing could change over time while somebody is at university, perhaps following certain experiences (e. g., college gratitude may increase after receiving good exam results, although so may academic satisfaction and effi-cacy). Therefore, more research needs to be done on the stability of, and influences on, the different aspects of col-lege student subjective wellbeing.
The construct validity of the CSSWQ was supported by correlations between the CSSWQ-Chinese and other scales in the nomological network, which were in line with previous research findings for the CSSWQ, e. g., positive with PANAS positive affect and with life satis-faction, and negative with PANAS negative affect [44], with similar observed coefficient sizes. The CSSWQ was also positively correlated with extraversion, and nega-tively correlated with neuroticism, consistent with gen-eral measures of wellbeing [31]. The CSSWQ also showed positive correlations with agreeableness, conscientious-ness, and (more weakly) with openness. The observed pattern of correlations between the CSSWQ and big five dimensions in the current research shows much consist-ency with a recent study in the USA [56].
Assumed as a correlate of college students’ wellbe-ing, self-reported GPA in this study was found to have moderate positive correlations with academic efficacy, academic satisfaction, and the total CSSWQ score. Comparing with the revised English CSSWQ study [44], the Chinese/English bivariate correlation coeffi-cients for the CSSWQ and GPA were: academic satis-faction 0.282/0.50,academic efficacy 0.372/0.48; college gratitude 0.090/0.17; school connectedness 0.051/0.11; total student wellbeing 0.277/0.42. Although the corre-lations in the current study were all smaller than those in the original study, it is consistent that GPA was a
much stronger correlate of academic satisfaction, aca-demic efficacy, and total student wellbeing than for col-lege gratitude and school connectedness. Evidence was also found to support the CSSWQ-Chinese’s incremen-tal validity, as it (especially the subscale of academic efficacy) was a significant predictor of GPA, after con-trolling for other aspects of wellbeing and other predic-tors of academic achievement.
The current study also investigated associations between college student wellbeing and drinking alcohol, smoking, exercise, and monthly family subsidy. It was found that drinking alcohol had little correlation with all aspects of students’ wellbeing, which may be due to the balanced-out effect of academic side effects and social benefits of drinking. On one hand, it is well supported by the literature that (excessive) alcohol drinking is related to poorer physical and mental wellbeing of individuals [5, 13, 34], and poorer academic performance of college students, primarily because drinking takes time away from studying (e. g., missing class due to hangovers) [39]. On the other hand, drinking, as long as below a certain amount, may help enhance a person’s positive emotions, and ability to cope with negative emotions; for college students, drinking often serves as a way for relaxing, cel-ebrating, and sharing happy/sad feelings with friends [8].
Second, smoking had a small positive correlation with school connectedness, while it may be expected to relate to higher risk of psychological problems and poorer student wellbeing, based on the evidence of previous research [14, 17]. However, similar to social drinking, smoking might serve a socializing function among stu-dents and enhance their social relationships and subjec-tive connectedness to the college society [33].
Third, exercise had a small positive correlation with academic efficacy, which is consistent with an exist-ing longitudinal study which found that regular exercise relates to better mental wellbeing [49].
Last, monthly family subsidy had small negative corre-lations with academic satisfaction and academic efficacy. It might be the case that college students with more extra disposable money have less academic motivation, or, financial assistance may be a reflection of a family’s par-enting style, which could directly affect their children’s financial coping behaviours, and indirectly affect their wellbeing [50]. However, as the current research was con-ducted at a joint-venture university with relatively high tuition fees, students at this university may generally have financial backgrounds much above the nation’s average level. The trend that an increased amount of money is related to poorer academic satisfaction and efficacy may not apply to students in most other Chinese universities. Future research may investigate this.

Page 9 of 10Zhang and Carciofo BMC Psychol (2021) 9:69
Limitations and further researchThe study is limited by the use of a convenience sample, and with a cross-sectional design the study cannot show any causal relationships between the variables. Also, vol-unteer bias may potentially have influenced the sample characteristics and study results, e. g., the overall well-being from this study may be better than the population level because more outgoing and helpful individuals, with higher wellbeing, may have been more willing to partici-pate in the research. Also, there were limitations with the questionnaires chosen to validate the CSSWQ. For exam-ple, the BFI-10 only has two items for each personality dimension, so it may be better to use a longer scale (e.g., the BFI-44), which may also allow for facet-level analysis. Additionally, more data could be collected for construct validity by comparing with other relevant scales, such as the Satisfaction with Life Scale [9], the Adult Hope Scale [51], and the Beck Anxiety Inventory [2], which were used by Renshaw [44]. Also, future studies could use alternative data collection methods such as online questionnaires which can deploy the survey more rap-idly, and can ensure the completeness of each survey [18]. Also, research with larger and more diverse samples may further test the structure of the Chinese CSSWQ using confirmatory factor analysis, and also test for the single higher-order factor of covitality (general student wellbe-ing), as identified by Renshaw and Bolognino [45] and Renshaw [44].
Further research may also explore how disposable money or economic dependence affect college students’ wellbeing in China, investigate cross-cultural compari-sons of college students’ wellbeing, and further test the stability of wellbeing traits over time, by measuring well-being at different time points throughout the school year. Other components of college student subjective wellbe-ing (in addition to the four assessed by the CSSWQ) may also be investigated.
ConclusionThe current study developed a Chinese translation of the College Student Subjective Wellbeing Scale (CSSWQ), and analysis of data for this scale showed evidence for validity and reliability. The Chinese CSSWQ could be useful for future research to (1) monitor students’ well-being in Chinese universities, (2) explore influences on student wellbeing, and (3) measure student wellbeing as an outcome in intervention studies. While there is a lot of depression among college students, there has been a relative lack of data on other aspects of the psychological wellbeing of this group, and a relative lack of instruments that specifically measure college students’ wellbeing in China. The use of the Chinese CSSWQ could help gather
more data about students’ wellbeing, and be useful in research to promote the wellbeing and happiness of Chi-nese university students.
AbbreviationsCSSWQ: College Student Subjective Wellbeing Questionnaire; GPA: Grade point average; DALY: Disability adjusted life year; SLSS: The Students’ Life Sat-isfaction Scale; PANAS: The Positive and Negative Affect Schedule; BFI-10: The 10-Item Big Five Personality Inventory; EFA: Exploratory factor analysis.
AcknowledgementsNot applicable.
Authors’ contributionsConceptualization: YZ, RC; Data curation: YZ; Formal analysis: YZ, RC; Supervi-sion: RC; Writing—original draft: YZ; Writing—review & editing: RC, YZ. All authors read and approved the final manuscript.
FundingThis research did not receive any specific grant from funding agencies in the public, commercial, or not-for-profit sectors.
Availability of data and materialsThe dataset supporting the conclusions of this article is included within the article (and its additional file(s)).
Declarations
Ethics approval and consent to participateThe study protocol was reviewed and approved by the faculty supervisor in accordance with research policies of Xi’an Jiaotong-Liverpool University, and in accordance with the guidelines of the university’s Research Ethics Sub-Committee. All participants gave written informed consent.
Consent for publicationNot applicable.
Competing interestsThe authors declare that they have no competing interests.
Received: 8 January 2021 Accepted: 16 April 2021
References 1. Andrews D, Wilding J. The relation of depression and anxiety to life-stress
and achievement in students. Br J Psychol. 2004;95:509–21. 2. Beck AT, Brown G, Epstein N, Steer RA. An inventory for measuring clinical
anxiety: psychometric properties. J Consult Clin Psychol. 1988;56:893–7. 3. Bewick B, Koutsopoulou G, Miles J, Slaa E, Barkham M. Changes in under-
graduate students’ psychological well-being as they progress through university. Stud High Educ. 2010;35(6):633–45.
4. Carciofo R, Yang J, Song N, Du F, Zhang K. Psychometric Evaluation of Chinese-language 44-item and 10-item big five personality inventories, including correlations with chronotype, Mindfulness and Mind Wander-ing. PLoS ONE. 2016;11(2):1–26.
5. Centers for Disease Control. Fact sheets—alcohol use and your health (2018). Retrieved from https:// www. cdc. gov/ alcoh ol/ fact- sheets/ alcoh ol- use. htm.
6. Cohen J. A power primer. Psychol Bull. 1992;112(1):155–9. 7. Cooke R, Bewick BM, Barkhan M, Bradley M, Audin K. Measuring, monitor-
ing and managing the psychological well-being of first year university students. Br J Guid Couns. 2006;34:505–17.
8. Cooper ML, Frone MR, Russell M, Mudar P. Drinking to regulate positive and negative emotions: a motivational model of alcohol use. J Pers Soc Psychol. 1995;69(5):990–1005.
Page 10 of 10Zhang and Carciofo BMC Psychol (2021) 9:69
9. Diener E, Emmons RA, Larsen RJ, Griffin S. The satisfaction with life scale. J Pers Assess. 1985;49(1):71–5.
10. Dimsdale JE. Psychological stress and cardiovascular disease. J Am Coll Cardiol. 2008;51(13):1237–46.
11. Dong A, Chen X, Zhu L, Shi L, Cai Y, Shi B. Translation and Validation of a Chinese Version of the Warwick-Edinburgh Mental Well-being Scale with Undergraduate Nursing Trainees. J Psychiatr Ment Health Nurs. 2016;23(9–10):554–60.
12. Duggan KA, Friedman HS, McDevitt EA, Mednick S. Personality and healthy sleep: the importance of conscientiousness and neuroticism. PLoS ONE. 2014;9(3):1–11.
13. El-Guebaly N. Investigating the Association Between Moderate Drinking and Mental Health. Ann Epidemiol. 2007;17(5):555–62.
14. Fergusson DM, Goodwin RD, Horwood LJ. Major depression and cigarette smoking: results of a 21-year longitudinal study. Psychol Med. 2003;33:1357–67.
15. Field A. Discovering statistics using SPSS. 3rd ed. London: Sage Publica-tion; 2009.
16. Gable S, Haidt J. What (and why) is positive psychology? Rev Gen Psychol. 2005;9(2):103–10.
17. Habibi M, Hosseini F, Darharaj M, Moghadamzadeh A, Radfar F, Ghaffari Y. Attachment style, perceived loneliness, and psychological well-being in smoking and non-smoking university students. J Psychol. 2018;152(4):226–36.
18. Hageman K, Kim A, Sanchez T, Bertolli J. Survey design and implementa-tion. In: Guest G, Namey EE, editors. Public health research methods. Thousand Oaks, CA: Sage Publication; 2015. p. 341–78.
19. Helliwell JF, Huang H, Wang S. Changing world happiness. In: Helliwell JF, Layard R, Sachs JD, editors. World happiness report 2019. New York: Sustainable Development Solutions Network; 2019.
20. Hicks T, Heastie S. High school to college transition: a profile of the stress-ors, physical and psychological health issues that affect the first-year on-campus college student. J Cult Divers. 2008;15(3):143–7.
21. Hidaka BH. Depression as a disease of modernity: explanations for increasing prevalence. J Affect Disord. 2012;140(3):205–14.
22. Huang L, Yang Y, Ji Z. Applicability of the positive and negative affect scale in Chinese. Chin Ment Health J. 2003;17(1):54–6.
23. Huebner ES. Initial development of the student’s life satisfaction scale. School Psychology International. 1991;12(3):231–40.
24. Hurst CS, Baranik LE, Daniel F. College student stressors: a review of the qualitative research. Stress Health. 2012;29(4):275–85.
25. Jiang X, Fang L, Stith BR, Liu R-D, Huebner ES. Psychometric evaluation of the Chinese version of the students’ life satisfaction scale. Appl Res Qual Life. 2017;13:1–15.
26. Jylha P, Isometsa E. The relationship of neuroticism and extraversion to symptoms of anxiety and depression in the general population. Depress Anxiety. 2006;23(5):281–9.
27. Koo TK, Li MY. A guideline of selecting and reporting intraclass correlation coefficients for reliability research. J Chiropr Med. 2016;15(2):155–63.
28. Kuh GD, Kinzie J, Buckley JA, Bridges BK, Hayek JC. What matters to student success: a review of the literature. Washington, DC: National Postsecondary Education Cooperative. 2006.
29. Lavrakas PJ. Encyclopaedia of survey research methods. Thousand Oaks, CA: Sage Publication; 2018.
30. Laws TA, Fiedler BA. Universities’ expectations of pastoral care: trends, stressors, resource gaps and support needs for teaching staff. Nurse Educ Today. 2012;32(7):796–802.
31. Lucas RE. Exploring the associations between personality and subjective well-being. In: Diener E, Oishi S, & Tay L, editors. Handbook of well-being. Salt Lake City, UT: DEF Publishers; 2018.
32. Lyubomirsky S, Lepper HS. A measure of subjective happiness: prelimi-nary reliability and construct validation. Soc Indic Res. 1999;46(2):137–55.
33. Martin BA, McCoy TP, Champion HLO, Parries MT, DuRant RH, Mitra A, Rhodes SD. The role of monthly spending money in college stu-dent drinking behaviors and their consequences. J Am Coll Health. 2009;57(6):587–96.
34. Mentzakis E, Suhrckeb M, Roberts B, Murphy A, McKee M. Estimating the causal effect of alcohol consumption on well-being for a cross-section of 9 former Soviet Union countries. Soc Sci Med. 2013;89:1–7.
35. Morgan GA, Leech NL, Gloeckner GW, Barrett KC. IBM SPSS for Introduc-tory statistics: use and interpretation. 5th ed. New York: Routledge; 2013.
36. Murray CJL, Vos T, Lozano R, Naghavi M, Flaxman AD, Michaud C, et al. Disability-adjusted life years (DALYs) for 291 diseases and injuries in 21 regions, 1990–2010: a systematic analysis for the global burden of disease study 2010. The Lancet. 2012;380(9859):2197–223.
37. Nan H, Ni MY, Lee PH, Tam WWS, Lam TH, Leung GM, McDowell I. Psy-chometric Evaluation of the Chinese Version of the Subjective Happiness Scale: Evidence from the Hong Kong FAMILY Cohort. Int J Behav Med. 2014;21(4):646–52.
38. Orçan F. Exploratory and confirmatory factor analysis: Which one to use first? J Measure Eval Edu Psychol. 2018;9(4):414–21.
39. Pascarella ET, Goodman KM, Seifert TA, Tagliapietranicoli G, Park S, Whitt EJ. College student binge drinking and academic achievement: a longitu-dinal replication and extension. J Coll Stud Dev. 2007;48(6):715–27.
40. Pascarella ET, Terenzini PT. How college affects students: a third decade of research, vol. 2. San Francisco: Jossey-Bass; 2005.
41. Prince M, Patel V, Saxena S, Maj M, Maselko J, Phillips MR, Rahman A. No health without mental health. The Lancet. 2007;370(9590):859–77.
42. Rammstedt B, John O. Measuring personality in one minute or less: a 10-item short version of the big five inventory in English and German. J Res Pers. 2007;41:203–12. https:// doi. org/ 10. 1016/j. jrp. 2006. 02. 001.
43. Regehr C, Glancy D, Pitts A. Interventions to Reduce Stress in University Students: A Review and Meta-Analysis. J Affect Disord. 2012;148(1):1–11.
44. Renshaw TL. Psychometric of the revised college student subjective wellbeing questionnaire. Can J Sch Psychol. 2018;33(2):136–49.
45. Renshaw TL, Bolognino SJ. The college student subjective wellbeing questionnaire: a brief, multidimensional measure of undergraduate’s covitality. J Happiness Stud. 2016;17(2):463–84.
46. Richardson M, Abraham C, Bond R. Psychological correlates of university students’ academic performance: a systematic review and meta-analysis. Psychol Bull. 2012;138(2):353–87.
47. Robitschek C, Ashton MW, Spering CC, Geiger N, Byers D, Schotts CG. Development and psychometric evaluation of the Personal Growth Initia-tive Scale–II. J Counsell Psychol. 2012;59(2):274–87.
48. Salzer MS. A comparative study of campus experiences of college students with mental illnesses versus a general college sample. J Am Coll Health. 2012;60(1):1–7.
49. Schuch FB, Vancampfort D, Firth J. Association between physical exercise and mental health in 1·2 million individuals in the USA between 2011 and 2015: a cross-sectional study. Lancet Psychiatry. 2018;5:736–46.
50. Serido J, Shim S, Mishra A, Tang C. Financial parenting, financial coping behaviors, and well-being of emerging adults. Fam Relat. 2012;59(4):453–64.
51. Snyder CR, Harris C, Anderson JR, Holleran SA, Irving LM, Sigmon ST, Pat H. The will and the ways: Development and validation of an individual-differences measure of hope. J Personal Soc Psychol. 1991;60:570–85.
52. Tennant R, Hiller L, Fishwick R, Platt S, Joseph S, Weich S. The Warwick–Edinburgh mental well-being scale (WEMWBS): development and UK validation. Health Qual Life Outcomes. 2007;5(1):63.
53. Watson D, Clark LA, Tellegen A. Development and validation of brief measures of positive and negative affect: the PANAS scales. J Pers Soc Psychol. 1988;54(6):1063–70. https:// doi. org/ 10. 1037// 0022- 3514. 54.6. 1063.
54. World Health Organisaiton. Depression. (2017) Retrieved from http:// www. wpro. who. int/ china/ topics/ mental_ health/ 1703m ental healt hfact sheet. pdf.
55. Yang H, Chang EC. Examining the structure, reliability, and validity of the Chinese personal growth initiative scale-ii: evidence for the importance of intentional self-change among Chinese. J Pers Assess. 2014;96(5):559–66.
56. Zhang DC, Renshaw TL. Personality and college student subjective well-being: a domain-specific approach. J Happiness Stud. 2019. https:// doi. org/ 10. 1007/ s10902- 019- 00116-8.
Publisher’s NoteSpringer Nature remains neutral with regard to jurisdictional claims in pub-lished maps and institutional affiliations.

![Assessing emotional wellbeing in a refugee camp [Read-Only]€¦ · Sunday’: Assessing emotional wellbeing in a refugee camp ... and validation of assessment instruments ... ¾Response](https://img.pdfslide.net/doc/110x75/5ea3c46bd4fe62320b3bcb84/assessing-emotional-wellbeing-in-a-refugee-camp-read-only-sundaya-assessing.jpg)