Embed Size (px)
Citation preview
TOPICS IN APPLIED RESOURCE MANAGEMENT IN THE TROPICS
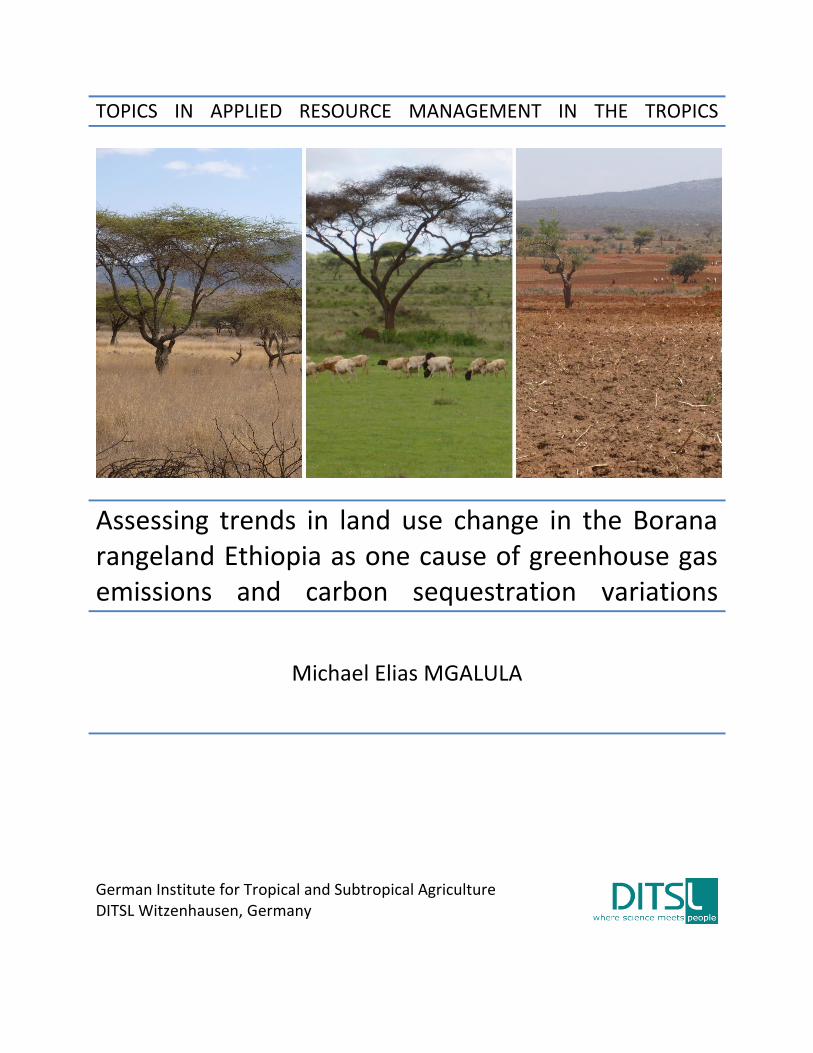
Assessing trends in land use change in the Borana rangeland Ethiopia as one cause of greenhouse gas emissions and carbon sequestration variations
Michael Elias MGALULA
German Institute for Tropical and Subtropical Agriculture DITSL Witzenhausen, Germany

This work has been accepted by the Faculty of Organic Agricultural Sciences of the University of Kassel as a thesis for fulfilment of the requirement of the academic degree Doktor der Agrarwissenschaften (Dr. agr.). Day of Disputation: 09.06.2016 Advisor: Prof. Dr. Oliver Hensel (University of Kassel) Examiner: Prof. Dr. Mathias Becker (University of Bonn) Examiner: Prof. Dr. Eva Schlecht (University of Kassel) Examiner: Dr. Christian Hülsebusch (DITSL Witzenhausen) Under the academic advice of the Department of Agricultural and Biosystems Engineering of the University of Kassel and the German Institute for Tropical and Subtropical Agriculture (DITSL) Published as:
- Topics in Applied Resource Management in the Tropics - A series on soil and water conservation and land use systems
Vol 5: Assessing trends in land use change in the Borana rangeland Ethiopia as one cause of greenhouse gas emissions and carbon sequestration variations
Author: Michael Elias Mgalula Series Editor: Dr. Christian Hülsebusch Publisher: German Institute for Tropical and Subtropical Agriculture (DITSL)
Witzenhausen, Germany Print: Print Tex Online UG, Witzenhausen, Germany © DITSL 2016 Deutsches Institut für Tropische und Subtropische Landwirtschaft Steinstrasse 19, P.O. Box 1652 37213 Witzenhausen, Germany ISBN 978-3-945266-03-8 ISSN 0933-4513 Gedruckt mit Unterstützung des Deutschen Akademischen Austauschdienstes DAAD / Printed with financial support of the German Academic Exchange Service DAAD The PhD project was funded by the German Academic Exchange Service (DAAD), the Ministry of Education and Vocational Training (MoEVT) of Tanzania, the Federal Ministry for Economic Cooperation and Development (BMZ) of Germany, and the German Institute for Tropical and Subtropical Agriculture (DITSL) in Witzenhausen, Germany.
SUMMARY
i
Summary
Land use change, particularly conversion of ecosystems with permanent plant cover into those
where soil lies bare for periods of the year (e.g. during ploughing) often increases emissions of
greenhouse gases (GHG) and decreases the ecosystems' capacity to store carbon in biomass and
soil. For land use planners to reconcile efforts to increase livelihoods and land productivity with
reaching national and international goals to reduce GHG emissions and enhancing carbon
sequestration potential, it is therefore necessary to have current information on land use and land
use change, drivers and impacts. Rangelands are particularly under pressure from increased land
use change. The Borana rangeland of Southern Ethiopia has been used and managed by
pastoralists for centuries. However, increasing population, the emergence of private enclosures,
contemporary climate anomalies and encroaching agricultural activity have altered the traditional
land management systems. In addition, the Ethiopian government has been actively promoting
several large scale projects involving water wells and agriculture. In order to better understand
the dynamics of the resulting transformations, its drivers and its impacts, and to provide planners
with current information, the objective of this study was to analyse the nature and extent of land
use and land cover changes in five study sites in the Borana rangeland. The specific objectives
were i) to provide a review of greenhouse gas emission sources and carbon sink potential in
African rangeland ecosystems, ii) to assess land conversion dynamics in the Borana rangeland
using remote sensing techniques and household and field survey data, iii) to examine
determinants of land use change for cultivation expansion at Darito agro-pastoral site in Borana
using participatory GPS/GIS techniques integrated into a geographical information system (GIS),
interviews on field cropping history, and multiple linear regression modelling, and iv) to analyse
the extent of vegetation changes using phenological observations of crops, rainfall, and time
series normalized difference vegetation index (NDVI) data. This information could contribute to
the development of tools for more effective land use planning.
The total land area studied was 735.90 km2, located at 4°45ˈ20ʺN, 4°5ˈ20ʺN and 38°22ˈ40ʺE,
38°9ˈ20ʺE zone 37N in the Borana rangeland. The study was part of a larger project and five
sites were chosen for the purpose of comparison: a predominantly agro-pastoral site (Darito),
three pastoral sites with some agro-pastoral land use (Did mega, Samaro, Haralo), and one purely
pastoral site (Soda), the latter four in Mega District. Vegetation is dominated by trees and shrubs

SUMMARY
ii
mainly of the genera Acacia, Boscia, Combretum, Commiphora, Cordia, Croton, Erythrina,
Euphorbia, Ficus, Terminalia, Juniperus, Rhamnus, Balanites, and Olea; herbs mainly of the
genera Commelina, Pupalia; and annual and perennial grasses mainly of the genera Cenchrus,
Heteropogon, Dactyloctenium, Chrysopogon, Bothriochloa, Cyperus, Digitaria, Sporobolus,
Cynodon, and Chloris. Rainfall is bimodal, with a long rainy season from March to May and a
short rainy season from October to December. Average annual rainfall ranges from 100 to 600
millimetres; the average temperature ranges from 15 to 24°C. Soil types are mainly chromic
cambisols and luvisols, and eutric cambisols, fluvisols and nitisols. Data collection was done
from August to December 2012 and from February to May 2014.
A schematic model of greenhouse gas emission pathways in rangeland ecosystems was devised,
based on a literature review of land use, greenhouse gas emissions and carbon sequestration in
Africa with a focus on the East African rangelands. Predominant land use activities in rangelands
considered were cultivation, livestock husbandry and extraction of plant biomass (e.g. trees for
firewood), but also the natural processes of soil microbes and macro decomposers (e.g. termites),
as they all potentially contribute to greenhouse gas emissions and carbon sequestration potential.
Fire (as one management tool employed in cultivation and livestock husbandry) was also
included, as it contributes directly and indirectly to emissions and decrease of carbon
sequestration potential. Abiotic factors (e.g. temperature, precipitation) also influence nutrient
fluxes over time and space, and different land use actions shape emission-sink relationships.
Landsat data (at 30 metres' resolution from 1985 and 2011), interview information from 265
households and rainfall data (1975 to 2012) obtained from the Ethiopian Meteorological Agency,
were used to analyse the extent of land use and land cover change and factors driving the change.
Between 1985 and 2011, considerable land cover changes were detected at the different study
sites. In Darito, cultivated land expanded by 12.49 percent, mostly at the expense of bushland,
which decreased by 10.04 percent. In the four other study sites, cultivated land area did not
increase (only Haralo and Did mega showed a marginal increase). In these four sites, grassland
expanded by about 17 – 28 percent at the expense of bushland, which decreased by about 20 – 30
percent. Bare land only increased considerably in Haralo (13.14 percent). The loss of bushland in
all sites is probably due to extraction of trees for fencing, construction, firewood and charcoal.
The detected changes – increase in cultivated land in Darito, increase of bare land in Haralo,

SUMMARY
iii
reduction of bushland in all sites – are likely to favor processes that will lead to increased GHG
emissions and reduced carbon sequestration potential. The main reasons contributing to
cultivation expansion established from household interviews (particularly in Darito), were:
recurrent droughts, desire to diversify income and loss of pasture. Changes in policy,
privatization of land, population pressure on available natural resources, and the intervention of a
water project contributed to intensified competition for grazing areas, and hence exacerbated the
resulting land use changes.
Participatory spatial mapping combining GPS recordings, interview information, retrospective
cropping calendar exercises, thematic map layers (soil, rainfall, slope, and digital elevation
model), GIS and statistical modelling were used to analyse the spatial and temporal expansion of
cultivation at Darito for a sample of 108 fields belonging to 54 individual farmers. Cultivated
land increased by 6.9±5.5 hectares (ha) per year from 1984 to 2014 and farming was found
predominantly on chromic cambisols in the 900 to 1.000 millimetre rainfall zones, and at a slope
of < 5º. Slope and elevation were significant variables in predicting cultivation expansion along
the dry-river low-lying areas in the rangeland, while soil type, distance from dry-river, and
rainfall were not significant. However, the model had a low R² value (R2=0.154), indicating that
other variables are more significant in influencing the direction cultivation expands. Cropland
mainly expands onto the low-lying rangeland landscapes with natural bushland vegetation and
grassland.
Vegetation assessment was carried out using MODIS NDVI data at a resolution of 250 metres
and 16 days' composite, from 2002 to 2012, in combination with phenology observation of crops,
and rainfall data. Phenology records served to identify points in time when the biomass cover of
cultivated land was expected to be particularly high (greening up phase, pre-harvest) or low (land
preparation for planting/seeding). At these times, cultivated land could be discriminated from
woodland, bushland, and grassland using spectral profiles. During the March to April cropping
season, pixels were dominated by land prepared for planting – thus bare - with mean NDVI
scores of < 0.25; while at greening up phase, NDVI scores of > 0.45 were found, while for the
September to October cropping season this difference was not so pronounced. For the period
2002 – 2010 vegetation greening only correlated with rainfall seasons for single years. Areas
managed by purely pastoral and agro-pastoral communities at the Mega sites showed an average
SUMMARY
iv
annual NDVI score below 0.4 in all years except 2003. At the larger agro-pastoral area in Darito,
the average annual NDVI score is above 0.4 for all years except 2008. For the month of January
2002 and 2012, change maps for Darito (where cultivation has increased) showed NDVI gains in
the majority of pixels up to 0.3164 but there were losses of up to -0.0642 in a few pixels; losses
were found mainly on cultivated land. Change maps for September 2002 and 2012 showed
NDVI scores of up to 0.4285 and losses of up to -0.5253; again, losses were predominantly in
cultivated areas. Similar analyses for the Mega sites for the month of September, with far less
cultivated land, showed comparatively moderate NDVI gains (up to 0.104) in the vast majority
of pixels, while losses of up to -0.2579 were confined locally and were lower than at the Darito
site. The January change map for Mega showed losses of up to -0.1065 vs. gains of up to 0.3805,
however, the losses covered far larger areas. At the Darito and Mega sites the NDVI are
decreasing over the study period, indicating loss of natural vegetation in the rangeland.
This study presented the trends in land use dynamics in five study areas in the Borana rangeland.
Land cover changes contribute directly or indirectly to GHG emissions. The expansion of
agricultural activities and extracting of natural vegetation apparently reduces the ecosystem's
potential to sequester carbon and to mitigate climate change. Rangeland managers and land use
planners should devise strategies for managing resources that aim at offsetting emissions, e.g. by
allocating agricultural areas to landscape regions where this impact is less pronounced. Such
planning could contribute to reconciling the needs of the Borana land users, meeting national
objectives and promoting international efforts to mitigate emissions and enhance carbon
sequestration capacity in rangeland ecosystems. NDVI time series integrated into a GIS is a tool
that land-use planners can integrate into participatory land use planning with land-users and
other stakeholders. Given the 250 m pixel resolution of the MODIS NDVI data, detecting the
changes on land cover in highly heterogeneous areas, where cultivation activity was encroaching
and yet surrounded by natural vegetation was challenging due to the mixed pixel effect. If a
monitoring tool for real-time observation – e.g. every two weeks or monthly were to be set up, it
would require NDVI data of higher spatial resolution, multispectral bands, or data from the
Hyperion instrument of the EO-1 (Earth Observing-1) so that a sharper distinction between
cropland areas and natural rangeland or species could be obtained.

ZUSAMMENFASSUNG
v
Zusammenfassung
Landnutzungsänderungen, insbesondere die Umwandlung von Ökosystemen mit permanentem
Pflanzenbewuchs in solche, in denen der Boden periodisch unbewachsen ist (z.B. nach der
Bodenbearbeitung vor der Aussaat), führen häufig zu Steigerungen von Klimagasemissionen und
verringern die Fähigkeit des Ökosystems Kohlenstoff in Biomasse und im Boden zu binden.
Damit Landnutzungsplaner die Verbesserung der Lebenssituation der Menschen und die
Flächenproduktivität des Landes mit dem Erreichen nationaler und internationaler
Klimaschutzziele in Einklang bringen können, benötigen sie idealerweise laufend aktuelle
Informationen über die tatsächliche Landnutzung, deren Veränderungen, Ursachen und
Auswirkungen. Insbesondere extensives Weideland (rangelands) steht durch zunehmende
Landnutzungsänderungen unter Druck. Das Borana Rangeland in Südäthiopien wird seit
Jahrhunderten von Pastoralisten bewirtschaftet. Bevölkerungswachstum, Landprivatisierung und
damit einhergehende Einzäunung, aktuelle Klimaanomalien und zunehmende ackerbauliche
Nutzung der Weidegründe haben die traditionelle Landnutzung verändert. Zusätzlich hat die
äthiopische Regierung diese Veränderungen durch Implementierung von Großprojekten zur
Förderung von Bewässerung und Ackerbau gefördert. Ziel der vorliegenden Arbeit war es, Art
und Umfang von Landnutzungsänderungen und Veränderungen der Vegetation des Borana
Rangelands an fünf Untersuchungsstandorten zu analysieren, um die Transformationsdynamik
mit ihren Ursachen und Wirkungen besser zu verstehen und die gewonnenen Erkenntnisse
Planungs- und Entscheidungsakteuren zur Verfügung zu stellen. Die spezifischen Ziele der
Arbeit waren i.) Quellen von Treibhausgasemissionen und Potentiale von Kohlenstoffsenken in
afrikanischen Rangeland-Ökosystemen anhand einer Literaturanalyse zusammenzustellen, ii.)
die Dynamik von Landnutzungsveränderungen im Borana Rangeland anhand von
Fernerkundungsdaten und Daten aus Haushaltsbefragungen zu untersuchen iii.) Ursachen der
Ausweitung des Ackerbaus am agro-pastoralen Untersuchungsstandort Darito mittels
Geographischen Informationssystem (GIS), Daten aus partizipativen GPS/GIS Methoden,
anbaugeschichtlichen Interviewdaten und multipler linearer Regressionsanalyse zu erfassen, und
iv.) das Ausmaß von Veränderungen der Vegetationsdecke mittels phänologischer Daten zu
Feldfrüchten, Niederschlagdaten, und NDVI Daten zu analysieren. Dieser Informationsgewinn
kann zur Entwicklung von Werkzeugen für eine effektivere Landnutzungsplanung beitragen.

ZUSAMMENFASSUNG
vi
Das Untersuchungsgebiet im Borana Rangeland umfasst 735,90 km² (Koordinaten: 4°45′20ʺN,
4°5′20″N und 38°22′40ʺ0, 30°9′20ʺ0, Zone 37N). Die Studie war Teil eines größeren
Forschungsprojektes. Es wurden fünf Vergleichsstandorte ausgewählt: ein überwiegend agro-
pastoraler Standort (Darito), drei vorwiegend pastorale Standorte mit geringer agro-pastoraler
Landnutzung (Did Mega, Samaro, Haralo), sowie ein ausschließlich pastoraler Standort (Soda),
die vier letzteren in Mega Distrikt. Die Vegetations ist dominiert von Bäumen und Sträuchern
der Gattungen Acacia, Boscia, Combretum, Commiphora, Cordia, Croton, Erythrina,
Euphorbia, Ficus, Terminalia, Juniperus, Rhamnus, Balanites, und Olea; Kräutern zumeist der
Gattungen Commelina, Pupalia; sowie ein- und mehrjährigen Gräsern der Gattungen Cenchrus,
Heteropogon, Dactyloctenium, Chrysopogon, Bothriochloa, Cyperus, Digitaria, Sporobolus,
Cynodon, und Chloris. Die Niederschlagsverteilung ist bimodal (lange Regenzeit von März bis
Mai, kurze Regenzeit von Oktober bis Dezember). Der Jahresniederschlag im langjährigen
Mittel beträgt zwischen 100 und 600 mm, die Durchschnittstemperaturen liegen zwischen 15 und
24°C. Dominante Bodenarten sind chromhaltige Braunerde, Parabraunerde, eutrische Braunerde,
Fluvisol und Nitisol. Die Datenerhebung erfolgte von August bis Dezember 2012 und von
Februar bis Mai 2014.
Basierend auf einer Literaturanalyse wurde ein schematisches Modell zur Veranschaulichung der
Quellen von Treibhausgasemissionen entwickelt in ostafrikanischen Rangelands. Dabei wurden
Tierhaltung, Ackerbau und Biomasseextraktion (z.B. für Feuerholz) als wesentliche
Landnutzungsaktivitäten berücksichtigt, sowie - aufgrund ihres potentiellen Beitrags zu
Treibhausgasemissionen und Kohlenstofffixierung - auch natürliche Faktoren wie
Bodenmikroorganismen und Makrozersetzer (z.B. Termiten). Feuer (gezieltes Abbrennen von
Vegetation) als Managementinstrument sowohl in der Tierhaltung als auch im Ackerbau wurde
berücksichtigt, da es direkt und indirekt auf Emissionen und potentielle Kohlenstoffspeicherung
wirkt. Zudem wurde auf abiotische Faktoren (z.B Temperatur und Niederschlag) eingegangen,
da diese Nährstoffflüsse zeitlich und räumlich beeinflussen und auf Landnutzung,
Treibhausgasemissionen und Kohlenstoffsequestrierung wirken.
Veränderungen der Landnutzung und des Pflanzenbewuchses und deren Ursachen wurden
anhand von Landsat Satellitenbildern (1985 und 2011; 30 m Auflösung), Daten aus 265
Haushaltsbefragungen, und Niederschlagsdaten des Äthiopischen Wetterdienstes (1975 und

ZUSAMMENFASSUNG
vii
2012) analysiert. In den unterschiedlichen Versuchsgebieten wurden zwischen 1985 und 2011
erhebliche Veränderungen der Vegetation festgestellt. In Darito erhöhte sich die ackerbaulich
genutzte Fläche um 12,49%, während Buschland um 10,04% zurückging. In den anderen vier
Gebieten weitete sich der Ackerbau nicht aus (lediglich in Haralo und Did Mega wurden
marginale Zuwächse ermittelt), hier nahm Grasland zwischen 17 und 28% zu, während
Buschland um 20 bis 30% zurückging. Lediglich in Haralo nahm die Ausbreitung von Land ohne
Bewuchs (bare land) mit 13,14% deutlich zu. Der Verlust von Buschland ist wahrscheinlich auf
die Extraktion von Holz für Baumaterial, Feuerholz und Holzkohle zurückzuführen. Die
beobachteten Veränderungen (Zunahme von Ackerland in Darito, Zunahme von „bare land“ in
Haralo, Rückgang von Buschland in allen Gebieten) begünstigen Prozesse die voraussichtlich zu
steigenden Treibhausgasemissionen und geringerer Kohlenstofffixierung führen. Hauptgründe
für die Ausweitung des Ackerbaus (insbesondere in Darito) waren: anhaltende Dürre, Verlust
von Futterquellen und Diversifizierung von Einkommensquellen. Politische Veränderungen,
Landprivatisierung, Bevölkerungsdruck auf vorhandene Ressourcen, und die Intervention eines
Wasserprojektes haben zu erhöhter Konkurrenz um Weideland geführt und damit sicher auch zu
Landnutzungsänderungen beigetragen.
Für die Analyse der zeitliche und räumlichen Ausweitung des Ackerbaus in Darito anhand einer
Stichprobe von 108 Feldern und 54 individuellen Landwirten, wurden Daten aus partizipativer
Kartierung (participatory GIS) verbunden mit GPS Tracking, Interviewdaten, retrospektiven
saisonalen Anbaukalendern, sowie thematische Kartenlayer (Boden, Niederschlag, Hangneigung,
Digitales Höhenmodell) und statistische Modellierung kombiniert. Zwischen 1984 und 2014
nahm Ackerlands jährlich um 6,9±5,5 Hektar (ha) zu. Ackerbau wurde vorwiegend auf
chromhaltigen Braunerden mit Jahrsniederschlägen zwischen 900 und 1000 mm, und auf Feldern
mit Hangneigungen <5º betrieben. Hangneigung und geographische Höhe erklärten signifikant
die Richtung der Ausweitung des Ackerbaus während Bodenart, Entfernung zum (saisonalen)
Flusslauf und Niederschlag nicht signifikant waren. Das niedrige Bestimmtheitsmaß (R²=0,154)
weist jedoch darauf hin, dass andere, in dieser Studie nicht erfasste Faktoren eine größere Rolle
bezüglich der räumlichen Ausweitung des Ackerlands spielen. Ackerbau wurde vorwiegend in
den niedrig liegenden Gebieten mit natürlicher Busch –und Graslandvegetation ausgeweitet.

ZUSAMMENFASSUNG
viii
Vegetationsveränderungen wurden anhand MODIS NDVI Daten (16 tägig; 250m Auflösung) mit
von 2002 bis 2012, phänologischer Beobachtungsdaten von Feldfrüchten und
Niederschlagsdaten analysiert. Die phänologischen Daten dienten dazu, Zeitpunkte festzustellen,
an denen auf Ackerland besonders hohe (Begrünung vor der Ernte) oder niedrige (nach der
Bodenbearbeitung) NDVI Werte zu erwarten sind. Zu diesen Zeitpunkten konnte Ackerland von
Baum-, Busch- und Grasland anhand von Spektralprofilen unterschieden werden. In der
Anbauphase zwischen März und April (Zeitpunkt der Bodenbearbeitung) lagen die NDVI-Werte
unter 0,25 während sie zum Zeitpunkt der größten Begrünung über 0,45 lagen. In der
Anbauperiode zwischen September und Oktober war dieser Unterschied weniger ausgeprägt. Im
Zeitraum 2002 bis 2010 war ein Zusammenhang zwischen NDVI und Niederschlag nur in
wenigen Jahren erkennbar. In Mega hatten die ausschließlich pastoralen und die agro-pastoralen
Standorte allen untersuchten Jahren bis auf 2003 NDVI Werte unter 0,4 im Jahresdurchschnitt.
Am agro-pastoralen Standort Darito lag der NDVI Wert im gleichen Zeitraum – bis auf 2008 - in
allen Jahren im Jahresdurchschnitt über 0,4. Für die Monate Januar 2002 und 2012 zeigten die
meisten Pixel auf den Karten für Darito (wo Ackerbau ausgeweitet wurde) NDVI Zunahmen von
bis zu 0,3164, jedoch waren in einigen wenigen Pixeln (überwiegend Ackerland) Verluste von
bis zu -0,0642 festzustellen. Die Karten von September 2002 und 2012 zeigten NDVI Zunahmen
von bis zu 0,4285 und Verluste von bis zu -0,5253. Auch hier waren Verluste vorwiegend auf
Ackerflächen zu verzeichnen. Eine ähnliche Analyse für die vier Standorte in Mega - an denen
sich deutlich weniger Ackerland befindet - im Monat September ergab vergleichsweise moderate
NDVI Zuwächse (bis zu 0,104) für die meisten Pixel, während Verluste von bis zu -0,2579 nur
lokal begrenzt und weniger ausgeprägt als in Darito festgestellt wurden. Für den Monat Janur
zeigte die Veränderungskarte der Mega-Standorte Verluste von bis zu -0,1065 und Zuwächse
von bis zu 0,3805, wobei Verluste auf wesentlich größeren Flächen zu beobachten waren. Auf
den Standorten Darito und Mega haben die NDVI Werte im Erhebungszeitraum abgenommen,
was auf einen Verlust natürlicher Rangelandvegetation hinweist.
Die vorliegende Studie hat Trends in der Landnutzungsdynamik an fünf Standorten des Borana
Rangelands aufgezeigt. Landnutzungsänderungen tragen direkt oder indirekt zu
Treibhausgasemissionen bei. Ausweitung ackerbaulicher Nutzung und Extraktion von Biomasse
reduziert das Kohlenstoffspeicherpotential des Ökosystems. Landnutzer und Landnutzungsplaner
sollten Ressourcenmanagementstrategien entwickeln, die auf Emissionseinsparungen abzielen,
ZUSAMMENFASSUNG
ix
beispielsweise indem Ackerbauflächen an solchen Standorten etabliert werden, an denen die
genannten Auswirkungen geringer sind. Solche Strategien können dazu beitragen, die
Bedürfnisse der Landnutzer, nationale Planungsziele und internationale Anstrengungen zur
Emissionsminderung besser in Einklang zu bringen.
NDVI Zeitreihendaten in ein GIS integriert stellen ein Werkzeug bereit, das Planer für
partizipative Landnutzungsplanung mit Landnutzern und weiteren Akteuren einsetzen können.
Die geringe räumliche Auflösung der verwendeten NDVI Daten von 250 m stellt dabei noch eine
Herausforderung dar, weil auf stark heterogenen Standorten, mit sich ausweitenden Ackerflächen
umgeben von natürlicher Vegetation, eine Unterscheidung von Ackerland und Rangeland
kleinräumig erschwert ist, da die Fläche eines Pixels verschiedene Vegetationsformen in
unterschiedlichen Anteilen enthält („Mixed Pixel Effekt“). Für die Entwicklung und Anwendung
eines Echtzeit Monitoring Systems, beispielsweise mit einem zweiwöchigen oder monatlichem
Erhebungsintervall, wären höher auflösende NDVI Daten, Multispektralband, oder Daten des
Hyperion EO-1 Sensors (Earth Observing-1) notwendig, um kleinräumig eine differenziertere
Unterscheidung zwischen Ackerland und natürlicher Rangeland-Vegetation zu erhalten.

LIST OF PAPERS
x
List of papers
This thesis is submitted to the Faculty of Organic Agricultural Sciences of the University of
Kassel for the fulfillment of the requirement of the degree Doktor der Agrarwissenschaften (Dr.
agr.). Chapters 2 – 5 are manuscripts for publication in international peer reviewed journals as
first author and have been published/ submitted for publication as follows:
Chapter 2: Elias, M., Wasonga, O., Richter, U., Hensel, O. & Hülsebusch, C. (2015).
Greenhouse gas emissions and carbon sink potentials in African rangeland ecosystems_Review
(Accepted to Journal of Agriculture and Rural Development in the Tropics and Subtropics
JARTS; www.jarts.info; Status: under review).
Chapter 3: Elias, M., Hensel, O., Richter, U., Hülsebusch, C., Kaufmann, B. & Wasonga, O.
(2015). Land Conversion Dynamics in the Borana Rangelands of Southern Ethiopia: An
Integrated Assessment Using Remote Sensing Techniques and Field Survey Data,”
Environments, 2, 1-31. doi: 10.3390/environments2010001 including a correction published
under Environments, 2, 385–387; doi:10.3390/environments2030385.
Chapter 4: Elias, M., Richter, U., Wasonga, O., Hensel, O. & Hülsebusch, C. (2015).
Determinants of land use change for cultivation expansion at Darito agro-pastoral rangeland in
Borana Ethiopia using GPS/GIS and multiple linear regression modelling (submitted to Land
Use Policy; http://www.journals.elsevier.com/land-use-policy; Status: under review).
Chapter 5: Elias, M., Richter, U., Wasonga, O., Hensel, O. & Hülsebusch, C. (2015). Monitoring
of vegetation changes using phenological observations of crops, rainfall and NDVI data in the
Borana rangelands, Ethiopia (submitted to the Journal of Arid Environments;
http://www.journals.elsevier.com/journal-of-arid-environments; Status: under review).
ACKNOWLEDGEMENTS
xi
Acknowledgements
Foremost, I thank the German Academic Exchange Service (DAAD) and Ministry of Education
and Vocational Training (MoEVT) of Tanzania for providing this scholarship.
I sincerely thank my two advisors Prof. Dr. Oliver Hensel and Dr. Christian Hülsebusch who
provided opportunity to join their team, without whom, truly I would not have been here today
and this work would not have been possible. I am grateful for their support, intellectual guidance
and encouragement from inception of the project until this submission. I extend my regards to
second advisor Dr. Christian Hülsebusch for the magnificent time we spent during his visit in the
Borana, Ethiopia for collecting data. His guidance helped me all the time of research and writing
this thesis.
Beside my advisors, I deeply thank Prof. Dr. Mathias Becker (University of Bonn) and Prof. Dr.
Eva Schlecht (Universities of Kassel and Göttingen) for agreeing to assess this work and their
participation in the oral examination.
I deeply thank Dr. Uwe Richter for his intellectual advice and proof reading my work that made
this study possible. Sincere thanks are extended to Prof. Dr. Brigitte Kaufmann, Prof. Dr.
Folkard Asch, Dr. Oliver Wasonga and Dr. Margareta Amy Lelea for their concrete contributions
in this research project. I am grateful to Dr. Sascha Kirchner, Dr. Barbara Sturm, Dr. Stefanie
Retz, Dr. Franz Román, Dr. Florian Pforte, Dr. Stuart Crichton, Dr. Carolina Bilibio and Dr.
Christian Dede for the academic enlightenment during my research. I am delighted to thank all
my colleagues at the Department of Agricultural and Biosystems Engineering, Witzenhausen in
particular, Karin Link, Michael Hesse and Christian Schellert for providing access to research
equipment. I sincerely thank Dr. Katja Brinkmann and Pascal Fust for their constructive advice
on GIS techniques.
I sincerely thank the Mkwawa University College of Education, a constituent college of the
University of Dar es Salaam for permitting and supporting me during my studies. Extended
thanks to German Institute for Agriculture in the Tropics and Subtropics (DITSL) for supporting
fieldwork logistic within the collaborative project ʺLivelihood diversifying potential of livestock
based carbon sequestration options in pastoral and agro-pastoral systems in Africa, Ethiopiaʺ
funded by Federal Ministry for Economic Cooperation and Development (BMZ), Germany. Ms

ACKNOWLEDGEMENTS
xii
Ute Dietrich and Claudia Blaue are warmly appreciated for organizing my stay and fieldwork
logistics.
Special thanks to my lovely mother Lydia B. Mgalula and my dearest wife Anasia E. Saria for
their endless support in the course of my study. I extend many thanks to my father in law
Elingaya Saria and mother Joana Motta Saria for encouraging me during my study. I thank my
family, my brothers (Big Dr. Leslie Mgalula) and sisters (Big Mary Mgalula) for their love,
support and cheering me during my study. I am delighted to Mwanaima Rajab, Hawa Mushi,
Marcus Frank, Jackline Ogolla, Henrike Hüseman, Juliane Vieth, Wolfgang Dewald, Ivan
Adolwa, Maria Restrepo, Guyo Roba, Dr. Hussein Wario, Dr. Justus Ochieng, Sibylle Faust,
Marie-Luise Hertkorn, Reem Al-naib, Usama Nasher, Jan Pfister, Joana Albrecht, Issa Irwa, Eva
Hilt and Jessica Lloyd for their cooperation during my study. I am grateful to the family of
Hilmar Apel and his wife Beate Linke-Apel, Gerhard Hahn and his wife Ulla Hahn, Willfried
Gerstenberg, Claus Schmitt, Leo Petersmann, Matthias Traube and Consolata Maunde for their
parent-like support, generous care and home feelings during my stay in Germany. Special thanks
to Dr. Silvester Kacholi, Dr. Charles Lyimo, Dr. Deusdedit Rwehumbiza, Dr. Isabela Mtani, Dr.
Theresia Dominic, Dr. Elisante Mshiu and Dr. Emanuel Munishi for your enormous support
during my study.
I thank the administration of the Yabello Pastoral and Agriculture Research Centre, Oromia, for
their enormous support during data collection, working and sleeping space in Borana rangeland.
TABLE OF CONTENTS
xiii
Table of contents
Contents Summary………………………………………………………………………………………………….i
Zusammenfassung ..................................................................................................................................... v
List of papers............................................................................................................................................. x
Acknowledgements .................................................................................................................................. xi
Table of contents .....................................................................................................................................xiii
Tables…………………………………………………………………………………………………..xvii
Figures………………………………………………………………………………………………...xviii
Acronyms, Abbreviations, Nomenclature and Symbols .......................................................................... xx
1. General introduction ............................................................................................................................ 1
1.1. Current trends in atmospheric greenhouse gas concentration and rangelands ..................... 1
1.1.1. Characteristics of rangelands ................................................................................................ 2
1.1.2. Greenhouse gas mitigation options and uncertainties .......................................................... 4
1.1.3. Contemporary issues on African rangelands ........................................................................ 4
1.1.4. The study site ........................................................................................................................ 6
1.1.5. Problem and justification ...................................................................................................... 7
1.1.6. Objective of the study ........................................................................................................... 8
1.1.6.1. Specific objectives ................................................................................................................ 8
1.1.7. Theoretical approaches in land use and land cover changes ................................................ 8
1.1.7.1. Definition of terms ............................................................................................................... 8
1.1.7.2. Approaches in assessing land use - land cover change and carbon stock dynamics ............ 9
1.1.8. Structure of this thesis ........................................................................................................ 10
References .......................................................................................................................... 12
2. Greenhouse gas emissions and carbon sink potentials in African rangeland ecosystems_Review ... 17
2.1. Introduction ........................................................................................................................ 17
2.2. Greenhouse gas emissions in rangeland ecosystems .......................................................... 20
2.2.1. Agriculture and rangeland conversion to cropland ............................................................. 21
2.2.2. Livestock husbandry ........................................................................................................... 26
2.2.2.1. Animal nutrition and feeding ...................................................................................... 26
2.2.2.2. Manure management ...................................................................................................... 27
2.2.2.3. Grazing management ..................................................................................................... 28
2.2.3. Range fires – burning biomass as a management tool ........................................................ 29
TABLE OF CONTENTS
xiv
2.2.4. Plant biomass extraction ..................................................................................................... 30
2.2.5. Biotic and abiotic processes ............................................................................................... 31
2.3. Potential for carbon sequestration in African rangelands ................................................... 32
2.4. Synthesis, conclusion and further research ......................................................................... 35
References .......................................................................................................................... 36
3. Land conversion dynamics in the Borana rangelands of southern Ethiopia: an integrated assessment using remote sensing techniques and field survey data .............. 47
3.1. Introduction ........................................................................................................................ 47
3.2. Materials and Methods ....................................................................................................... 49
3.2.1. The study areas ................................................................................................................... 49
3.2.2. Data collected for land use and land cover classification ................................................... 51
3.2.3. Socio-economic data .......................................................................................................... 52
3.2.4. Data analysis ....................................................................................................................... 53
3.2.4.1. Land cover classification and change detection ................................................................. 53
3.2.4.2. Socio-demographic and economic profile of the respondents ............................................ 54
3.2.4.3. Rainfall data and the number farmers over time ................................................................ 54
3.3. Results ................................................................................................................................ 55
3.3.1. The land cover changes ...................................................................................................... 55
3.3.1.1. Land cover changes in the Darito site ................................................................................ 55
3.3.1.2. Land cover changes in Mega sites ...................................................................................... 57
3.3.2. Socio-economic information and economic activities ........................................................ 63
3.3.2.1. Socio-demographic characteristics ..................................................................................... 63
3.3.2.2. Socio-economic and demographic profiles and their linkages to land use ......................... 63
3.3.2.3. Major economic activities and sources of income .............................................................. 64
3.3.2.4. Land ownership and the temporal growing of cultivation in the study sites ...................... 65
3.3.2.5. Perceived drivers behind the expansion of cultivation ....................................................... 68
3.3.3. Decadal rainfall and the number of farmers who started cultivation .................................. 69
3.3.4. The implications of cultivation and land management on the rangeland ........................... 70
3.4. Discussion .......................................................................................................................... 72
3.4.1. Land cover changes between 1985 and 2011 ..................................................................... 72
3.4.2. Drivers contributing to the expansion of cultivation in the rangeland ............................... 76
3.5. Conclusion .......................................................................................................................... 80
References .......................................................................................................................... 83
4. Determinants of cultivation expansion at Darito agro-pastoral rangeland in Borana Ethiopia using GPS/GIS and multiple linear regression modelling .................................................. 87
4.1. Introduction ........................................................................................................................ 87
TABLE OF CONTENTS
xv
4.2. Materials and Methods ....................................................................................................... 89
4.2.1. Study area ........................................................................................................................... 89
4.2.2. Data collected ..................................................................................................................... 90
4.2.3. Sampling ............................................................................................................................. 91
4.2.4. Analyses ............................................................................................................................. 93
4.2.4.1. Spatial analyses .................................................................................................................. 93
4.2.4.2. Statistical analyses .............................................................................................................. 93
4.2.4.3. Multiple linear regression model ........................................................................................ 94
4.3. Results ................................................................................................................................ 94
4.3.1. Farm size distribution and the association with rainfall at Darito ...................................... 94
4.3.2. Spatial pattern in cultivation expansion .............................................................................. 95
4.3.3. The influence of elevation, soil and distance to the river valley on cultivation expansion ........................................................................................................................... 98
4.3.4. The slope of the study area and cultivation potentialities................................................. 100
4.4. Discussion ........................................................................................................................ 100
4.5. Conclusion ........................................................................................................................ 103
References ........................................................................................................................ 105
5. Monitoring of vegetation changes using phenological observations of crops, rainfall and NDVI data in the Borana rangelands, Ethiopia ................................................................ 110
5.1. Introduction ...................................................................................................................... 110
5.1.1. Theoretical basis for vegetation index .............................................................................. 112
5.1.2. Applications of NDVI data for vegetation analyses ......................................................... 112
5.2. Methods ............................................................................................................................ 113
5.2.1. Study sites ......................................................................................................................... 113
5.2.2. Data collected ................................................................................................................... 114
5.2.2.1. Sampling of cropland areas and the vegetation types ....................................................... 114
5.2.2.2. Phenology data ................................................................................................................. 116
5.2.2.3. Rainfall, temperature and NDVI data ............................................................................... 116
5.2.3. Analyses ........................................................................................................................... 116
5.2.3.1. Spatial analyses ................................................................................................................ 116
5.2.3.2. Statistical analyses of NDVI data ..................................................................................... 117
5.2.3.3. Rainfall and temperature analyses .................................................................................... 117
5.2.4. Workflow .......................................................................................................................... 118
5.3. Results .............................................................................................................................. 118
5.3.1. Rainfall characteristics of the Darito and Mega sites in the Borana rangeland ................ 118
5.3.2. The spatial and temporal mean annual NDVI trends in Darito and Mega ....................... 120

TABLE OF CONTENTS
xvi
5.3.3. Correlation between monthly rainfall and NDVI ............................................................. 120
5.3.4. Vegetation classification and changes in the NDVI between 2002 and 2012 .................. 123
5.3.5. Characterising vegetation types based on unique NDVI profiles ..................................... 126
5.4. Discussion ........................................................................................................................ 129
5.4.1. Rainfall and NDVI trends ................................................................................................. 129
5.4.2. Spatial-temporal changes in vegetation ............................................................................ 130
5.4.3. Vegetation classification and changes .............................................................................. 130
5.4.4. Characterising vegetation types ........................................................................................ 131
5.5. Conclusion ........................................................................................................................ 132
References ........................................................................................................................ 133
6. General discussion of the methods and findings of the study ......................................................... 137
6.1. Introduction ...................................................................................................................... 137
6.2. Methods and key findings ................................................................................................ 137
6.3. Study limitation and suggestions ...................................................................................... 144
6.4. Conclusion and recommendations .................................................................................... 144
References ........................................................................................................................ 146
Appendices ...................................................................................................................................... 148
i. Household questionnaire .................................................................................................. 148
ii. Key informant interviews local communities ................................................................... 151
iii. Key informant interviews officials ................................................................................... 152
iv. Checklist questions for focus group discussion community members ............................. 153
v. Rainfall sheet .................................................................................................................... 154
vi. Phenology sheet ................................................................................................................ 156
vii. BBCH-scale ...................................................................................................................... 157
FIGURES
xvii
Tables Table 1.1. Ecological zones, vegetation and land uses of Africa’s rangelands. ................................................... 3
Table 2.1. Carbon sequestration for various recommended management practices. ......................................... 22
Table 2.2. Land area of Eastern Africa rangelands converted into cultivated land. ........................................... 25
Table 2.3. Estimates of carbon sequestration potential of different land use and management practices
in African rangelands. ....................................................................................................................... 34
Table 3.1. Description of the criteria used to classify land use and land cover type .......................................... 53
Table 3.2. Summary of the land cover and land cover changes in Darito site ................................................... 55
Table 3.3. Summary of the land cover and land cover changes in Mega sites ................................................... 60
Table 3.4. Comparison of mean family size, land size and income across the study sites: N = 265 ................. 64
Table 3.5. Ranked economic activities and sources of income of the respondents: N = 265 ............................ 65
Table 3.6. Comparison of land size per hectares (ha) across the village, by family size, children in
school and cropping history (X2 test): N = 265 ................................................................................. 67
Table 4.1. Determinant variables influencing cultivation expansion:
N = 108, R2 = 0.154, F = 6.313, p= 0.001 ......................................................................................... 98
Table 5.1. Description used to identify and classify vegetation types. ............................................................ 115
Table 5.2. The association between monthly rainfall and NDVI composition: p <0.05; N = 12 months. ....... 121
Table 5.3. Comparison of mean NDVI for vegetation types (2002 to 2012): One-way ANOVA. .................. 127

FIGURES
xviii
Figures Figure 1.1. Terrestrial distribution of rangeland and non-rangeland biomes (Launchbaugh and Strand
2015)……. .......................................................................................................................................... 2
Figure 1.2. Land conversion in the rangelands of Borana: (photo March, 2014). ................................................. 5
Figure 1.3. Location of the study sites. ............................................................................................................... 11
Figure 2.1. Land use management and natural processes contributing to greenhouse gas emissions
via different pathways. (+) and (-) indicate a positive/negative contribution of activities
or processes to GHG emissions. ....................................................................................................... 21
Figure 3.1. Study sites ......................................................................................................................................... 51
Figure 3.2. Land cover and land cover change maps in Darito site 1985 (a) and 2011 (b). ................................ 57
Figure 3.3. Land cover and land cover change maps in Mega sites 1985 (a) and 2011 (b). ............................... 62
Figure 3.4. Age cohorts of respondents. .............................................................................................................. 63
Figure 3.5. Trends of numbers of agro-pastoralists from 1960 to 2012 in Kebele. ............................................. 66
Figure 3.6. Drivers behind the expansion of cultivation in the study sites. ......................................................... 68
Figure 3.7. Comparison of the deviation of mean monthly rainfall from the long-term mean and the
number of new farmers engaging in cultivation in Darito (a) and Mega sites (b). ........................... 70
Figure 3.8. Land preparation under crop cultivation. .......................................................................................... 71
Figure 3.9. Farming management practices. ....................................................................................................... 71
Figure 3.10. Development of gully erosions around cultivated land in Did mega site
(photo November, 2012). .................................................................................................................. 76
Figure 4.1. Location of the study area, elevation and rainfall zones. .................................................................. 90
Figure 4.2. Polygons of crop fields and settlements areas overlaid on a GeoEye google image
acquired in 2015. .............................................................................................................................. 92
Figure 4.3. Land area taken into cultivation from 1984 to 2014 by farmers in Darito, Borana,
Ethiopia, and total annual rainfall: N = 54. ....................................................................................... 95
Figure 4.4. Spatial and temporal pattern of cultivation expansion at Darito, Borana, Ethiopia:
N = 108 fields. .................................................................................................................................. 96
Figure 4.5. Land cover of year 2011 and the spatial distribution of cultivated areas in relation
to soil types. ...................................................................................................................................... 97
Figure 4.6. Area taken into cultivation from 1984 to 2014 and cumulated increase of agricultural
area by 54 farmers in Darito, Borana, Ethiopia. ............................................................................... 98
Figure 4.7. Association between cultivated land area and elevation (a), and age under cultivation
and elevation (b) in Darito, Borana, Ethiopia (1984 – 2014), N = 108 for 54 farmers. .................... 99
Figure 4.8. Location of crop fields and slope in Darito, Borana, Ethiopia: N = 108. ........................................ 100
Figure 5.1. Locations and elevation maps of the study sites. ............................................................................ 114

FIGURES
xix
Figure 5.2. Workflow for data analyses and vegetation mapping. .................................................................... 118
Figure 5.3. Climate diagrams for Darito and Mega: rainfall data for both sites obtained
from 1975 to 2012 while temperature data for Darito was obtained from 1962 to 2012
and for Mega, 1984 to 2012. ........................................................................................................... 119
Figure 5.4. Total annual rainfall in (mm), Source: Ethiopian Meteorological Agency (EMA, 2012). ............. 119
Figure 5.5. Inter-annual variability of mean NDVI for Darito and Mega sites: a black line at
0.4 NDVI score is the threshold score for sparse and dense vegetation.......................................... 120
Figure 5.6. Inter-seasonal variability of NDVI pattern at Darito (a & b) and at Mega (c & d) sites,
Borana, Ethiopia. April wet season and September dry season during the year 2002. ................... 122
Figure 5.7. Inter-seasonal variability of the NDVI pattern at Darito (a & b) and Mega (c & d) sites,
Borana, Ethiopia. April wet season and September dry season during the year of 2012. ............... 123
Figure 5.8. Vegetation maps for Darito during the short dry season in January, (plate a, and b) and
the long dry season September, (plate d, and e). Plate c, and f shows change maps
between January 2002/2012 and September 2002/2012. ................................................................ 124
Figure 5.9. Vegetation maps for the Mega sites during the short dry season in January, (plate a, and b)
and the long dry season September, (plates d, and e). Plate, c, and f show maps of changes
between January 2002/2012 and September 2002/2012. ................................................................ 125
Figure 5.10. Mean annual NDVI profile for vegetation types, Darito (D) and Mega (M) sites. ......................... 126
Figure 5.11. Seasonal comparisons of NDVI for vegetation types in the year 2012: high NDVI
correspond to rainy seasons and low NDVI to the dry seasons. ..................................................... 127
Figure 5.12. NDVI profile for cropland at different phenological phases in the year 2012 for two
cropping seasons. ............................................................................................................................ 128
Figure 5.13. Comparisons of the mean NDVI for grassland and cropland with different percentage
of biomass cover in the year 2012: N = 5 pixels. ............................................................................ 129

ACRONYMS
xx
Acronyms, Abbreviations, Nomenclature and Symbols ANOVA Analysis Of Variance
AU African Unity
DEM Digital Elevation Model
EMA Ethiopian Meteorological Agency
EMA Ethiopian Mapping Agency
FAO Food and Agriculture Organization of the United Nations
GEI gross energy ingested
GHG Greenhouse Gases
GIS Geographic Information Systems
GPS Global Positioning System
IPCC Intergovernmental Panel on Climate Change
Kg Kilogram
LiDAR Light Detection And Ranging, a remote sensing technology that measures distance by
illuminating a target with a laser and analysing the reflected light
MEA Millennium Ecosystem Assessment
Mg Megagram
MODIS Moderate-resolution Imaging Spectroradiometer
NDVI Normalized Difference Vegetation Index
NIR Near InfraRed
nm Nanometre
NPP Net Primary Productivity
ppb parts per billion
ppm parts per million
REDD Reducing Emissions from Deforestation and Forest Degradation
ROI Region of Interest
SOC Soil Organic Carbon
UN United Nations
UNEP United Nations Environment Programme
UTM Universal Transverse Mercator
WGS World Geodetic System
WRI World Resource Institute
μg Microgram

CHAPTER ONE
1
1. General introduction
1.1. Current trends in atmospheric greenhouse gas concentration and rangelands
Since 1750 through 2011 the global average of atmospheric concentrations of greenhouse gases
(GHG), carbon dioxide (CO2), methane (CH4), and nitrous oxide (N2O) have increased (IPCC
2013). According to IPCC (2013), CO2 rose from 285 ppm to 391 ppm, CH4 from 700 ppb to
1803 ppb, and N2O rose from 270 ppb to 324 ppb. These concentrations have changed the
atmospheric chemistry, precipitation, biogeochemical cycles, and climate system and contribute
to global warming (Forster et al., 2007). The witnessed increases were caused by human activity,
i.e. industrialisation-based combustion of fossil fuels, transport, building, land use changes,
deforestation and increase and intensification of agriculture (Lal 2004; IPCC 2007). These
actions disturb the exchange of greenhouse gases between the terrestrial ecosystem and the
atmosphere. The enduring climate change influences ecosystems’ net primary productivity,
nutrients fluxes and thus in turn is one driver that induces change in land use systems. These
changes have effects on ecosystems, and rangelands are particularly affected because they are
situated in regions with low total annual rainfall and high temporal and spatial rainfall
variability. On the other hand, they may play a significant role in mitigating climate change
through sequestering atmospheric carbon. Atmospheric carbon is stored in different pools, i.e.
above ground vegetation biomass, below ground biomass (e.g. roots, soil microbes and macro
decomposers) and soil organic carbon (humus). However such capacity is determined by climate,
soil properties and land uses in different biomes. The soil organic carbon pool (SOC) varies
across biomes. Tropical forest, boreal and tundra forest have a SOC pool of about ≥19 kg C m _2,
warm and dry forest ±13 kg C m _2, and desert, dry forest and savanna rangelands have smallest
SOC pool ˂10 kg C m _2 (De Deny et al., 2008; Xia et al., 2013). Though rangelands have a
relatively low SOC pool compared to forest biomes, they have potential to store carbon in the
soil for a longer time because of the slow turnover of carbon below ground (Abberton et al.,
2010). About 41.3% of the world’s landmass is classified as rangeland (about 6 billion hectares
(MEA 2005), (Figure 1.1) higher than forest cover that is estimated at 30% (3.8 billion hectares)
(FAO & JRC 2012). With such an extensive coverage, rangelands can store up to 10–30% of
global soil organic carbon (SOC) (Grace et al., 2006; Derner and Schuman 2007; UN 2011),

CHAPTER ONE
2
hence must be considered the second major terrestrial soil organic carbon pool after the forest
biome (WRI 2000).
Figure 1.1. Terrestrial distribution of rangeland and non-rangeland biomes (Launchbaugh and
Strand 2015).
1.1.1. Characteristics of rangelands
Rangelands are heterogeneous ecosystems characterised by hyper arid, arid, semi-arid and dry
sub-humid climates and they can be termed as drylands based on an aridity index (MEA 2005).
Rangelands comprise of native woodland trees or savannas, grassland, shrublands and or
bushland (Reid et al., 2005). They are characterised by low and erratic precipitation but they
support extensive livestock husbandry (pastoralism), wildlife conservation and rainfed
agriculture in dry-sub humid and humid areas and other ecosystem services and goods. In Africa,
rangelands cover 43% of the terrestrial surface (IRIN 2007). Homewood (2004) defines African
rangelands as landscapes dominated by natural or semi-natural vegetation, suitable habitat for
herds of wild or domestic ungulates. Table 1.1 summarises the characteristics of vegetation in
Africa’s rangelands. Many different vegetation classifications exist for rangeland biomes. For the
purpose of this study, rangeland vegetation is classified into six different categories: 1.
Woodland, landscapes dominated by trees; 2. Bush/shrubland landscapes with few trees

CHAPTER ONE
3
dominated by bushes and grasses; 3. grassland, only single trees and bushes mainly grass
vegetation; 4. Shrub/grassland with seasonal floods, landscapes with seasonal floods and
vegetated; 5. Farmland, the land that is mainly used for farming or is under crop cultivation; 6.
Bare land, land without vegetation cover. The criteria used for land use and land cover
classification follow the rangeland classification systems for Eastern Africa by (Pratt et al.,
1966).
Table 1.1. Ecological zones, vegetation and land uses of Africa’s rangelands.
No Ecological zones Rainfall (mm) Dominant vegetation
characteristics Land use and management
1 Afro-alpine moorland and grassland
1200 - 2000 Afro-alpine moorland and grassland
Low range-use potential; limited by altitudes.
2 Humid to dry-sub humid
600 -1200
Forest, grasslands and shrubland, also ground-water forests may occur under a climate drier than dry-sub humid
Agriculture potential and livestock production.
3 Dry-sub humid to semi-arid
500 -1000
Woodland canopy cover more than 10% with underneath herbaceous dominated by closed or sparse wood trees with understory shrub, herbs or grasses, bush land or savanna. Vegetation is broad leaf and mostly evergreen
Agriculture potential is high. Livestock production is also possible. Regular burning is important when tall Hyparrhenia dominates grasslands.
4 Semi-arid
200 - 800
Dry forms of woodland and savanna often dominated by Acacia-Themeda association. Intermediate sub-types either wood trees or bush species.
Potential for grazing but sensitive to overgrazing. It is mostly managed by occasional burning.
5 Arid
200 - 400 Woody vegetation being dominant (Commiphora, Acacia and allied genera). Dominated by perennial grasses like Cenchrus ciliaris and Chloris roxburghiana
Only locally suited for agriculture. Wild life conservation is suitable if dry thorn–bush land predominates. Burning is effective for but cautionary controlled.
6 Very arid
< 200 Dwarf shrub grassland and or very dry forms of bushed grassland with species (Acacia reficiens subsp. misera). Perennial grasses (Chrysopogon aucheri). Mostly vegetation are confined around depressions and water courses
Low potential range. Livestock grazing based on nomadic way on vegetation patchiness. Wildlife is also important though limited by environmental constraints (dryness).
Sources: Pratt et al. (1966); FAO (1989); Herlocker (1999); FAO (2004); UNEP (2009).

CHAPTER ONE
4
1.1.2. Greenhouse gas mitigation options and uncertainties
Though rangelands are believed to have potential to mitigate climate through sequestering
atmospheric carbon, there are uncertainties. For instance, the land use activity such as rangeland
conversion for agriculture expansion, e.g., private plantations, is a major cause of vegetation and
below ground carbon loss (Neely et al., 2009; Reid et al., 2014). Apart from that, the transition
from pastoral land use to agriculture activity /or diversifying pastoralism with crop farming are
enduring challenges in these ecosystems. The process alters the capacity of rangeland
ecosystems to provide sink benefits and climate change mitigation (Lal 2004; 2015). As the land
is modified, the carbon stored in different pools together with methane and nitrous oxide gases
are emitted and contribute to atmospheric greenhouse gas concentrations and hence climate
change processes. On the other hand, climate change intensifies changes in land use as people
trying to cope with enduring variances. In such a spiral of changes it is impossible to implement
strategies to mitigate emissions without up-to-date information about the status of land use and
land cover changes. Generating such information can support decision makers and land use
planners in reconciling efforts to increase livelihood and land productivity with reaching national
and international goals of GHG emission reduction and carbon sequestration potentials.
1.1.3. Contemporary issues on African rangelands
The major challenges that African rangelands face are land conversion for farming or pasture
expansion and land degradation (AU-IBAR 2012; Reid et al., 2014). These are mainly caused by
population growth, increasing competition for resources but also exacerbated by contemporary
climate anomalies (Snyaman & du Preez 2005; Hoffman & Vogel 2008). In particular converting
rangelands into agricultural land contributed to loss of vegetation cover, soil erosion and
deterioration of soil organic carbon storage (Safriel et al., 2005). Agriculture in rangelands is
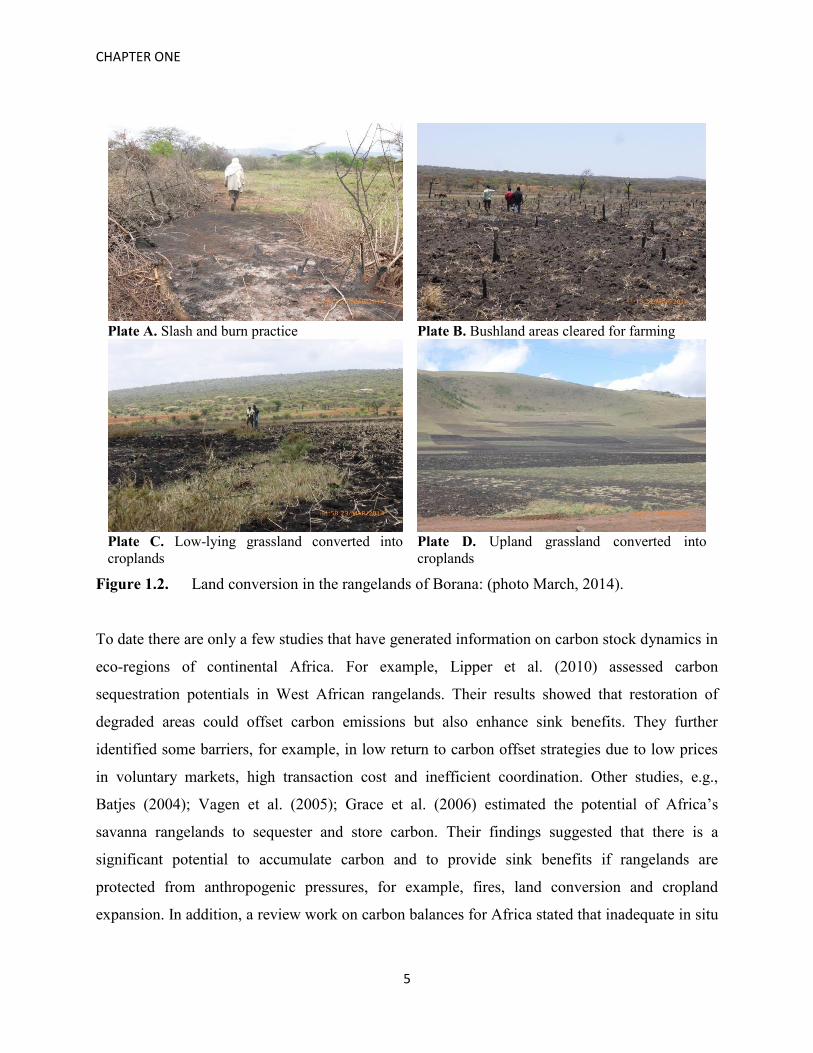
almost always associated with clearing of the natural and spontaneous vegetation (Figure 1.2,
Plate A, B, C, & D) and appears to have larger and much more different effects bearing upon
both, GHG emissions and carbon stock dynamics, than land-use activities that strategically use
the spontaneous vegetation in these systems. These indicators manifest an ecological and
economic loss of rangeland productivity and a corresponding threat to economic security. The
aforementioned concerns must be considered in land use planning. However, this would require
current information about the status of land use and land cover change also at higher spatial and
temporal resolution.
CHAPTER ONE
5
Plate A. Slash and burn practice Plate B. Bushland areas cleared for farming
Plate C. Low-lying grassland converted into croplands
Plate D. Upland grassland converted into croplands
Figure 1.2. Land conversion in the rangelands of Borana: (photo March, 2014).
To date there are only a few studies that have generated information on carbon stock dynamics in
eco-regions of continental Africa. For example, Lipper et al. (2010) assessed carbon
sequestration potentials in West African rangelands. Their results showed that restoration of
degraded areas could offset carbon emissions but also enhance sink benefits. They further
identified some barriers, for example, in low return to carbon offset strategies due to low prices
in voluntary markets, high transaction cost and inefficient coordination. Other studies, e.g.,
Batjes (2004); Vagen et al. (2005); Grace et al. (2006) estimated the potential of Africa’s
savanna rangelands to sequester and store carbon. Their findings suggested that there is a
significant potential to accumulate carbon and to provide sink benefits if rangelands are
protected from anthropogenic pressures, for example, fires, land conversion and cropland
expansion. In addition, a review work on carbon balances for Africa stated that inadequate in situ

CHAPTER ONE
6
data from savannas have made it difficult to characterise the carbon stocks or fluxes in
rangelands (Ciais et al., 2011).
A study by Tennigkeit & Wilkies (2008) on the potentials for carbon finance in African
rangelands elucidated other constraints, for example, lacking recognition of pastoralist’s land
rights, imperfect cooperation between land users and practitioners. Neely & Wilkes (2009)
reviewed the potentials of drylands in mitigating climate change. They suggested that improved
farming practices such as fallowing could contribute significantly to soil organic carbon
sequestration in sub Saharan Africa. Nevertheless, there is sparse information about the
opportunity cost of implementing carbon sequestration management practices at different scales
and management systems. These studies have fallen short of capturing the heterogeneity of local
land use and management characteristic for Africa’s rangelands. As a result, decisions at local
level on resource use rely on continental or global estimates that do not take the differences at a
country or location specific level into account (UNEP 2008). These insights highlight the need to
generate location-specific information at different levels so as to complement eco-regional,
continental and global estimates. One way to construct a better understanding of the past and
present changes in land use and its impact on carbon storage potentials and greenhouse gas
emissions is through remote sensing data combined with ground based field surveys.
1.1.4. The study site
This study was designed under the project “Livelihood diversifying potential of livestock based
carbon sequestration options in pastoral and agro-pastoral systems in Borana rangeland Ethiopia”
funded by the Federal Ministry for Economic Cooperation and Development (BMZ). The project
focused on the biophysical potential of rangelands to sequester carbon under changing land use
and on the resource use strategies and management options that land users and other actors have
to adapt to change. The Borana rangeland covers a total land area of about 95,000 km2 (Kamara
et al., 2004) in Southern Ethiopia (Figure 1.3), between 1090 and 2204 meters above sea level
(cf. Figure 3.1, 4.1 and 5.1). Rainfall is bimodal (cf. Figure 5.3) with a short rainy season from
October to December and a long rainy season March to May. Average annual rainfall ranges
from 100 to 600 millimetres; the average temperature ranges from 15 to 24°C. Vegetation
communities include woody plants (Acacia spp, Boscia mossambicensis, Combretum molle,
Commiphora schimperi, Cordia africana, Croton macrostachyus, Erythrina melanacantha,

CHAPTER ONE
7
Euphorbia tirucalli, Ficus sycomorus, Terminalia brownii, Terminalia prunioides, Juniperus
procera, Rhamnus prinoides, Balanites aegyptiaca and Olea europaea subsp. cuspidate ), shrub
plants (Commiphora Africana), herbs plants (Commelina africana, Pupalia lappacea), and
annual and perennial grasses (Cenchrus ciliaris, Heteropogon contortus, Dactyloctenium species,
Chrysopogon auchei, Bothriochloa insculpta, Cyperus species, Digitaria naghellensis,
Sporobolus pellucidus, Digitaria milanjiana, Cynodon dactylon, Chloris roxburghiana) (Desta &
Coppock 2002). The ecosystem supports a multitude of economic and ecological benefits to the
inhabitants.
1.1.5. Problem and justification
Traditionally, pastoralism has been the mainstay of the Borana, who inhabited the area since
before the 13th century (Coppock 1994), and who are recognised as the standing pastoral
community for their well-established practices in managing rangeland resources under the
communal system (Angassa 2002). However, over the past three decades some dynamics in
resource use occurred (Solomon et al., 2007; Angassa & Oba 2008). Fratkin (2001) analysed the
privatisation scenario of communal rangelands and demographic changes. Solomon & Coppock
(2002) analysed cattle population dynamics, rainfall trends and the resulting economic losses.
Studies such as (Coppock 1994; Tefera et al., 2007; Tache & Oba 2010; Flintan et al., 2011)
elucidated the weakening of the communal system of managing range-resources, grazing
pressure, poverty and crop farming expansion in the Borana rangeland. The aforementioned
changes together with recurrent droughts during the 1980s and 1990s have increased stress on
resources and pastoralist production (Desta & Coppock 2004). As a result, there have been
progressive changes in land use while the resulting land cover changes and its implications on
the ecosystem to support carbon sequestration have not been explicitly analysed (Haile et al.,
2010). This study was designed in order to analyse the nature and extent of land use and land
cover change and to examine the drivers behind the changes. The study seeks to understand
whether the management of land has the potential to offset emission and enhancing carbon
sequestration benefits in order to provide land use planners and decision makers with
information and tools to monitor land use change and devise sustainable land use strategies for
the Borana rangelands reconciling their needs with national objectives but also promoting global
efforts in mitigating greenhouse gas emissions. The study methods combined geospatial analyses
and vegetation changes, socio-economic, and long-term rainfall and temperature analyses.

CHAPTER ONE
8
1.1.6. Objective of the study
The objective of this study was to analyse the nature and extent of land use and land cover
changes in five study sites of the Borana rangeland.
1.1.6.1. Specific objectives
i. To provide a review on greenhouse gas emission sources and carbon sink potentials in
African rangeland ecosystems.
ii. To do an integrated assessment of land conversion dynamics in the Borana rangelands of
Southern Ethiopia using remote sensing techniques and field survey data.
iii. To examine determinants of land use change for cultivation expansion at Darito agro-
pastoral rangeland in Borana Ethiopia using participatory GPS/GIS techniques,
interviews on field cropping history, and multiple linear regression modelling.
iv. To analyse the extent of vegetation changes using phenological observations of crops,
rainfall and time series normalized difference vegetation index (NDVI) data in the
Borana rangelands, Ethiopia.
1.1.7. Theoretical approaches in land use and land cover changes
1.1.7.1. Definition of terms
Land use refers to the purpose for which humans use land (i.e. protected areas, forest, plantation,
crop or agricultural land, pasture land, settlement and construction), while land cover is the
ecological state and physical appearance of the land surface (i.e. forest, grassland, wetland)
(Turner II and Meyer 1994). Land use dynamics refers to the changes in patterns of land use by
human over time. The changes are influenced by the human population and their associated
activities on the land (Dale et al., 2000). Change in use may or may not cause a significant
change in land cover. For example, selective forest harvest to protected forest will not cause
much cover change in the short time. Likewise transforming cultivated land or agricultural land
to grassland or forest will change the land cover and there will be considerable changes in the
ecosystem and its biodiversity. On the contrary, land use change that involves conversion of
natural forest or grassland to cultivated land will cause a large change in cover (Turner II et al.,
1994). The latter change has significant consequences for land cover, and for many aspects of
local, regional and global environment – including climate, atmospheric chemistry, vegetation,
biodiversity, soil conditions, water, eutrophication and sediment flows, human health and

CHAPTER ONE
9
livelihoods. Therefore, regional and global assessments can provide the spatial and temporal
resolutions required to identify the causes and major variations on ecosystems’ (Tian et al.,
2015). In addition, narrowing our assessments to regions or locations (Turner II et al., 1994), can
greatly improve our understanding and permits to capture the local dynamics in land use. In this
study therefore, the term land cover change refers to conversion of natural rangelands into
mainly cultivated land or cropland. “Cultivated land” means all crop fields cultivated by farmers
to produce agricultural crops while rangelands refers to land cover with spontaneous vegetation
as described in section 1.1.1.
1.1.7.2. Approaches in assessing land use - land cover change and carbon stock dynamics
Land use and land cover changes contribute to global change (Lambin et al., 2003), thus, broader
approaches are required in order to understand and predict the impacts of the process at regional
to global scales (Townshend et al., 1991; Taylor et al., 2002). Several land use models have been
developed and used for simulating carbon-nitrogen dynamics in relation to land cover changes
(Xia et al., 2013); however, there exist some uncertainties among models. For instance, decisions
to use a certain a model depend on the availability of input data (e.g. land use information). Input
data about land use and management changes is particularly needed in order to predict patterns
of carbon stock changes. According to the IPCC (Carré et al., 2010) guide for the calculation of
land carbon stocks Tier 1, illustrates that carbon stock changes are a result of converting a native
forest land to cropland or cultivated land. Thus, the assessment should consider the carbon stock
on the land before conversion and the carbon stock after conversion of an area of land converted
in a given year. The following formula is used:
∆𝐶𝐿𝑈 = (𝐶𝐴𝐹𝑇𝐸𝑅 − 𝐶𝐵𝐸𝐹𝑂𝑅𝐸) ∗ 𝐴𝑇0
where,
Δ CLUC carbon stock changes as a result of conversion from a generic land-use category to cropland (t C ha-1).
CBEFORE carbon stock on land before the conversion (t C ha-1)
CAFTER carbon stock on land after conversion (t C ha-1)
ATO area of land use converted to another land use in a given year (ha yr-1).

CHAPTER ONE
10
However, the appropriate method to compute carbon stocks (either before or after conversion)
depends on the availability of land use data (IPCC).
Therefore, apart from modelling approaches in assessing land cover change and carbon dynamics
(Hersperger et al., 2010), accurate mapping of land cover change at different spatial and
temporal scales is necessary for predicting patterns of terrestrial ecosystems carbon pools and
fluxes (McGuire et al., 2001). Since change in land use supposedly contributes to land cover
change and carbon stock dynamics (Reid et al., 2014), quantifying the extent of land cover
change and the driving factors behind such changes is one major step for establishing land use
inventory data or input data. Such data can be used in designing models for predicting carbon
dynamics and land cover changes. This study therefore, is built in the analytical approach of the
IPCC procedures in calculating carbon stock changes as a result of land use and land cover
changes. The main approaches used in this entire study is the land use and land cover change
analyses, vegetation dynamics in the Borana rangeland using geospatial analyses, vegetation
analyses and other field survey data. The study also examines the extent of land cover changes
and the management on carbon stocks dynamics and greenhouse gas emissions.
1.1.8. Structure of this thesis
This thesis is organised into six chapters: chapter one presents an introduction of the research
topic, problem justification, and objectives. Chapter two provides a review on greenhouse gas
emission sources and carbon sink potentials in African rangelands. The first and second chapter
identify research gaps in the existing body of knowledge and show the importance of generating
location-specific information through integrated methods. Chapter three presents the nature and
extent of land use and land cover changes from five communities in the Borana rangeland:
geospatial analyses, rainfall trends, and socio-economic analyses. Chapter four demonstrates the
potential of participatory GPS spatial data, interview information about farming history, GIS
applications and multiple linear regression modelling in tracking retrospective cultivation
expansion at local scale landscapes in the Darito agro-pastoralist area. Chapter five integrates
time series NDVI data, phenology observation and rainfall records to analyse the causes and
extent of change in vegetation composition in purely-pastoral and mixed-agro-pastoral managed
areas in Borana rangeland Ethiopia. Chapter six delivers a general discussion of the methods and
key findings, limitations, conclusion and recommendations.

CHAPTER ONE
11
Figure 1.3. Location of the study sites.

CHAPTER ONE
12
References
Abberton, M., Conant, R. & Batello, C. (2010). Grassland carbon sequestration: Management, policy and economics. Integrated Crop Management, 11, 338. http://www.carbonranching.org/INTRO/Integrated_Crop_Management.pdf. Accessed on 16 December, 2015.
Angassa, A. & Oba, G. (2008). Herder Perceptions on Impacts of Range Enclosures, Crop Farming, Fire Ban and Bush Encroachment on the Rangelands of Borana, Southern Ethiopia. Hum Ecol. 36, 201–215. doi: 10.1007/s10745-007-9156-z. Angassa, A. (2002). The effect of clearing bushes and shrubs on range condition in Borana, Ethiopia. Trop. Grass. 36, 69–76. AU-IBAR. (2012). Rational Use of Rangelands and Fodder Crop Development in Africa: AU-IBAR Monographic Series, 1, 1–37. Batjes, N.H. (2004). Carbon stocks and projected changes according to land use and management: A case study for Kenya. Soil Use and Management, 20, 350–356. Carré, F., Hiederer, R., Blujdea, V. & Koeble, R. (2010). Background Guide for the Calculation of Land Carbon Stocks in the Biofuels Sustainability Scheme Drawing on the 2006 IPCC Guidelines for National Greenhouse Gas Inventories. EUR 24573 EN. Luxembourg: Office for Official Publications of the European Communities. 109pp. Ciais, P., Bombelli, A., Williams, M., Piao, S.L., Chave, J., Ryan, C.M., Henry, M., Brender, P. & Valentini, R. (2011). The carbon balance of Africa: synthesis of recent research studies. Phil. Trans. R. Soc. 369, 1–20. Coppock, D.L. (1994). (Ed.). The Borana Plateau of Southern Ethiopia: Synthesis of pastoral research, development and change, 1980 -91.ILA (International Livestock Centre for Africa), Addis Ababa. Ethiopia, 393. Dale, V.H., Brown, S. Haeuber, R.A., Hobbs, N.T., Huntly, N. Naiman, R.J., Riebsame, W.E., Turner, M.G. & Valone, T.J. (2000). Ecological principles and guidelines for managing the use of land. Ecological Applications, 10(3), 639–670.
De Deyn, G.B., Cornelissen, J.H.C. & Bardgett, R.D. (2008). Plant functional traits and soil carbon sequestration in contrasting biomes. Ecology Letters, 11(5), 516–531. doi:10.1111/j.1461-0248.2008.01164.x.
Derner, J.D. & Schuman, G.E. (2007). Carbon sequestration and rangelands: A synthesis of land management and precipitation effects. Journal of Soil and Water Conservation, 62(2), 77–85.
Desta, S. & Coppock, D.L. (2002). Cattle population dynamics in the southern Ethiopian. Journal Of Range Management, 55, 439–451.

CHAPTER ONE
13
Desta, S. & Coppock, D.L. (2004). Pastoralism under pressure: Tracking system change in southern Ethiopia. Human Ecology, 32, 485–486. FAO & JRC. (2012). Global forest land-use change 1990–2005, by Lindquist, E.J., D’Annunzio, R., Gerrand, A., MacDicken, K., Achard, F., Beuchle. R., Brink, A., Eva, H.D., Mayaux, P., San-Miguel-Ayanz, J. & Stibig, H-J. FAO Forestry Paper No. 169. Food and Agriculture Organization of the United Nations and European Commission Joint Research Centre. Rome, FAO. 1–39. FAO. (1989). Arid zone forestry: A guide for field technicians. Version 20. http://www.fao.org/docrep/T0122E/TO122E00.htm. Accessed on 13 February, 2012. FAO. (2004). Carbon sequestration in dryland soils, Argentina: Version 102. Retrieved from http://www.fao.org/docrep/007/y5738e/y5738e00.htm. Accessed on 25 October, 2011. Flintan, F., Tache, B. & Eid, A. (2011). Rangeland fragmentation in traditional grazing areas and its impact on drought resilience of pastoral communities: Lessons from Borana, Oromia and Harshin, Somali Regional States, Ethiopia. 1–16. Forster, P., Ramaswamy, V., Artaxo, P., Berntsen, T., Betts, R., Fahey, D.W., Haywood, J., Lean, J., Lowe, D.C., Myhre, G., Nganga, J., Prinn, R., Raga, G., Schulz, M. & Van Dorland, R. (2007). Changes in Atmospheric Constituents and in Radiative Forcing. In Solomon, S., Qin, D., Manning, M. & Chen, Z. (Eds.), Climate Change 2007: The Physical Science Basis. Contribution of Working Group I to the Fourth Assessment Report of the Intergovernmental Panel on Climate Change, 131–217. Fratkin, E. (2001). East African Pastoralism in Transition: Maasai, Boran, and Rendille Cases. African Studies Review, 44(3), 1–25. http://www.jstor.org/stable/525591. Grace, J., San José, J., Meir, P., Miranda, H.S. & Montes, R.A. (2006). Productivity and Carbon fluxes of tropical savannas. J. Biogeogr. 33, 387–400. doi:10.1111/j.1365-2699.0148x. Haile, G., Assen, M. & Ebro, A. (2010). Land use/cover dynamics and its implications since the 1960s in the Borana rangelands of Southern Ethiopia. Livestock Research for Rural Development, 22, 132. http://www.lrrd.org/lrrd22/7/hail22132.htm. Accessed on 8 March, 2013. Herlocker, D. (1999). Rangeland Ecology and Resources Development in Eastern Africa: their ecology and development. German Technical Cooperation (GTZ), Nairobi, Kenya, 2–213. Hersperger, A.M., Gennaio, M., Verburg, P.H. & Bürgi, M. (2010). Linking land change with driving forces and actors: four conceptual models. Ecology and Society 15(4): 1. [online] URL: http://www.ecologyandsociety.org/vol15/iss4/art1/. Hoffman, T.M. & Vogel, C. (2008). Climate change impacts on African rangelands. Plant Conservation Unit Botany Department University of cape Town South Africa. Rangelands, 30 (3), 12–17.

CHAPTER ONE
14
Homewood, M.K. (2004). Policy, environment and development in African rangelands. Environmental Science & policy, 7, 125–143. www.elsvier.com/locate/envsc. Accessed on 26 July, 2011. IPCC. (2007). Climate Change 2007: Mitigation. Contribution of Working Group III to the Fourth Assessment Report of the Intergovernmental Panel on Climate Change [Metz, B., Davidson, O.R., Bosch, P.R., Dave, R. & Meyer, L.A. (Eds.)], Cambridge University Press, Cambridge, United Kingdom and New York, NY, USA, XXX. IPCC. (2013). Summary for Policymakers. In: Climate Change 2013: The Physical Science Basis. Contribution of Working Group I to the Fifth Assessment Report of the Intergovernmental Panel on Climate Change [Stocker, T.F., Qin, D., Plattner, G.-K., Tignor, M., Allen, S.K., Boschung, J., Nauels, A., Xia, Y., Bex, V. & Midgley, P.M. (eds.)]. Cambridge University Press, Cambridge, United Kingdom and New York, NY, USA. IRIN. (2007). Africa: Can pastoralism survive in the 21st century? UN Integrated Regional Information Networks, World Press: http://www.worldpress.org/Africa/2861.cfm. Accessed on 23 November, 2011.
Kamara, A.B., Swallow, B. & Kirk, M. (2004). Policies, Interventions and Institutional Change in Pastoral Resource Management in Borana, Southern Ethiopia. Development Policy Review, 22(4), 381–403. doi:10.1111/j.1467-7679.2004.00256.x.
Lal, R. (2004). Soil carbon sequestration to mitigate climate change. Geoderma, 123, 1–22.
Lal, R. (2015). Restoring Soil Quality to Mitigate Soil Degradation. Sustainability, 7(5), 5875–5895. doi:10.3390/su7055875.
Lambin, E.F., Geist, H.J. & Lepers E. (2003). Dynamics of land-use and land-cover Change in tropical regions. Annu. Rev. Environ. Resour. 28:205–41. doi: 10.1146/annurev.energy.28.050302.105459. Launchbaugh, K. & Strand, E. (2015). Rangelands of the world. Society for Range Management, http://www.webpages.uidaho.edu/what-is-range/rangelands_map.htm, 18 September 2015. Lipper, L., Dutilly-Diane, C. & McCarthy, N. (2010). Supplying Carbon Sequestration from West African Rangelands: Opportunities and Barriers. Rangeland Ecology & Management, 63(1), 155–166. McGuire, A.D., Sitch S, Clein, J.S., Dargaville, R., Esser, G., Foley, J., Heimann, M., Joos, F., Kaplan, J., Kicklighter, D.W., Meier, R.A., Melillo, J.M., Moore III, B., Prentice, I.C., Ramankut, N., Reichenau, A,T., Schloss, A., Tian, H., Jilliams, L.J. & Wittenbergs U. (2001). Carbon balance of the terrestrial biosphere in the twentieth century: analyses of CO2, climate and land-use effects with four process-based ecosystem models. Glob. Biogeochem. Cycles 15(1), 183–206.

CHAPTER ONE
15
MEA. (2005). Millennium Ecosystem Assessment and Human Well-being: Desertification Synthesis: By Safriel, U., Adeel, Z., Niemeijer, D., Puigdefabregas, J., White, R., Lal, R., Wilson, M., Ziedler, J., Prince, S., Archer, E., King, C., Shapiro, B., Wessels, K., Nielsen, T., Portnov B., Reshef, I., Thonell, J., Lachman, E. & McNab, D. (2005). Chapter 22: Dry land Systems’’. In Ecosystems and Human Well-being: Current State and Trends, Volume 1. Hassan, R., Scholes, R. & Ash, N. (Eds.) World Resource Institute, Washington, DC, 625–653. Neely, C., Bunning, S. & Wilkes, A. (2009). Review of evidence on drylands pastoral systems and climate change: Implications and opportunities for mitigation and adaptation. Land and Water Discussion Paper 8. (Eds.). FAO, Rome, Italy, 1–38. Pratt, D.J., Greenway, P.J. & Gwynne, M.D. (1966). A classification of East Africa Rangeland, with an Appendix on terminology. Journal of Applied Ecology, 3(2), 369–383.
Reid, R.S., Fernández-Giménez, M.E. & Galvin, K.A. (2014). Dynamics and Resilience of Rangelands and Pastoral Peoples Around the Globe. Annual Review of Environment and Resources, 39(1), 217–242. doi:10.1146/annurev-environ-020713-163329.
Reid, R.S., Serneels, S., Nyabenge, M. & Hanson, J. (2005). The changing face of pastoral systems in grass-dominated ecosystems of eastern Africa. In: FAO Grasslands of the world (2005): Chapter 2. Suttie, J.M., Reynolds, S.G. & Batello, C. (Eds.), 19–65. Safriel, U., Adeel, Z., Niemeijer, D., Puigdefabregas, J., White, R., Lal, R., Wilson, M., Ziedler, J., Prince, S., Archer, E., King, C., Shapiro, B., Wessels, K., Nielsen, T., Portnov B., Reshef, I., Thonell, J., Lachman, E. & McNab, D. (2005). Ecosystems and Human Well-being: Current State and Trends: Chapter 22: ‘‘Dryland Systems’’ Volume 1. Hassan, R., Scholes, R. & Ash, N. (Eds.), 2–22. Snyman, H.A. & du Preez, C.C. (2005). Rangeland degradation in a semi-arid South Africa—II: influence on soil quality. Journal of Arid Environments, 60, 483–507. doi:10.1016/j.jaridenv.2004.06.005. Solomon, D. & Coppock, D.L. (2002). Cattle population dynamics in the southern Ethiopian rangelands, 1980-97. J. Range Manage. 55, 439–451. Solomon, T.B., Snyman, H.A. & Smit, G.N. (2007). Cattle-rangeland management practices and perceptions of pastoralists towards rangeland degradation in the Borana zone of southern Ethiopia. Journal of Environmental Management 82, 481–494. doi:10.1016/j.jenvman.2006.01.008. Tache, B. & Oba, G. (2010). Is poverty driving Borana herder in southern Ethiopia to crop cultivation? Hum. Ecol. 38, 639–649. Taylor, C., Lambin, E.F., Stephenne, N., Harding, R. & Essery, R. (2002). The influence of land-use change on climate in the Sahel. J. Clim. 15(24), 3615–29. Tefera, S., Snyman, H.A. & Smit, G.N. (2007). Rangeland dynamics in southern Ethiopia: (1) Botanical composition of grasses and soil characteristics in relation to land-use and distance
CHAPTER ONE
16
from water in semi-arid Borana rangelands. Journal of Environmental Management, 85, 429–442. doi:10.1016/j.jenvman.2006.10.007. Tennigkeit, T. & Wilkies, A. (2008). An Assessment of the Potential for Carbon Finance in Rangelands. ICRAF Working Paper, 68, 1–31.
Tian, F., Fensholt, R., Verbesselt, J., Grogan, K., Horion, S. & Wang, Y. (2015). Evaluating temporal consistency of long-term global NDVI datasets for trend analysis. Remote Sensing of Environment, 163, 326–340. doi:10.1016/j.rse.2015.03.031.
Townshend, J., Justice, C., Li, W., Gurney, C. & McManus, J. (1991). Global Land Cover Classification by Remote Sensing: Present Capabilities and Future Possibilities. Remote Sen. Environ. 35, 243-255. Turner, B.L., II. & Meyer, W.B. (1994). Global land-use and land-cover change: an overview. Pages 3–10 in Meyer W.B. & Turner B.L. II, editors. Changes in land use and land cover: a global perspective. Cambridge University Press, Cambridge, UK. Turner, II, B.L., Meyer, W.B. & Skole, D.L. (1994). Global Land-Use/Land-Cover Change: Towards an Integrated Study. Integrating Earth System Science, Ambio, 23(1), 91–95. UN. (2011). Global Drylands: A UN System-wide response. Prepared by the Environment Management Group. Chapter 1- 4, 14–129. UNEP. (2008). Carbon in Drylands: Desertification, Climate Change and Carbon Finance: A UNEP-UNDP-UNCCD Technical Note for Discussion at CRIC 7, Istanbul, Turkey-03-14 November, 2008, 2–12. UNEP. (2009). Climate change in the African drylands: Options and opportunities for adaptation and mitigation. UNEP, UNCCD and UNDP, United Nations Development Programme, One UN Plaza, New York, NY, 10017, USA, 17–44. Vagen, T.G., Lal, R. & Singh, B.R. (2005). Soil carbon sequestration in Sub-Saharan Africa: A review. Land Degra. Develop. 16, 53–7. World Resources Institute (WRI). (2000). Pilot Analysis of Global Ecosystems Grassland Ecosystems. White, R.P. Murray, S. & Rohweder, M. (Eds.), 1–70. http://www.wri.org/wr2000. Xia, J., Luo, Y., Wang, Y. & Hararuk, O. (2013). Traceable components of terrestrial carbon storage capacity in biogeochemical models. Global Change Biology, 19, 2104–2116, doi: 10.1111/gcb.12172. Xia, J., Luo, Y., Wang, Y.P. & Hararuk, O. (2013). Traceable components of terrestrial carbon storage capacity in biogeochemical models. Global Change Biology, 19(7), 2104–2116. doi:10.1111/gcb.12172.
CHAPTER TWO
17
2. Greenhouse gas emissions and carbon sink potentials in African rangeland
ecosystems_Review
Abstract: Rangelands are natural sinks of atmospheric carbon in the form of soil organic carbon, thus, they have potential to mitigate climate change. However, various resource use strategies on African rangelands disturb nutrient fluxes, net primary productivity and emit greenhouse gases in different ways. Although it is well known that human activity contributes to global change, the understanding of how existing trends in resource use and the influence of natural ecosystem processes on gas emissions are incomplete. First, this article reviews the principal sources of greenhouse gas emissions related to agricultural expansion, livestock husbandry and range fires. It then looks at natural process such as soil microbes and the activity of macro-decomposers. The impact of precipitation and temperature on nutrient fluxes is shown. Second, various resource use and management strategies were identified and the uncertainties facing rangeland ecosystems indicated. Third, the potential African rangelands under different management practices have to sequester carbon were shown. The article identified research issues requiring further study; in order to capture the local dynamics of resource use; location specific data is needed, the spatial-temporal trends in land use changes need assessing, along with factors affecting carbon sink processes under different management practices. This information is needed for a better understanding of the carbon dynamics in Africa at different scales. Much existing evidence is aggregated on regional or continental scales with little site specific proof; policy implementation for resource users at the local context resource is based on evidence inappropriate for the local scale.
2.1. Introduction The increase in the concentration of atmospheric greenhouse gases is a significant driver of
global change (MEA 2005; Solomon et al., 2009; IPCC 2013). Most of this increase is associated
with human activities such as industrial combustion of fossil fuels, agriculture, deforestation, and
land use changes; all exacerbated by contemporary climate anomalies. Therefore, enhancing the
capacity of terrestrial ecosystems to sequester carbon in the form of CO2 (IPCC 2001; 2007), and
to minimise emissions related to combustion of fuels, land use changes, agricultural practices
and deforestation is important (Ringius 2002 & Niles et al., 2002). Rangelands are the second
largest terrestrial carbon pool after forest ecosystems (WRI 2000), and they are believed to have
a large potential to sequester carbon, mainly because of the amount of space they cover -
currently estimated at 41.3% of the world’s terrestrial surface (Nosetto et al., 2006; Lal 2011;
UN 2011). By virtue of this extensive coverage, rangelands can store 10–30% of global soil
organic carbon (SOC), (Lal 2004; Derner and Schuman 2007) and sequester 198 million tons

CHAPTER TWO
18
(Mt) equivalent to 179.623 Megagram (Mg) of CO2 from the atmosphere per year (McDermot
and Elavarthi 2014).
Rangelands can be classified into sub-types based on aridity index, i.e. hyper arid, arid, semi-
arid, dry-sub humid and humid with rainfall ranging from less than 200 mm in hyper arid to
above 1500 mm in humid areas (MEA 2005). In Africa, rangelands cover 43–45% of the land
surface (WRI 2003; UNEP 2009) and harbour different vegetation types such as woodland
(23.8%), grassland (19.5%), dense forest (7.5%), mosaic forest and croplands (4.3%), and
wetlands (0.9%), (Hoffman & Vogel 2008). Rangeland ecosystems support over 40% of the
continent’s population (about 268 to 325 million people) who engage in various forms of
livelihood (IRIN 2007; UNEP 2009; IIED & SOS Sahel 2010). Rangelands provide a habitat for
wild flora and fauna, and are home to most of the wildlife in Africa (Reid et al., 2005).
Rangeland also supplies products such as timber, fuel-wood, fruits, roots, gums and resins,
fodder and medicine (Herlocker 1999; Sandford & Ashley 2008). On the one hand, rangelands
provide a large variety of tangible ecosystem services; on the other hand - whilst doing this –
they can act as either source or sink for atmospheric carbon. Given the many different land use
patterns in African rangelands, uncertainties remain about whether the current pattern of land use
such as agricultural expansion, extraction of wood tree and livestock husbandry can enhance
their potential as a carbon sink. More detailed research into processes associated with different
human livelihood activities on rangeland must be carried out in order to identify land use
strategies which can enhance rangelands' carbon sink potential. This article systematically
reviews the scientific literature available looking at sources of greenhouse gases from different
land use activities pursued in African rangelands and natural ecosystem dynamics.
Since livestock husbandry (either mobile as nomadism or pastoralism, or stationary as ranching
or feedlot) has been the dominant form of land use in the African rangelands, it has transformed
the natural environment to a certain extent (Brink et al., 2014). These changes include the
conversion of rangelands into pasture land, and grazing and resting of pasture areas with both
detrimental and beneficial effects on the vegetation and the water cycles. Livestock is also often
alleged to contribute to greenhouse gas emissions (e.g. Safriel et al., 2005; MEA 2005; Gerber et
al., 2013). Alongside that, the increase of small scale agriculture or cultivation practices (Reid et
al., 2004), and the emergence of land intensive investment projects (e.g. for biofuel production),

CHAPTER TWO
19
are other changes that put pressure on African rangelands (Mortimore et al., 2009; Flintan,
2011). Apart from agricultural activities, excessive extraction of trees for firewood, construction
material and charcoal production are other actions which contribute to the loss of perennial and
woody forest vegetation in African rangelands (Bongers & Tennigkeit 2010). Besides that,
climate anomalies such as recurrent droughts, high temperature and erratic rainfall have
increased the number of natural changes observed which not only affect biomass production but
also intensify nutrient and matter fluxes in the African rangelands (Perez et al., 2007; Hoffman &
Vogel 2008; Bardgett et al., 2008). As the natural ecosystem processes changes, it drives further
changes in rangelands' land use patterns. Both anthropogenic and natural processes influence
each other. Therefore, a better understanding of the interplay between land use and natural
processes, and their effects on greenhouse gas emissions and carbon sink potentials especially in
African rangelands, to be in place in order to be able to make decisions on future rangeland
management strategies and to define rangeland development pathways.
In the contemporary discourse on land use changes, greenhouse gas emissions, climate change
mitigation, adaptation, poverty reduction and development strategies, the introduction of carbon
finance schemes has been suggested as a win-win strategy for Africa’s rangelands (Perez et al.,
2007). Carbon schemes are perceived as a possible way of exploiting the synergy between
climate change mitigation and the enhancement of pastoral livelihoods for the benefit of the
larger ecosystem. Such schemes are seen as an opportunity for striking a positive trade-off
between the use of rangeland for livestock production on the one hand, and carbon sequestration,
on the other. However, the current UN’s ˈREDD+ carbon-based payment for ecosystem services'
programmes have largely focused on forest ecosystems with little emphasis on arid and semi-arid
rangelands. This is likely due to a lack of adequate data, mostly resulting from methodological
complexities of carbon stock measurements in rangelands (Ciais et al., 2011), a limited
understanding of carbon market opportunities by the stakeholders, unclear land rights in most
communal rangelands and uncertainty of the capacity of rangelands to compete for limited
carbon markets with forest biomes (Tennigkeit & Wilkes 2008; UNEP 2008). There are not
enough studies from specific site- that have quantified carbon stocks and the sink potential of
African rangelands under different land use and management practices (Lal 2004; Lipper et al.,
2010; Ciais et al., 2011, see also Table 2.3). Consequently, policy decisions on rangeland
resource use, mitigation of greenhouse gas emissions and enhancing carbon sink capacity still

CHAPTER TWO
20
rely on continental or global aggregate estimates. Since land users at the local scale play a big
role in the implementation of policies, there is a need to scale down studies to local or country
specific levels in order to capture local dynamics in the rangeland. The prevailing variations in
climate, vegetation type, soil type and management across African rangelands mark the necessity
to establishing smaller scale estimates. Estimates from local scale studies can complement
continental or global estimates in decision making processes. In view of what has already been
mentioned, this article aims at (a) reviewing the causes of greenhouse gas emissions related to
land use and natural processes in African rangeland ecosystems; (b) identifying gaps in existing
knowledge and key questions that need further investigation and (c) examining the potential of
African rangelands to sequester carbon. The overall objective is to indicate a way forward in
achieving sustainable rangeland management which guarantees peoples’ livelihoods and long
term enhancement of carbon sink potential.
2.2. Greenhouse gas emissions in rangeland ecosystems
The activities contributing to greenhouse gas emissions in rangelands comprise land conversion
(for crop cultivation or pasture), livestock husbandry (grazing, feeding, and manure
management), extracting of plant or biological resource materials (e.g. building materials,
fuelwood and charcoal), and burning of plant biomass during clearing land ready for ploughing
and other land management. Some natural activities of soil microbes and macro-decomposers
also contribute to emissions, though these in turn are largely influenced by precipitation,
moisture, temperature, topography, soil properties, and by land management. Many of these
activities (e.g. the extraction of trees for fuelwood or charcoal, but also grazing) affect vegetation
biomass composition and remove or add to the carbon stored therein. They also influence
changes in soil organic carbon stocks. These interactions between land use, management and
natural processes in ecosystems are the major drivers of carbon stock dynamics and greenhouse
gas emissions. Figure 2.1 illustrates the processes and activities that shape carbon balances and
greenhouse gas emissions in ecosystems. There may be direct emission of CH4, CO, CO2, NH3,
NO, N2O and N2 gases during nitrification, denitrification, volatilization, or from range fires. As
GHG concentration in the atmosphere increases, changes in land management and natural
processes become more apparent.

CHAPTER TWO
21
Figure 2.1. Land use management and natural processes contributing to greenhouse gas
emissions via different pathways. (+) and (-) indicate a positive/negative
contribution of activities or processes to GHG emissions.
2.2.1. Agriculture and rangeland conversion to cropland
Agricultural activity is known to be one cause of vegetation loss and deterioration of soil organic
carbon in rangeland soils (Conant & Paustian 2002; Farage et al., 2007; Luo et al. 2011).
However, African rangelands are increasingly being converted into agricultural land (small scale
farming or plantations) e.g. for biofuels feedstock (Valentini et al., 2014). By converting
rangelands into agricultural land carbon stocks in standing vegetation and soil are significantly
altered. For example, in grassland areas, soil is the major stock of carbon; therefore, if this
carbon reserve is disturbed by cultivation practices it becomes a source of emissions rather than a
storage pool. Batjes (1996) reported that the SOC reserve in grassland has a capacity to store
about 90 to 160 Mg C ha-1. However, soils can lose their SOC reserve upon conversion within 2
to 5 years (Lal 2000b), though this depends on management practices, precipitation and
temperature. The major ways in which agricultural practices affect rangeland carbon stocks are:
clearing of virgin land for cropland extension, continuous tilling without fallowing and rangeland

CHAPTER TWO
22
fires (Lal 2000c; 2003). These three practices disturb soil microbes and macro-decomposer
functions and the soil's ecosystem in different ways (Figure 2.1). Ploughing activity weakens soil
aggregates and compactness, this process accelerates carbon emissions from cultivated lands, but
carbon losses may also occur through erosion. Therefore, adopting recommended management
practices which enhance the storage of organic matter in soils and decrease carbon loss or
emissions can have sequestration benefits for the rangelands (Lal 2011). For example, no-till
farming, the incorporation of farmyard manure, water harvesting and constructing water breaks
are considered as examples of best practice which enhance soil carbon storage in rangeland
ecosystems (Lal 2004). Other management practices (such as conservation tillage, restoration of
degraded areas and agro-forestry) have long term benefits in enhancing carbon storage (SOC and
vegetation biomass) and sequestration benefits in rangelands (Olsson & Ardö 2002). For
example, Lal (2003), Batjes 2004, and Sharma et al. (2012) illustrated the contribution of
specific recommended management practices to carbon sequestration capacity (Table 2.1).
Table 2.1. Carbon sequestration for various recommended management practices.
Management practices Carbon sequestration capacity (Mg C ha-1yr-1) Composting 1 – 2 Cover crop 0.8 – 1.2 No-till 0.1 – 0.5 Rotation 0 – 0.2 Manure 0 – 0.2 Restoration of degraded areas 0.1 – 0.4 Irrigation practices 0.05 – 0.2 Restoration of degraded soil, cropland and grassland
0 – 0.10
Units converted from Kg C ha to Mg C ha for uniformity: source: adopted from Lal 2003, Batjes 2004 and Sharma et al. 2012.
As shown on Table 2.1, specific management practices contribute differently to carbon
sequestration potential if they are appropriately implemented. The variations in sequestration
capacity in Table 2.1, are mainly due to the heterogeneous nature of agro-ecosystems (climates
and soils properties), but also to the various methods and criteria employed. Amongst the
management practices, compost, manure and restoration of degraded soils seem to have the
greatest potential to increase soil organic carbon storage and off-set anthropogenic emissions at
the same time (Lal 2011). The major limitations and uncertainties that affect carbon stock
dynamics are land use and management history, but also biophysical conditions such as
temperature and precipitation (Batjes 2004). It is often said that improving management practices

CHAPTER TWO
23
could enhancing soil organic carbon storage. However, that has always not been the case on the
ground for many farming communities of the African rangelands. Small scale farmers or those
with plantations are often hesitant to implement the management practices recommended, mainly
due to poverty and lack of economic incentives to engage in conservation practices. Other
constraints are: technology, financial and institutional conditions. For instance, a recent analysis
of changes in land cover, crop cultivation and soil management practices in five agro-pastoral
communities from the Borana rangeland in Ethiopia revealed that most cultivators rarely engage
in soil conservation practices (Elias et al., 2015). Instead, as their field plots become less
productive due to a decline in soil quality, farmers convert virgin grassland into agricultural land.
Such practices affect strategies to off-set anthropogenic emissions from agricultural practices in
the rangelands. In addition, research and development seems not to support farmers in
developing management strategies which actually fit their production context and are not just
beneficial in terms of reducing GHG emissions but also in terms of livelihood improvement.
The loss of Nitrogen (N) from agricultural land is another source of emissions related to
agriculture practice. Inappropriate land use management and inefficient use of fertilizers may
also accelerate N gas emissions from agricultural land. Fertilizer spread on fields is not entirely
taken up by plants and losses occur through leaching if there is high precipitation, run-off, and
emissions in form of gases (Lal 2004). The type and rate of fertilizer use, tillage practices, type
of crop cultivated, precipitation, temperature, soil properties and management practices are the
major factors influencing N losses in agro-ecosystems (Smil 1999). In most African rangelands,
temperature, soil moisture and precipitation varies across agro-ecosystems and the major
pathways contributing to NH3, NO, N2O and N2 losses are nitrification, denitrification, and
volatilization processes (Sugihara et al., 2012) (Figure 2.1). Indeed, the rate of N loss through
volatilization doesn't only depend on soils with high pH levels (Barton et al., 2008) but also on
soil carbon levels. By including these factors, it is possible to design and implement strategies
that decrease anthropogenic emissions from agricultural practice and also enhance carbon
sequestration potentials in rangelands on a long term basis.
A similar trend in large-scale agricultural activities is the introduction of bio-energy feedstock
plantations on African rangelands (FAO 2008; Mortimore et al., 2009). Investors lobby to
acquire land for production in the sub-humid areas of Africa with the view that the feedstock will
CHAPTER TWO
24
help solve the energy crisis, increase the proportion of plant biomass and then act as a sink for
atmospheric carbon (Kim et al., 2009). In some African countries (Tanzania for example)
Jatropha and sugarcane plantations have been set up (Habib-Mintz 2010; Kideghesho et al.,
2013); whilst in Kenya, sugarcane and palm oil is promoted (Mortimore et al. 2009). Private
investors search for land in dry sub-humid areas in the Tana Delta of Kenya for biofuel
production (FIAN 2010). Zambia and the Democratic Republic of Congo are the other countries
targeted for this plan (ProBEC 2009). In Ethiopia, about 3.7 million hectares of rangeland have
been reserved for an agricultural development project and it is anticipated that nearly 1.3 million
hectares will be used to implement the project (Flintan 2011). The increasing desire to utilise
rangelands for biofuel feedstock is uncertain to the ecosystem needs. The potential of the biofuel
feedstock to provide sink benefits as compared to natural rangelands is unknown. Table 2.2
presents a selection of examples showing the amount of land in African rangelands being
converted for biofuel feedstock plantations. Table 2.2 shows a selection of cases recorded where
rangelands were converted into agricultural land, but there have been other substantial
conversions across Africa which have not yet been quantified. The greenhouse gases released in
the conversion of virgin land into a feedstock plantation cannot be assimilated during the growth
cycle of the feedstock; this is too brief. Biofuels feedstock needs longer time than the natural
vegetation (woody, bushes or grassland) in the rangelands to provide sink benefits. The
estimated ‘‘payback period’’ for biofuels feedstock is between 100 – 1000 years. It is dependent
on the type of feedstock and the ecosystem being converted into plantations (Kim et al., 2009).
The capacity of natural vegetation to assimilate and store atmospheric carbon differs from that of
biofuels feedstock. Plant species which grow faster are likely to contribute to soil carbon pool
through the input of carbon to soil, and slower growing plants will contribute less to the soil
carbon reserve (De Deyn et al., 2008). The trade-offs from land conversion for biofuel
plantations and the associated greenhouse gas emissions have not been adequately studied
(Djomo and Ceulemans 2012).
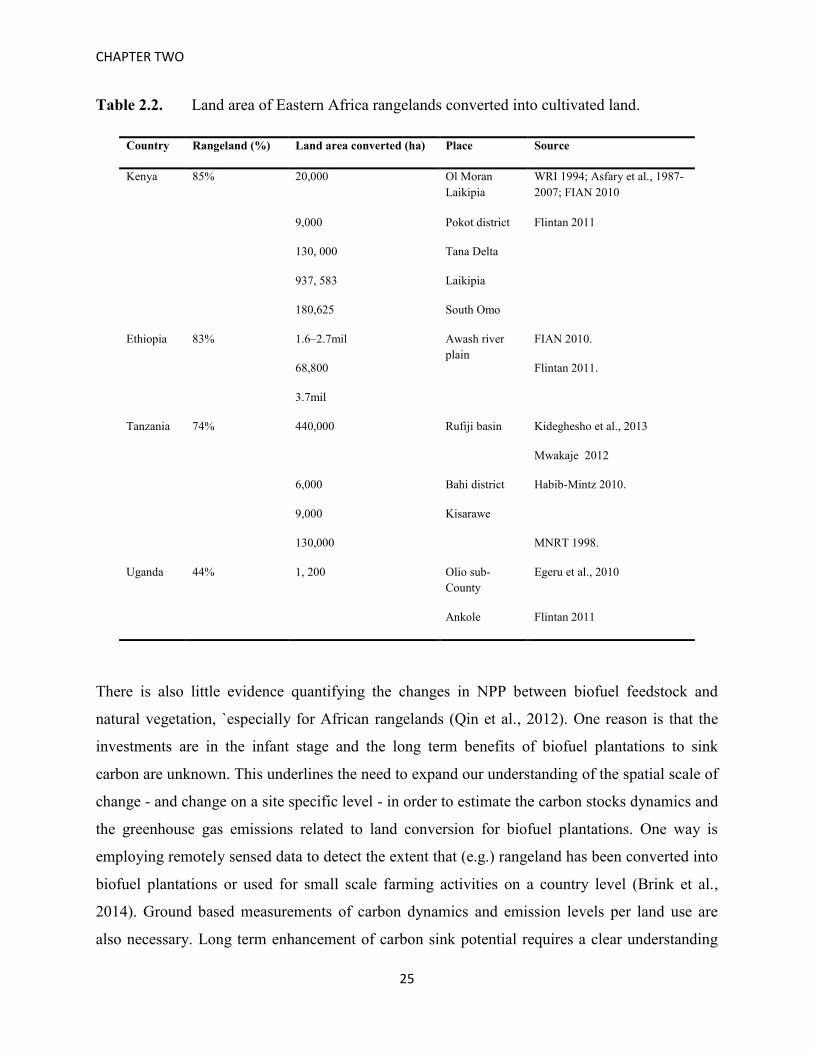
CHAPTER TWO
25
Table 2.2. Land area of Eastern Africa rangelands converted into cultivated land.
Country Rangeland (%) Land area converted (ha) Place Source
Kenya 85% 20,000 Ol Moran Laikipia
WRI 1994; Asfary et al., 1987-2007; FIAN 2010
9,000 Pokot district Flintan 2011
130, 000 Tana Delta
937, 583 Laikipia
180,625 South Omo
Ethiopia 83% 1.6–2.7mil Awash river plain
FIAN 2010.
68,800 Flintan 2011.
3.7mil
Tanzania 74% 440,000 Rufiji basin Kideghesho et al., 2013
Mwakaje 2012
6,000 Bahi district Habib-Mintz 2010.
9,000 Kisarawe
130,000 MNRT 1998.
Uganda 44% 1, 200 Olio sub-County
Egeru et al., 2010
Ankole Flintan 2011
There is also little evidence quantifying the changes in NPP between biofuel feedstock and
natural vegetation, `especially for African rangelands (Qin et al., 2012). One reason is that the
investments are in the infant stage and the long term benefits of biofuel plantations to sink
carbon are unknown. This underlines the need to expand our understanding of the spatial scale of
change - and change on a site specific level - in order to estimate the carbon stocks dynamics and
the greenhouse gas emissions related to land conversion for biofuel plantations. One way is
employing remotely sensed data to detect the extent that (e.g.) rangeland has been converted into
biofuel plantations or used for small scale farming activities on a country level (Brink et al.,
2014). Ground based measurements of carbon dynamics and emission levels per land use are
also necessary. Long term enhancement of carbon sink potential requires a clear understanding

CHAPTER TWO
26
of the capacity of different plant species to store and sink carbon. The trade-offs of converting
rangelands into agricultural land and plantations require detailed assessments.
2.2.2. Livestock husbandry
2.2.2.1. Animal nutrition and feeding
The primary gases emitted from livestock husbandry are methane (CH4) and nitrous oxide (N2O),
(Herrero et al., 2013a). These gases are attributed to the microbial breakdown process of feed
components in herbivores’ gastrointestinal tracts and to decomposition processes occurring
during storage and handling of manure or urine (McAllister et al., 1996; Kebreab et al., 2006).
The emissions of carbon dioxide (CO2) released by livestock from respiration are part of the
carbon cycle but CO2 is also released as land is converted for grazing pasture and during range
fires related to this conversion process. Feeding livestock with forage such as carbohydrates,
proteins, free amino-N, and secondary plant components ingested may influence CH4 production
and emissions (Kebreab et al., 2006). Johnson & Johnson (1995), found that 4–12% of the gross
energy ingested (GEI) by livestock is converted to CH4 by microbial fermentation in the
gastrointestinal tract. However, this is largely reliant on feed type. The use of high quality forage
for ruminants can minimize CH4 emissions. Boadi et al. (2004) showed a decline of about 50% in
CH4 production from steers grazing on high quality pastures compared to the CH4 produced from
steers grazing on lower quality pastures. Observations by McCaughey et al. (1999) specified that
feeding livestock on alfalfa-grass pastures can reduce CH4 production by 7.1% (of GEI),
compared to 9.5% (of GEI) on grass-only pastures. Minimizing CH4 emissions by improved
feeding may be possible in well-organised livestock production systems, but may be challenging
in low external input systems due to financial, technological and environmental constraints.
Thornton & Herrero (2010) suggested alternative options; for example, improved diet, diet
intensification and grain supplements can play a significant role in the reduction of GHG
emissions from livestock husbandry. Herrero et al. (2013b) further showed that in well-managed
livestock production systems, supplementing animal feed with cereal stovers and straws,
groundnuts, hay and maize silage has the potential to reduce emissions as well as to increase
animal productivity. However, such options are appropriate for intensive livestock production
systems but less practical for low input pastoralists in the African rangelands. All options depend
on individuals' production goals. Looking at low input production systems in pastoral areas of

CHAPTER TWO
27
the East and the Horn of Africa, grazing depends entirely on mobile systems in extensive
rangelands (HPG 2009). In this context, there are few or no avenues for feed supplementation
except in a few cases where crop residues such as sorghum, teff and wheat straw are available or
if agro-forestry is practiced. In most pastoral rangelands of Africa, land rights are an issue and
rangelands are increasingly being privatised (FIAN 2010; Flintan 2011). In open grazing
systems, selection of forages (grass and shrubs) or planting of grass for fodder is hindered by
disease, insecurity, land use rights issues and conflicts over resources. Thus the option of
reducing CH4 emissions through improved forage or supplemented feed cannot be adopted easily
by the low input livestock systems dominating the African rangelands. This fact confirms the
need to identify and analyse various avenues to minimise emissions from low input livestock
production systems.
2.2.2.2. Manure management
The emissions of nitrous oxide (N2O) and ammonia (NH3) from livestock husbandry occur
during the handling and decomposition of faeces and urine (Dijkstra et al., 2013). But N
emissions from livestock are related to feeding habits and depend mostly on the animal’s ability
to metabolize nitrogen into protein such as milk and meat (Gay & Knowlton 2009). For example,
the presence of dietary tannins in ligneous foliage, affects nitrogen partitioning between faeces
and urine - thus channeling a higher proportion of nitrogen towards the faeces (Somda et al.,
1995; Powell et al., 1999). This can therefore cause (N) emissions. Volatilization losses from
excreta deposit dependent on grazing intensity and direct loss from soils during decomposition of
litter. Volatilization of animal urine as urea-nitrogen is also attributed to high temperature
conditions. The nitrification and denitrification processes are the major biological processes
producing N2O and NO (Dijkstra et al., 2013). The N2O gas is emitted during the denitrification
process of NO3- of manure stored under anaerobic conditions (Janzen et al., 1999), and it occurs
both in intensive and extensive livestock production systems. Livestock manure stored in
compost heaps, stockpiles or slurry systems also contributes to the emission of CH4, N2O, and
NH3 gases (Steinfeld et al., 2006), and much of the carbon in faeces anaerobically decomposing
in stockpiles and slurry storage systems is converted to CH4 through microbial breakdown
processes similar to those in the gastrointestinal system. However, this depends on temperature,
moisture and type of manure (dry or wet matter). Aerobic N2O production, which is relevant for
surface-dropped faeces in extensive grazing systems, results in nitrification (Mosier et al., 1998).

CHAPTER TWO
28
However, the processes depends on temperature, soil moisture content, soil pH levels, wind
speed and duration of animal grazing in a particular area (Barton et al., 2008). Deposit of
excreta or manure storage cause redistribution of nutrients in the soils and soil organic carbon
within ecosystems (McIntyre et al., 1992). This process shapes the source-sink relationships
between different land or vegetation units (Schlecht et al., 2007). These emissions could be
minimised through improved dietary N intake and proper handling of animal excreta. However,
in low input systems, an improvement may be challenging because grazing occurs in extensive
rangeland systems. Studies estimating NH3 and N2 emissions for African rangelands are
important as the N cycle is so complex and swayed by precipitation and temperature levels.
2.2.2.3. Grazing management
Grazing is a modifier of ecosystem functions and affects soil organic carbon storage. Therefore,
appropriate grazing management is key option in reduction of greenhouse gas emissions and
enhancement of carbon sequestration. Turner et al. (2005); Schlecht et al. (2001); Schlecht et al.
(2006); Schlecht et al. (2009) showed that the degree of animal grazing impact is determined by
the number of livestock, herding mode and mobility. Therefore, managing livestock grazing
behavior and resting the land from grazing are important strategies for sustainable grazing in the
rangelands (Garnett 2009). In open access systems, where mobile and sedentary forms of
livestock husbandry coexist, pastures are exploited by multi-species herds, and grazing can cause
defoliation of plants and over concentration of livestock excreta (faeces and urine) in one area
(Arsenault & Owen-Smith 2002). Defoliation affects below- and above-ground biomass
production in a given vegetation period (Hiernaux & Turner 1996). In perennial and annual
herbaceous species, moderate defoliation may also result in over-compensatory growth. In this
context, livestock grazing can affect nutrient matter fluxes, particularly in heterogeneous grazing
areas. Carbon fixation in grasslands is highly influenced by grazing intensity and is allocated to
above and below ground stocks (Wezel & Schlecht 2004; Herrero et al., 2013). Therefore,
varying stock densities, grazing itineraries, herd mobility, enclosures, grazing cessation, fencing
or livestock corralling all offer the potential to redirect nutrient redistribution processes (Schlecht
et al., 1998). In nomadic livestock systems, tracking strategies optimize year-round results on
quality and quantity feedback and there is a high degree of flexibility in terms of space and time
that yields the best outcomes (Schlecht et al., 2001). This can thus offer sustainability in land use
where non-equilibrium systems are present. In this context, sustainability relates to both the

CHAPTER TWO
29
productivity of the grazed pastures and animals (Vetter 2005). However, implementing such
measures depends on production goals, access to grazing lands and water points, property and
user rights regimes for grazing lands and the level of economic development (Turner 1995). In
well-organised livestock production systems, such strategies can be implemented, but in low
input production systems on the African rangelands, proper grazing management is hardly ever
employed. Trampling is one effect of grazing, it accelerates the deterioration of vegetation,
transforming standing materials into litter and incorporating litter into soil. On different soil
types; trampling breaks surface crusts, affects water infiltration, compacts soil, and reduces
infiltration in clay. Consequently, trampling influences nutrient fluxes and grassland productivity
(Hiernaux et al., 1999; Hiernaux 2001) and hence, reduces carbon sink potential. Excessive
trampling on soils reduces the ability of plants to access nutrients and water, and limits plant
growth. In turn, the process exhausts carbon reserves and the capacity of grasslands to store
carbon (Turner 2000; Hiernaux & Turner 1996; Thornton and Herrero 2010). Livestock
husbandry is sustainable if appropriate management practices are adopted and where production
goals incorporate sustainability (productivity and ecosystem).
2.2.3. Range fires – burning biomass as a management tool
Fire has positive and negative effects to the ecosystem. The immediate effect of fire is the
emission of carbon monoxide (CO), methane (CH4), ammonia (NH3), nitrogen oxides (NOx),
and nitrous oxide (N2O) gases during burning of plant biomass (Radojevic 2003; Anderson et
al., 2004; Bell & Adams 2009; Castaldi et al., 2010). Fire is used by pastoralists for managing
pasture and controlling pests. It is also used by cultivators to clear unwanted vegetation ready for
ploughing and to clear crop residues. In wildlife management (game/parks), fire is used to
stimulate germination of certain seed species, control bush encroachment in transitional zones,
control unwanted plant species, reduce vegetation patchiness, replace nutrients in soil and reduce
dead plant biomass to pave way for lush vegetation (Andrew 1986; Paton & Rickert 1989; Orr et
al., 1991). Though natural fires occur due to lighting, studies (Mbow et al., 2000; Van Wilgen et
al., 2004) indicate that the recurrent of fires in African rangelands seem to overwhelm forest
ecosystems. The occurrence of range fires is mainly attributed to land conversion for cultivation
and grazing. For instance, Williams et al. (2007) showed that about 37% of carbon emissions due
to land conversion are related to fire from the savanna rangelands of Africa. Such estimates
might not be accurate because the authors did not specify the extent of a burned area, or its
CHAPTER TWO
30
intensity and frequency. The effect of range fires on carbon stock dynamics is hard to estimate
because it depends on the intensity, speed, fuelwood composition, vegetation characteristics
(woody, shrubs, bushes or open tall-grassland plain, and maturity of vegetation) and the
frequency of fire. Other effects of fire on carbon balances were described in previous studies
(Ojima et al., 1990; Crutzen & Andreae 1990; Ojima et al., 1994; Synmann 2002; Bucini &
Lambin 2002; Fynn et al., 2003; Perez et al., 2007; Fynn 2008). Fire distorts litter materials,
impairs soil microbes and humus and can decrease organic matter in the soil ecosystem. The
effect of fires in African rangelands depends on the land uses after fire. If a burnt area is
converted into agricultural land (usually the case) carbon dioxide (CO2) emitted will remain in
the atmosphere without being re-assimilated during re-growth (Lehsten et al., 2009). But if the
range fire occurs on grassland or woody species and the land is used for pasture, CO2 emitted
will be assimilated during re-growth, but this also depends on the fire's intensity. Therefore,
quantifying the effects of range fires on African rangelands remains crucial for understanding the
contribution of different management regimes to global carbon balances. In a distinct case in the
Borana of Southern Ethiopia, banning the use of fire as a grazing management tool is believed to
have permitted the bush encroachment in the rangeland and diminishing of grassland (Angassa &
Oba 2008). Due to different cases it is remain important to evaluate the trade-offs of fire regimes
on carbon dynamics in African rangeland at different spatial and temporal scales.
2.2.4. Plant biomass extraction
Changes in vegetation composition on many African rangelands are attributed to pastoralism,
shifting cultivation, domestic wood harvest for construction, firewood and charcoal production,
but also to extraction of products such as fodder. The composition of woodland vegetation in
African rangelands is very sparse (Pratt et al., 1966), but the increasing human activities
accelerate vegetation loss and degradation (Lipper et al., 2010; Bongers & Tennigkeit 2010). A
number of studies Tsegaye et al. (2010); Wasonga et al. (2011); Brink et al. (2014); Egeru et al.
(2014); Elias et al. (2015) have analysed the extent of land cover changes at different spatial and
temporal scales across African rangelands, however, despite these studies, there have been
regular changes in land use and these changes are thought to affect net primary production and
carbon balance dynamics in Africa. There are indirect emissions related to the extraction of
wood for charcoal which is the major source of energy in many parts of Africa. Estimates of the
extent of tree losses remain crucial for understanding carbon stocks dynamics across the African
CHAPTER TWO
31
rangelands (Valentini et al., 2014). As the demand for wood products increases across African
countries, large areas of savanna rangelands are becoming more vulnerable to fragmentation and
over exploitation of wood resources (Brink and Eva 2011; Brink et al., 2014). Thus, there is a
need to explore alternatives such as planting tree species which could be used to supply
fuelwood for the people instead of harvesting naturally occurring trees and bushes. In some parts
of the East Africa rangelands, there is certain levels land degradation (Pricope et al., 2013).
Losses of trees and bushes reduce biomass production and composition, degrade soil quality and
reduce the potential of rangelands to sequester atmospheric carbon. It is necessary that strategies
to conserve trees should focus on mitigating the levels of tree extraction. Implementing such
strategies depends on the availability of up to date inventory studies and small scale information
on the status of rangeland vegetation.
2.2.5. Biotic and abiotic processes
Soil microbes and macro-decomposer activity have a positive role in supporting soil carbon
storage and sequestration benefits. Soil microbes mix soil through the profile, decompose plant
litter, mix organic components and soil aggregation and macro-decomposers mix organic and
mineral fractions in soil and prepare the litter for soil microbes in arid rangelands (De Deyn et
al., 2008). Apart from their positive role, soil biota contributes to emissions of gases under
varying conditions. In an anaerobic environment, specific soil microbes (denitrifier) require
oxygen to survive, they therefore, use nitrate (NO3-) as a supplement, in the process they release
NO, N2O, and N2 gases into the atmosphere (Sugihara et al., 2012). Notably, the rate of emission
depends on many environmental factors (for example, the pH level, soil temperature, soil
moisture and availability of plant biomass), but land management plays a significant role too.
Aerobic emissions are caused by nitrifying microbes who convert (NH4+) to nitrate (NO3
-) to
obtain energy and result in N2O as a by–product of N–transformations (Barton et al., 2008).
These emissions occur naturally in biogeochemical cycles. The emissions of CO2 from soil
respiration are a result of soil microbial respiration and also root respiration (autotrophic and
heterotrophic) and decomposition respectively (Ferréa et al., 2012). The rate of emissions is
intensified by high temperatures and precipitation in most arid and semi-arid rangelands (Edward
1975; Davidson & Janssens 2006; Perez et al., 2007; Bardgett et al., 2008) and leaching of
dissolved organic carbon (Jenkinson et al., 1991). Changes in land management, climate and
plant phenology also influence the variations in soil respiration over time. In reviewing the
CHAPTER TWO
32
various ways to mitigate CO2 emissions in arid rangelands, it can be seen that improving land
management has the potential to increase soil organic carbon storage and sequestration benefits.
Therefore, it is crucial that processes which influence carbon stock dynamics and greenhouse gas
emissions at different spatial and temporal scales are well understood in order to design
sustainable strategies to off-set emissions and enhance soil carbon sequestration in African
rangelands.
The emission of methane (CH4) and carbon (CO2) gases are attributed to the activities of macro-
decomposers in termite colonies (MEA 2005). Literature shows that the flagellate protozoa in
lower and in higher termite groups emit CO2 and CH4 gases during digestion of feed components
(Sapunov 2008; Velu et al., 2011). However, estimates for emissions of CH4 and CO2 from
termites are very rare, especially for African rangelands. Using estimates from the world's
savanna rangelands, it is seen that the lower termite group can emit up to 0.425 μg CH4 per
termite per day, and 0.397 μg CH4 per day for higher termite species (Zimmerman et al., 1982).
The rate of these emissions depends on the feed components consumed. Soil-feeding termites in
the savanna can emit up to 7.68 μg CH4 g termite-1 h-1 and 0.17 ± 0.06 mg CO2 termite-1 h-1;
Xylophagous termites emit up to 2.88 μg CH4 g termite-1 h-1 and 0.75 ± 0.42 mg CO2 termite-1 h-
1, and fungus-growing termites 14.08 ± 4.5 μg CH4 g termite-1 h-1 and 0.953 mg CO2 termite-1 h-1
(Sanderson 1996). The estimates provided here indicate a broad contribution of termites to CH4
and CO2 emissions in ecosystems. In African rangelands, studies that have investigated termites
focused on the environmental impacts and control measures (Wood 1991) or ethno-ecological
measures to manage termites (Sileshi et al., 2009) and the role of termites in vegetation
heterogeneity (Sileshi et al., 2010). Attempts made to quantify termites’ biomass and their
emissions have been largely inadequate. For example, emissions from termites depends on
feeding habits, the availability of dead wood (and their components), ground litter composition,
human disturbances (cultivation or burning) and management practices (Jamali et al., 2013).
Thus, by understanding the dynamics of these variables, we can design strategies that can help to
mitigate these emissions from biotic processes in African rangelands.
2.3. Potential for carbon sequestration in African rangelands
The ability of terrestrial ecosystems to capture atmospheric CO2 and store in long term reserves
without re-emitting is referred to as carbon sequestration (Lal 2004). However, the natural

CHAPTER TWO
33
carbon balance cycle is disturbed by numerous human activities and natural processes in
ecosystems (Vagen et al., 2005), as discussed in previous sections. The previous sections in this
paper indicated some of the processes and activities responsible for the changes in net primary
production, vegetation composition, nutrient fluxes, carbon stock dynamics and greenhouse gas
emissions in African rangelands (Figure 2.1). In some areas where improved land management
has taken place, there are some prospects of enhancing carbon storage and sequestration benefits.
Using a few case studies from continental Africa and regional and country level estimates, Table
2.3 presents estimates of African rangelands' capacity to sequester carbon under different
management practices. It can be seen that the estimates vary greatly, e.g. from a low 0.21 Mg C
ha-1 yr-1 to a high 13 Mg C ha-1 yr-1, and there are even some variations between specific regions
or country estimates (Table 2.3). Such variations are due to the methods used, environmental
heterogeneity, accuracy of estimates, complexity in defining boundaries of rangeland vegetation
and the differences in land use and management history (Ciais et al., 2011). This variability
partly explains one of the weaknesses of relying on continental or regional estimates to guide
policy recommendations for land users at the local level. A certain management practice may
have a positive contribution on C sequestration in one place but a negative contribution on
another area due to the diversity of agro-ecological systems in Africa's rangelands. There is
currently little understanding of how changes in land use-management affect carbon stocks and
the sequestration potential of African rangelands (Nosetto et al., 2006). Without generating
estimates from site specific or small scale studies, it is impossible to design or to implement
sustainable ways of using rangeland resources and the long-term enhancement of carbon sink
potential. Therefore, because of the great variations in management and climates across African
rangelands, there is a great need to generate long term estimates for various management
practices that could enhance carbon sequestration. The use of integrated methods, such as ground
measurements, can enable monitoring of emissions and carbon stock dynamics within site;
remote sensing can help to capture heterogeneity of land use and land cover changes over larger
areas; GIS modelling can be used for predicting carbon balance dynamics in the rangeland
biome.

CHAPTER TWO
34
Table 2.3. Estimates of carbon sequestration potential of different land use and management
practices in African rangelands.
Sources Regions C–Sequestration (Mg C ha-1yr-1) Land use and management
Conant & Paustian (2002) Continental Africa 0.21 Transition from heavy grazing to
moderate grazing
Grace et al., (2006) Savanna Africa 5.8 Protected from intensive grazing and fire
Lehsten et al., (2009) Continental Africa 6.3 Wildfire and changes in C- stocks van der Werf et al., (2006) Continental Africa 13 Effects of burning on C- stocks
Bourliere & Hadley (1970)
Continental Africa 0– 15 Grazing, farming activities or conservation area
Vagen et al., (2005) Sub-Saharan Africa 0.1– 5.3
Allowing fallow systems, agro-forestry, resting from grazing
Batjes (2004) East Africa 37– 39 Conversion of native to pasture
Solomon et al., (2000) Northern Tanzania 28.2
Grazing and farming activities
Farage et al., (2007) Sudan -0.012 Allowing grazed fallow
Sudan 0.006– 0.017 Management with inorganic
fertilizers
Conant et al., (2001) Zimbabwe 0.11– 3.04
Conversion of native to pasture
Farage et al., (2007) Nigeria 0.004– 0.01 Allowing grazed fallow
Nigeria -0.062– -0.138 Management with inorganic fertilizers
Tiessen et al., (1998) Senegal 2.3 Short fallowing periods
Lal (2000a) Western Nigeria 0.02– 0.20
Restoration of degraded cultivated areas (no-till, fallowing)
CHAPTER TWO
35
2.4. Synthesis, conclusion and further research
This paper has shown various potential and uncertainties of African rangelands' to provide sink
benefits. There is great potential to off-set anthropogenic emissions and enhance carbon sink
potential. The major concerns affecting these rangelands are e.g. land conversion, management
practices, land tenures and climate anomalies. These variants across agro-ecosystems limit
proper implementation of strategies to enhance carbon sink. A better understanding of the effects
of different land management strategies on carbon stock dynamics at different spatial and
temporal scales is needed. Information on a small scale is needed in order to capture the
dynamics discussed in previous sections. To attain a win-win solution; off-setting emissions
related to land use, climate change mitigation, long term enhancement of carbon sink potential
and poverty reduction, up-to date information is needed. As shown in Tables 2.1 and 2.3, better
land management, restoration of degraded areas, agro-forestry practices are crucial for promoting
carbon fixation and sink benefits. Climate change is likely to affect arid and semi-arid rangelands
more because of the inherently low precipitation. Therefore, appropriate interventions and
research on (technical, financial, policy reforms and assessment methodology and social
acceptance) are necessary to mitigate emissions and long term enhancement of carbon
sequestration. This review proposes further analysis on the following lines:
- Analytical assessment of the interface of social-economic and climatic drivers contributing to
land conversion in the rangelands of Africa using integrated approaches.
- Quantifying the extent of changes in vegetation using multi-temporal satellite data,
precipitation and temperature records is needed. In some areas (like the Sudano-Sahelian
zone), changes in vegetation and biomass production correlated with precipitation. Thus
linking precipitation, net primary production, land use and vegetation is essential for
understanding carbon balances in African rangelands.
- Estimating changes in soil carbon stocks and emissions per land use under different
management practices is important for understanding carbon dynamics and emission process
in African rangelands.
- There is also a need to analyse the effects of change in land use policy on the management of
rangelands across African countries, because they are the underlying cause of resource
degradation.

CHAPTER TWO
36
References
Andersson, M., Michelsen, A., Jensen, M. & Kjoller, A. (2004). Tropical savannah woodland: effects of experimental fire on soil microorganisms and soil emissions of carbon dioxide. Soil Biology & Biochemistry, 36, 849–858.
Andrew, M.H. (1986). The use of fire for spelling monsoon tallgrass pasture grazed by cattle. Tropical Grasslands, 20, 69–78.
Angassa, A. & Oba, G. (2008). Herder Perceptions on Impacts of Range Enclosures, Crop Farming, Fire Ban and Bush Encroachment on the Rangelands of Borana, Southern Ethiopia, Hum. Ecol., 36, 201–215. doi: 10.1007/s10745-007-9156-z.
Arsenault, R. & Owen-Smith, N. (2002). Facilitation versus competition in grazing herbivore assemblages. Oikos, 97, 313–318.
Asfary, A.F., Giri, C., Govil, K., Hartemink, A., Holmgren, P., Keita-Ouane, F., Navone, S., Olsson, L., Ponce-Hernandez, R., Rockström, J. & Shepherd, G. (1987-2007). Chapter 3, Land-State and Trends of the Environment. UNEP.
Bajtes, N.H. (2004). Estimation of soil carbon gains upon improved management within croplands and grasslands of Africa. Environment, Development and Sustainability, 6,133–143.
Bardgett, R., Freeman, C. & Ostle, N.J. (2008). Microbial contributions to climate change through carbon cycle feedbacks. The International Society for Microbial Ecology (ISME) Journal, 2, 805–814.
Barton, L., Kiese, R., Gatter, D., Butterbach-Bahl, K., Buck, R., Hinz, C. & Muphy D.N. (2008). Nitrous oxide emissions from a cropped soil in a semi-arid climate. Global Change Biology, 14, 177–192. doi: 10.1111/j.1365-2486.2007.01474.x.
Batjes, N.H. (1996). Total C and N in the soils of world. Eur. J. Soil Sci. 47, 151–163.
Batjes, N.H. (2004). Carbon stocks and projected changes according to land use and management: A case study for Kenya. Soil Use and Management, 20, 350–356.
Bell, T. & Adams, M. (2009). Smoke from Wildfires Prescribed Burning in Australia: Effects on Human Health and Ecosystems. Development in Environmental Sciences, 8, 289–308.
Boadi, D.A., Wittenberg, K.M., Scott, S.L., Burton, D., Buckley, K., Small, J.A. & Ominski, K. H. (2004). Effect of low and high forage diet on enteric and manure pack greenhouse gas emissions from a feedlot Canadian. Journal of Animal Science, 84, 445–453.
Bongers, F. & Tennigkeit, T. (eds.). (2010). Degraded Forests in Eastern Africa, Management and Restoration, Earthscan, London. 1–22.
Bourliere, F. & Hadley, M. (1970). The ecology of tropical savannas. Annual Review of Ecology and Systematics, 1, 125–152.
CHAPTER TWO
37
Brink, A.B. & Eva, H.H. (2011). The potential use of high-resolution Landsat satellite data for detecting land-cover change in the Greater Horn of Africa. International Journal of Remote Sensing iFirst, 1–15. doi: 10.1080/01431161.2010.499382.
Brink, A.B., Bodart. C., Brodsky, L., Defourney, P., Ernst, C., Donney, F., Lupi, A. & Tuckova, K. (2014). Anthropogenic pressure in East Africa—Monitoring 20 years of land cover changes by means of medium resolution satellite data. International Journal of Applied Earth Observation and Geoinformation, 28, 60–69. http://dx.doi.org/10.1016/j.jag.2013.11.006.
Bucini, G. & Lambin, E.F. (2002). Fire impacts on vegetation in Central Africa: a remote-sensing-based statistical analysis. Applied Geography, 22, 27–48.
Castaldi, S., de Grandcourt, A., Rasile, A., Skiba, U. & Valentini, R. (2010). CO2, CH4 & N2O Fluxes from soil of burned grassland in central Africa. Biogeoscience, 7, 3459–3471.
Ciais, P., Bombelli, A., Williams, M., Piao, S.L., Chave, J., Ryan, C.M., Henry, M., Brender, P. & Valentini, R. (2011). The carbon balance of Africa: synthesis of recent research studies. Phil. Trans. R. Soc. A. 369, 1–20.
Conant, R.T. & Paustian, K. (2002). Potential soil carbon sequestration in overgrazed grassland ecosystems. Global Biogeochemical Cycles, 16(4) 11–43. doi: 10.1029/2001GB001661, 2002.
Conant, R.T., Paustian, K. & Elliott, E.T. (2001). Grassland management and conversion into grassland: effects on soil carbon. Ecological Applications, 11(2), 343–355.
Crutzen, P.J. & Andreae, M.O. (1990). Biomass burning in the tropics: impact on atmospheric chemistry and biogeochemical cycles. Science, 250, 1669–1678.
Davidson, E.A. & Janssens, I.A. (2006). Temperature sensitivity of soil carbon decomposition and feedbacks to climate change. Nature, 440 (7081), 165–173.
De Deyn, G.B, Cornelissen, J.H.C. & Bardgett, R.D. (2008). Plant functional traits and soil carbon sequestration in contrasting biomes. Ecology Letters, 11, 516–-531. Doi: 10.1111/j.1461-0248.2008.01164.x.
Derner, J.D. & Schuman, G.E. (2007). Carbon sequestration and rangelands: A synthesis of land management and precipitation effects. Journal of Soil and Water Conservation, 62(2), 77–85.
Dijkstra, J., Oenema, O., van Groenigen, J.W., Spek, J.W., van Vuuren, A.M. & Bannink, A. (2013). Diet effects on urine composition of cattle and N2O emissions. Animal, 7(s2), 292–302. doi: 10.1017/S1751731113000578.
Djomo. S.N. & Ceulemans. R. (2012). A comparative analysis of the carbon intensity of biofuels caused by land use changes. GCB Bioenergy 4, 392–407. doi: 10.1111/j.1757-1707.2012.01176.x.
Edward, N.T. (1975). Effects of temperature and moisture on carbon dioxide evolution in a mixed deciduous forest floor, Soil process, Soil Science Society. Is Journal. 39, 361–365.

CHAPTER TWO
38
Egeru, A., Okello, P., Majaliwa, M.G.J., Mukwaya, P. & Isubikalu, P. (2010). The effects of land cover change on Biomass stock in dryland areas of Eastern Uganda. A case study of Olio Sub-county in Soroti District. J. Appl. Sci. Environ. Manage, 14 (4), 101–106.
Egeru, A., Wasonga, O., Kyagulanyi, J., Majaliwa, G., MacOpiyo, L. & Mburu, J. (2014). Spatio-temporal dynamics of forage and land cover changes in Karamoja sub-region, Uganda, Pastoralism: Research, Policy Practice, 4(6) 1–21. doi: 10.1186/2041-7136-4-6.
Elias, M., Hensel, O., Richter, W., Hülsebusch, C., Kaufmann, B. & Wasonga, O. (2015). Land Conversion Dynamics in the Borana Rangelands of Southern Ethiopia: An Integrated Assessment Using Remote Sensing Techniques and Field Survey Data. Environments, 2, 1–31. doi: 10.3390/environments2010001.
FAO. (1989). arid zone forestry: A guide for field technicians. Version 20. http://www.fao.org/docrep/T0122E/TO122E00.htm. Accessed on 13 February, 2012.
FAO. (2004). Carbon sequestration in dryland soils, Argentina: Version 102. http://www.fao.org/docrep/007/y5738e/y5738e00.htm. Accessed on 25 October, 2011.
FAO. (2008). ‘‘The State of Food and Agriculture, Biofuels: prospects, risks and opportunities’’. Food and Agriculture Organization of the United Nations, Rome, Italy. http://www.fao.org/3/contents/2fd3c0e7-16c9-569b-9f82-34de8ffcd741/i0100e.pdf. Accessed on 9 August, 2014.
Farage, P.K, Ardö, J. Olsson, L, Rienzi, E.A. Ball, A.S. & Pretty, J.N. (2007). The potential for soil carbon sequestration in three tropical dryland farming systems of Africa and Latin America: A modelling approach. Soil & Tillage Research, 94, 457–472. doi:10.1016/j.still.2006.09.006.
Ferréa, C., Zenoneb, T., Comolli, R. & Seufert, G. (2012). Estimating heterotrophic and autotrophic soil respiration in a semi-natural forest of Lombardy, Italy. Pedobiologia 55, 285– 294. doi.org/10.1016/j.pedobi.2012.05.001.
FIAN. (2010). Land Grabbing in Kenya and Mozambique. A report on two research missions and human rights analysis of land grabbing, Odeny, E., Leonhard, R., Saturnino, B Jr., & Rocha, M., (Eds.), FIAN, Germany, 1–43.
Flintan, F. (2011). The causes, process and impacts of land fragmentation in the rangelands of Ethiopia, Kenya and Uganda. Regional Learning and Advocacy programme for Vulnerable Dryland Communities, 1–12.
Fynn, R. (2008). Savory insights – is rangeland science due for a paradigm shift? Rangeland management, Grassroots. Newsletter of the Grassland Society of Southern Africa, 8(3), 25–38.
Fynn, R.W.S., Haynes, R.J. & O’Connor, T.G. (2003). Burning causes long-term changes in soil organic matter content of South African grassland. Soil Biology & Biochemistry, 35, 677–687.
Garnett, T. (2009). Livestock-related Greenhouse Gas Emissions: Impacts and Options for Policy Makers. Environmental Science & Policy, 12, 491–503.

CHAPTER TWO
39
Gay, S.W. & Knowlton, K.F. (2009). Ammonia Emissions and Animal Agriculture. Virginia Cooperative Extension, Publication 442–110, 1–5. Gerber, P.J., Steinfeld, H., Henderson, B., Mottet, A., Opio, C., Dijkman, J., Falcucci, A. & Tempio, G. (2013). Tackling climate change through livestock – A global assessment of emissions and mitigation opportunities. Food and Agriculture Organization of the United Nations (FAO), Rome.
Grace, J., San José, J., Meir, P., Miranda, H.S. & Montes, R.A. (2006). Productivity and Carbon fluxes of tropical savannas. J. Biogeogr. 33, 387–400. doi:10.1111/j.1365-2699.0148x.
Habib-Mintz, N. (2010). Biofuel investment in Tanzania: Omissions in implementation. Energy Policy, 38, 3985–3997.
Herlocker, D. (1999). Rangeland Ecology and Resources Development in Eastern Africa: their ecology and development. German Technical Cooperation (GTZ), Nairobi, Kenya, 2–213.
Herrero, M., Grace, D., Njuki, J., Johnson, N., Enahoro, D., Silvestri, S. & Rufino. M.C. (2013a).The roles of livestock in developing countries. Animal, 7(1), 3–18. doi: 10.1017/S1751731112001954. Herrero, M., Havlík, P., Valin, H., Notenbaert, A., Rufino, M.C., Thornton, P.K., Blümmel, M., Weiss, F., Grace, D. & Obersteiner, M. (2013b). Biomass use, production, feed efficiencies, and greenhouse gas emissions from global livestock systems. PNAS, 110(52), 20888–20893. www.pnas.org/cgi/doi/10.1073/pnas.1308149110. Hiernaux, P. (2001). Fondements écologiques de la gestion des parcours au Sahel. In Tielkes, E., Schlecht, E. & Hiernaux, P. (Eds.), Elevage ET gestion de parcours au Sahel, implications pour le développement. Verlag E. Grauer, Beuren-Stuttgart, 65–77.
Hiernaux, P. & Turner, M.D. (1996). The effect of clipping on growth and nutrient uptake of Sahelian annual rangelands. Journal of Applied Ecology, 33, 387–399.
Hiernaux, P., Bielders, C.L., Valentin, C., Bationo, A. & Fernández-Rivera, S. (1999). Effects of livestock grazing on physical and chemical properties of sandy soils in Sahelian rangelands. Journal of Arid Environments, 41, 231–245.
Hoffman, T.M. & Vogel, C. (2008). Climate change impacts on African rangelands. Plant Conservation Unit Botany Department University of cape Town South Africa. Rangelands, 30 (3), 12–17.
Humanitarian Policy Group, (hpg), (2009). Pastoralism, policies and practice in the Horn and East Africa. A review of current trends, Synthesis Paper. 1–4.
IIED and SOS. (2010). Modern and mobile: The future of livestock production in Africa's drylands. De Jode. H. (Eds.). International Institute for Environment & Development (IIED) and SOS Sahel International UK, 11–87.

CHAPTER TWO
40
IPCC. (2001). Climate Change 2001: The Scientific Basis. Contribution of Working Group I to the Third Assessment Report of the Intergovernmental Panel on Climate Change. Houghton, J.T.,Y., Ding, D.J., Griggs, M., Noguer, P.J., van der Linden, X., Dai, Maskell, K. & Johnson, C.A. (Eds.), Cambridge University Press, Cambridge, UK, 881.
IPCC. (2007). Climate Change 2007: Mitigation. Contribution of Working Group III to the Fourth Assessment Report of the Intergovernmental Panel on Climate Change [Metz, B., Davidson, O.R., Bosch, P.R., Dave, R. & Meyer, L.A. (Eds.)], Cambridge University Press, Cambridge, United Kingdom and New York, NY, USA, XXX.
IPCC. (2013). Summary for Policymakers. In Stocker, T.F., Qin, D., Plattner, G.K-. Tignor, M., Allen, S.K., Boschung, J., Nauels, A., Xia, Y., Bex, V. & Midgley, P.M. (Eds.), Climate Change 2013: The Physical Science Basis. Contribution of Working Group I to the Fifth Assessment Report of the Intergovernmental Panel on Climate Change. Cambridge University Press, Cambridge, United Kingdom and New York, NY, USA, 4–29.
IRIN. (2007). Africa: Can pastoralism survive in the 21st century? UN Integrated Regional Information Networks, World Press: http://www.worldpress.org/Africa/2861.cfm. Accessed on 23 November, 2011.
Jamali, H., Livesley, S.J., Hutley, L.B., Fest, B. & Arndt, S.K. (2013). The relationships between termite mound CH4/CO2 emissions and internal concentration ratios are species specific. Biogeosciences, 10(4), 2229–2240.
Janzen, H.H., Desjardins, R.L., Asselin, J.M.R. & Grace, B. (1999). The health of our air: towards sustainable agriculture in Canada. Research Branch, Agriculture and Agric-Food Canada, Ottawa, Ontario, Publication 1981/E. 31–41.
Jenkinson, D.S., Adams, D.E. & Wild. A. (1991). Model estimates of CO2 emissions from soil in response to global warming. Nature, 351, 304–306.
Johnson, K.A. & Johnson, D.E. (1995). Methane emissions from cattle. Journal of Animal Science, 73, 2483–2492.
Kebreab, E., Clark, K., Wagner, R. & France, J. (2006). Methane and nitrous oxide emissions from Canadian animal agriculture: A Review: Can. J. Anim. Sci. 86, 135–158.
Kideghesho, J.R., Rija, A.A., Mwamende, K.A. & Selemani, I.S. (2013). Emerging issues and challenges in conservation of biodiversity in the rangelands of Tanzania. Nature Conservation, 6, 1–29. doi: 10.3897/natureconservation.6.5407.
Kim, H., Kim, S. & Dale, B.E. (2009). “Biofuels, land use change, and greenhouse gas emissions: Some unexplored variables,” Environmental Science and Technology, 43(3), 961–967.
Lal, R. (2000a). ‘Land Use and Cropping System Effects on Restoring Soil Carbon Pool of Degraded Alfisols in Western Nigeria’, in Lal, R., Kimble, J.M. & Stewart, B.A. (eds.), Global Climate Change and Tropical Ecosystems. Lewis Publishers, Boca Raton, 157–165.

CHAPTER TWO
41
Lal, R. (2000b). Carbon sequestration in drylands. Annals of Arid Zone, 39 (1), 1–10. Lal, R. (2000c). World cropland soils as a source or sink for atmospheric carbon. Advances in Agronomy, 71, 145–191. Lal, R. (2003). Carbon Sequestration in Dryland Ecosystems. Environmental Management, 33, (4), 528–544. doi: 10.1007/s00267-003-9110-9.
Lal, R. (2004). Soil carbon sequestration to mitigate climate change. Geoderma, 123, 1–22.
Lal, R. (2011). Sequestering carbon in soils of agro-ecosystems. Food Policy, 36, 33–39. doi:10.1016/j.foodpol.2010.12.001.
Lehsten, V., Tansey, K., Balzter, H., Thonicke, K., Spessa, A., Weber, U., Smith, B. & Arneth, A. (2009). Estimating carbon emissions from African wildfires. Biogeosciences, 6, 349–-360. www.biogeosciences.net/6/349/2009/.
Lipper, L., Dutilly-Diane, C. & McCarthy, N. (2010). Supplying Carbon Sequestration from West African Rangelands: Opportunities and Barriers. Rangeland Ecology & Management, 63(1), 155–166.
Luo, Z., Wang, E., Sun, O.J., Smith, C.J. & Probert, M.E. (2011). Modeling long-term soil carbon dynamics and sequestration potential in semi-arid agro-ecosystems. Agricultural and Forest Meteorology, 151, 1529–1544. doi:10.1016/j.agrformet.2011.06.011.
Mbow, C., Nielson, T.T. & Rausmussen, K. (2000). Savanna fires in east central Senegal: distribution patterns, resource management perceptions. Human Ecology, 28, 561–-583.
McAllister, T.A., Okine, E.K., Mathison, G.W. & Cheng, K.J. (1996). Dietary, environmental and microbiological aspects of methane production in ruminants. Canadian Journal of Animal Science, 76, 231–243.
McCaughey, W.P., Wittenberg, K.M. & Corrigan, D. (1999). Impact of pasture type on methane production by lactating beef cows. Canadian Journal of Animal Science, 79, 221–226.
McDermot C. & Elavarthi, S. (2014) Rangelands as Carbon Sinks to Mitigate Climate Change: A Review. J. Earth Sci Clim Change. 5, 221. doi:10.4172/2157-7617.1000221.
McIntyre, J., Bourzat, D. & Pingali, P. (1992). Crop Livestock Interaction in Sub-Saharan Africa. Regional and Sectoral Studies Series: The World Bank, US: Washington, DC.
MEA. (2005). Millennium Ecosystem Assessment and Human Well-being: Desertification Synthesis: By Safriel, U., Adeel, Z., Niemeijer, D., Puigdefabregas, J., White, R., Lal, R., Wilson, M., Ziedler, J., Prince, S., Archer, E., King, C., Shapiro, B., Wessels, K., Nielsen, T., Portnov B., Reshef, I., Thonell, J., Lachman, E. & McNab, D. (2005). Chapter 22: Dryland Systems’’. In Ecosystems and Human Well-being: Current State and Trends, Volume 1. Hassan, R., Scholes, R. & Ash, N. (Eds.) World Resource Institute, Washington, DC, 625–653.
Ministry of Natural Resources and Tourism (MNRT). (1998). The National Forest Policy of Tanzania. Government Printer, Dar es Salaam, Tanzania. 59.

CHAPTER TWO
42
Mortimore, M., Anderson, S., Cotula, L., Davies, J., Faccer, K., Hesse, C., Morton, J., Nyangena, W., Skinner, J. & Wolfangel, C. (2009). Dryland Opportunities: a new paradigm for people, ecosystems and development, IUCN, Gland, Switzerland; IIED, London, UK and UNDP/DDC, Nairobi, Kenya. x + 86. http://pubs.iied.org/pdfs/G02572.pdf. Accessed on 20 July, 2012.
Mosier, A., Kroeze, C., Nevison, C., Oenema, O., Seitzinger, S. & van Cleemput, O. (1998). Closing the global N2O budget: nitrous oxide emissions through the agricultural nitrogen cycle. Nutrient Cycling in Agroecosystems, 52, 225–248.
Mwakaje. A.G. (2012). Can Tanzania realise rural development through biofuel plantations? Insights from the study in Rufiji District. Energy for Sustainable Development, 16, 320–327.
Niles, J.O., Brown, S., Pretty, J., Ball A.S. & Fay., J. (2002). Potential carbon mitigation and income in developing countries from changes in use and management of agricultural and forest lands. Phil. Trans. R. Soc. Lond. 1–19. doi: 10.1098/rsta.2002.1023.
Nosetto, M.D., Jobbágy, E.G. & Paruelo, J.M. (2006). Carbon sequestration in semi-arid rangelands: Comparison of Pinus ponderosa plantations and grazing exclusion in NW Patagonia. Journal of Arid Environments, 67, 142–156. doi:10.1016/j.jaridenv.2005.12.008.
Ojima, D.S, Schimel, D.S., Parton, W.J. & Owensby, C.E. (1994). Long and short-term effects of fire on nitrogen cycling in tallgrass prairie. Biogeochemistry, 24, 67–84.
Ojima, D.S., Parton, W.J., Schimel, D.S. & Owensby, C.E. (1990). Simulated impacts of annual burning on prairie ecosystems. In Collins, S.L. & Wallace, L.L. (Eds.), Fire in North American Tall Grass Prairie, University of Oklahoma Press, Norman, Ok, 118–132.
Olsson, L. & Ardö, J. (2002). Soil Carbon Sequestration in Degraded Semiarid Agro-ecosystems—Perils and Potentials. A Journal of the Human Environment, 31(6), 471–477. DOI: http://dx.doi.org/10.1579/0044-7447-31.6.471.
Orr, D.M., McKeon, G.M. & Day, K.A. (1991). Burning and Exlosure Can Rehabilitate Degraded Black Speargrass (Heteropogon contortus) Pasture, Tropical Grasslands, 25, 333–336.
Paton, C.J. & Rickert, K.G. (1989). Burning, then Resting, Reduces Wiregrass (Aristida ssp,) in Black Speargrass Pastures, Tropical Grasslands, 23, 211–216.
Perez, C., Roncoli, C., Neely, C. & Steiner, J.L. (2007). Can carbon sequestration markets benefit low-income producers in semi-arid Africa? Potentials and challenges. Agricultural Systems, 94, 2–12.
Powell, J.M., Ikpe, F.N. & Somda, Z.C. (1999). Crop yield and the fate of nitrogen and phosphorus following application of plant material and faeces to soil. Nutrient Cycling in Agroecosystems, 54, 215–226.
Pratt, D.J., Greenway, P.J. & Gwynne, M.D. (1966). A classification of East Africa Rangeland, with an Appendix on terminology. Journal of Applied Ecology, 3(2), 369–383.
Pricope, N.G., Husak, G., Lopez-Carr, D. Funk, C. & Michaelsen., J. (2013). The climate-population nexus in the East African Horn: Emerging degradation trends in rangeland and

CHAPTER TWO
43
pastoral livelihood zones. Global Environmental Change, 23, 1525–1541. http://dx.doi.org/10.1016/j.gloenvcha.2013.10.002.
ProBEC. (2009). Program for Basic Energy and Conservation-saving energy for better future. GTZ Biofuel newsletter 16, 2–8. Qin, Z., Zhuang, Q. & Chen M. (2012). Impacts of land use change due to biofuel crops on carbon balance, bioenergy production, and agricultural yield, in the conterminous United States. GCB Bioenergy, 4, 277–288. doi: 10.1111/j.1757-1707.2011.01129.x.
Radojevic, M. (2003). Chemistry of forestry fires and regional haze emphasis on southern Asia. Pure Appl. Geophy, 160, 157–187.
Reid, R.S., Thornton, P.K., McCrabb, G.J., Kruska, R.L., Atieno, F. & Jones, P.G., (2004). Is it possible to mitigate greenhouse gas emissions in pastoral ecosystems of the tropics? Environment, Development and Sustainability, 6, 91–109.
Reid, R.S., Serneels, S., Nyabenge, M. & Hanson, J. (2005). The changing face of pastoral systems in grass-dominated ecosystems of eastern Africa. In: FAO Grasslands of the world (2005): Chapter 2. Suttie, J.M., Reynolds, S.G. & Batello, C. (Eds.), 19–65.
Ringius, L . (2002). Soil carbon sequestration and the CDM: opportunities and challenges for Africa. Climatic Change, 54, 471–495.
Safriel, U., Adeel, Z., Niemeijer, D., Puigdefabregas, J., White, R., Lal, R., Wilson, M., Ziedler, J., Prince, S., Archer, E., King, C., Shapiro, B., Wessels, K., Nielsen, T., Portnov B., Reshef, I., Thonell, J., Lachman, E. & McNab, D. (2005). Ecosystems and Human Well-being: Current State and Trends: Chapter 22: ‘‘Dryland Systems’’ Volume 1. Hassan, R., Scholes, R. & Ash, N. (Eds.), 2–22.
Sanderson, M.G. (1996). Biomass of termites and their emissions of methane and carbon dioxide: A global database. Global biogeochemical cycles, 10(4), 543–557.
Sandford, J. & Ashley, S. (2008). Livestock livelihoods and Institutions in the IGAD region. IGAD Livestock Policy Initiatives, Working paper, 10(08), 1–41.
Sapunov, V.B. (2008). Global dynamics of termite population: modeling, control and role in greenhouse effect. In Robinson, W.H. & Bajomi, D. (Eds.), Proceeding of the Sixth International Conference on Urban Pest, 390–393.
Schlecht, E., Dickhoefer, U., Gumpertsberger, E. & Buerkert, A. (2009). Grazing itineraries and forage selection of goats in the Jabal al Akhdar Mountain range of northern Oman. Journal of Arid Environments, 73(3), 355–363.
Schlecht, E., Fernández-Rivera, S. & Hiernaux, P. (1998). Timing, size and N-concentration of faecal and urinary excretions in cattle, sheep and goats - can they be used for better manuring of cropland? In Renard, G., Neef, A., Becker, K. & von Oppen, M. (Eds.), Soil fertility Management in West African Land Use Systems. Margraf Verlag, Weikersheim, Germany, 361–368.

CHAPTER TWO
44
Schlecht, E., Hiernaux, P. & Turner, M.D. (2001). Mobilité du bétail: nécessité ET alternatives. In Tielkes, E., Schlecht, E. & Hiernaux, P. (Eds.), Elevage, Gestion des Parcours ET Implications pour le Développement au Sahel. Verlag U.E. Grauer, Beuren-Stuttgart, Germany, 65–77.
Schlecht, E., Hiernaux, P., Kadaouré, I., Hülsebusch, C. & Mahler, F. (2006). A spatio-temporal analysis of forage availability, grazing and excretion behaviour of cattle, sheep and goats in Western Niger. Agriculture, Ecosystems and Environment, 113, 226–242.
Schlecht, E., Richter, H., Fernández-Rivera, S. & Becker, K. (2007). Gastrointestinal passage of Sahelian roughages in cattle, sheep and goats, and implications for livestock-mediated nutrient transfers. Animal Feed Science and Technology, 137, 93–114.
Sharma, P., Abrol, V., Abrol, S. & Kumar, R. (2012). Climate Change and Carbon Sequestration in Dryland Soils.140–164. http://dx.doi.org/10.5772/52103.
Sileshi, G.W., Nyeko, P., Nkunika, O.Y., Sekematte, B.M., Akinnifesi, F.K. & Ajayi, O.C. (2009). Integrating ethno-ecological and scientific knowledge of termites for sustainable termite management and human welfare in Africa. Ecology and Society 14(1), 48. [Online] URL: http://www.ecologyandsociety.org/vol14/iss1/art48/.
Sileshi, G.W., Arshad, M.A., Konaté, S. & Nkunika, P.O.Y. (2010). Termite-induced heterogeneity in African savanna vegetation: mechanisms and patterns. Journal of Vegetation Science, 21, 923–937. doi: 10.1111/j.1654-1103.2010.01197.x.
Smil, V. (1999). Nitrogen in crop production: An account of global flows. Global Biogeochemical Cycles, 13(2), 647–662.
Solomon, D., Lehman, J. & Zech, W. (2000). Land-use effects on soil organic matter properties of chromic luvisols in semi-arid northern Tanzania: Carbon, nitrogen, lignin and carbohydrates. Agriculture, Ecosystems and Environment 78, 203–213.
Solomon, S., Plattner, G, Knuttic, R. & Friedlingstein, P. (2009). Irreversible climate change due to carbon dioxide emissions. PNAS, 106(6), 1704–1709. www.pnas.org_cgi_doi_10.1073_pnas.0812721106.
Somda, Z.C., Powell, J.M., Fernández-Rivera, S. & Reed, J. (1995). Feed factors affecting nutrient excretion by ruminants and the fate of nutrients when applied to soil. In Powell, J.M., Fernández-Rivera, S., Williams, T.O. & Renard, C. (Eds.), Livestock and Sustainable Nutrient Cycling in Mixed Farming Systems of sub-Saharan Africa. International Livestock Center for Africa, Addis Ababa, Ethiopia. 2, 227–243.
Steinfeld, H., Gerber, P., Wassenaar, T., Castel, V., Rosales, M. & de Haan, C. (2006). Livestock’s Long Shadow-Environmental Issues and Options, Chapter 3 & 4, FAO, Rome, Italy, 79–176.
Sugihara, S., Funakawa, S., Kilasara, M. & Kosaki, T. (2012). Effects of land management on microbial N supply to crop N uptake in dry tropical cropland in Tanzania. Agriculture, Ecosystem and Environment, 146, 209–219.

CHAPTER TWO
45
Synmann, H.A. (2002). Fire and the dynamics of semi-arid grassland: influence on soil characteristics. African Journal of Range and Forage Science, 19, 137–145. Tennigkeit, T. & Wilkies, A. (2008). An Assessment of the Potential for Carbon Finance in Rangelands. ICRAF Working Paper, 68, 1–31.
Thornton, P.K. & Herrero, M. (2010). Potential for reduced methane and carbon dioxide emissions from livestock and pasture management in the tropics. PNAS, 107(46), 19667–-19672. www.pnas.org/cgi/doi/10.1073/pnas.0912890107.
Tiessen H, Feller C, Sampaio E.V.S.B. & Garin P. (1998). Carbon sequestration and turnover in semiarid savannas and dry forest. Climate Change, 40, 105–117.
Tsegaye, D., Moe, S.R., Vedeld, P. & Aynekulu, E. (2010). Land-use/cover dynamics in Northern Afar rangelands, Ethiopia. Agriculture, Ecosystems and Environment, 139, 174–180. doi:10.1016/j.agee.2010.07.017.
Turner, M.D. (1995). The sustainability of rangeland to cropland nutrient transfer in semi-arid West Africa: ecological and social dimensions neglected in the debate. In Powell, J. M., Fernández-Rivera, S., Williams, T.O. & Renard, C. (Eds.), Livestock and sustainable nutrient cycling in mixed farming systems of sub-Saharan Africa. Proceedings of a conference at ILCA, Addis Ababa, Ethiopia, Nov. 22-26, 1993, II, 435–452.
Turner, M.D. (2000). Misunderstandings of Sahelian land use ecology. In Environment: Reality And Myth; a symposium re-evaluating some prevailing beliefs. http://www.india-seminar.com /2000/486.htm.
Turner, M.D., Hiernaux, P. & Schlecht, E. (2005). The distribution of grazing pressure in relation to vegetation resources in semi-arid West Africa: The role of herding. Ecosystems, 8, 668–281.
UN. (2011). Global Drylands: A UN System-wide response. Prepared by the Environment Management Group. Chapter 1- 4, 14–129.
UNEP. (2008). Carbon in Drylands: Desertification, Climate Change and Carbon Finance: A UNEP-UNDP-UNCCD Technical Note for Discussion at CRIC 7, Istanbul, Turkey-03-14 November, 2008, 2–12.
UNEP. (2009). Climate change in the African drylands: Options and opportunities for adaptation and mitigation. UNEP, UNCCD and UNDP, United Nations Development Programme, One UN Plaza, New York, NY, 10017, USA, 17–44.
Vagen, T.G., Lal, R. & Singh, B.R. (2005). Soil carbon sequestration in Sub-Saharan Africa: A review. Land Degra. Develop. 16, 53–71.
Valentini, R., Arneth, A., Bombelli, A., Castaldi, S., Gatti, C.R., Chevallier, F., Ciais, P., Grieco, E., Hartmann, J., Henry, M., Houghton, R.A., Jung, M., Kutsch, W.L., Malhi, Y., Mayorga, E., Merbold, L., Murray-Tortarolo, G., Papale, D., Peylin, P., Poulter, B., Raymond, P.A., Santini, M., Sitch, S., Laurin, G.V., van der Werf, G.R., Williams, C.A. & Scholes, R.J.

CHAPTER TWO
46
(2014). A full greenhouse gases budget of Africa: synthesis, uncertainties, and vulnerabilities. Biogeosciences, 11, 381–407. doi:10.5194/bg-11-381-2014.
Van der Werf, R., Randerson, J.T., Giglio, L., Collatz, G.J., Kasibhatla, P.S. & Arellano, Jr. A. F. (2006). Inter-annual variability in global biomass burning emissions from 1997 to 2004. Atmos. Chem. Phys. 6, 3423–3441.
Van Wilgen, B.W., Govender, N., Biggs, H.C., Ntsala, D. & Funda, X.N. (2004). Response of Savanna Fire Regimes to Changing Fire-Management Policies in a Large African National Park. Conservation Biology, 18(6), 1533–1540.
Velu, G., Ramasamy, K., Kumar, K., Sivaramaiah, N. & Ramanjaneya, V.R.M. (2011). Green House gas emission from termite’s ecosystem. African Journal of Environmental Science and technology, 5(2), 56–64.
Vetter, S. (2005). Rangelands at equilibrium and non-equilibrium: Recent developments in the debate. Journal of Arid Environments, 62, 321–241.
Wasonga, V.O., Nyariki, D.M. & Ngugi, R.K. (2011). Assessing socio-ecological dynamics using local knowledge in the semi-arid lowlands of Baringo districts, Kenya. Environmental Research Journal, 5, 11–17.
Wezel, A. & Schlecht, E. (2004). Inter-annual variation of species composition in fallow plant communities of semi-arid Niger. Journal of Arid Environments, 56, 265–282.
Williams, C.A., Hanan, N.P., Neff, J.C., Scholes, R.J., Berry, J.A., Denning, A.S. & Baker, D.F. (2007). Africa and the global carbon cycle, Carbon Bal. Manag. 2(3), 13.
Wood, T.G. (1991).Termites in Ethiopia: The Environmental Impact of Their Damage and Resultant Control Measures. Ambio, 20(3/4), 136–138. http://www.jstor.org/stable/4313800.
World Resources Institute (WRI), (1994). World Resources, 1994–95. A report by the World The World Resources Institute in collaboration with UNEP&UNDP, New York, Oxford University Press, 3–385.
World Resources Institute (WRI), (2000). Pilot Analysis of Global Ecosystems Grassland Ecosystems. White, R.P. Murray, S. & Rohweder, M. (Eds.), 1–70. http://www.wri.org/wr2000.
World Resources Institute (WRI), (2003). Drylands, People, and Ecosystem Goods and Services: A Web-Based Geospatial Analysis. White. R. P. & Nackoney. J. (Eds.), World Resources Institute, 1–58.
Zimmerman, P.R., Greenberg, J.P., Wandiga, S.O. & Crutzen, P. (1982). Termites: A potentially large source of atmospheric methane, carbon dioxide, and molecular hydrogen. Science, 218(4572) 563–565. doi: 10.1126/science.218.4572.563.
CHAPTER THREE
47
3. Land conversion dynamics in the Borana rangelands of southern Ethiopia: an
integrated assessment using remote sensing techniques and field survey data
Abstract: Conversion of rangelands into cultivated land is one of the main challenges affecting the management of rangelands in Ethiopia. In order to inform policy makers about trends in land-use conversion, this study examined the drivers, trends, and impacts of land conversions in five locations selected in the Borana rangelands of Southern Ethiopia. This study integrated survey interviews from agro-pastoralists, participatory appraisals, rainfall data, and remotely sensed satellite data from Landsat images taken in 1985 and 2011. Results indicate that there is a marked increase in cultivated land in some of the study sites while in the other sites there is a slight reduction. The bare lands increased in some parts of the study sites though there was slight recovery of grassland in some of the degraded areas. Settlement areas with permanent housing increased. Woodland vegetation decreased except on mountain escarpments where there were slight gains. The results further show that, during this period, bushland decreased while at the same time grassland increased. Shrub/grassland with seasonally flooded areas increased in the bottomlands. Inhabitants interviewed in the study areas perceived land use and land cover changes to be driven by interplay of recurrent drought, loss of pasture, food insecurity, and decline in income. Changes in policies that govern natural resources have influence the land use change in this area and the expansion of cultivation. Expansion of cultivation practices upon rangelands has resulting in significant loss of vegetation biomass and soil erosion, thereby precipitating rangeland degradation. The results provide comprehensive insights regarding the influence of internal and external drivers of land conversion that should be considered when making decisions for land use planning.
3.1. Introduction
Conversions of land from one use to another have become recognized as major causes of global
environmental changes (Turner 2002; Camill 2010). It is, therefore, important to understand the
drivers and trends influencing these conversions as a prerequisite for analysis of land use and
land cover change processes (Lambin & Serneels 2001; Geist & Lambin 2002). Knowledge of
the drivers and the trends of land conversion are needed for local, regional, and global
assessments because land conversion affects ecosystem processes (carbon stocks, biodiversity,
vegetation, and water) and the livelihoods of inhabitants are under threat (Lambin & Geist 2006).
Earlier studies have shown that land conversion in Africa’s rangelands is attributed to inefficient
policies that govern natural resources (Homewood et al., 2004), and that increasing
anthropogenic activities such as grazing and cultivation (Hein & De Ridder 2006). Wessels et al.
(2007), distinguish the effects of the rainfall patterns and human activities on the degradation of
rangelands. They also have analysed the effects of variable climate conditions on vegetation
changes in the Sahel (Kaspersen et al., 2011). These studies have demonstrated that both human

CHAPTER THREE
48
and climatic factors have potential influences on land conversion. One of the dominant
contemporary forms of land conversion in Africa’s rangelands is the expansion of cultivation
(WRI 2003; Safriel et al., 2005; White & Wanasselt 2000). Small-scale crop cultivation is
regarded as a livelihood diversification option to cope with economic hardships, but the process
has negative impacts on ecosystem integrity.
In Ethiopia, the conversion of rangelands into cultivated land has been reported (Garedew 2010;
Flintan 2011), but the driving factors behind the on-going processes have not been thoroughly
investigated. Specifically, the Borana pastoralists of Southern Ethiopia have been appreciated for
their superior systems of rangeland resource use and management for a long time (Coppock
1994; Oba et al., 2000); however, the prior communal management systems have been weakened
over time. Alongside this, there has been increasing crop cultivation in some portions of the
rangelands (Tache & Oba 2010). Despite the fact that small-scale crop cultivation is an age-old
practice of diversifying asset portfolios among pastoral communities inhabiting the precarious
rangelands of Ethiopia (Tolera & Abebe 2007), the negative trade-offs associated with its
adoption, especially on contemporary scales, have adverse implications for the very livelihoods
of these people and for the ecosystem. A previous study by (Tache & Oba 2010) investigated the
association between poverty and the participation of Borana herders in cultivation and (Solomon
et al., 2007), analysed current trends in cattle management, rangeland degradation, and the
perceptions of pastoralists. However, not many of the drivers behind the expansion of cultivation
in the rangeland have been examined, except for in the case of (Desta & Coppock 2004) who
analysed livelihood diversifications in the Borana rangeland. There is a paucity of evidence
regarding the drivers, trends, and impacts of on-going land conversions. Analysing these
variables will inform policy makers and rangeland managers of the extent to which land
conversion affects the ecosystem. Alongside this, a better way to understand the drivers, trends,
and impacts requires an integrative approach, i.e. socio-economic and biophysical processes
(Lambin & Serneels 2001). Since the drivers of land conversion are not uniform, case study
evidence remains crucial for gaining broad insight into how socio-environmental interactions
within specific contexts influence land conversions and how the processes can lead to global
impacts (Lambin & Geist 2006). This is necessary for guiding decisions and policies on land use
and the sustainability of ecosystems. It is against this background that this study was conducted

CHAPTER THREE
49
to examine the drivers and trends in land conversion using integrated methods of remote sensing
and field survey data.
Earlier studies (Liavoga et al., 2014; Foody 2002) have documented the benefits of remote
sensing and geographic information systems (GIS) for tracing and analysing land cover changes.
Remote sensing and GIS are suitable for deriving quantitative information regarding spatial and
temporal land cover changes. Besides remote sensing techniques, understanding the impact of
the socio-economic dimension on land conversion remains crucial for land cover change studies
(Lambin & Geist 2006). For example, (Pisanelli et al., 2012), demonstrates a methodological
context for analysing ecological dynamics by combining demography, local community
perceptions, and socio-ecological systems. The authors provide empirical evidence on the trade-
offs between socio-economic concerns and the environment in assessing ecological dynamics. In
this study, we integrated remotely sensed satellite data, rainfall data, and social economic data to
investigate land conversion dynamics.
The objective of this study is to examine the drivers, trends, and impacts of land conversion
dynamics in selected sites of the Borana rangelands. The specific objectives are: (a) to assess
temporal trends in the expansion of cultivation and the resulting land cover changes between
February 1985 and February 2011, (b) to analyse the social economic factors and their influences
on the expansion of cultivation, (c) to understand the drivers behind the expansion of cultivation,
and (d) to analyse the implications of land management on the rangeland ecosystems. The results
of this study have the potential to improve scientific knowledge of the drivers behind land
conversion. The study demonstrates the importance of integrating multiple data sources in
analysing land conversion dynamics. The findings are expected to guide decisions and to inform
policy makers about the current status of land uses and land cover changes, which are very
crucial in resource management in the arid and semi-arid rangelands.
3.2. Materials and Methods
3.2.1. The study areas
The administrative division of the Federal Democratic Republic of Ethiopia divides the regional
states into divisions called Woreda. A Woreda is an administrative division equivalent to a
CHAPTER THREE
50
district. It is composed of a number of subdivisions, which are the smallest units of local
government, called Kebele. In this study, a Kebele refers to a pastoral area (PA) within a
Woreda. The study was conducted in five Kebele located in the Borana rangelands in the
Southern part of Ethiopia. The total land area of the study sites is 735.90 km2. One study site,
Darito, is located in the Yabelo Woreda. The other four study sites, Soda, Samaro, Haralo, and
Did mega are all located around Mega in Dire Woreda. The study sites lie within 4°45ˈ20ʺN and
4°5ˈ20ʺN and 38°22ˈ40ʺE and 38°9ˈ20ʺE (Figure 3.1). The landscapes of the study areas are
characterized by low-lying flat terrain, rolling hills, and steeply dissected mountains ranging
from 1090 to 2204 m above sea level. The region has a bimodal rainfall pattern with ‘short rain’
occurring between September to December and ‘long rain’ falling from March to May. The
average annual rainfall ranges between 100 mm and 600 mm, and the mean annual temperature
ranges from 15 °C to 24 °C (Coppock 1994; Mengistu 1998). The major soil types in the study
areas developed from a geological formation of 40% quaternary deposit, 38% basement complex
formation, and 20% volcanic deposit (Tefera et al., 2007). In the lowland areas of the rangelands,
soil drainage is inundated, resulting in occasional water-logging or floods. The common
vegetation types include Acacia spp, Boscia mossambicensis, Combretum molle, Commiphora
schimperi, Cordia africana, Croton macrostachyus, Erythrina melanacantha, Euphorbia
tirucalli, Ficus sycomorus, Terminalia brownii, Terminalia prunioides, Juniperus procera,
Rhamnus prinoides, Balanites aegyptiaca and Olea europaea subsp. cuspidate (Coppock 1994).
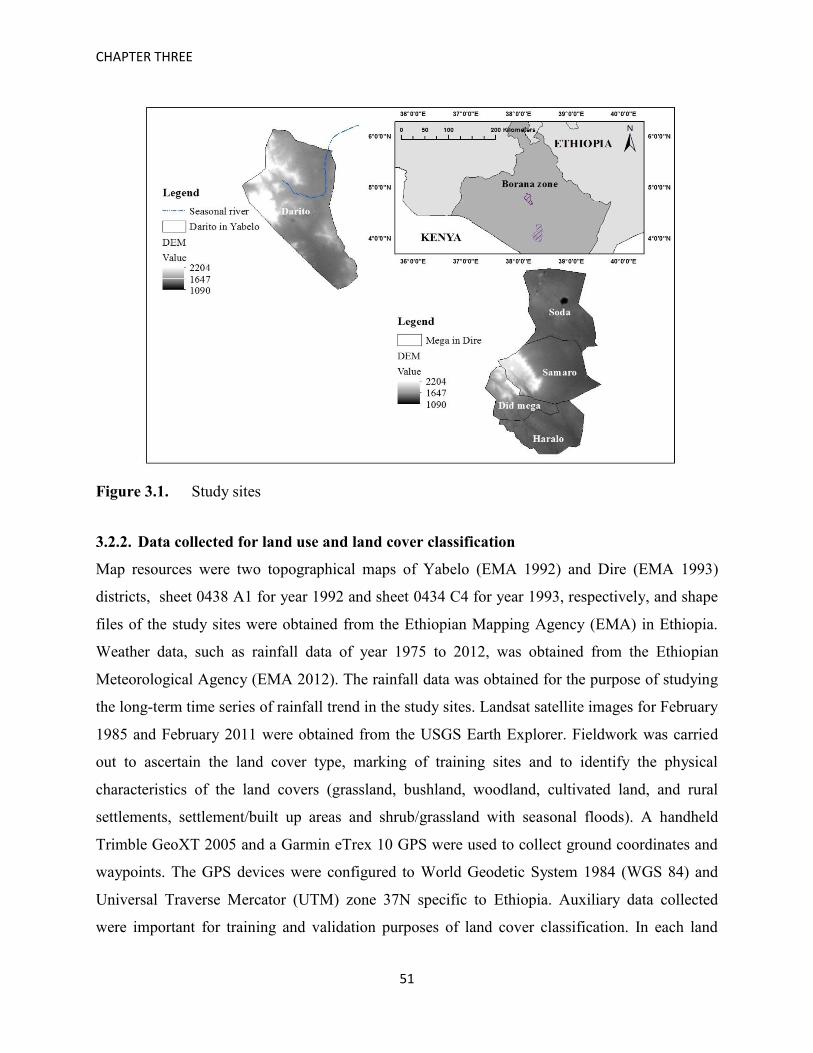
CHAPTER THREE
51
Figure 3.1. Study sites
3.2.2. Data collected for land use and land cover classification
Map resources were two topographical maps of Yabelo (EMA 1992) and Dire (EMA 1993)
districts, sheet 0438 A1 for year 1992 and sheet 0434 C4 for year 1993, respectively, and shape
files of the study sites were obtained from the Ethiopian Mapping Agency (EMA) in Ethiopia.
Weather data, such as rainfall data of year 1975 to 2012, was obtained from the Ethiopian
Meteorological Agency (EMA 2012). The rainfall data was obtained for the purpose of studying
the long-term time series of rainfall trend in the study sites. Landsat satellite images for February
1985 and February 2011 were obtained from the USGS Earth Explorer. Fieldwork was carried
out to ascertain the land cover type, marking of training sites and to identify the physical
characteristics of the land covers (grassland, bushland, woodland, cultivated land, and rural
settlements, settlement/built up areas and shrub/grassland with seasonal floods). A handheld
Trimble GeoXT 2005 and a Garmin eTrex 10 GPS were used to collect ground coordinates and
waypoints. The GPS devices were configured to World Geodetic System 1984 (WGS 84) and
Universal Traverse Mercator (UTM) zone 37N specific to Ethiopia. Auxiliary data collected
were important for training and validation purposes of land cover classification. In each land

CHAPTER THREE
52
cover type, about a hundred training sites were marked. Other training sites were marked for
water points and for the main roads for ground truthing. Two Landsat TM imageries acquired in
February 1985 and February 2011 were used for land cover classification. These years were
chosen because of the availability of data, the quality of the images and in February there were
no clouds. Analysis was processed using ArcGIS 10.2 and supplemented by Quantum GIS 1.8.0
and Monteverdi 1.12.0 software. The images were rectified to the World Geodetic System 1984
(WGS 84) and Universal Traverse Mercator (UTM) zone 37N specific to Ethiopia. The pre-
processing procedures recommended in (Lillesand et al., 2008), clipping the region of interest
(ROI) and using colour composites with different reflectance bands (4, 3, and 2), were used to
improve visualization and interpretation. Land cover classification was done separately in all five
Kebele for the purpose of comparing the differences.
3.2.3. Socio-economic data
A semi-structured household questionnaire was administered in the five communities and a total
of 265 heads of households were interviewed (Appendix 1). In order to obtain a representative
sample, stratified cluster sampling method was designed and used to ensure that data collected
represented the communities studied. The approach is similar to (Jansen et al., 2006) as they
employed the approach while analysing livelihoods strategies in Honduras, and also Ye et al.
(2013) who used stratified sampling approach in sampling forest. Five villages or Kebele were
purposely selected. Within the study villages, four to five clusters were designed contingent to
the total number of households because the pastoralists do not live in nuclear settlements but are
scattered community. Within the five villages households were systematically randomly selected.
Social economic data collected included the age of the household head, gender, income,
livelihood activities, and land ownership. This information was collected in order to ascertain the
socio-economic activities, background of the inhabitants in the study sites and the perceived
reasons led to land use and land cover changes (participating in cultivation activity).
Participatory tools, such as resource mapping and transect walks, were used to learn about the
locations of different land resources. Key informant interviews with elders, women leaders,
natural resource experts, vegetation ecologists, Kebele chairpersons, pastoralist and agro-
pastoralist leaders, development agencies and, government officials from the respective Kebele
were conducted using a specific checklist of questions (Appendix 2 and 3). A total of 12 focus
group discussions were held using a specific checklist (Appendix 4). The participants were from

CHAPTER THREE
53
the following social groups: Kebele elders (men and women), youths, natural resource experts,
vegetation ecologists, Kebele chairpersons, pastoralist and agro-pastoralist leaders, and
development agency and government officials. The discussion focused on the following topics:
resource mapping, land management in the areas, land availability and ownerships, ecological
and social changes, rainfall trends, farming activities and land management, crops grown, wealth
ranking and persisting land use dynamics over the last 30 years (Appendix 5).
3.2.4. Data analysis
3.2.4.1. Land cover classification and change detection
The maximum likelihood approach of the unsupervised classification method was used for the
analyses. The software grouped the pixels based on the reflectance properties of the pixels to
create clusters. This approach was used because it has the advantages of recognizing unique
classes, reduces human error and does not require great knowledge of the area.
Table 3.1. Description of the criteria used to classify land use and land cover type. Land Use/Cover Class Description Woodland Land covered with vegetation species (plants higher than 5 m to 20 m
classified as woodland trees Bushland Land composed of bush or shrubs (plants lower than 5 m are classified as
bushland) Grassland Land cover dominated by grass and herbs with scattered trees and shrubs Cultivated land Crop fields with rural settlements Bare land Non vegetative land such as rock, sand and lava Shrub/Grassland with seasonal floods Semi-permanent and seasonal water logged land with less than 10% of
vegetation cover (flood plains comprised of herbs, grass and dwarf bushes) Settlement/Built up area Permanent settlement areas with more than 2000 inhabitants
Based on (Anderson 1976) land-use land-cover classification system, seven land cover classes,
bare land, cultivated land and rural settlements, settlements/built up areas, shrub/grassland with
seasonal floods, woodland, grassland, and bushland, were classified in accordance with (Pratt et
al., 1966; Pratt & Gwynne 1977) classification criteria for East African rangelands. With a
spatial resolution of 30m × 30m for Landsat images it was not possible to classify rural
settlements under one separate class because the roofs of most houses were grass thatched and
thus caused spectral mixture with other covers. It was, therefore, decided to classify cultivated
land and scattered settlements under one class. Nevertheless, settlements covered with
galvanized iron sheets were classified. Change detection analysis was carried out using

CHAPTER THREE
54
ArcGIS10.2 by comparing two classified land cover maps, i.e., land cover for 1985 and 2011.
The summaries of the areas and percentages of land cover change are presented in Tables 3.1 and
3.2. Accuracy assessment was done using ERDAS IMAGINE 2011 software by comparing the
classified land cover maps with high resolution images from Google Earth and the training sites
generated during field data collection.
3.2.4.2. Socio-demographic and economic profile of the respondents
Social economic data from respondents’ interviews were analysed using descriptive statistics in
the Statistical Package for Social Sciences (SPSS) and QED Statistics computer software. A
statistical test, i.e., Chi-square (X2), was used to test the differences among family size and size
of land, the proportion of Kebele demanding land periodically and the differences in existence of
school-going children. Mean comparison was used to check the differences in income, family
size, and school-going children. The spatial and temporal trends in increasing number of agro-
pastoralists, the drivers behind the expansion of cultivation, ranked income sources, economic
activities, and land management practices were analysed using descriptive statistics such as
means, standard deviations, and percentages.
3.2.4.3. Rainfall data and the number farmers over time
The mean monthly rainfall and standard deviations were computed from the corresponding years
(1975 to 2012). The long-term mean monthly rainfall from 1975 to 2012 was computed by
summing the mean monthly rainfall and divided by the total count years. Pearson’s correlation
coefficient test was used to check the association between the deviations of the mean monthly
rainfall of a respective year with the numbers of new farmers who started farming in that year.
The deviations of farmers was not computed because only the years they started cultivation were
recorded and not the total number of farmers in the study areas. Therefore, these indices were
tested to check if deviations of the rainfall from the long term mean influenced the number of
farmers starting cultivation in that year or afterwards.
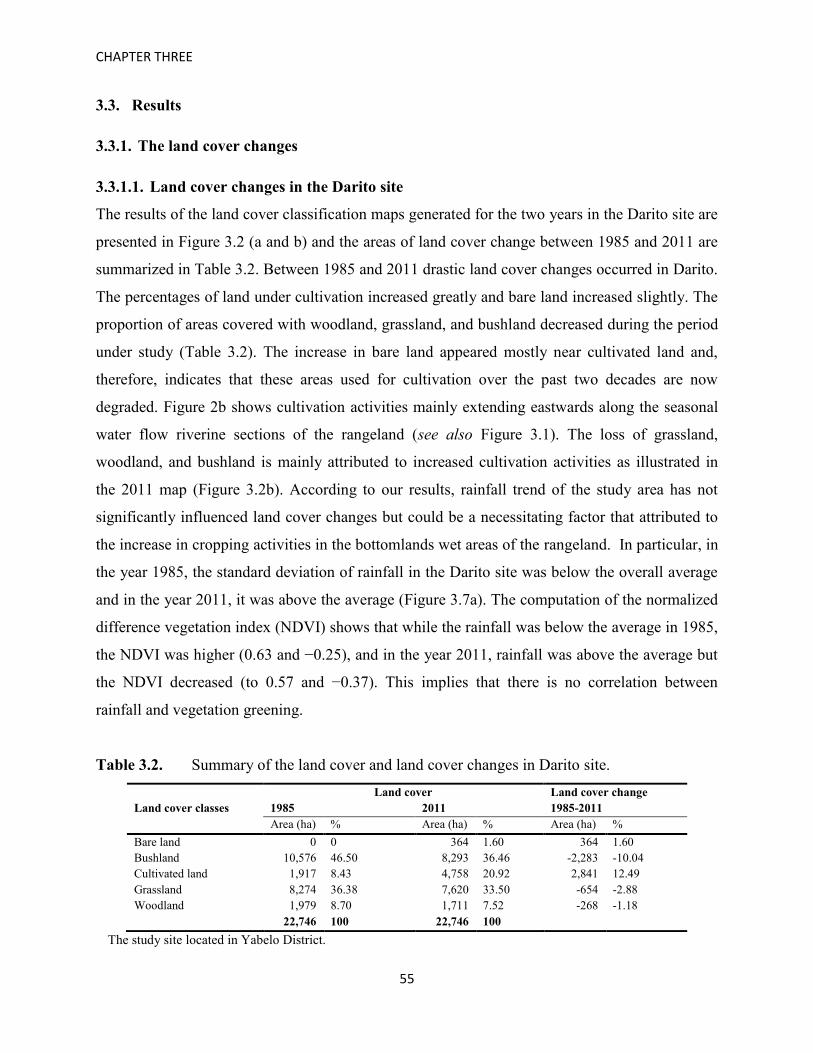
CHAPTER THREE
55
3.3. Results
3.3.1. The land cover changes
3.3.1.1. Land cover changes in the Darito site
The results of the land cover classification maps generated for the two years in the Darito site are
presented in Figure 3.2 (a and b) and the areas of land cover change between 1985 and 2011 are
summarized in Table 3.2. Between 1985 and 2011 drastic land cover changes occurred in Darito.
The percentages of land under cultivation increased greatly and bare land increased slightly. The
proportion of areas covered with woodland, grassland, and bushland decreased during the period
under study (Table 3.2). The increase in bare land appeared mostly near cultivated land and,
therefore, indicates that these areas used for cultivation over the past two decades are now
degraded. Figure 2b shows cultivation activities mainly extending eastwards along the seasonal
water flow riverine sections of the rangeland (see also Figure 3.1). The loss of grassland,
woodland, and bushland is mainly attributed to increased cultivation activities as illustrated in
the 2011 map (Figure 3.2b). According to our results, rainfall trend of the study area has not
significantly influenced land cover changes but could be a necessitating factor that attributed to
the increase in cropping activities in the bottomlands wet areas of the rangeland. In particular, in
the year 1985, the standard deviation of rainfall in the Darito site was below the overall average
and in the year 2011, it was above the average (Figure 3.7a). The computation of the normalized
difference vegetation index (NDVI) shows that while the rainfall was below the average in 1985,
the NDVI was higher (0.63 and −0.25), and in the year 2011, rainfall was above the average but
the NDVI decreased (to 0.57 and −0.37). This implies that there is no correlation between
rainfall and vegetation greening.
Table 3.2. Summary of the land cover and land cover changes in Darito site. Land cover Land cover change Land cover classes 1985 2011 1985-2011 Area (ha) % Area (ha) % Area (ha) % Bare land 0 0 364 1.60 364 1.60 Bushland 10,576 46.50 8,293 36.46 -2,283 -10.04 Cultivated land 1,917 8.43 4,758 20.92 2,841 12.49 Grassland 8,274 36.38 7,620 33.50 -654 -2.88 Woodland 1,979 8.70 1,711 7.52 -268 -1.18 22,746 100 22,746 100
The study site located in Yabelo District.
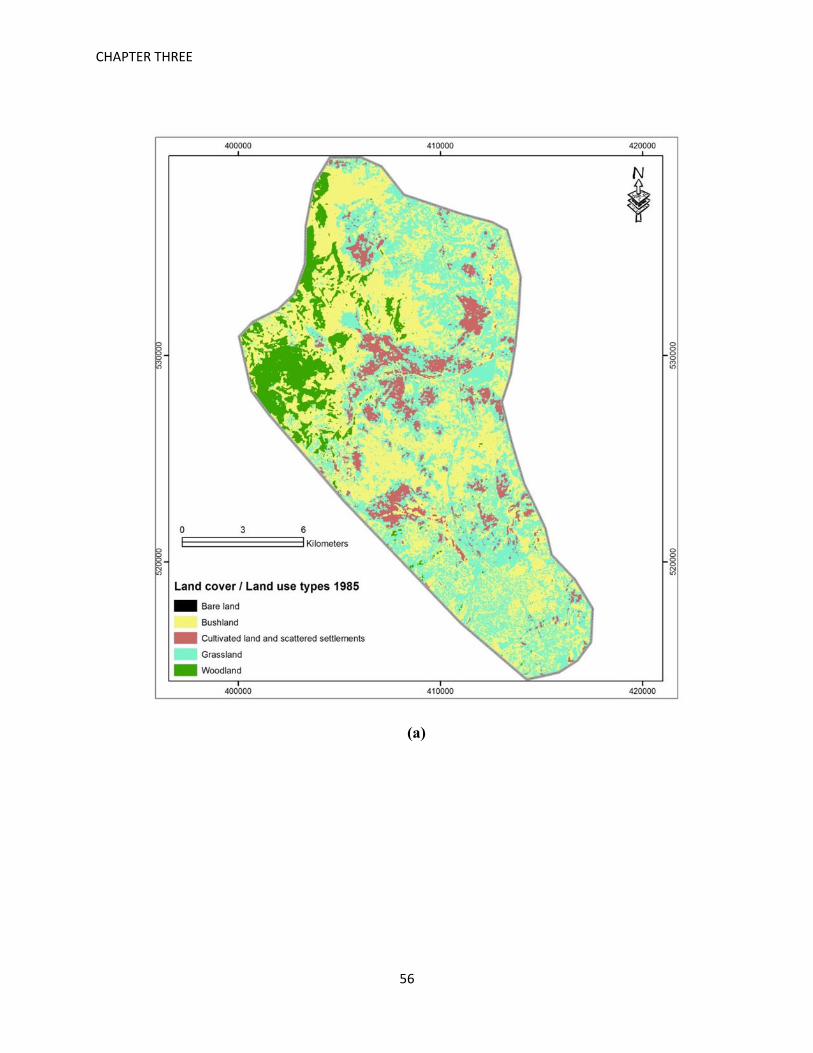
CHAPTER THREE
56
(a)

CHAPTER THREE
57
(b)
Figure 3.2. Land cover and land cover change maps in Darito site 1985 (a) and 2011 (b).
3.3.1.2. Land cover changes in Mega sites
Figure 3.3 (a and b) present the land cover maps of the four study sites (Soda, Samaro, Haralo,
and Did mega), and Table 3.3 summarizes the results of the areas of land that changed between
1985 and 2011. In the Soda site, noticeable changes occurred in land cover types. In the 2011
map, the proportion of the area under shrub/grassland characterised by seasonal floods increased
in the lowland areas (Figure 3.3b). Such increments could be attributed to an increase in water
run-off during the rainy seasons. According to our results, there was also an eminent increase of
CHAPTER THREE
58
grassland in the 2011 map (Table 3.3). Other changes occurred in the woodland, which increased
in the north-western part of the Soda site in the 2011 map (Figure 3.3b). Based on the 1985 map,
some portions of the rangeland that had been covered by bushland were now dominated by
woodland vegetation. There is a great connection between the decrease in bushland vegetation in
the site and the increase of grasslands during the study period. The results in (Table 3.3)
demonstrate that the land under cultivation decreased in the 2011 map and adjacent to it, the
proportion of bare land areas also decreased. This can be explained by the restoration of
grassland and decrease in the proportion of cultivated areas in the southern part of the site in the
2011 map (Figure 3.3b).
Table 3.3 presents the results of the land cover changes in Samaro where woodland vegetation
increased slightly. Additionally, fascinating changes occurred in grassland cover where there was
a great increment in the 2011 map, and this is concurrent with an enormous decline in the
bushland vegetation (Figure 3.3b). The decline in bushland can be explained by successful
efforts introduced by the district government in the study area to clear bushes, which were
overwhelmingly grasslands. Gains of grassland are also concomitant to improved land
management such as creation of grassland enclosures and cessation of grazing that allow
vegetation to recover. Cultivated land decreased slightly between 1985 and 2011 while bare land
increased. In the settlement category, built up areas increased to a certain degree, which is
attributed to immigration and natural increase. The bottomlands vegetation (shrub/grassland)
characterized by occasional flooding decreased slightly in the 2011 map. Variable rainfall in the
study area was attributed to land cover changes, in particular to the decline in cultivation
activities within the Samaro site. The topographic landscapes around Mega have created an arid
condition that limit cropping performance unlike the cases of the Haralo and Did mega sites.
Moreover, in the Haralo site, the proportion of shrub/grassland vegetation in the bottomlands
decreased slightly, and this can be explained by the re-growth of vegetation such as grass, herbs
or shrubs. As it was detected in the analysis, the grassland cover increased in the 2011 map and
this was connected to a decrease of bushland vegetation. Despite the extensive gains in
grasslands in some portions of the site, the proportion of bare land in the site increased more than
was the case for the rest of the study sites. This is a massive indicator of land degradation

CHAPTER THREE
59
obtained in this site (Table 3.3). Woodland vegetation increased slightly during the study period.
Nevertheless, the change was very small for this vegetation class.
In the Did mega site, Table 3.3 shows the greatest increase in the proportion of grassland in the
2011 map (Figure 3.3b). Explanations for this change are a cessation of grazing, creation of
grassland enclosures, and bush clearing practices. Cultivated land on the other hand increased
slightly, and there was also an increase in the proportion of bare land during the period under
study. The proportion of bottomland vegetation such as shrub/grassland with seasonal floods
increased, and such increment is associated to loss of vegetation cover due to expansion of
cultivation activities and harvesting of bushes and wood trees for domestic use. Hence the
bottomland areas are subjected to seasonal water-logging.
The overall land cover analysis and change detection showed remarkable land cover changes
across the study sites. The greatest change is the decrease in the proportion of bushland
vegetation in all study areas. Grassland cover also increased significantly in Soda, Samaro,
Haralo, and Did mega though in the Darito site, the grassland cover decreased. Other changes is
the wide spreading of bare land obtained in Haralo and the increase in cultivated areas in the
Darito site, which was more extensive than in the rest of the study sites. The rainfall pattern of
the study areas fluctuates below and above the overall average, indicating that the areas
experienced more droughts than precipitation over the years tested (Figure 3.7b). The normalized
difference vegetation index (NDVI) in 1985 was between 0.57 and −0.12 and in 2011 it was
between 0.52 and −0.09, signifying that vegetation greenness decreased during the study period.
However, the decrease in greening of vegetation does not correlate with rainfall trend of the area
but with the losses of vegetation cover.

CHAPTER THREE
60
Table 3.3. Summary of the land cover and land cover changes in Mega sites. Land cover in Soda Land cover change Land cover classes 1985 2011 1985-2011 Area (ha) % Area (ha) % Area (ha) % Bare land 1,243 7.60 523 3.20 -720 -4.40 Bushland 8,886 54.32 4,428 27.07 -4,458 -27.25 Cultivated land 1,431 8.75 694 4.24 -737 -4.51 Shrub/grassland with seasonal floods 633 3.87 773 4.73 140 0.86 Grassland 3,881 23.73 8,441 52.60 4,560 27.88 Woodland 284 1.74 1,499 9.60 1,215 7.43 Total 16,358 100 16,358 100 Land cover in Samaro Land cover change Land cover classes 1985 2011 1985-2011 Area (ha) % Area (ha) % Area (ha) % Bare land 1,270 7.11 1,729 9.67 459 2.57 Bushland 8,451 47.29 4,315 24.14 -4,136 -23.14 Cultivated land 1,665 9.32 1,639 9.17 -26 -0.15 Shrub/grassland with seasonal floods 2,380 13.32 1,932 10.81 -448 -2.51 Grassland 2,991 16.74 6,924 38.74 3,933 22.01 Woodland 1,047 5.86 1,254 7.02 207 1.16 Settlement/Built up Area 68 0.38 79 0.44 11 0.06 Total 17,872 100 17,872 100 Land cover in Haralo Land cover change Land cover classes 1985 2011 1985-2011 Area (ha) % Area (ha) % Area (ha) % Bare land 576 5.16 2,044 18.30 1,468 13.14 Bushland 5,813 52.04 2,320 20.77 -3,493 -31.27 Cultivated land 1,231 11.02 1,601 14.33 370 3.31 Shrub/grassland with seasonal floods 2,209 19.78 1,979 17.72 -230 -2.06 Grassland 1,340 12.00 3,146 28.16 1,806 16.17 Woodland 1 0.01 80 0.72 79 0.71 Total 11,170 100 11,170 100 Land cover in Did mega Land cover change Land cover classes 1985 2011 1985-2011 Area (ha) % Area (ha) % Area (ha) % Bare land 919 13.20 1,069 15.35 150 2.15 Bushland 4,041 58.04 1,860 26.71 -2,181 -31.32 Cultivated land 851 12.22 912 13.10 61 0.88 Shrub/grassland with seasonal floods 339 4.87 940 13.50 601 8.63 Grassland 341 4.90 1,908 27.40 1,567 22.50 Woodland 472 6.78 274 3.94 -198 -2.84 Total 6,963 100 6,963 100
Four study sites Soda, Samaro, Haralo and Did mega were analysed at Mega in Dire District.

CHAPTER THREE
61
(a)

CHAPTER THREE
62
(b)
Figure 3.3. Land cover and land cover change maps in Mega sites 1985 (a) and 2011 (b).

CHAPTER THREE
63
3.3.2. Socio-economic information and economic activities
3.3.2.1. Socio-demographic characteristics
Of the total 265 respondents involved in this study, 50 were from Darito, 47 from Soda, 57 from
Samaro, 50 from Haralo, and 61 from Did mega. Three quarters were males and the remaining
25% were females. The majority of the respondents were aged 60 years and above (Figure 3.4).
The mean family size for the five study sites was 7.32 at 95% Confidence Interval (CI), however,
there was a difference in mean family size across the study sites (Table 3.4), and the difference
had a significant (r = 0.53, p < 0.0001) correlation with the age of the respondents. The level of
education attained by the respondents was low, the majority (n = 229) had never been to school,
only a few (n = 28) had attained primary education and even fewer (n = 7) had attained a
secondary education. About 180 of the respondents had at least one schooling child and the other
85 had no schooling child.
Figure 3.4. Age cohorts of respondents.
3.3.2.2. Socio-economic and demographic profiles and their linkages to land use
The majority, 93%, of the respondents owned land for cultivation, and the average size of farms
was 2.10 hectares (ha). The average land size in the Did mega site was higher with 2.79 ha than
the overall average size of farms (Table 3.4). Based on the 173 out of 265 respondents who
mentioned their incomes, the mean monthly income varied across the study sites (Table 3.4).
And the variations in income across the study locations are attributed to the size of the family,
households with children in school, and the availability of diverse income sources (three or more
sources). In particular, the mean income in the Soda site was higher than the overall average

CHAPTER THREE
64
income. The main reason is that many families in the Soda site depend more on livestock
production because they are a pure pastoralist economy, and the site is endowed with salt
extraction activities, which is another injector that contributes to a households’ economy. Haralo
is the poorest site with the lowest mean income, and the situation is attributed to inadequate
livelihood diversification activities.
Table 3.4. Comparison of mean family size, land size and income across the study sites: N =
265. Village/Kebele Mean
family size SD Mean
farm size SD Mean monthly
income SD (log)
Darito 6.88 3.589 2.00 1.161 0.00 0.00000
Soda 8.06 3.75 1.19 1.191 3424.68 1.86032
Samaro 7.33 2.942 2.09 1.057 1456.49 0.77329
Haralo 6.88 1.965 2.22 1.093 743.00 3.27574
Did mega 7.44 3.384 2.79 1.368 1219.34 3.52461
Overall average 7.32
2.10
1341.55 At the time of this research 1 US$ ~ 17.7 Ethiopia Birr: The mean monthly income is in Ethiopia Birr (ETB), SD -
meaning standard deviation.
3.3.2.3. Major economic activities and sources of income
Over more than three quarters of the respondents were involved in both crop and livestock
farming to earn a living. The rest dealt with only crop farming, only livestock farming, or a
combination of crop farming with petty trade or salt extraction. Crop and livestock production
accounted for more than three quarters of the income of those interviewed (Table 3.5).
Specifically, the types of crops produced are rain-fed, such as maize, haricot beans, teff, wheat,
barley, and sorghum.
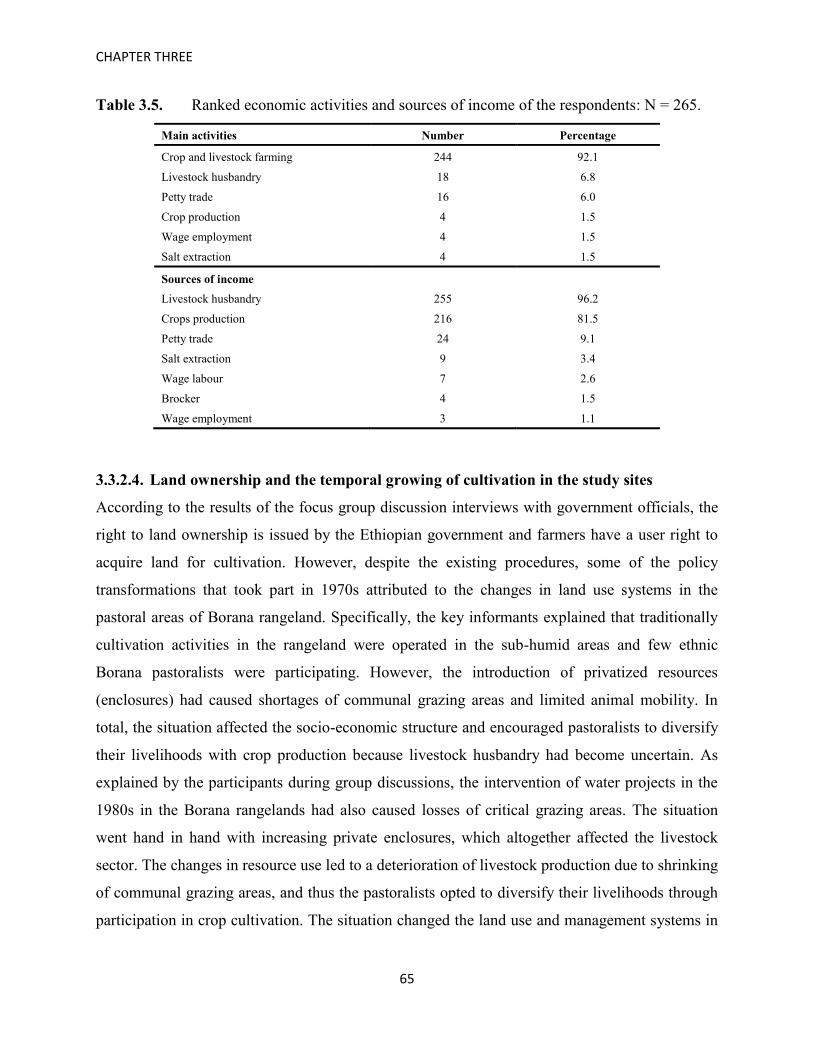
CHAPTER THREE
65
Table 3.5. Ranked economic activities and sources of income of the respondents: N = 265.
Main activities Number Percentage
Crop and livestock farming 244 92.1
Livestock husbandry 18 6.8
Petty trade 16 6.0
Crop production 4 1.5
Wage employment 4 1.5
Salt extraction 4 1.5
Sources of income
Livestock husbandry 255 96.2
Crops production 216 81.5
Petty trade 24 9.1
Salt extraction 9 3.4
Wage labour 7 2.6
Brocker 4 1.5
Wage employment 3 1.1
3.3.2.4. Land ownership and the temporal growing of cultivation in the study sites
According to the results of the focus group discussion interviews with government officials, the
right to land ownership is issued by the Ethiopian government and farmers have a user right to
acquire land for cultivation. However, despite the existing procedures, some of the policy
transformations that took part in 1970s attributed to the changes in land use systems in the
pastoral areas of Borana rangeland. Specifically, the key informants explained that traditionally
cultivation activities in the rangeland were operated in the sub-humid areas and few ethnic
Borana pastoralists were participating. However, the introduction of privatized resources
(enclosures) had caused shortages of communal grazing areas and limited animal mobility. In
total, the situation affected the socio-economic structure and encouraged pastoralists to diversify
their livelihoods with crop production because livestock husbandry had become uncertain. As
explained by the participants during group discussions, the intervention of water projects in the
1980s in the Borana rangelands had also caused losses of critical grazing areas. The situation
went hand in hand with increasing private enclosures, which altogether affected the livestock
sector. The changes in resource use led to a deterioration of livestock production due to shrinking
of communal grazing areas, and thus the pastoralists opted to diversify their livelihoods through
participation in crop cultivation. The situation changed the land use and management systems in
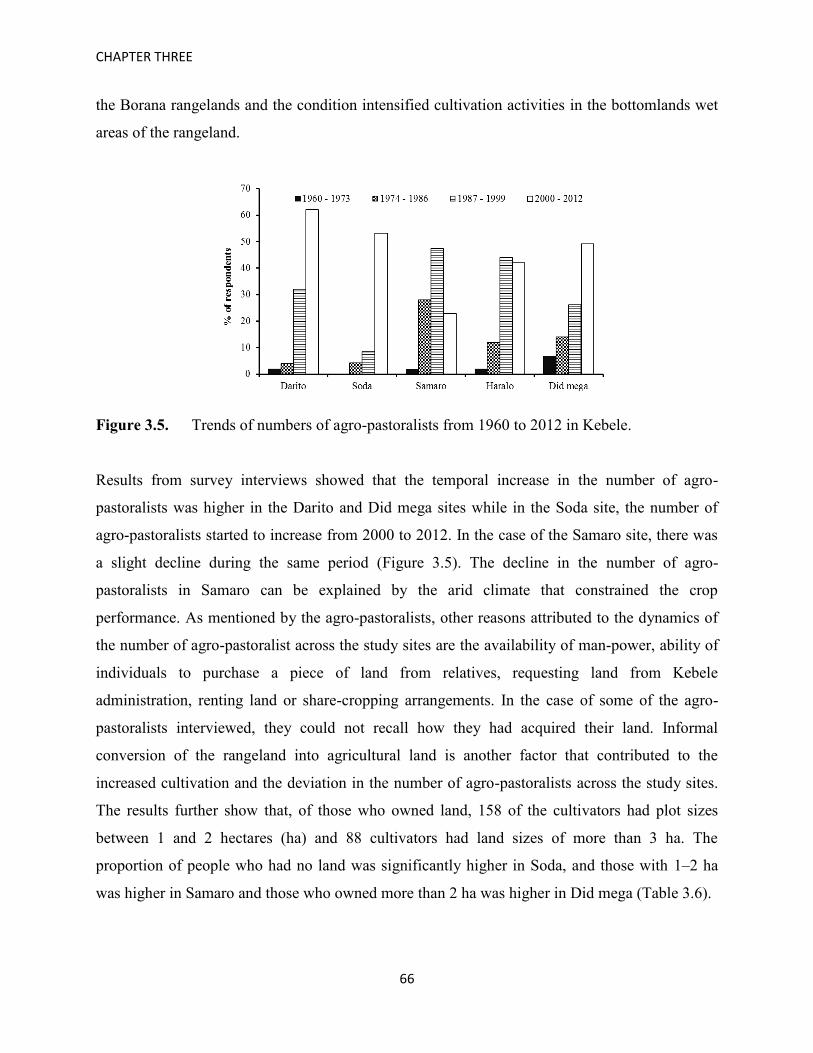
CHAPTER THREE
66
the Borana rangelands and the condition intensified cultivation activities in the bottomlands wet
areas of the rangeland.
Figure 3.5. Trends of numbers of agro-pastoralists from 1960 to 2012 in Kebele.
Results from survey interviews showed that the temporal increase in the number of agro-
pastoralists was higher in the Darito and Did mega sites while in the Soda site, the number of
agro-pastoralists started to increase from 2000 to 2012. In the case of the Samaro site, there was
a slight decline during the same period (Figure 3.5). The decline in the number of agro-
pastoralists in Samaro can be explained by the arid climate that constrained the crop
performance. As mentioned by the agro-pastoralists, other reasons attributed to the dynamics of
the number of agro-pastoralist across the study sites are the availability of man-power, ability of
individuals to purchase a piece of land from relatives, requesting land from Kebele
administration, renting land or share-cropping arrangements. In the case of some of the agro-
pastoralists interviewed, they could not recall how they had acquired their land. Informal
conversion of the rangeland into agricultural land is another factor that contributed to the
increased cultivation and the deviation in the number of agro-pastoralists across the study sites.
The results further show that, of those who owned land, 158 of the cultivators had plot sizes
between 1 and 2 hectares (ha) and 88 cultivators had land sizes of more than 3 ha. The
proportion of people who had no land was significantly higher in Soda, and those with 1–2 ha
was higher in Samaro and those who owned more than 2 ha was higher in Did mega (Table 3.6).

CHAPTER THREE
67
Table 3.6. Comparison of land size per hectares (ha) across the village, by family size,
children in school and cropping history (X2 test): N = 265.
0 ha 1–2 ha > 2 ha
Village/Kebele Numbers Numbers Numbers p–Value
Darito 0 35 15
0.0001 Soda 17 22 8
Samaro 0 42 15
Haralo 0 34 16
Did mega 2 25 34
Family size
<5 3 37 9 0.0001 5–10 8 111 62
>10 8 10 17
School going children
Household with schooling children 16 95 69 0.0038 Household with no schooling children 3 63 19
Cropping history
1960 –1979 0 10 9 0.01538 1980 –1999 0 59 49
2000 –2012 1 89 30
The reasons for the observed differences are three-fold. First, larger family size was significantly
correlated with the size of land owned by a household. Second, many families with >2 ha of land
were those with children in school, and this is linked to early sedentarization whereby families
living closer to Mega town are more likely to have been sedentary for longer, meaning that they
had the opportunity to acquire more land. Families who were more mobile had a lesser chance of
sending their children to school and acquiring land. Third, households, which started cultivation
from 1980–1999, had bigger plots of land than those that started in from 1960–1979. The reason
for this is that in the 1960s and–1970s, cultivation activities in the Borana rangeland were
minimally practiced and the economies of many households relied more on livestock husbandry.
During group discussion interviews, participants specified that the few families who had been
engaged in crop farming in 1997 had such good yields, especially after El Niño rains, that other
pastoralists became motivated to start their own cultivation. On the contrary, the statistical
analysis of the decadal rainfall pattern across the study sites is not comparable with the effects of
El Niño rains on land cover changes. More verification is needed with regard to this.

CHAPTER THREE
68
3.3.2.5. Perceived drivers behind the expansion of cultivation
According to the survey interviews, the agro-pastoralists explained that the expansion of
cultivation in the rangeland was attributed to climatic and socio-economic constraints. Figure
3.6, presents the perceived drivers behind the expansion of cultivation in the study sites. The
drivers considered were: recurrent drought, food insecurity, income diversification, and a
decrease of pasture. Recurrent drought, food insecurity, and diminishing pasture were considered
to be the main reasons attributed to the expansion of crop cultivation in Darito. In Soda, Samaro,
Haralo, and Did mega, food insecurity, a desire to diversify income and recurrent drought were
the major reasons. As specified by the respondents, recurrent drought had caused diminishing
grazing pasture, a decline in livestock holdings, and a state of food insecurity, all leading to an
overall decline in household income. Therefore, in order to obtain food and income security the
pastoralists are engaged in cultivation activities in the relatively wet areas of the rangelands.
Figure 3.6. Drivers behind the expansion of cultivation in the study sites.
Specifically, variable rainfall is a key environmental constraint affecting the pastoral production
system. The key informants specified that over the past 15 years recurrent drought had caused
deterioration of pasture and consequently led to severe livestock mortality. During group
discussions, the pastoralists stated that many households lost their herds through the succession
of extreme droughts between 1983 and 1985 and during the 1990s, when there was starvation.
The livestock mortality caused famine and a decline in per capita household income. Thus, for
pastoralists in this region to improve their wealth, they had to introduce cultivation activities to
diversify their livelihoods. Despite the unreliability of rainfall, rain-fed crops such as haricot

CHAPTER THREE
69
beans, sorghum, maize, teff, and barley, could be produced in the agro-pastoral areas under
specific rainfall conditions in the sub-humid areas and to the lowland wet areas of the rangeland.
3.3.3. Decadal rainfall and the number of farmers who started cultivation
Results show that the rainfall trend in Darito site deviates greatly from the long-term mean with
marked increases and decreases over time (Figure 3.7a). Between 1980 and 1985, recurrent
drought rather than precipitation dominated the area, and rainfall was below the mean. The
comparison between the deviations of the rainfall and the number of farmers who started
cultivation indicates that there is not a statistically significant relationship (p> 0.388).
Nevertheless, there is a general tendency that, in some drought years, the number of famers did
not show any sign of decline and even in the year after rainfall the number of farmers did not
suddenly increase. Although the sampled farmers indicated the exact year they began to cultivate
in relation to rainfall pattern, the increasing variability and unpredictability of rainfall in some
ways have triggered the pastoralists in this region to diversify their livelihoods through crop
cultivation.
Similarly, Figure 3.7b demonstrates rainfall trends in Soda, Samaro, Haralo, and in Did mega.
The area also experienced marked rainfall fluctuations from the long term mean. The correlation
analysis between rainfall and the number of farmers also shows that there is not a statistically
significant relationship (p> 0.521). This is evidenced by an increase in the number of farmers
even in the driest years. Although the agro-pastoralists and the key informants explained that
recurrent droughts intensified the increase in cultivation activities, this analysis cannot conclude
that rainfall trends of the study locations are the sole factor for studying the factors attributed to
the expansion of cultivation because the two indices (rainfall vs. number of farmers) are not
correlated.

CHAPTER THREE
70
(a)
(b)
Figure 3.7. Comparison of the deviation of mean monthly rainfall from the long-term mean
and the number of new farmers engaging in cultivation in Darito (a) and Mega
sites (b).
Source: Rainfall data from Ethiopian Meteorological Agency 2012 and field data.
3.3.4. The implications of cultivation and land management on the rangeland
Prior to cultivation, the farmers across the study sites use the major four farming practices to
prepare their fields (Figure 3.8). Slash and burn is used more in Samaro, Haralo and Did mega,
and to a small extent in Darito. Burning of crop residuals during the preparation of fields is
practiced highly in Did mega and Darito, and only few farmers sowed without clearing. The
techniques used to prepare land for cultivation in these study sites have major concerns regarding
the rangeland. Slush and burn deteriorates vegetation biomass and reduces soil organic carbon

CHAPTER THREE
71
while ploughing contributes to the emissions of greenhouse gas, soil erosions, and land
degradation. The practices reduce the capacity of carbon storage and sequestration benefits in the
rangelands.
Figure 3.8. Land preparation under crop cultivation.
Concerning management practices, there are differences across the study locations. The agro-
pastoralists in Haralo and Did mega sites are engaged in conservation practices such as use of
compost, soil water conservation, terracing, seedling nursery, and water harvesting. In case of
other agro-pastoralists communities in Darito, Soda, and in Samaro, there are little efforts
invested in conservation farming (Figure 3.9). The implications of this are deterioration and
fragmentation of the rangeland.
Figure 3.9. Farming management practices.

CHAPTER THREE
72
3.4. Discussion
3.4.1. Land cover changes between 1985 and 2011
The land cover changes between 1985 and 2011 were analysed in the five study sites, namely
Darito, Soda, Samaro, Haralo, and Did mega. The analysed remotely sensed data detected
considerable changes across the study areas. Specifically, grassland and bushland vegetation in
the central and north-eastern part of Darito had decreased, and this was connected with increases
of cultivation as seen in the 2011 map. The central and eastern portions of the rangeland in
Darito are the areas subjected to land conversion for cultivation because they are characterized
by wet soils along the bottomlands where seasonal water-logging occurs (Figure 3.2b, see also
Figure 3.1). The loss of woodland vegetation along the hill escarpments of Darito has also been
attributed to the expansion of crop cultivation as revealed in the 2011 map. The present findings
are supported by (Haile et al., 2010) who found that the percentage of cultivated land increased
in the Yabelo district of the Borana rangeland between 1960 and 2000 and caused a serious loss
of natural vegetation in the rangeland. A similar loss of woodland vegetation in the Did mega
site is also due to the expansion of cultivation activities (Table 3.3). The implications of
increasing cultivated areas in the rangeland are loss of grassland and bushland as detected in this
study. This is a main concern regarding livestock and pasture because the bottomland grasslands
are dry season grazing reserves and, therefore, converting them into croplands adversely affects
critical grazing resources. The ecological implications of inappropriate farming techniques are
the losses of vegetation biomass (grassland, bushland, and woodlands) and below ground carbon
stocks, consequent, reduce the capacity of the rangeland ecosystems to store and to sequester
carbon.
Apart from cultivation pressure, participants during group discussions explained that harvesting
of bushes and wood trees for charcoal, fuel-wood, fencing, and construction purposes are other
possible causes of vegetation fragmentation in the rangeland. The key informants such as the
development agency officials in the Kebele clarified that expansion of cultivation and clearing of
wood trees have led to increased loss of natural vegetation in the rangeland. The loss of
vegetation such as bushes and wood trees will constrain the supply of fuelwood, fodder, non-
timber forest product, and building materials available to the inhabitants. As it is, the proportion
of woodland vegetation in the rangeland is very low. The loss of woodland vegetation in other

CHAPTER THREE
73
African drylands is a common environmental problem, and it is mainly attributed to the
expansion of cultivation (Wezel & Haigis 2000) and clearing of trees for charcoal and fuel-
wood, in particular the northern rangelands of Ethiopia (Tsegaye et al., 2010). Other changes are
shown by the gains of woodland vegetation in the north-western part of Soda, western Samaro
and in Haralo (Figure 3.3b), and such gains were possible in the mountainous escarpment
because human interactions are limited. Specifically, within the Soda site, the areas that were
dominated by bush vegetation in the 1985 map are now replaced by wood vegetation. This is a
positive change for ecosystem integrity because woodland biomes have a high potential for
above ground biomass storage hence carbon sequestration benefits. In the Haralo site woodland
vegetation has increased to some extent and a wide proportion of the area is bare land.
The percentage of bare land increased significantly (Table 3.3), and this is attributed to the
expansion of cultivated areas and loss of vegetation cover. The increase in bare land is also
linked to past land use and management practices related to grazing (Coppock 1994). A recent
study showed that bare land areas extended adjacent to cultivated land (Figure 3.2b & 3.3b), and
the trend indicates that inappropriate farming techniques attribute to soil erosion and land
degradation. During transect walks with farmers, some portions of the rangeland had already
been degraded and large gully erosion had advanced. The expansion of bare land exposes soil to
erosion, leading to loss of nutrients and soil organic carbon (Guo & Gifford 2002; Lal 2004).
Consequently, the process alters soil carbon storage and sequestration benefits in the rangelands
(Trumper et al., 2008). The increase in bare land due to cultivation pressure in other rangelands
of Africa have also been reported (Neely et al., 2009; Reid et al., 2004) and the authors
advocated that inappropriate land management poses a serious concern to ecosystem integrity
and people’s livelihoods. Exceptional change occurred in the Soda site whereby the percentage
of bare land decreased in the 2011 map, and such changes were attributed to the regeneration of
grasslands and reduction in the area under cultivation.
Moreover, there is a significant increase in the proportion of grassland in Soda, Samaro, Haralo,
and Did mega in the 2011 map (Table 3.3). The recovery of grassland is attributed to the past
interventions of the Southern Rangeland Development Unit (SORDU) project (Coppock 1994).
The establishment of grassland enclosures and grazing cessation has contributed to the

CHAPTER THREE
74
progressive recovering of grasslands. Extensive portions of the rangeland, which were dominated
by bush vegetation in the 1985 map, have been colonized by grasslands in the 2011 map.
Previous studies (Oba et al., 2000; Solomon et al., 2007; Desta & Coppock 2004) showed that
bush encroachment had altered the availability of palatable grassland pasture and animal
mobility. However, concurrent efforts made by the district government to clear bush trees have
contributed to an increase of grasslands and a decrease in the proportion of bush vegetation.
Current evidence suggests that the changes obtained in the grassland are associated with the
implementation of the land rehabilitation program, in particular bush clearing, cessation of
grazing, and creation of grassland enclosures. This is a successful story in the grasslands but
diminishing bushland vegetation has negative effects such as risk of fire and loss of above
ground vegetation biomass. The decrease of bushland put serious constraints on browser animals,
such as goats, sheep, and other game animals, because they feed on bushes. Apart from the
deterioration of fodder, loss of bushland vegetation limits access to fuel-wood, fencing and
building materials, and inhibits harvesting of non-timber forest products, such as those with
medicinal values. In terms of ecosystem services, a loss in bushland reduces the proportion of
above ground vegetation biomass and carbon storage capacity. Other negative consequences
could be soil erosion and possibly losses of soil organic carbon.
Furthermore, a variable rainfall pattern is a major agro-climatic constraint that supports or limits
cropping performance. Specifically, the inhabitants of the Soda site only practice pure
pastoralists and crop cultivation to a limited extent. The comparison of the results of the change
detection with the land ownership in the Soda site indicated that the site had the highest numbers
of people without land from the 1960s to 1999, which differed from other Kebele (Figure 3.5).
Afterward, the number of agro-pastoralists started to increase from 2000 to 2012, and the change
was attributed to the increase of socio-environmental constraints, in particular, aridity conditions
of the area affected by topographical landscape. Nevertheless, the observed trend in the increase
of the number of agro-pastoralists in the Soda site is not comparable to the land cover change.
The analysis managed to capture observable land cover changes, but the numbers of agro-
pastoralists sampled during the survey interviews were consisted of those farmers who started
cultivation around the year 2000 and afterwards. Given the uncertainty of livestock production,
diversification of livelihood with crop production in the study site is inevitable. In the Samaro

CHAPTER THREE
75
site, the area is affected by the topography and it is characterized more by an arid climate than by
precipitation. Such a climatic condition restricts cropping activities compared to other sites such
as Haralo and Did mega, which are located on the lowland plain of Mega. A topographical
difference, as clarified by (Seleshi & Zanke 2004) is one of the key factors that influence the
microclimate in Ethiopia. Other factors that might have contributed to the decrease in cultivated
areas in Samaro could be soil characteristics, which differ across the four study sites. The
comparison of the results of land cover change and cropping trends (Figure 3.5) demonstrate a
corresponding association whereby the number of agro-pastoralists started to decline from 2000
to 2012.
Built up areas also increased in Samaro Kebele (Table 3.4) and this can be explained by the
growth of Mega town due to the influx of immigration and natural increase. In the last category,
the proportion of shrub/grassland vegetation decreased slightly, and those areas which were
characterized by seasonal water-logging were subsequently colonized by grass, dwarf bushes or
herbs. However, in some bottomlands of the Soda and Did mega sites, shrub/grassland
vegetation increased. This is attributed to the accumulation of water-logging during rainy
seasons. The intensity of water flowing to the bottomlands of Did mega is attributed to the
spread of bare land and loss of vegetation cover. Inadequate construction of water breakers
during rainy seasons has also contributed to increase of water-logging in the bottomlands.
The implications of cultivation in the rangeland were analysed by evaluating the practices used
by farmers to prepare and manage their land. Just like in many other African countries, slash and
burn is a widely used practice for the preparation of fields in the study sites (Figure 3.8).
Continuous ploughing without fallow periods reduces the soil’s ability to produce humus and
soil fertility. The consequences of this practice are loss of habitat and species, an increase in air
pollution, and the release of carbon into the atmosphere (Reid et al., 2004). Soil erosion is one of
the significant consequences of this practice in the study areas, and the intensity of erosions
increased in the lowland areas. Figure 3.10 illustrates the effects of cultivation on the
development of gully erosions in the Did mega site. This is attributed to inadequate adoption of
recommended farming techniques such as construction of water breakers, terracing, and the
planting of trees (Figure 3.9). The results provide the insight that unsustainable farming practice

CHAPTER THREE
76
is not a better way of using rangelands. It is, therefore, necessary to improve farming practices in
order to minimize the loss of soil organic carbon and vegetation biomass.
Figure 3.10. Development of gully erosions around cultivated land in Did mega site (photo
November, 2012).
From the above analysis, the changes (positive and negative) in land cover obtained here varied
across the study locations. The greatest change is found as a large increase in the proportion of
bare land in Haralo. The decrease in the proportion of bushland vegetation occurred in all five
sites, and extensive increase in cultivated areas occurred in Darito to a greater proportion than in
the rest of the sites. The results from this study establish a strong indication that increasing
human pressure on land uses and the expansion of cultivation activities in the study sites have
attributed to loss of vegetation biomass, soil erosion, and land degradation.
3.4.2. Drivers contributing to the expansion of cultivation in the rangeland
The analyses have shown that the expansion of cultivation in the studied sites is attributed to
environmental constrains, socio-economic, and demographic factors. Demographic variables
such as family size played a critical role in the study areas. The major role is the provision of a
labour force for different livelihood activities both on and off farms. It appears that most families
with more members in their households owned larger plots of land for cultivation. This is
evidenced by the significant difference between family size and land size (Table 3.6). According

CHAPTER THREE
77
to (Lambin et al., 2003), the immediate factor influencing land use decisions at local level is the
household. This appears to correlate with the situation in this study where the agro-pastoralists
from the entire studied site are engaged in cultivation because they need to create additional
income to support their families. The availability of a labour force in a household has also
necessitated the expansion of cultivation in the studied sites. The association between the
expansion of agricultural land in the semi-arid lands of Yatta sub-county and demographic
variables such as population, has also been elaborated by (Liavoga et al., 2014), and the authors
found a significant association between the indices. Cultivation in the study sites is considered to
be a major livelihood diversification option because incomes derived from selling grains help
families to afford education costs of their children. In our results (Table 3.6), most families with
children in school depend more on crop production because it is a source of income. The
experience across the study locations shows that it is rare to find families with school-going
children that are do not participate in cultivation activities. The situation has led to an increase in
the demand of land for cultivation across the study locations.
The agro-pastoralists interviewed specified that food insecurity was another factor contributing
to the expansion of cultivation. Most agro-pastoralists in the study locations have been in an
extremely vulnerable state of food shortage due to recurrent drought. As explained by the
participants during group discussions, cultivation in the study locations began as far back as the
1960s, but few people were engaged. It was intensified by the worst drought incidents in 1984,
1985, 1992, and 2000 that caused severe livestock mortality and decline in household herds.
According to (Yemane 2004), the occurrence of drought leads the pastoral communities to be
faced with food insecurity due to livestock mortality. Recurrent drought episodes are
increasingly worsening livestock production; the majority of the pastoralists are embracing crop
production in order to cushion themselves against food shocks. The pastoralists, therefore, have
increasingly engaged in crop cultivation in the relatively wet sections of the rangelands (lowland
plain areas) and in the sub-humid areas. Recurrent drought as a reason behind the expansion of
cultivation across the study sites is similar to (Mengistu 1998) who reports other incidences of
droughts in 1991 and 1992 and by (Angassa & Oba 2008) who describes other drought
incidences in the 1970s. According to the authors, variable rainfall and deterioration of livestock
production have caused food shortages in the Borana rangeland, and thus in order to secure food

CHAPTER THREE
78
grains, pastoralists have started crop production in the good years with rainfall. The authors
noted a decline in the percentage of pure pastoralists from 15%, to 8%. Such a decline is also
consistent with (Solomon et al., 2007) who found that 92% of the inhabitants of five peasant
associations in the Borana rangeland were agro-pastoralists who relied on both livestock and
crop production. The increase in agro-pastoralists in the present study is also explained by a
progressive increase in households practicing cultivation from 1960 to 2012 in the Darito, Soda,
and Did mega sites except for a slight decline that was obtained in the Samaro site from 2000 to
2012 (Figure 3.5). The proportion of agro-pastoralists is evident with the increase in the number
of households engaged in crop cultivation from 35% reported by (Coppock 1994) to 87%
reported by (Angassa & Oba 2008). The 92% figure obtained in the present study is also
consistent with the figures obtained by (Solomon et al., 2007; Desta & Coppock 2004) in their
studies.
The need to diversify income at household level is another factor that contributed to the
expansion of cultivation in the study sites. The mean household income obtained in this study
varied across the study sites (Table 3.4), nevertheless, reported amounts were insufficient to
support households’ basic needs. According to the agro-pastoralists, they claimed that their
incomes had been declining due to unreliable livestock production. Although the initial income
before the occurrence of droughts was not captured in this study, the mean incomes revealed
across the study sites provide significant insight into the economic situation of the agro-
pastoralists and its implications on the expansion of cultivation activities. Experiences from other
pastoral areas of eastern African rangelands show that diversification of income through crop
production is the key livelihood option (Campbell et al., 2005). Income generated from crop
production helps the pastoralists to buy food, support their families, and reconstruct their
economies. Specifically, the money generated from selling food grains is used to pay school fees,
pay for health services, begin petty business, and purchase livestock for post-drought recovery. A
similar situation is reported by (Solomon et al., 2007), i.e., that the Borana agro-pastoralists are
increasingly engaging in crop cultivation to rebuild their wealth. The majority of the pastoral
households in the study sites are increasingly embracing crop production in response to the past
devastating droughts that affected their livestock.

CHAPTER THREE
79
Another underlying driver behind the expansion of cultivation as mentioned by the key
informants and also during group discussions is the increase of local and cross-border
immigration that has led to the development of towns like Mega and Yabelo. The growth of
towns has contributed to population growth and hence has led to a higher demand of land for
cultivation. However, due to inadequate census data of population trends across the studied sites,
it was not possible to cross-reference this assertion. Further investigation into this is
recommended. Further evidence of population growth and land conversion in Eastern Africa
rangelands have been described by (Wasonga et al., 2011) for the case of Kajiado rangeland of
Kenya and by (Desta & Coppock 2004) for the Maasai pastoral areas. According to the authors,
the Maasai pastoralists from Tanzania have embraced crop cultivation to complement livestock
production, which seems to be deteriorating over time.
Moreover, verification of the impacts of recurrent drought and the expansion of cultivation
activities were analysed by testing the correlation between rainfall and the number of famers who
started cultivation. Although the rainfall pattern in the study areas fluctuates greatly, there is no
clear statistical mark to validate the influence of rainfall trend on dictating the farmers’
engagement in cultivation activities. The deviation in the rainfall and the fluctuation in the
number of farmers are not statistically significantly correlated. The results are supported by
(Cheung et al., 2008) who found that the rainfall trend in Southern Ethiopia did not show a
significant decline but that the area was characterised by long-term fluctuations. It should be
noted that the rainfall pattern of the study sites fluctuates below and above the average in some
years. It is, therefore, possible that such fluctuation trends and recurrent droughts, as mentioned
by the farmers and demonstrated in Figure 3.7 (a and b), could be the underlying basis for
justifying the expansion of cultivation in wet areas of the rangeland and, on the other hand, it
contributes to the decline in cultivation activities in other sites. According to (Coppock 1994),
12% of the low-lying wet areas of the Borana rangelands can support rain-fed crop production
(teff, sorghum, barley, and haricot beans); this makes the expansion of cultivation across the
study sites possible.
Furthermore, according to the Ethiopian government land policy, land resource is communal,
and it is the property of the federal government. When the key informants were asked about the
CHAPTER THREE
80
land tenure system in Ethiopia, they pointed out that access to land could only be acquired
through leasing, and this is regulated by the Ethiopian government. According to the federal
government of Ethiopia, it issues ‘‘use rights’’ to the farmers to own land for the purpose of
farming and prohibits them from selling land (Crewett et al., 2008). Despite the existing regal
procedures, informally, another possibility used by the agro-pastoralists in the study sites to
acquire land is to purchase a plot of land from relatives. Nevertheless the survey could not
explicitly explore to what extent such a system has attributed to land cover changes across the
Kebele, but it is among the reasons mentioned during interviews. Moreover, the results further
revealed that policy transformation in the 1970s and the intervention of development projects, in
particular water projects, were additional factors leading to land use changes. Policy
transformations such as privatization of the communal rangelands into private enclosures
affected land use and traditional rangeland management and hence expansion of cultivation and
the land cover changes (Angassa & Oba 2008). Despite the fact that cultivation is growing in the
study locations, there are differences across the sites (Figure 3.5), and the differences are
attributed to the heterogeneous nature of the sites, socio-environmental conditions, availability of
draught power (mainly oxen), and variable rainfall. With regard to crops grown in the studied
sites, rainfall and soil are the major agro-climatic factors influencing crop performance.
Specifically, rain-fed crops such as maize, haricot beans, teff, wheat, barley, and sorghum are
preferred because of the suitability of the soil and the climate of the area. Apart from being
sources of food, they are marketable and, therefore, a reliable source of income for households,
and they are also an important source of animal fodder, especially during the dry season.
3.5. Conclusion
In this paper, land cover changes and the reasons behind them have been analysed in five
locations in the Borana rangelands of Southern Ethiopia. Much of the land cover changes differ
spatially across the study sites. The most important changes are the loss in the proportion of
bushland vegetation in all five sites. Also there are progressive increases in grasslands cover in
all sites except Darito. The bare land in the Haralo site is more widely spread than in the rest of
the sites, which is an indication of land degradation in this study. Clearing of vegetation,
harvesting wood trees for numerous uses (charcoal, fuel wood, fencing, and construction), and
the expansion of cultivation activities are instrumental causes of rangeland fragmentation. A
bush clearing program has also contributed to the decline in bushland vegetation. Unwise use of

CHAPTER THREE
81
rangelands can set processes into motion that drive range degradation and lead to a deterioration
of the capacity to store and sequester carbon. Rangelands store carbon as plant biomass and soil
organic carbon, and the largest stock is the soil pool because the ecosystem is characterized by
scant vegetation. Therefore, converting these ecosystem into croplands without due consideration
of their nature potentially undermines their resilience. The land management practices adopted
are not adequate to enhance carbon storage potentials. The adoption of no-till farming, water
harvesting, and soil conservation and the use of compost manure are very crucial in soil
conservation, nutrient restoration, carbon storage, and greenhouse gas mitigation. Conversely,
these practices are only moderately adopted. The trade-offs of converting rangelands into
cropland without appropriate management are a threat, as they lead to vegetation fragmentation,
restriction of livestock mobility, acceleration of soil erosion and loss of soil organic carbon and,
hence, land degradation.
Concerning the drivers behind the expansion of cultivation, interactive factors such as recurrent
drought, diminished grazing pasture, food insecurity, and the need to diversify income, are
possible reasons. A significant association between larger family size and families with school-
going children was the main socio-economic and demographic factor attributed to the expansion
of cultivation across the study sites. Although access to land is issued by the government,
spontaneous encroachment upon rangelands for cultivation purposes remains the critical
challenge. Policy transformations and the introduction of private enclosures in the Borana
rangeland are other underlying causes leading to the expansion of crop cultivation. The findings
of this study have provided a comprehensive insight into the temporal increase in the number
agro-pastoralists, current trends in land cover changes, and their impacts on the ecosystem. The
retrospective analysis of the drivers behind the expansion of cultivation has established site-
specific evidence regarding how environmental, socio-economic, and demographic factors have
concurrently contributed to the expansion of crop cultivation. This information is very crucial for
future management plans and decisions.
Based on the results of our study, the following recommendations are given. There is a need to
incorporate indigenous and scientific information for sustainable rangeland management. There
is a large need for addressing the socio-economic and environmental challenges of the local areas

CHAPTER THREE
82
as part of a solution to the surface problem of the expansion of cultivation in rangelands. This
could be achieved through consistent cooperation of policy makers, local resource users, regional
and international stakeholders as well as NGOs. In future studies, the analysis of the biophysical
changes in the soil quality within cropped areas and that of the natural rangelands is needed. It is
also necessary to further investigate the influences of biophysical and agro-climatic factors on
land use and land cover changes. Analysing vegetation changes using multi-temporal satellite
data is highly recommended. As a last point, the assessment of emissions through land use can
justify the impacts of cultivation on nutrient matter fluxes in rangeland ecosystems.

CHAPTER THREE
83
References
Anderson, A. (1976). Land Use and Land Cover Classification System. Geological Survey Professional Paper 964, Washington, D.C. Angassa, A. & Oba, G. (2008). Herder perception on impacts of range enclosures, crop farming, fire ban and bush encroachment on the rangeland of Borana, Southern Ethiopia. Human Ecology, 36, 201–215. Camill, P. (2010). Global change: An overview. Nature Education Knowledge, 3 (10), 49. Campbell, D.J., Lusch, D.P., Smucker, T.A. & Wangu, E.E. (2005). Multiple methods in the study of driving forces of land use and land cover change: A case study of South East Kajiado district Kenya. Hum. Ecol. 33, 763–794. Cheung, W.H., Senay, G.B. & Singh, A. (2008). Trends and spatial distribution of annual and seasonal rainfall in Ethiopia. Int. J. Climatol. doi: 10.1002/joc.1623. Coppock, D.L. (1994). (Ed.). The Borana Plateau of Southern Ethiopia: Synthesis of pastoral research, development and change, 1980 -91.ILA (International Livestock Centre for Africa), Addis Ababa. Ethiopia, 393. Crewett, W., Bogale, A. & Korf, B. (2008). Land tenure in Ethiopia: Continuity and change, shifting rulers, and the quest for state control. CAPRi Working Paper, 91, 1–22. International Food Policy Research Institute: Washington, DC. http://dx.doi.org/10.2499/CAPRiWP91. Desta, S. & Coppock, D.L. (2004). Pastoralism under pressure: Tracking system change in southern Ethiopia. Human Ecology, 32, (4) 485–486. Ethiopian Mapping Agency. (1992–1993). Topographical maps of Yabelo (1992) and Mega (1993). Addis Ababa, Ethiopia: Ethiopian Mapping Agency. Ethiopian Meteorological Agency. (2012). Recorded rainfall and temperature data of Yabelo and Dire Districts in Borana Rangeland. Addis Ababa, Ethiopia, 1975–2012. Unpublished field data. Flintan, F. (2011). The causes, process and impacts of land fragmentation in the rangelands of Ethiopia, Kenya and Uganda: Regional learning and advocacy programme for vulnerable dryland communities, 1–12. http://www.disasterriskreduction.net/east-central-africa/library/?querystring=reglap (accessed 5 September 2012). Foody, G.M. (2002). Status of land cover classification accuracy assessment remote. Sensing of Environment, 80, 185–201. Garedew, E. (2010). Land Use and Land Cover Dynamics and Rural Livelihood Perspectives in the Semi-Arid Areas of Central Rift Valley of Ethiopia. Doctoral Thesis. Swedish University of Agricultural Sciences: Umeå, Sweden.

CHAPTER THREE
84
Geist, H.J. & Lambin, E.F. (2002) Proximate causes and underlying driving forces of tropical deforestation. Bioscience, 52 (2), 143–150. Guo, L. & Gifford, R. (2002). Soil carbon stocks and land use change: A meta-analysis. Global Change Biol. 8, 345–360. Haile, G., Assen, M. & Ebro, A. (2010). Land use/cover dynamics and its implications since the 1960s in the Borana rangelands of Southern Ethiopia. Livestock Research for Rural Development, 22, 132. http://www.lrrd.org/lrrd22/7/hail22132.htm. Accessed 8 March, 2013. Hein, L. & De Ridder, N. (2006). Desertification in the Sahel: a reinterpretation. Glob. Chang. Biol. 12, 751–758. Homewood, K., Coast, E. & Thompson, M. (2004). In-migrants and exclusion in East African rangelands: Access, tenure and conflict. International African Institute, 74, 567–610. DOI: http://dx.doi.org/10.3366/afr.2004.74.4.567.
Jansen, H.G.P., Pender, J., Damon, A., Wielemaker, W. & Schipper, R. (2006). Policies for sustainable development in the hillside areas of Honduras: a quantitative livelihoods approach. Agricultural Economics, 34, 141–153. http://onlinelibrary.wiley.com/doi/10.1111/j.1574-0864.2006.00114.x/full.
Kaspersen, P.S., Fensholt, R. & Huber, S.A. (2011). Spatiotemporal Analysis of Climatic Drivers for Observed Changes in Sahelian Vegetation Productivity (1982–2007). Int. J. Geophys. 1–14. Lal, R. (2004). Soil carbon sequestration to mitigate climate change. Geoderma, 123, 1–22. Lambin, E.F. & Geist, H.J. (2006). Land-use and Land-cover Change: Local Processes and Global Impacts. IGBP Series. Springer-Verlag, Berlin, Germany, 1–8. Lambin, E.F. & Serneels, S. (2001). Proximate causes of land-use change in Narok District, Kenya: A spatial statistical model. Agriculture, Ecosystems and Environment, 85, 65–81. Lambin, E.F., Geist, H.J. & Lepers, E. (2003). Dynamics of land-use and land cover change in tropical regions. Annu. Rev. Environ. Resour. 28, 205–241. Liavoga, B.A., Kathumo, V.M., Onwonga, R.N., Karuku, G.N. & Onyango, C.M. (2014). Assessment of trends in land cover and crop type change over two decades in Yatta sub county, Kenya. International Journal of Agriculture Forestry and Fisheries, 2(3), 46–52. Lillesand, T.M., Keifer, R.W. & Chipman, J.W. (2008). Remote Sensing and Image Interpretation: Digital Image Interpretation and Analysis, pp. 482–621. Mengistu, A. (1998). The Borana and the Drought: A Rangeland and Livestock Resource Study. Addis Ababa, Ethiopia: Institute of Sustainable Development, 1–79.
CHAPTER THREE
85
Neely, C., Bunning, S. & Wilkes, A. (2009). Review of evidence on drylands pastoral systems and climate change: Implications and opportunities for mitigation and adaptation. Land and Water Discussion Paper 8. (Eds.). FAO, Rome, Italy, 1–33. Oba, G., Post, E., Syvertsen, P.O. & Stenseth, N.C. (2000). Bush cover and range condition assessments in relation to landscape and grazing in southern Ethiopia. Landscape Ecology, 15, 535–546. Pisanelli, A., Chiocchini, F., Cherubini, L. & Lauteri, M. (2012). Combining demographic and land-use dynamics with local communities perceptions for analysing socio-ecological systems: A case study in a mountain area of Italy. iForest, 5, 163–170. http://www.sisef.it/ iforest/contents? id=efor0615-005. Accessed 25 June 2012. Pratt, D.J. & Gwynne, M.D. (1977). Rangeland Management and Ecology in East Africa. London, UK: Hodder and Stoughton. Pratt, D.J., Greenway, P.J. & Gwynne, M.D. (1966). A classification of East Africa rangeland, with an appendix on terminology. Journal of Applied Ecology, 3 (2), 369–383. Reid, R.S., Thornton, P.K., McCrabb, G.J., Kruska, R.L., Atieno, F. & Jones, P.G. (2004). Is it possible to mitigate greenhouse gas emissions in pastoral ecosystems of the tropics. Environ. Dev. Sustain., 6, 91–109. Safriel, U., Adeel, Z., Niemeijer, D., Puigdefabregas, J., White, R.., Lal, R., Wilson, M., Ziedler, J., Prince, S., Archer, E., King, C., Shapiro, B., Wessels, K., Nielsen, T., Portnov B., Reshef, I., Thonell, J., Lachman, E. & McNab, D. (2005). Dry land systems. In R. Hassan; R. Scholes; N. Ash (Eds.). Ecosystems and Human Well-being: Current State and Trends. Washington, DC: World Resource Institute, 625–653. Seleshi, Y. & Zanke, U. (2004). Recent changes in rainfall and rainy days in Ethiopia. International Journal of Climatology, 24, 973–983. doi:10.1002/joc.1052. Solomon, T.B., Snyman, H.A. & Smit, G.N. (2007). Cattle-rangeland management practices and perceptions of pastoralists towards rangeland degradation in the Borana zone of southern Ethiopia. Journal of Environmental Management, 82, 481–494. Tache, B. & Oba, G. (2010). Is poverty driving Borana herder in southern Ethiopia to crop cultivation? Human Ecology, 38, 639–649. Tefera, S., Snyman, H.A. & Smit, G.N. (2007). Rangeland dynamics in southern Ethiopia: (1) botanical composition of grasses and soil characteristics in relation to land-use and distance from water in semi-arid Borana rangelands. Journal of Environmental Management, 85, 429–442. Tolera, A. & Abebe, A. (2007). Livestock production in pastoral and agro-pastoral production systems of southern Ethiopia. Livestock Research for Rural Development, 19, 177.

CHAPTER THREE
86
Trumper, K., Ravilious, C. & Dickson, B.A. (2008). Carbon in drylands: Desertification, Climate Change and Carbon Finance. A UNEP-UNDP-UNCCD. Technical Note for Discussions at CRIC 7, Istanbul, Turkey, November, pp. 2–12. Tsegaye, D., Moe, S.R., Vedeld, P. & Aynekulu, E. (2010). Land-use/cover dynamics in Northern Afar rangelands, Ethiopia. Agriculture, Ecosystems and Environment, 139, 174–180. Turner, B.L. (2002). Toward integrated land-change science: Advances in 1.5 decades of sustained international research on land-use and land-cover change. In W. Steffen, J. Jäger, D. J. Carson, & C. Bradshaw (Eds.), Challenges of a Changing Earth. Springer, Berlin, Germany, 2002, 21–26. Wasonga, V.O., Nyariki, D.M. & Ngugi, R.K. (2011). Assessing socio-ecological dynamics using local knowledge in the semi-arid lowlands of Baringo districts, Kenya. Environmental Research Journal, 5, 11–17. Wessels, K.J., Prince, S.D., Malherbe, J., Small, J., Frost, P.E. & VanZyl, D. (2007). Can human-induced land degradation be distinguished from the effects of rainfall variability? A case study in South Africa. J. Arid Environ. 68, 271–297. Wezel, A. & Haigis, J. (2000). Farmers’ perception of vegetation changes in semi-arid Niger. Land Degrad. Dev. 11, 523–534. White, R.P. & Wanasselt, W. (2000). Grasslands in Pieces: Modification and Conversion Take a Toll. World Resource Institute, 1–4. WRI. (2003). Drylands, people, and ecosystem goods and services: A Web-based geospatial analysis. In White, R.P. & Nackoney, J. (Eds.), World Resources Institute, 1–58. http://www.wro.org accessed 29 December, 2011.
Ye, Y., Wu, Q., Zhexue Huang, J., Ng, M.K. & Li, X. (2013). Stratified sampling for feature subspace selection in random forests for high dimensional data. Pattern Recognition, 46, 769–787. doi:10.1016/j.patcog.2012.09.005.
Yemane, B. (2004). Drought and famine in the pastoral areas of Ethiopia. Oxfam GB. Pastoralist Forum Ethiopia, Addis Ababa, Ethiopia, Admassu, Y. (Ed), 117–134.

CHAPTER FOUR
87
4. Determinants of cultivation expansion at Darito agro-pastoral rangeland in Borana
Ethiopia using GPS/GIS and multiple linear regression modelling
Abstract: Changes in land use for cultivation hold crucial concern on landscapes in rangelands. We integrated global positioning system (GPS) data, geographical information system (GIS), interview information, and multiple linear regression model to analyse these changes at local scale landscape. This study aimed: (a) to map spatial-temporal patterns of cultivated fields acquired by farmers based on interviews with farmers from 1984 – 2014 and GPS mapping; (b) to analyse the associations between cultivation expansion and soil and rainfall, and (c) to model the influence of elevation, slope and distance from river valley on cultivation expansion. We used surface and overlay analyses of ArcGIS 10.2 to link cultivation pattern and biophysical conditions, statistical test checked the significances, and multiple linear regression model for predictions. Cultivation has been increased at a magnitude of 6.9±5.452 hectares (ha) per annual by 54 farmers from 1984 to 2014, and the average farm size per household was 2.01±1.208 ha. Cultivation gravitates on ‘chromic cambisols’, at a slope of < 5º and rainfall of 900 to 1000 mm. Elevation and slope are significant predictors in explaining land suitability for cultivation extension than distance from the dry-river valley. Cultivation into rangelands affected low-lying grasslands and dry-season grazing reserves. The results inform policy makers and rangeland managers in identifying landscape prone to degradation that should be considered to improve management. GPS/GIS applications and statistical model were robust in the analysing of land use changes at local scale landscapes. In future, integrating spatial information with other higher resolution data would increase the diagnostic strength of this combination of methods.
4.1. Introduction
Land use change for cultivation expansion hold crucial concern on landscapes changes in
rangelands. Therefore, examining the trends and conditions influencing cultivation expansion
from land users is very crucial for supporting policy formulation and sustainable landscape
management. The humid rangelands of Africa are considered mainly susceptible to degradation
due to increasing cultivation activity (White and Wanasselt 2000; FAO 2004; Brink et al., 2014).
The Food and Agriculture Organization of the United Nations (FAO) (2011) indicated that
expansion of cultivation exacerbate vegetation loss, fragmentation, soil erosion and land
degradation because the nature of rangeland ecosystems is characterised by sparse vegetation
(Kiptoo & Mirzabaev 2014). Cultivation modify the natural landscapes and it is one driver of
global change (Turner 2003; Lambin and Meyfroidt 2010; Steffen et al., 2011). Studies from
tropical ecosystems have shown that the cultivation expansion have impacted biodiversity and
cause of land degradation (Geist & Lambin 2002; Lambin et al., 2003; Lambin and Meyfroidt
2011). Therefore, locating and mapping spatial and temporal trends of cultivation into rangelands

CHAPTER FOUR
88
and analysing the bio-geo-physical conditions influencing the expansion can provide valuable
information for landscape mosaic, monitor and predict cultivation impacts on ecosystem. In
Eastern African rangelands, a previous study (Coppock 1994) showed that the numbers of small
scale farmers has been increasing in the Darito agro-pastoral community of the Borana in
Southern Ethiopia. The inhabitants are increasingly engaging in cultivation to cope against
economic hardships (Tache and Oba 2010), and much land in the humid areas is being taken into
cultivation. Higher resolution information about the changes in land cover has been recently
established (Haile et al., 2010; Elias et al., 2015); however, the geo-bio-physical conditions
which appear to have great influence on cultivation have not been analysed. Cultivation into
rangelands has short to long term effects on landscapes and ecosystem functions (Spottiswoode
et al., 2009). Therefore, it is imperative to assess the spatial-temporal shift in land use for
cultivation. Apart from remote sensing technology and its potential for detecting land use change
at various spectral, spatial and temporal resolutions (Ruiz-Gallardo et al., 2004; FAO 2010),
changes at local landscapes are inefficiently detected in heterogeneous areas. The uncertainty
such as sensor noise and degradation, calibration errors, scaling issues (Targesson et al., 2014),
anisotropic properties of the land surface (Per et al., 2007; Proud et al., 2014), and lack of
adequate field information about land use dynamics are amongst the challenges (Mbow et al.,
2015).
Land use changes is selective in a manner that decisions made by farmers to use a certain area of
land for cultivation is influenced by socio-economic and policy systems (Cak et al., 2015), and
geo-bio-physical conditions of a particular area. To understand the connection between
cultivation expansion in humid rangelands and biophysical conditions, we integrated GPS spatial
data and map layers into GIS for surface analyses, and a multiple linear regression model was
generated to predict cultivation patterns. GPS and GIS are useful in facilitating planning,
monitoring and rehabilitation of a landscape at a local level (Lin-yi et al., 2001; Wang et al.,
2005), and grazing management. Trung et al. (2006) demonstrated how GPS and GIS can
facilitate land use planning in the Coastal Mekong Delta of Vietnam. Rutter (2007) combined
GPS data and GIS for vegetation mapping and Walsh et al. (2008) integrated GPS data with
Hyperion satellite data in assessing reforestation patterns in the North Ecuadorian Amazon.
Buerkert and Schlecht (2009) used GPS collars to monitor goats’ grazing itineraries on Hajar

CHAPTER FOUR
89
Mountain range in Northern Oman. Apart from those studies, (Olson 1994) combined socio-
economic surveys, rainfall, and soil data into GIS to analyse the causes of land degradation in the
Gokongoro region of Rwanda. A recent study by Castaño et al. (2012) quantified ground water
withdrawer using GIS applications. In addition to GPS and GIS applications, introducing
modelling approaches are significant for understanding land cover change process (Were et al.,
2014). For instance, Hyandye et al. (2015) combined GIS and logit regression model to analyse
land use-land cover changes and distribution in Usangu catchment in Tanzania. Beyene (2016)
used logistic model to predict the determinants of land use change and management in agro-
pastoral herders in Eastern Ethiopia. Besides these studies, our study aim to map cultivation shift
from land users at Darito agro-pastoral area and to determine the role of geo-bio-physical
settings such as elevation, soil and distance from dry-river catchment in influencing cultivation
expansion. Certainly, climatic factors are one of the limiting factors that can impact crop
production in semi-arid, dry-sub humid and humid areas. However, farmers have their own
criteria to make decision on land suitability for cultivation.
The objective of this study was to demarcate the retrospective spatial and temporal trends in
cultivation expansion from farmers at the Darito in Borana rangeland. The specific objectives
were; (a) to locate spatial-temporal patterns of cultivated fields acquired by farmers based on
interviews with farmers from 1984 – 2014 and GPS mapping; (b) to analyse the associations
between cultivation expansion and soil and rainfall patterns, and (c) to determine the influence of
elevation, slope and distance from dry-river on cultivation expansion using multiple linear
regression model. This article demonstrates in what ways GPS spatial information and map
layers integrated into GIS can facilitate locating cultivation pattern at local level landscape
resource users, while a multiple linear regression model helped in predicting the influence of
biophysical conditions on land use changes in the rangelands. Understanding this pattern from
societal level is very crucial in supporting policy recommendation concerning sustainable
resource use and landscape management in rangeland ecosystems.
4.2. Materials and Methods
4.2.1. Study area
The study area is located at 4°43ˈ30̎ N & 38°10ˈ0̎ E and 4°49ˈ0̎ N & 38°14ˈ0̎ E of zone 37N in
the Darito of Yabelo District in Oromiya region, Southern Ethiopia (Figure 4.1). The study site

CHAPTER FOUR
90
covers 221.19 km² with an elevation range from 1116 to 2232 metre above sea level (m.s.a.l).
The area is characterised by a bimodal rainfall distribution with a long rainy season from March
to May and short rainy season from October to December (Mengistu 1998). Annual rainfall
varies from 200 mm to 700 mm with an average of 543.50±286.61 mm for the years 1984 to
2012 (Figure 4.3). Mean annual temperature varies from 19°C to 24°C, with an average decrease
of 1°C for every 200 m.a.s.l (Coppock 1994). Agriculture in the area is characterised by mixed
farming (crops and livestock) with the cultivation of teff, barley, wheat, sorghum, maize, haricot
beans, and the keeping of cattle, sheep, goats and camels. The study was done in the framework
of a larger collaborative research project on “livelihood diversifying potential of livestock based
carbon sequestration options in pastoral and agro-pastoral systems” and within the study area of
that larger project.
Figure 4.1. Location of the study area, elevation and rainfall zones.
4.2.2. Data collected
The study integrated spatial data on the location of crop fields with information from field
surveys and interviews with farmers’ on their land use history. Map layers of rainfall, soil cover
classes, river drainage and a Digital Elevation Model (DEM) at a resolution of 30 m were
obtained from Ethiopian Meteorological Agency (EMA 2014) and Ethiopian Mapping Agency
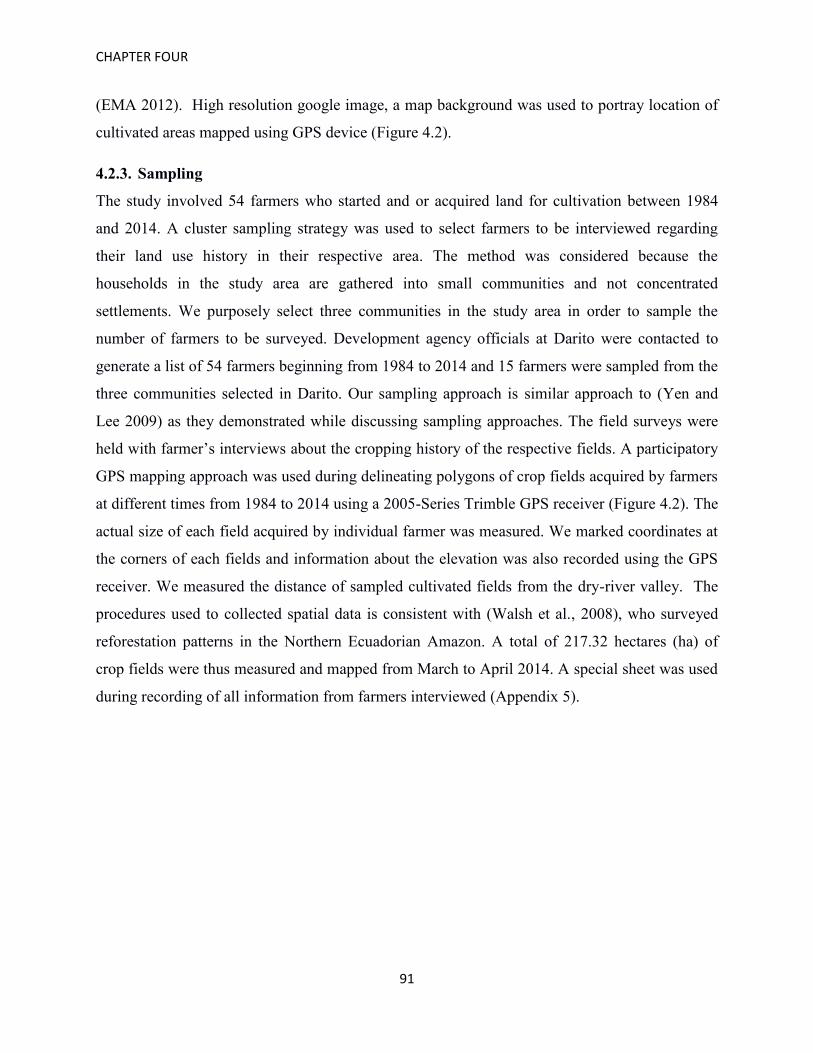
CHAPTER FOUR
91
(EMA 2012). High resolution google image, a map background was used to portray location of
cultivated areas mapped using GPS device (Figure 4.2).
4.2.3. Sampling
The study involved 54 farmers who started and or acquired land for cultivation between 1984
and 2014. A cluster sampling strategy was used to select farmers to be interviewed regarding
their land use history in their respective area. The method was considered because the
households in the study area are gathered into small communities and not concentrated
settlements. We purposely select three communities in the study area in order to sample the
number of farmers to be surveyed. Development agency officials at Darito were contacted to
generate a list of 54 farmers beginning from 1984 to 2014 and 15 farmers were sampled from the
three communities selected in Darito. Our sampling approach is similar approach to (Yen and
Lee 2009) as they demonstrated while discussing sampling approaches. The field surveys were
held with farmer’s interviews about the cropping history of the respective fields. A participatory
GPS mapping approach was used during delineating polygons of crop fields acquired by farmers
at different times from 1984 to 2014 using a 2005-Series Trimble GPS receiver (Figure 4.2). The
actual size of each field acquired by individual farmer was measured. We marked coordinates at
the corners of each fields and information about the elevation was also recorded using the GPS
receiver. We measured the distance of sampled cultivated fields from the dry-river valley. The
procedures used to collected spatial data is consistent with (Walsh et al., 2008), who surveyed
reforestation patterns in the Northern Ecuadorian Amazon. A total of 217.32 hectares (ha) of
crop fields were thus measured and mapped from March to April 2014. A special sheet was used
during recording of all information from farmers interviewed (Appendix 5).
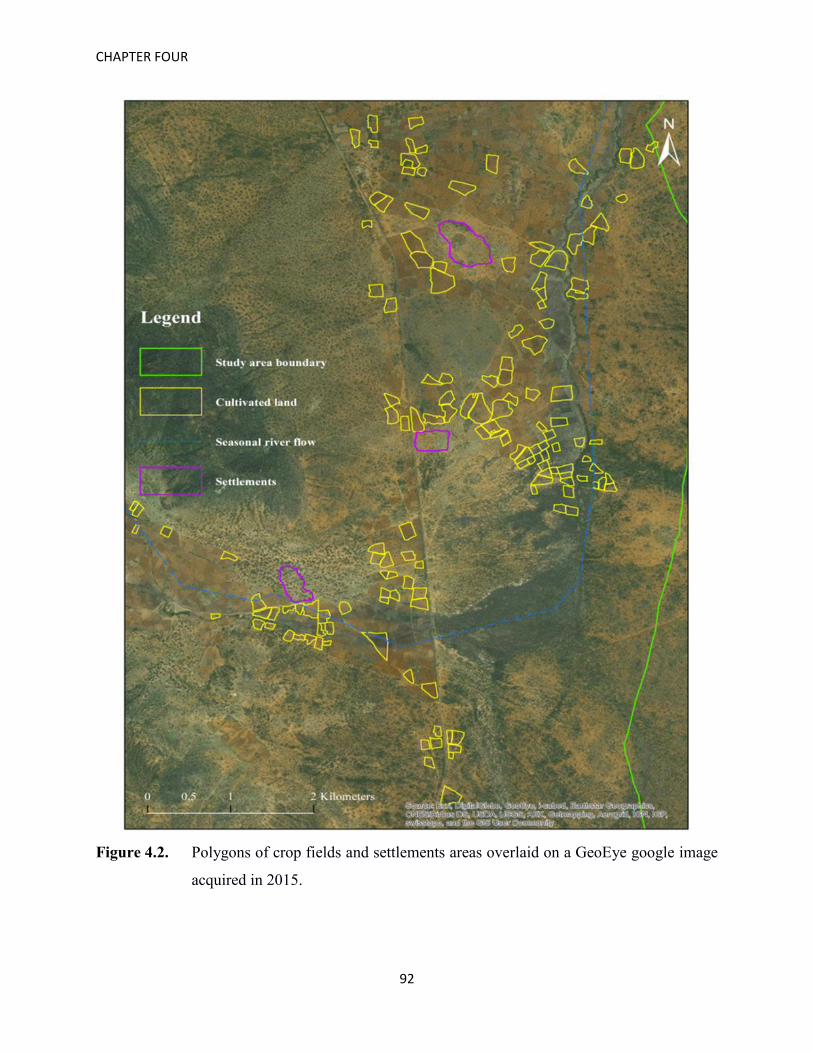
CHAPTER FOUR
92
Figure 4.2. Polygons of crop fields and settlements areas overlaid on a GeoEye google image
acquired in 2015.

CHAPTER FOUR
93
4.2.4. Analyses
4.2.4.1. Spatial analyses
Pre-processing steps involved projection of GPS data (points and polygons) using Trimble®
GPS pathfinder office software V 4.20 (http://www.trimblesupport.com/). The standard storage
(SSF) data format generated with the GPS receiver was converted to ESRI shape files (shp) for
further analyses. Digital Elevation Model (DEM) raster data 30x30 metre and all other data were
projected onto World Geodetic System 84, UTM zone 37N specific for Ethiopia. Spatial
analyses were done using ArcMap10.2© (Environmental Systems Research Institute, Redlands,
CA) and QGIS 2.8.1 and QGIS 2.8.1(http://www.qgis.org/) spatial operations. The first
processing step was to classify the polygons of crop fields mapped into seven clusters based on
the year acquired (Figure 4.4). This was purposely done in order to illustrate spatio-temporal
expansion of cultivation activities, and to define the years when new land was taken into
cultivation by the farmers. Elevation and slope were computed from the DEM using surface
analysis operations of ArcGIS 10.2. The slope was categorised as: flat areas (< 5º), moderate to
gentle slopes (5 – 15º) and steep slopes (> 15º). We also calculate the slope of each field
sampled. The spatial analyses used in this study are consistent with (Li et al., 2013), who
analysed land use change and its relationship with topographic factors in the Jing river catchment
on the Loess Plateau of China. In this study, elevation, slope and distance from the river are the
useful predictors in the influencing land use change for cultivation. To link the influence of
cultivation expansion, we also used soil and rainfall map layers for overlaying analyses. In
addition, we used our own classified land cover maps of year 2011 and integrated with the
polygons of cultivated fields sampled using overlaying functions of ArcGIS 10.2. We also linked
cultivation areas expansion and the land cover type’s characteristics.
4.2.4.2. Statistical analyses
Descriptive statistics using frequency counts were computed to show the variations in the
proportion of land taken into cultivation over the study period from 1984 to 2014. A cumulated
analysis was computed to illustrate temporal trend in increment of the land areas taken into
cultivation from 1984 to 2014. We calculated annual average increment in farm size taken into
cultivation by 54 farmers sampled, and the average farm size per household. Total annual rainfall
was computed from daily rainfall records (EMA 2014), to demonstrate the variations in rainfall

CHAPTER FOUR
94
of the study area. To demonstrate the association between fluctuations in land area taken into
cultivation and rainfall of the study areas, the Pearson’s correlation coefficient of the SPSS
Statistics (IBM SPSS Statistics V16) was used for the test. Scatterplots were generated to
illustrate the association between cultivated land acquired in relation to the elevation and the
association between ages of land acquired for cultivation and elevation.
4.2.4.3. Multiple linear regression model
A multiple linear regression model was generated using SPSS to test the extent to which the
independent biophysical variables elevation, slope and distance from dry-river valley influence
farmer’s decision to take a specific area of land for cultivation. The decision “for” the suitability
of a specific piece of land for cultivation is the dependent variable. We assumed that, given the
bio-geo-physical conditions in the study area, a part of this suitability might be explained by its
slope, its elevation and its distance to the seasonal valley. Rainfall and soil type could not be
included as all fields in the sample lay in the same rainfall zone (900 – 1000) and had the same
soil type (chromic cambisols). The model used has the following equation
𝑦 = a + b1x1 + b2x2 + b3x3
where y is the dependent variable (perceived suitability for cultivation), a is the intercept and b1
to b3 are the coefficients which show the magnitude of the influence of the factors x1 = elevation
in metres above sea level (range in sample 1548 – 1693 m.a.s.l.), x2 = slope in degrees (range 0-
38.862), x3 = distance to rivers in km (range 0.028-2.839).
4.3. Results
4.3.1. Farm size distribution and the association with rainfall at Darito
In total 217.32 hectares (ha) of cultivated crop fields were measured, and the average farm size
per farmer is 2.01±1.208 ha. There were increasing numbers of small < 1 (21.5%), medium 1–
2.9 (63.5%) and large > 3 (15.0%) ha of cultivated fields in the Darito area from 1984 to 2014. In
some years results showed that the land area acquired into cultivation increased but in some
years the size of new land acquired was below the average (Figure 4.3). In the years 2004 and
2008 the land area acquired for cultivation was marked higher than in other years. We tested the
associations between rainfall and the land area taken into cultivation by news farmers over the

CHAPTER FOUR
95
study period. We founded that total annual rainfall shows fluctuation but such trend was not
significantly correlated with the acquisition of new land for cultivation by the 54 farmers.
Figure 4.3. Land area taken into cultivation from 1984 to 2014 by farmers in Darito, Borana,
Ethiopia, and total annual rainfall: N = 54.
4.3.2. Spatial pattern in cultivation expansion
The expansion of cultivation in Darito was illustrated by mapping the land plots acquired by
farmers over various years from 1984 to 2014 (Figure 4.4). The results show that beginning from
1984 to 1993 there was little cultivation activity. However, from 1994 to 2014 more new land
was acquired for cultivation as shown with dark green polygons of crop fields (Figure 4.4). The
majority of the cultivated fields sampled are located in the 900-1000 mm rainfall zone North of
Darito (cf. rain map Figure 4.1). The direction of land cover change for cultivation is moving
toward the East of Darito. This pattern is explained by the reasons that the Eastern Darito is
characterised by seasonally water-logged soils which have the capacity to store moisture and the
soil is rich with alluvial deposits ‘chromic cambisols’ (Figure 4.4). Six soil classes occur in
Darito: chromic cambisols, chromic luvisols, eutric cambisols, eutric fluvisols, eutric nitisols,
and orthic luvisols (cf. soil map Figure 4.4). Each soil class has properties supporting or limiting
agriculture. In particular, ‘chromic cambisols’ are important for growing crops as they are
composed of medium and fine- textured materials like alluvial, colluvial and aeolian deposits. As
shown on soil map (Figure 4.4), a large proportion of the low-lying area of Eastern Darito is
covered with chromic cambisols.
CHAPTER FOUR
96
Figure 4.4. Spatial and temporal pattern of cultivation expansion at Darito, Borana, Ethiopia:
N = 108 fields.
Farmers’ knowledge and experience on land uses explained that the ‘chromic cambisols’ have
great potential to support rain-fed crops like sorghum, barley, teff, haricot beans, wheat, and
maize. According to our results all mapped crop fields in this study were located on ‘chromic
cambisols’. The Darito farmers explained that food crops such as sorghum and maize could be

CHAPTER FOUR
97
grown on chromic luvisols despite a deficit in nutrients. At a higher resolution scene much of the
land under cultivation dominates on the Eastern Darito while a slight expansion can also be seen
on the Northern part dominated by soil types such as eutric fluvisols, chromic luvisols and eutric
nitisols, and eutric cambisols and those soils types are considered not very suitable for
cultivation (Figure 4.5). Other landscape is dominated by woodland, bushland or mixed
grassland and other vegetation communities. A wide portion of the landscapes dominated by
grassland that is mostly converted into cultivated land.
Figure 4.5. Land cover of year 2011 and the spatial distribution of cultivated areas in relation
to soil types.
The overall trend of the area of rangeland taken into cultivation by the 54 farmers is shown in
(Figure 4.6), for 5 year intervals. The trend demonstrates a steady increase of cultivation from
1984 to 2014 that stands at 217.32 ha. The annual average land area (ha) taken into cultivation
by the 54 farmers was 6.9±5.452 ha over the last 30 years.

CHAPTER FOUR
98
Figure 4.6. Area taken into cultivation from 1984 to 2014 and cumulated increase of
agricultural area by 54 farmers in Darito, Borana, Ethiopia.
4.3.3. The influence of elevation, soil and distance to the river valley on cultivation
expansion
Elevation and slope were significant predictors in determining suitability of land for cultivation
whilst distance to the river was not (cf. Table 4.1). However, though significant the overall
explanatory power of slope and elevation is low, given the R2 of 0.154. This suggests that other
variables are much more important in deciding suitability of land for cropping and hence
selecting new land for cultivation. Other variables such as distance from settlement and density
of wood vegetation cover and hence necessity of bush clearing could be more explanatory but
could not be investigated in this study.
Table 4.1. Determinant variables influencing cultivation expansion: N = 108, R2 = 0.154, F
= 6.313, p= 0.001.
Cultivated land Coefficient Robust Std. Err. p
Constant 18.490 5.247 .001*
Elevation .-0.11 .003 .001*
Slope .372 .134 .006*
Distance from river .049 .134 .709
The majority (87%) of cultivated fields (< 3 and > 3 ha) are found between 1548 and 1600
m.a.s.l (Figure 4.7a). As the elevation increase up to 1640 – 1693 m, few (13%) fields are found

CHAPTER FOUR
99
in upper areas. In most upper areas the biophysical condition favours wood forest, bush
vegetation, grass and herbs. The association between age of the field under cultivation and the
elevation was not statistically significant. The majority (87%) of old and (13%) of younger fields
are located within 1548 and 1620 m.a.s.l (Figure 4.7b). All fields younger than 10 years are at an
elevation of below 1620 m.s.a.l. The results indicate that cultivation activities gravitate on low-
lying areas.
(a)
(b)
Figure 4.7. Association between cultivated land area and elevation (a), and age under
cultivation and elevation (b) in Darito, Borana, Ethiopia (1984 – 2014), N = 108
for 54 farmers.

CHAPTER FOUR
100
4.3.4. The slope of the study area and cultivation potentialities
The slope was calculated for the entire study area. The mean slope is 3.020º±5.159º and the
maximum is 38.862º. During 1984 – 2014, much cultivation activities concentrate within the
low-lying areas on a slope 0 – 5º (Figure 4.8). Areas with slope of 5 – 15º, no cultivation
activities were recorded albeit there farming activities that we did not sample as presented at
higher resolution scene (Figure 4.5). Areas with a slope > 15º is mainly dominated with wood
forest and bush vegetation on upper areas. Cultivation activities on low-lying areas are widely
extensive because grassland areas are easily to be converted into croplands than woody or bushes
areas (c.f. Figure 4.5, land cover types).
Figure 4.8. Location of crop fields and slope in Darito, Borana, Ethiopia: N = 108.
4.4. Discussion
This study demonstrated the potential of geospatial information and GIS techniques in analysing
land use changes and cultivation expansion. The aim of this study was to explore and
demonstrate the effectiveness of the method in understanding land use change process at local
scale landscapes— in this case land users. The approach used has potential in tracing the extent

CHAPTER FOUR
101
to which individual land users have been acquiring land for cultivation at Darito. This kind of
information is hardly being captured using remote sensing change detection alone. For example,
previous studies (Foody 2003; Tsegaye et al., 2010; Egeru et al., 2014; Liavoga et al., 2014; Kou
et al., 2015) have demonstrated the benefits of the remote sensing change method in monitoring
land cover changes. Rendering to the method used, the study mapped crop fields acquired by
farmers at various times and recorded the respective land use history to ascertain spatial shift of
cultivation activities. This information is very potential in landscape management and
understanding how land users transform natural landscapes into agricultural land, identifying
landscapes prone to land conversion, degradation status and in designing strategies to rehabilitate
degraded areas.
As shown in our findings the proportion of cultivated land increased in the years (Figure 4.3),
and there were also variations in the sizes of farms such as smaller (< 1 ha), medium (1– 2.9 ha)
and large (> 3 ha). These disparities could be compared to the international standard such as the
FAO classification criteria (FAO 2014), i.e., smaller farms ranging from (0.5 to 1 ha), slightly
larger farms (1 and 2 ha) and (2 to 5 ha) per household. By understanding the actual sizes of
farms measured we linked the location of cultivation land with elevation of the study area which
is very crucial in understanding the influence of elevation and its relation to the land area of
rangeland taken into cultivation. Adoption of this approach is consistence with Lin-yi et al.
(2001), who used GPS data to analyse land cover change at country-level in Dehui County Jilin
province. The study findings further provided illustration on the direction of increasing
cultivation activities in the rangeland. Although cultivation was practised adjacent to settlement
areas there were temporal expansion of new cultivated land far away from housing areas. This
however, was possible due to the existence of dry-riverine flow which seasonally cumulates
alluvium deposit and moist soils that made cultivation possible in relatively low-lying areas of
central and eastern part of Darito (Figure 4.4).
The implication of the increased cultivation is deterioration of grassland which is mostly
converted into croplands (Figure 4.5). By ascertaining the spatial shift in cultivation pattern in
the area, the study findings inform land planners and rangeland managers on the effects of
cultivation expansion that may inhibit the capacity of the rangeland to support ecosystem
functions and livestock pasture. Increasing cultivation into low-lying areas of the rangelands

CHAPTER FOUR
102
would jeopardize critical grazing resources and livestock watering area particularly during the
dry season (Wario et al., 2015). This is an important input for decision making patterning
landscape conservation, resource use and sustainable rangeland management. Temporary,
between 1984 and 2014, the areas used for cultivation varied but cumulatively increased over the
past 30 years (Figure 4.3). The obtained trend with an annual average increment of 6.9±5.452 ha
for 54 farmers implying that areas of rangelands are increasingly being converted into croplands.
For example, previous studies (Solomon et al., 2007; Elias et al., 2015) founded that about 92%
of the inhabitants were participating into cultivation.
The study also showed that spatio-temporal expansion of cultivation is largely influenced by soil
type. Most cultivation activities gravitate within ‘chromic cambisols’ (Figure 4.4). Other soil
types such as ‘chromic luvisols’ could support some crops production while areas dominated by
orthic luvisols, eutric nitisols and eutric cambisols composed of natural vegetation and they were
identified by farmers as not suitable for cultivation activities. The information about soil types
and cultivation pattern obtained in this study inform land planners about the influence of soil in
influencing land conversion and predicting the rate of land use changes in the study area. In
some points thereafter, despite that rainfall is the main determinant variable for supporting
agriculture, the findings could not find significant association between rainfall and fluctuations
in land used for cultivation. Although Olson (1994) demonstrated that environmental conditions
such as soil type, texture, organic matter content, rainfall were major determinants variables in
predicting land degradation in the Gokongoro region of Rwanda, our results are in contrast with
a previous study.
Elevation and slope were found significant variables in determining the perceived suitability of
land for cultivation (Table 4.1); however, the model comprising just three variables had low
explanatory power, which suggests other more decisive variables. The majority of fields in our
sample were located adjacent to the river valley falling within 1548 to 1600 metres (Figure 4.7)
and within a slope of 0 – 5º (Figure 4.8). The influence of slope on cultivation as obtained in this
study is comparable to the FAO (2007) descriptions that land with slopes 0 – 8º as not a
constraint, 16 – 30º moderately constrains and greater than 30º severely constrain agricultural
activities. Knowing the variables that would explain farmers’ decision for suitability of land for
cultivation could be useful in predicting the direction of cropland expansion into rangeland.

CHAPTER FOUR
103
Particularly if such variables could be retrieved at low cost using reliable remote sensing tools
that would not require ground truthing. Density of woody vegetation, which necessitates hard
labour for bush clearing before cultivation, could be another decisive factor that might be
assessed from crown cover from RS images. However, land-use change in rangelands towards
cultivation is likely to be induced by a host of social, political and economic variables, which
could not be assessed during this study.
The study generated ground based evidence about cultivation pattern into rangelands and it
demonstrated the implications of conversion on low-lying grassland areas, natural watersheds
and dry-season grazing resources. The study demonstrated a robust method in revising land use
change process at local scale landscapes and geo-bio-physical influence on land use changes as
discussed. The classification of the polygons from crop fields provided a broader understanding
about the spatial-temporal distribution of cultivation activities. Through this approach, we
mapped land areas converted into farmlands in a time series. The database generated can be
integrated with remote sensing data to monitor the seasonal variation in biomass in cultivated
land using phenological developmental changes between croplands and natural rangeland
vegetation. The integration of GPS spatial data and GIS techniques was efficient in land cover
change studies on a small scale landscapes especially when cultivation activities extend towards
marginal or fragile areas, e.g. woodlands and grassland.
4.5. Conclusion
The study showed how land use changes at local scale landscapes could be retrospectively
delineated using GPS spatial data integrated into GIS. By overlaying the polygons of crop fields
onto thematic map layers the study linked the expansion of cropland to factors such as soil types,
dry-river flow and rainfall. The analysis permitted to identify the direction and trends towards
low-lying areas which favours cultivation and the associated impacts on grasslands. This
information is significant for policy recommendation pertaining rangeland management.
Multiple linear regression model facilitated to explain the influence of elevation and slope in
predicting cultivation pattern. Such information is crucial for planning landscape conservation
strategies and estimating the rate of increase in agricultural land for a given population. By
locating cultivated fields, the study established digital sampling sites that could be used for
monitoring crop stress, estimating crop yield per hectare, and estimation of the rate of increase in

CHAPTER FOUR
104
croplands in the natural rangelands. Being cross sectional in nature, the study could not map
fields that were taken into cultivation but then abandoned again in the past, an omission that
should be built into future interview approaches. We conclude that this mixed method approach
can be applied in different agro-ecological zones on studies of land use and land cover changes
but also increasing the sample size and inclusion of other variables in modelling could be best
choices in predicting of cultivation expansion and the resulting land use change in rangelands.
Integrating other higher resolution remote sensing data would increase the diagnostic strength of
this combination of methods.

CHAPTER FOUR
105
References
Beyene, F. (2016). Land use change and determinants of land management: Experience of pastoral and agro-pastoral herders in eastern Ethiopia. Journal of Arid Environments, 125, 56–63. doi:10.1016/j.jaridenv.2015.10.001.
Brink, A.B., Bodart, C., Brodsky, L., Defourney, P., Ernst, C., Donney, F., Lupi, A. & Tuckova K. (2014). Anthropogenic pressure in East Africa—Monitoring 20 years of land cover changes by means of medium resolution satellite data. International Journal of Applied Earth Observation and Geoinformation, 28, 60–69. doi:10.1016/j.jag.2013.11.006.
Buerkert, A. & Schlecht, E. (2009). Performance of three GPS collars to monitor goats’ grazing itineraries on mountain pastures. Computers and Electronics in Agriculture, 65(1), 85–92. doi:10.1016/j.compag.2008.07.010.
Cak, A.D., Moran, E.F., Figueiredo, R.O., Lu, D., Li G. & Hetrick, S. (2015). Urbanization and small household agricultural land use choices in the Brazilian Amazon and the role for the water chemistry of small streams, Journal of Land Use Science, 1–19. doi: 10.1080/1747423X.2015.1047909.
Castaño, S., Sanz, D. & Alday José Gómez-Alday, J. (2012) Remote Sensing and GIS Tools for the Groundwater Withdrawals Quantification. Journal of Agricultural Science and Applications, 01(01), 33–36. doi:10.14511/jasa.2012.010106.
Coppock, D.L. (1994). The Borana Plateau of Southern Ethiopia: The Borana Plateau of Southern Ethiopia: Synthesis of pastoral research, development and Change 1980-91. Addis Ababa, Ethiopia: (ILCA) International Livestock Centre for Africa.
Egeru, A., Wasonga, O., Kyagulanyi, J., Majaliwa, G., MacOpiyo, L. & Mburu, J. (2014). Spatio-temporal dynamics of forage and land cover changes in Karamoja sub-region, Uganda. Pastoralism: Research, Policy and Practice, 4(6), 1–21. doi:10.1186/2041-7136-4-6.
Elias, M., Hensel, O., Richter, U., Hülsebusch, C., Kaufmann, B. & Wasonga, O. (2015). Land Conversion Dynamics in the Borana Rangelands of Southern Ethiopia: An Integrated Assessment Using Remote Sensing Techniques and Field Survey Data. Environments, 2, 1–31. doi:10.3390/environments2010001.
Ethiopian Mapping Agency. (2012). Topographical Maps of Yabelo (1992) and Mega (1993); Ethiopian Mapping Agency: Addis Ababa, Ethiopia. Ethiopian Meteorological Agency. (2014). Recorded Rainfall and Temperature Data of Yabelo and Dire Districts in Borana Rangeland; Ethiopian Meteorological Agency: Addis Ababa, Ethiopia. FAO. (2004). Carbon sequestration in dryland soils. Argentina. Version 102. http://www.fao.org/docrep/007/y5738e/y5738e00.htm. Access on 15 October 2012.

CHAPTER FOUR
106
FAO. (2007). Mapping biophysical factors that influence agricultural production and rural vulnerability: By van Velthuizen, H., Huddleston, B., Fischer, G., Salvatore, M., Ataman, E., Nachtergaele, F.O., Zanetti, M. & Bloise, M. Environment and Natural Resources Series 11:96. Rome, Italy. FAO. (2010). Global forest resources assessment. Main report, forestry paper 163, Rome, Italy. FAO. (2011). The state of the world’s land and water resources for food and agriculture: Managing systems at risk. Rome, Italy. FAO. (2014). The State of Food and Agriculture 2014 in brief: Innovation in family farming. 1–12. Rome, Italy.
Foody, G.M. (2003). Remote sensing of tropical forest environments: Towards the monitoring of environmental resources for sustainable development. International Journal of Remote Sensing, 24(20), 4035–4046. doi:10.1080/0143116031000103853.
Geist, H.J. & Lambin, E.F. (2002). Proximate Causes and Underlying Driving Forces of Tropical Deforestation. Bioscience, 52(2), 143–150.
Haile, G., Assen, M. & Ebro, A. (2010). Land use/cover dynamics and its implications since the 1960s in the Borana rangelands of Southern Ethiopia. Livestock Research for Rural Development 22(132). http://www.lrrd.org/lrrd22/7/hail22132.htm. Access on August 23 2014.
Hyandye, C., Mandara, C.G. & Safari, J. (2015). GIS and Logit Regression Model Applications in Land Use / Land Cover Change and Distribution in Usangu Catchment. American Journal of Remote Sensing, 3(1), 6–16. doi:10.11648/j.ajrs.20150301.12.
Kiptoo, K.O. & Mirzabaev, A. (2014). Economics of Land Degradation in Eastern Africa. Working Paper, 128, 1–29. Bonn, Germany. www.zef.de. Access on November 15 2015.
Kou, W., Xiao, X., Dong, J., Gan, S., Zhai, D., Zhang, G., Qin, Y. & Li, L. (2015). Mapping Deciduous Rubber Plantation Areas and Stand Ages with PALSAR and Landsat Images. Remote Sensing, 7(1), 1048–1073. doi:10.3390/rs70101048.
Lambin, E.F. & Meyfroidt, P. (2011). Global land use change, economic globalization, and the looming land scarcity. Proceedings of the National Academy of Sciences of the United States of America, 108(9), 3465–3472. doi:10.1073/pnas.1100480108.
Lambin, E.F. & Meyfroidt, P. (2010). Land use transitions: Socio-ecological feedback versus socio-economic change. Land Use Policy, 27(2), 108–118. doi:10.1016/j.landusepol.2009.09.003.

CHAPTER FOUR
107
Lambin, E.F., Geist, H.J. & Lepers, E. (2003). Dynamics of Land -Use and Land -Cover Change in Tropical Regions. Annual Review of Environment and Resources, 28(1), 205–241. doi:10.1146/annurev.energy.28.050302.105459.
Li, Z., Liu, W. & Zheng, F. (2013). The land use changes and its relationship with topographic factors in the Jing river catchment on the Loess Plateau of China. SpringerPlus, 2(Suppl 1), 2–7. Doi: 10.1186/2193-1801-2-S1-S3.
Liavoga, B.A., Kathumo, V.M., Onwonga, R.N., Karuku, G.N. & Onyango, C.M. (2014). Assessment of trends in land cover and crop type change over two decades in Yatta sub county, Kenya, 2(3), 46–52.
Lin-yi, L., Fang, H., Zhao-li, L. & En-pu, W. (2001). Study on methods of land use dynamic monitoring at county level-taking Dehui County, Jilin province for example. Chinese Geographical Science, 11(2), 181–185. http://www.scopus.com/inward/record.url?eid=2-s2.0-70449737586&partnerID=tZOtx3y1. Access on 15 November 2015.
Mbow, C., Brandt, M., Ouedraogo, I., de Leeuw, J. & Marshall, M. (2015). What Four Decades of Earth Observation Tell Us about Land Degradation in the Sahel? Remote Sensing, 7(4), 4048–4067. doi:10.3390/rs70404048.
Mengistu, A. (1998). The Borana and the 1991–92 drought: Rangeland and livestock resource study. Addis Ababa, Ethiopia: Institute for Sustainable Development Olson, J.M. (1994). Land degradation in Gikongoro, Rwanda: Problems and possibilities in the integration of household survey data and environmental data. Rwanda Society-Environment Project Working Paper 5. East Lansing, MI: Department of Geography and the Center for Advanced Study of International Development, Michigan State University.
Per, J., Lars, H. & Andres, A. (2007). Investigating modelled and observed Terra/MODIS 500-m reflectance data for viewing and illumination effects. Advances in Space Research, 39, 119–124. doi:http://dx.doi:10.1016/j.asr.2006.02.022.
Proud, S.R., Zhang, Q., Schaaf, C., Fensholt, R., Rasmussen, M.O., Shisanya, C., Anyamba, A., Pak, E. & Sandholt, I. (2014). The normalization of surface anisotropy effects present in SEVIRI reflectances by using the MODIS BRDF method. IEEE Transactions on Geoscience and Remote Sensing, 52(10), 6026–6039. doi:10.1109/TGRS.2013.2294602. Ruiz-Gallardo, J.R., Castaño, S. & Calera, A. (2004). Application of remote sensing and GIS to locate priority intervention areas after wildland fires in Mediterranean systems: a case study from south-eastern Spain. International Journal of Wildland Fire, 13, 241–252. http://dx.doi.org/10.1071/WF02057.
Rutter, S.M. (2007). The integration of GPS, vegetation mapping and GIS in ecological and behavioural studies. Revista Brasileira de Zootecnia, 36, 63–70. doi:10.1590/S1516-35982007001000007.

CHAPTER FOUR
108
Solomon, T.B., Snyman, H.A. & Smit, G.N. (2007). Cattle-rangeland management practices and perceptions of pastoralists towards rangeland degradation in the Borana zone of southern Ethiopia. Journal of Environmental Management, 82, 481–494. doi:10.1016/j.jenvman.2006.01.008.
Spottiswoode, C.N., Wondafrash, M., Gabremichael, M.N., Abebe, Y.D., Mwangi, M.A.K., Collar, N.J. & Dolman, P.M. (2009). Rangeland degradation is poised to cause Africa’s first recorded avian extinction. Animal Conservation, 12, 249–257. doi:10.1111/j.1469-1795.2009.00246.x.
Steffen, W., Persson, Å., Deutsch, L., Zalasiewicz, J., Williams, M., Richardson, K., Crumley, C., Crutzen, P., Folke, C., Gordon, L., Molina, M., Ramanathan, V., Rockström, J., Scheffer, M., Schellnhuber, H.J. & Svedin, U. (2011). The Anthropocene: From Global Change to Planetary Stewardship. Ambio, 40(7), 739–761. doi:10.1007/s13280-011-0185-x.
Tache, B. & Oba, G. (2010). Is Poverty Driving Borana Herders in Southern Ethiopia to Crop Cultivation? Human Ecology, 38(5), 639–649. doi:10.1007/s10745-010-9349-8.
Tagesson, T., Fensholt, R., Guiro, I., Rasmussen, M.O., Huber, S., Mbow, C., Garcia, M., Horion, S., Sandholt, I., Holm-Rasmussen, B., Göttsche, F.M., Ridler, M-E., Olén, N., Olsen, J.L., Ehammer, A., Madsen, M., Olesen, F.S. & Ardö, J. (2015). Ecosystem properties of semiarid savanna grassland in West Africa and its relationship with environmental variability. Global Change Biology, 21(1), 250–264. doi:10.1111/gcb.12734.
Trung, N.H., Tri, L.Q., Van Mensvoort, M.E.F. & Bregt, A.K. (2006). Application of GIS in land-use planning: A Case Study in The Coastal Mekong Delta of Vietnam. International Symposium on Geoinformatics for Spatial Infrastructure Development in Earth and Allied Sciences. Ho Chi Minh, Vietnam, 01-11 November 2006. Wageningen: Wageningen University, the Netherlands.
Tsegaye, D., Moe, S.R., Vedeld, P. & Aynekulu, E. (2010). Land-use/cover dynamics in Northern Afar rangelands, Ethiopia. Agriculture, Ecosystems and Environment, 139(1-2), 174–180. doi:10.1016/j.agee.2010.07.017.
Turner, B.L. (2003). Toward integrated land-change science: Advances in 1.5 decades of sustained international research on land-use and land-cover change. In Steffen W, Jäger J, Carson DJ, Bradshaw C (Eds.), Challenges of a changing earth (21–26). Berlin, Germany: Springer.
Walsh, S.J., Shao, Y., Mena, C.F. & McCleary, A.L. (2008). Integration of Hyperion satellite data and a household social survey to characterize the causes and consequences of reforestation patterns in the northern Ecuadorian Amazon. Photogrammetric Engineering and Remote Sensing, 74(6), 725–735.
CHAPTER FOUR
109
Wang, Y., Tobey, J., Bonynge, G., Nugranad, J., Makota, V., Ngusaru, A. & Traber, M. (2005). Involving Geospatial Information in the Analysis of Land-Cover Change along the Tanzania Coast. Coastal Management, 33, 89–101. doi: 10.1080/08920750590883132. Wario, H.T., Roba, H.G. & Kaufmann, B. (2015,) Shaping the Herders’ ‘‘Mental Maps’’: Participatory Mapping with Pastoralists’ to Understand Their Grazing Area Differentiation and Characterization. Environmental Management, 56, 721–737.doi: 10.1007/s00267-015-0532-y.
Were, K., Dick, Ø.B. & Singh, B.R. (2014). Exploring the geophysical and socio-economic determinants of land cover changes in Eastern Mau forest reserve and Lake Nakuru drainage basin, Kenya. GeoJournal, 79, 775–790. doi:10.1007/s10708-014-9525-2.
White, R.P. & Wanasselt, W. (2000). Grasslands in Pieces: Modification and Conversion Take a Toll. World Resource Institute, 2000–200:1–4.
Yen, S.J. & Lee, Y.S. (2009). Cluster-based under-sampling approaches for imbalanced data distributions. Expert Systems with Applications, 36(3 PART 1), 5718–5727. doi:10.1016/j.eswa.2008.06.108.

CHAPTER FIVE
110
5. Monitoring of vegetation changes using phenological observations of crops, rainfall
and NDVI data in the Borana rangelands, Ethiopia
Abstract: Changes in vegetation in rangelands are influenced by human activities and variably rainfall. As the changes have local, regional and global effects, it is crucial to analyse their extent. The objectives of this study were: (a) to analyse the temporal changes in vegetation at Darito agro-pastoralist and Mega pure-/ agro-pastoralist areas; (b) to analyse the effects of cultivation and variability of rainfall on vegetation changes, and; (c) to demonstrate the potential of phenology metrics in characterising cropland and natural rangelands. The study sites are located in the Borana rangeland in Southern Ethiopia. Moderate resolution imaging spectroradiometer (MODIS) NDVI time series data for 11 years from 2002 to 2012 was integrated with rainfall data, and phenology data of crops to analyse changes in vegetation. Vegetation classification and change detection was done using ArcGIS and trend analysis using SPSS and QED. The results showed no significant association between NDVI and rainfall except in 2010 and 2012. The NDVI trends of the largely agro-pastoral area were higher than a mixed of pure-/ agro-pastoral managed areas. Decreasing NDVI was caused by an increased cultivation, extraction of trees and grazing. Phenology observation assisted in identifying croplands from natural vegetation as croplands displayed lower NDVI than natural vegetation. Classification of vegetation and change detection facilitated detecting of the changes in vegetation. However, in the dry season maps the reflectance from nearby and back ground features caused a mixed pixel effect using 250 m resolution. The study recommends using Hyperion or hyperspectral bands. The decrease in NDVI is an indication of rangeland degradation; therefore, policy makers should strengthen strategies to manage rangeland resources.
5.1. Introduction
Changes in vegetation and productivity in rangelands are greatly influenced by human activities
such as grazing, extracting tree, cultivation, and by natural factors such as variability of rainfall.
The interplay of human and natural forces predominantly affects vegetation and ecosystem
functions (Lambin et al., 2003; Neely et al., 2009; UN 2011; Gamoun 2013). Ever since
rangelands are exposed to human activities they have altered the vegetation at various levels
(Bongers & Tennigkeit 2010; Brink et al., 2014). Apart from human influences, variable rainfall
has increased changes of growth form, structure, and net primary productivity in rangelands
(UNEP 2009; Augustine 2010). Therefore, real-time monitoring of the spatial-temporal changes
is crucial in assessing the extent of human and natural forces in influencing vegetation changes
that will provide theories towards improving the management of rangelands. Although greening
of vegetation in the Sahel region and elsewhere in semi-arid African is associated with
precipitation trends (e.g. Herrmann et al., 2005; Funk & Brown 2006), various land uses have

CHAPTER FIVE
111
influences on vegetation dynamics in rangelands. Rangeland studies are important as they are the
second largest pool of terrestrial soil organic carbon after forest ecosystems (WRI 2000). They
thus have great potential in sequestering atmospheric carbon and climate change mitigation. On
one hand, regional and global assessments have broaden our understanding about ecosystems’
dynamics (Tian et al., 2015), but on the other, site specific analyses are needed in order to
capture the local dynamics, thus, they support policy and decisions concerning management of
rangelands. The East African rangelands ecoregion has great ecological and economic potentials.
However, varieties land uses and variably rainfall affects these biome. In particular, the Borana
rangeland of Southern Ethiopia is one of extensive ecosystem in Eastern Africa, and supports
pastoralism, small scale farming and other ecosystem functions (Coppock 1994). However, over
the past three decades, successive changes in resource use and management have occurred
(Angassa 2002; Angassa & Beyene 2003). Among these changes were banning the use of fire as
a range management tool, the expansion of cultivation and privatization of some shares of the
rangeland (Tefera et al., 2007; Tache and Oba 2010). These changes are thought to have effects
on land uses, vegetation and net primary productivity (Angassa & Oba 2008).
The study site of Borana chosen was part of a larger project funded by the German Ministry of
Economic Cooperation and Development on Livelihood diversifying potential of livestock based
carbon sequestration options in pastoral and agro-pastoral systems in Africa, in which the present
work was embedded. The aforementioned large study site included within it one purely pastoral
site (Soda) and other three sites (namely Did mega, Samaro and Haralo), where crop farming is
already expanding; located around Mega in Dire district. The largely agro-pastoral community of
Darito (located in Yabelo district) was also chosen, in order to capture the dynamics of that
expansion and contrast it with a more pastoral setting. Previous studies (e.g. Haile et al., 2010;
Elias et al., 2015) in the Borana rangeland have shown the trends of land cover changes using
medium high resolution Landsat imagery. However, change detection method using two to three
sets of images is insufficient for monitoring temporal changes in vegetation over a longer time
(Herrmann et al., 2005). In search of a real-time method to monitor changes in vegetation in
rangelands, fortnightly moderate resolution NDVI data from MODIS was combined with rainfall
data and phenology data of crops in order to differentiate croplands from other land covered by
natural/ spontaneous vegetation. The real-time monitoring at monthly or yearly resolutions,
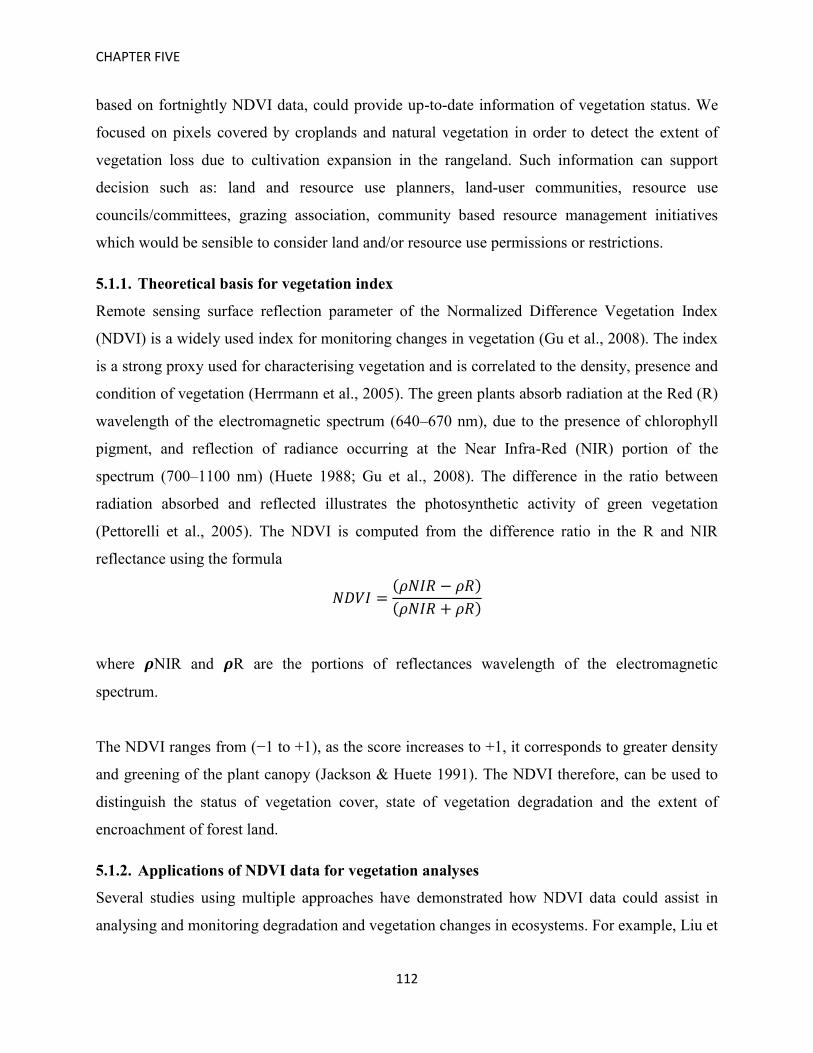
CHAPTER FIVE
112
based on fortnightly NDVI data, could provide up-to-date information of vegetation status. We
focused on pixels covered by croplands and natural vegetation in order to detect the extent of
vegetation loss due to cultivation expansion in the rangeland. Such information can support
decision such as: land and resource use planners, land-user communities, resource use
councils/committees, grazing association, community based resource management initiatives
which would be sensible to consider land and/or resource use permissions or restrictions.
5.1.1. Theoretical basis for vegetation index
Remote sensing surface reflection parameter of the Normalized Difference Vegetation Index
(NDVI) is a widely used index for monitoring changes in vegetation (Gu et al., 2008). The index
is a strong proxy used for characterising vegetation and is correlated to the density, presence and
condition of vegetation (Herrmann et al., 2005). The green plants absorb radiation at the Red (R)
wavelength of the electromagnetic spectrum (640–670 nm), due to the presence of chlorophyll
pigment, and reflection of radiance occurring at the Near Infra-Red (NIR) portion of the
spectrum (700–1100 nm) (Huete 1988; Gu et al., 2008). The difference in the ratio between
radiation absorbed and reflected illustrates the photosynthetic activity of green vegetation
(Pettorelli et al., 2005). The NDVI is computed from the difference ratio in the R and NIR
reflectance using the formula
𝑁𝐷𝑉𝐼 =(𝜌𝑁𝐼𝑅 − 𝜌𝑅)
(𝜌𝑁𝐼𝑅 + 𝜌𝑅)
where 𝝆NIR and 𝝆R are the portions of reflectances wavelength of the electromagnetic
spectrum.
The NDVI ranges from (−1 to +1), as the score increases to +1, it corresponds to greater density
and greening of the plant canopy (Jackson & Huete 1991). The NDVI therefore, can be used to
distinguish the status of vegetation cover, state of vegetation degradation and the extent of
encroachment of forest land.
5.1.2. Applications of NDVI data for vegetation analyses
Several studies using multiple approaches have demonstrated how NDVI data could assist in
analysing and monitoring degradation and vegetation changes in ecosystems. For example, Liu et

CHAPTER FIVE
113
al. (2010) and Sakamoto et al. (2005) used NDVI to assess changes in vegetation and plant
phenology. Brinkmann et al. (2011) quantified the above-ground rangeland productivity in the
Arabian Peninsula using NDVI data, and Todd et al. (1998) and Foody (2002; 2003) used the
NDVI to predict carbon flux patterns in ecosystems. Besides these studies, assessing the extent
of changes in vegetation in highly heterogeneous ecosystems is limited because of the mixture of
flora, such as: shrubs, wood trees, grassy, herbaceous, bushes and cultivation disturbances (Levin
2015). Differentiating cultivated land from grassland or bushland using NDVI data alone may
well entail a certain degree of inaccuracy, particularly in rangelands with high spatial and
temporal variability. It is easier to discriminate woodlands/forests and bushland from grassland
because of the canopy cover structure. Recognising these challenges, it is hoped that integrating
crop phenological observation NDVI profiles into the analysis will permit identifying cropland
area from natural vegetation efficiently. Studying phenological changes of crops’ can help to
study growth pattern and variation in green biomass (Vrieling et al., 2011). In the same way, a
time series analysis of the long term rainfall’s trends can help to determine its influence on
changes in vegetation. In this study, NDVI data from Moderate-resolution Imaging
Spectroradiometer (MODIS) 250 metre (m) resolution of 16 days' composite data from the Terra
satellite was integrated with phenology observation and rainfall data to analyse changes in
vegetation. The objective of this study was to analyse the extent and causes of changes in
vegetation composition on the ecological gradients of Darito and Mega in the Borana rangeland
from 2002 to 2012. Specific objectives were: (a) to analyse the temporal changes in vegetation at
Darito agro-pastoralist and Mega pure-/ agro-pastoralist areas; (b) to analyse the effects of
cultivation and variability of rainfall on vegetation changes, and; (c) to demonstrate the potential
of phenology metrics in characterising cropland and natural rangelands. The study sites are
located in the Borana rangeland in Southern Ethiopia. This study has the potential to the
understanding of the extents of the interplay of human activity and variable rainfall on vegetation
changes in the arid and semi-arid rangelands.
5.2. Methods
5.2.1. Study sites
The study sites Darito and Mega, are located within 4°45ˈ20ʺN and 4°5ˈ20ʺN and 38°22ˈ40ʺE
and 38°9ˈ20ʺE in the Borana rangeland in Southern Ethiopia covering 735.90 km2 (Figure 5.1).

CHAPTER FIVE
114
The sites are characterised by mountainous of 2204 meters above sea level (m.a.s.l), gently
sloped to moderately flat areas (1647 m), and lowland plains to shallow valleys (1090 m). The
average annual rainfall is about 600 mm, with a minimum and maximum rainfall that varies from
100 mm in the lower to 1500 mm in the higher areas (Cheung et al., 2008). The average annual
rainfall computed is (470.644±320.847 mm) at Darito and (544.423±428.740 mm) at Mega
(Figure 5.3), lower than the one calculated by Cheung and others. Mean annual temperature
varies from 19°C to 24°C, with an average decrease of 1°C for every 200 m.a.s.l (Coppock
1994).
Figure 5.1. Locations and elevation maps of the study sites.
5.2.2. Data collected
5.2.2.1. Sampling of cropland areas and the vegetation types
A total of 108 croplands were identified by generating polygons and ground points using 2005–
series Trimble GPS device (cf. chapter four methods). The sizes of the cultivated croplands vary;
< 1 hectare (ha), 1.1 – 2.9 ha and > 3 ha. Meanwhile cultivated land or croplands were not
homogeneously covered with biomass we clustered them into three categories; 80%, 50% and
20%, of biomass cover per pixel. The samples of woodland, grassland and bushland were
identified based on rangeland classification criteria for Eastern Africa (Pratt et al., 1966; Table

CHAPTER FIVE
115
5.1). Larger blocks of polygons representing specific vegetation types were generated during
field surveys in the course of this study. The polygons generated from the study authors' land
cover classification with Landsat data (Elias et al., 2015) were also used to validate the
vegetation types identified. Table 5.1 shows the descriptions of the vegetation types identified
based on their physiognomic characteristics.
Table 5.1. Description used to identify and classify vegetation types.
Land cover with wood trees or vegetation higher than 5 metres with grass or shrub, interspersed with canopy cover: more than 20% was identified and classified as woodland.
Land cover or type composed of close or open bushes plants, lower than 5 metres in height and with less than 20% canopy cover, was classified as bushland.
Land cover dominated by grasses and other natural scattered or grouped trees or bushes- with canopy cover not exceeding 2%– was identified as grassland.
The land cover type used for cultivation was defined as cropland or cultivated land.
Source: Photos were taken during field surveys in Borana rangeland, Southern Ethiopia (2012 to 2014).

CHAPTER FIVE
116
5.2.2.2. Phenology data
The mono- and dicotyledonous crop species (maize, wheat, barley, sorghum, teff and haricot
beans) were identified on the respective crop fields. Identification of the phenological
developmental stages of the crop species was guided by the Federal Biological Research Centre,
Office of Plant Varieties and Industrial Scale Chemistry (BBCH monograph) (Meier 2001) for
uniform coding (Appendix 6 and 7). The nine principal phenophases (0) germination; (1) leaf
development; (2) formation of side shoots or tillering; (3) stem elongation or shoot development;
(4) development of harvestable vegetables (main shoot); (5) inflorescence emergence; (6)
flowering; (7) development of fruit; (8) ripening or maturity; (9) senescence (beginning of
dormancy), were identified. Information on the timing of farming practices such as clearing,
tilling, weeding and harvesting dates was recorded from field studies, interviews with farmers
and by using the regional crop calendar in order to identify times when fields would be covered
by plants and when they would be left bare.
5.2.2.3. Rainfall, temperature and NDVI data
Monthly total rainfall from the years 1975 to 2012 and temperature data from 1962 to 2012 at
Darito in Yabelo district, and from 1984 to 2012 at Mega in Dire district, were used for the
analyses. Data was collected by the Ethiopian Meteorological Agency (EMA 2014). The MODIS
product MOD13Q1 was obtained from lpdaac.usgs.gov/mod13q1 and is available at a scale
factor of 0.0001 or (10000) mapped in the Sinusoidal (SIN) grid projection (Solano et al., 2010).
Digital Elevation Model (DEM) 30 m was considered for generating the elevations of the area
studied.
5.2.3. Analyses
5.2.3.1. Spatial analyses
Spatial analyses were done using ArcMap 10.2 and Q-GIS 2.8.1. Zonal statistics function was
used to extract NDVI units of the Regions of Interest (ROIs) from corresponding vegetation
types for all months from January to December for the years 2002 to 2012. For croplands
covered 80%, 50% and 20% by biomass, NDVI cell values were extracted by points and three
spectral curves were plotted and compared with a spectral curve for grassland. This was done
only for the year 2012 and only five pixels were used as a sample to represent a category.
Vegetation map classification was done by computing a range of pixel scores (as a threshold)

CHAPTER FIVE
117
from woodland, bushland, grassland and cultivated land, and then pixels were grouped in a
specific class. Only images from the years 2002 and 2012 were classified using supervised
classification. Change detection was done using an NDVI map of January 2012 laid over the
same period in 2002 map which portrayed the short dry season and September 2012 laid over
that period in 2002 map which portrayed the long dry season. Then a re-map function was used
to map areas of gains and losses. A threshold score of +0.4 NDVI value was considered as
densely vegetated and an NDVI score of -0.4 was considered as sparsely vegetated (MODIS user
guide).
5.2.3.2. Statistical analyses of NDVI data
The Statistical analyses were performed using the Statistical Package for Social Sciences (IBM
SPSS Statistics V 16), QED statistics and Microsoft Excel 2010. The mean values of NDVI of
the years 2002 to 2012 were computed and two-sample t-test was used to check for differences in
NDVI at Darito and Mega. One-Way ANOVA tested the mean differences in NDVI of
vegetation types and the Pearson correlation coefficient test was then used to measure the
association between monthly rainfall and monthly NDVI (greening) from 2002 to 2012. In
testing the association between rainfall and NDVI, we used dry-months and wet-months so as to
eliminate test bias. The method used is similar to that of Gunnula et al. (2011), who measured the
relationship between rainfall, NDVI pattern and yield. The mean NDVI scores from cropland
areas were used to plot a spectral curve demonstrating phenological phases. In order to determine
the NDVI trends for woodland, bushland, grassland and cultivated land, mean annual values
were used to plot a time series trends from 2002 to 2012. To determine the variations in NDVI
scores for croplands with 80%, 50%, 20% biomass cover, we used average monthly NDVI
scores and that of grassland in year 2012.
5.2.3.3. Rainfall and temperature analyses
Climate data was analysed using Microsoft Excel 2010, and C-PLOT32 was used for climate
diagrams (Lieth et al., 1999). Total annual rainfall of a specific year was computed by summing
total monthly rainfall over the number of months of that year. Average annual rainfall was
computed by dividing total annual rainfall over the number of years studied (in this case 38
years). Then, the long-term average annual rainfall from the two study areas was computed and
the corresponding standard deviation. This is similar to Cheung et al. (2008) who analysed

CHAPTER FIVE
118
rainfall pattern in Ethiopia. Bi-modal rainfall diagrams were plotted using average monthly
rainfall values calculated from 1975 to 2012 and average monthly temperature values calculated
from 1962 to 2012 for Darito, and 1984 to 2012 for Mega.
5.2.4. Workflow
Figure 5.2 illustrates the steps in analysing data. The pre-processing steps were image projection,
raster projection onto WGS 84 of UTM zone 37N and clipping of regions of interest (ROIs). At
pixel level, unique digital numbers (DN) which represent the NDVI score of vegetation types
(woodland, bushland, grassland and cultivated land) were extracted using the zonal statistics
function and NDVI cell values from years 2002 to 2012 were extracted using ArcMap 10.2
applications.
Figure 5.2. Workflow for data analyses and vegetation mapping.
5.3. Results
5.3.1. Rainfall characteristics of the Darito and Mega sites in the Borana rangeland
The rainfall distribution is bi-modal (Figure 5.3), with the long rainy season occurring from
March to May and short rainy season from October to December. Total annual rainfall fluctuates
from average annual rainfall (Figure 5.4). From 1983 to 1985, the area studied experienced some
drought; while during 2010 higher rainfall levels were recorded. Rainfall distribution is greatly

CHAPTER FIVE
119
influenced by altitude, meaning a semi-arid, dry-sub humid to humid climate subjected to low,
moderate, to higher rainfall levels; the former climate and rainfall in low-lying areas and the
latter in higher regions.
Figure 5.3. Climate diagrams for Darito and Mega: rainfall data for both sites obtained from
1975 to 2012 while temperature data for Darito was obtained from 1962 to 2012
and for Mega, 1984 to 2012.
The red line shows temperature in (ºC) and the blue line shows rainfall in (mm). Source: rainfall
and temperature data obtained from the Ethiopian Meteorological Agency in 2014.
Figure 5.4. Total annual rainfall in (mm), Source: Ethiopian Meteorological Agency
(EMA, 2012).

CHAPTER FIVE
120
5.3.2. The spatial and temporal mean annual NDVI trends in Darito and Mega
The NDVI trends at Darito and Mega sites differ significantly over the study period of 11 years
(p<0.05). The mean annual NDVI at Darito (0.42±0.027) were higher than at Mega (0.35±0.024)
from 2002 to 2012. The NDVI trends demonstrate that at Darito, the NDVI was only below the
threshold 0.4 score in 2008, while at the Mega sites, the NDVI runs below the threshold 0.4
score except for 2003 (Figure 5.5). Increasing land conversion for cultivation and sparse
vegetation composition at the Mega site is the major reason for the NDVI trends obtained. It can
thus be interpreted that decreasing trends in NDVI indicating that both sites are at risk of running
below the threshold score indicating degradation.
Figure 5.5. Inter-annual variability of mean NDVI for Darito and Mega sites: a black line at
0.4 NDVI score is the threshold score for sparse and dense vegetation.
5.3.3. Correlation between monthly rainfall and NDVI
The statistical correlation between monthly rainfall and NDVI is shown in Table 5.2. The results
show that there were weak associations between rainfall and NDVI changes except in 2010 and
2012. It can thus be interpreted that NDVI changes could be influenced by other factors such as
soil moisture apart from rainfall). Nonetheless, in some years, it seems that despite negative or
positive NDVI trends, rainfall and NDVI are only weakly related.

CHAPTER FIVE
121
Table 5.2. The association between monthly rainfall and NDVI composition: p <0.05; N
= 12 months.
Years 2002 2003 2004 2005 2006 2007 2008 2009 2010 2011 2012
Darito 0.234 0.280 0.406 0.028 -0.502 0.340 0.449 -0.279 0.633** -0.005 -0.623**
Mega -0.046 0.162 -0.338 0.519 -0.397 0.065 0.485 -0.543 0.581** 0.024 0.265
**correlation is significant at 5%.
Figure 5.6 shows the NDVI pattern during the wet and dry seasons in the year 2002. Pixels
showing higher NDVI score (0.92) during April are areas dominated by woodland and the low-
lying water-logged vegetated areas. Denser areas with greening pixels dominated Western and
Southern portions of Darito, with a small portion at Did mega and Samaro, and an area in
Southern Haralo (Figure 5.6a & c). At the Darito site, the average NDVI was 0.42; greater than
the 0.34 calculated for the Mega sites. During the dry season, from the end of September to mid-
October, the mean NDVI at Darito decreased to 0.39 and that of Mega rose to 0.37 and all were
below the threshold score (0.4). Figure 5.6 (b & d) show that the greening of vegetation
remained on small sections around water-logged areas; on central and Southwest Darito, Did
mega, around mountainous areas of Samaro and on the Northeast of Soda around the lake
depression. Areas showing decreasing NDVI are those portions used as cultivated land, areas
with sparse vegetation and degraded areas.

CHAPTER FIVE
122
Figure 5.6. Inter-seasonal variability of NDVI pattern at Darito (a & b) and at Mega (c & d)
sites, Borana, Ethiopia. April wet season and September dry season during the
year 2002.
In the year 2012, slight changes in vegetation greening occurred in all study areas. Pixels with
dense vegetation dominate on a small section in the Western part of Darito (Figure 5.7a), around
Samaro, Did mega and to the South-West parts of Haralo on the Mega site (Figure 5.7c). The
mean NDVI during April 2012 decreased to 0.32; less than in year 2002. Accordingly, during the
dry season in September, greening vegetation remained on the mountainous areas of Western
Darito and around Did mega and Samaro (Figure 5.7b & d). Areas dominated with pink to red
colour pixels are those with dense vegetation while gray pixels represent parts of the rangeland
which are degraded or bare (Figure 5.7c).

CHAPTER FIVE
123
Figure 5.7. Inter-seasonal variability of the NDVI pattern at Darito (a & b) and Mega (c & d)
sites, Borana, Ethiopia. April wet season and September dry season during the
year of 2012.
5.3.4. Vegetation classification and changes in the NDVI between 2002 and 2012
Vegetation types identified were classified during January and September 2002 and 2012 (Figure
5.8 and 5.9, plate a, b, d and e). The results show that at the Darito site there were marked
increase of pixels of cultivation during January whilst a slight decrease in woodland and
bushland pixels occurred between 2002 and 2012 (Figure 5.8, plate a, and b). The changes that
are seen in the September 2002 and 2012 maps are increases in cultivated land pixels. The
pattern obtained mainly shows prolonged dry conditions and the vegetation such as bushes, herbs
and grasses have entered the dormancy phase (Figure 5.8, plate d, and e). Hence, the NDVI units
of areas with sparse, dry vegetation and bare land are low similar to cultivated areas. There were
losses in vegetation between 2002 and 2012 as illustrated by decreasing NDVI values between
January 2002/ 2012 and September 2002/2012 (Figure 5.8, plate c and f).

CHAPTER FIVE
124
Figure 5.8. Vegetation maps for Darito during the short dry season in January, (plate a, and b)
and the long dry season September, (plate d, and e). Plate c, and f shows change
maps between January 2002/2012 and September 2002/2012.
The results also show that between January 2002 and 2012 at the Mega site, grassland decreased
while bush vegetation increased and interspersed with grassland (Figure 5.9, plate a, and b).

CHAPTER FIVE
125
Pixels showing positive greening (high NDVI values) dominate woodland areas and areas with
water-logged vegetation in particular Southern Mega at Haralo and South-Eastern Samaro
(Figure 5.9, plate c).
Figure 5.9. Vegetation maps for the Mega sites during the short dry season in January, (plate
a, and b) and the long dry season September, (plates d, and e). Plate, c, and f show
maps of changes between January 2002/2012 and September 2002/2012.

CHAPTER FIVE
126
Accordingly, during September 2002 and 2012 (Figure 5.9, plates d and e), the number of pixels
representing cultivated areas increased- especially around Soda. The changes observed matched
to the dormancy phase of the vegetation communities, as much of the land is dominated by
sparse vegetation. In Southern Mega, the expansion of bare land at Haralo also indicated low
NDVI values; similar to that of cultivated areas. The change maps (Figure 5.9, plate c and f);
showed decreasing green pixels NDVI which corresponded to vegetation losses and dormancy
phase.
5.3.5. Characterising vegetation types based on unique NDVI profiles
The mean NDVI of vegetation types are summarised in Table 5.3. Both sites and for all
vegetation types are characterised by fluctuations in mean NDVI from 2002 and 2012 (Figure
5.10). During 2006 a higher NDVI for woodland was obtained at the Darito site, nevertheless
such pattern does not associated with cumulative rainfall 2005. As shown in Table 5.3, woodland
vegetation is dense at Darito than that of Mega sites. At the Darito site, bushland spectral curve
overlapped with grassland. In contrast, at Mega sites, bushland and grassland curves are low,
suggesting a low proportion of biomass cover. Though both sites displayed the lowest NDVI
curve of cultivated land, the grassland curve at Mega site is the lowermost. Accordingly, during
2002, 2003, 2005 and 2006, the NDVI curve for cultivated land was even higher than that of
grassland. Such trends can be explained by the fact that the vegetation communities are very
sparse and cultivation is encroaching onto grassland.
Figure 5.10. Mean annual NDVI profile for vegetation types, Darito (D) and Mega (M) sites.

CHAPTER FIVE
127
Table 5.3. Comparison of mean NDVI for vegetation types (2002 to 2012): One-way
ANOVA. Darito site Number of pixels Mean NDVI F- test p-value Cultivated land 115 0.36 98.055 0.000 Woodland 115 0.58 Grassland 115 0.42 Bushland 115 0.42 Mega sites Number of pixels Mean NDVI F- test p-value Cultivated land 115 0.33 53.615 0.000 Woodland 115 0.48 Grassland 115 0.31 Bushland 115 0.36
Significance level 1%.
In addition, the seasonal NDVI trends demonstrated that cropland curve displayed a lower NDVI
profile throughout the year. In October and at the beginning of December, the NDVI curves for
all vegetation types displayed a drastic decrease. This could be associated with the timing of
greening (Figure 5.11).
Figure 5.11. Seasonal comparisons of NDVI for vegetation types in the year 2012: high NDVI
correspond to rainy seasons and low NDVI to the dry seasons.
In identifying croplands into rangelands phenology observations was used. Figure 5.12, presents
variation in biomass at different growing stages. The results show that low NDVI occurred
during January, February, July, August and September after harvesting and during the preparing
land for planting. The NDVI started to increase from leaf development through to greening
stages, as crops became photosynthetically active. As the crops entered flowering, development

CHAPTER FIVE
128
of fruit and ripening, the NDVI started to decrease until the senescence phase. Such pattern is
different from natural vegetation as the mean NDVI score during greening is 0.45 for cropland,
0.53 for grassland, 0.58 for bushland and 0.65 for woodland (Figure 5.11).
Figure 5.12. NDVI profile for cropland at different phenological phases in the year 2012 for
two cropping seasons.
There were also slight variations in NDVI scores for crop fields with biomass at different
proportions per pixel (Figure 5.13). Remarkably, crop fields with 20% biomass cover have
higher NDVI values than the others (January to March and June to August) and the lowest is for
croplands with 80% biomass cover. However, such variation is not similar to the spectral curve
for grassland (Figure 5.13). The obtained trends can be explained by the fact that new crop fields
extending into grassland is interspersed with nearby natural vegetation (mixed pixel effects). As
a result the NDVI values of grassland, bushes contributed to the NDVI scores for cropland. This
is one constraint of using moderate resolution data for classifying cultivated land and grassland
or bush vegetation in the rangeland.

CHAPTER FIVE
129
Figure 5.13. Comparisons of the mean NDVI for grassland and cropland with different
percentage of biomass cover in the year 2012: N = 5 pixels.
5.4. Discussion
5.4.1. Rainfall and NDVI trends
The causes of changes in vegetation in the Borana rangeland were analysed using NDVI time
series data, phenology and rainfall records. According to the study findings, the rainfall in the
study area is bi-modal and characterised by long-term fluctuations from the mean with some
extreme drought events from 1983 to 1985 (Figure 5.4). As revealed in this analysis, the changes
in NDVI did not correlate strongly with rainfall (p> 0.05; Table 5.2). However, in 2010 and
2012, there was a significant (p< 0.05) relationship between rainfall and NDVI composition.
This is consistent with Herrmann et al. (2005) and Funk & Brown (2006) who found that rainfall
is a key factor influencing vegetation dynamics in the semi-arid African Sahel. A weak
association obtained in other years could be attributed to either timing of vegetation greening,
effects of soil moisture, variations in rainfall from location to location or the sparsely vegetated
nature of the study areas. Whilst global observations showed that changes in NDVI trends and
vegetation greening in arid and semi-arid areas is largely driven by precipitation and global
climate change (Nemani et al., 2003; Fensholt et al., 2012). The study findings seem contrary to
these global studies, negative NDVI trends obtained related more with the increased conversion
of land for cultivation and the loss of vegetation through cutting tree than to rainfall trends. This
also supported by a previous study (Evans & Geerken 2004) as they associated it with increased
human activities on the land.
CHAPTER FIVE
130
5.4.2. Spatial-temporal changes in vegetation
Accordingly, the NDVI compositions at Darito and Mega differed significantly (p< 0.05) and
low NDVI values were obtained at the Mega sites. The sparse nature of vegetation and increased
cultivation at Did mega and Haralo within the Mega study area could be the major causes of the
decreasing NDVI. In a previous study Elias et al. (2015), reported that much of the low-lying
areas at Did mega and Haralo within the Mega study area were being cultivated. Although
agriculture activities is also practiced at Darito site, the temporal trends indicated that at the
NDVI values were above the threshold, while for many of the years, the NDVI trends at the
Mega sites were below the threshold score of 0.4 (Figure 5.5). The reason for that trend is that
cultivation started much earlier at the Mega sites than at Darito. In addition, at Mega, the growth
of the town of Mega and an influx of immigrants from the Moyale border of Kenya lead to an
increasing demand for firewood, charcoal, building materials and rangeland is converted into
cultivated. The Soda site is inhabited by pastoralists; therefore there is great pressure on the land
for livestock grazing and farming within the Mega study area. Apart from that, at Haralo, in the
Southern portion of the Mega study area, there is extensive bare land and the proportion of
woodland, bushland and grassland vegetation is very sparse. The results can be compared to a
previous study in the Borana area, where Tefara et al. (2007) showed that livestock grazing
intensity have direct and indirect effects on vegetation. An increase in farming and extraction of
wood trees are important force in explaining the loss of vegetation in the Borana rangeland. For
example, in mountainous areas where human activities are restricted by topographic settings
there is more vegetation greening than in the low-lying areas (Figure 5.6 and 5.7), and much of
them is woodland. A very similar pattern are seen elsewhere in Africa where many of the low-
lying areas of the Southern African rangelands have less biomass compared to mountainous
areas (Fox et al., 2005).
5.4.3. Vegetation classification and changes
The assessment of vegetation changes (i.e. focusing on woodland, bushland, grassland with
bushes and cultivated land) was done using two classified NDVI maps for the short and long dry
seasons. Vegetation maps for Darito and Mega (Figure 5.8 and 5.9) showed some changes
between 2002 and 2012. There was a decrease in woodland and grassland vegetation on both
sites while bushland has encroached onto grassland areas. The increase in bushland is linked to
changes in management – particularly banning the use of fire and grazing pressure over the past

CHAPTER FIVE
131
three decades (Figures 5.8 and 5.9, plates a, and b). In a previous study by Coppock (1994)
revealed that banning the use of fire as a management tool paved a way to bush encroachment in
the Borana rangelands and it is thought to have suppressed grassland. The decrease in woodland
and grassland is attributed to cutting trees for fuelwood and construction but also cultivation
activity. The vegetation maps for September (Figures 5.8 and 5.9, plates d and e) showed that the
pixels under cultivated areas in both sites increased more than during the short dry season in
January. The changes in NDVI observed are obvious due to existence of sparsely vegetated areas
nearly bareland. Similarly, during September 2002 and 2012 the NDVI maps showed an increase
in grassland areas. However, such changes are due to the fact that bushland vegetation have
entered dormancy phase and there are no understory herbs to cover the surface instead.
Therefore, the ground surface is bare, making the NDVI values low. Distinct from bushland, as
grassland entering its dormancy phase, dry biomass remains on the ground unless disturbance
from grazing or range fires. Therefore, decreasing in NDVI scores during September are also
associated to background object reflectance of non-vegetated features. Change maps in both sites
(Figures 5.8 and 5.9, plates c and f) showed different rates of decrease in NDVI scores. Areas
with negative NDVI trends were rangeland which had been natural in 2002 but had been
converted into agricultural land, very sparsely vegetated areas or bare land in the 2012 maps.
Areas with positive NDVI trends are those where vegetation has regenerated; either grassland or
bush encroachment. When comparing this study's results with previous studies (Angassa &
Beyene 2003; Tefera et al., 2007), marked decrease in vegetation is associated to grazing
pressure over past decades and the expansion of cultivation. Therefore, the results of this study
indicate that changes in vegetation are a product of human activities than natural forces like
rainfall.
5.4.4. Characterising vegetation types
The characterisation of vegetation types was shown on (Figure 5.10 and 5.11). Comparing the
four spectral curves, cropland has low NDVI distinct from natural vegetation. The mean NDVI
for all vegetation types and by the sites were significant different (Table 5.3). The heterogeneity
of canopy structure and productivity of woodland, bushland, grassland and cultivated land partly
explains the pattern but also the extent of human disturbances (Figure 5.10). Seasonally, the
largest differences can be seen for woodland with a higher NDVI (Figure 5.11). Nonetheless,
during October and beginning of December all vegetation types displayed a drastic decline in
CHAPTER FIVE
132
mean NDVI values, mostly, the pattern obtained could be corresponded to timing of greening.
Moreover, phenology observation of crops facilitated detecting variation in biomass seasonally.
A unique profile could be seen when comparing the mean NDVI of the four vegetation types
(Figure 5.11). Nonetheless, in areas where cultivation are increasing and yet surrounded by
grassland or bushland, neighboring vegetation could contribute to the NDVI score for cultivated
land. For example, crop fields covered by biomass by 80% have low NDVI than those with 20%
(Figure 5.13). The obtained trends are due to the reason that the resolution of a MODIS pixel
was higher than the size of some fields, therefore, nearby pixels contributed to NDVI score on
fields with 20% biomass cover. For example, Gunnula et al. (2011) demonstrated that coarse-
resolution NDVI pixels may be affected by a mixed pixel. As the differences in crop fields were
shown in this analysis there is need to use Hyperion or Hyperspectral bands to minimize a mixed
pixel effects. In general, vegetation information from NDVI time series analyses is important in
identifying the causes contributing to the changes in rangelands. This information is important
for management and early warning. In grazing management, the NDVI trends can be an
informative indicator of biomass losses or gains over time. In particular, bushland vegetation is
the main food source for browsing animals while for grazing animals depends on grassland for
fodder. Therefore, studying the spatial-temporal changes could help in improving grazing
management but also to detect areas of natural rangelands encroached by cultivation.
5.5. Conclusion
In this study we demonstrated method that combined NDVI data, rainfall and phenological
observations to analyse the causes and extent of vegetation changes in semi-arid rangelands.
Much of the changes in vegetation seen (such as negative NDVI trends) were influenced by an
increase land conversion for agricultural expansion, past grazing pressure and cutting of trees.
Rainfall is one of the determinants but not a strong proxy in explaining the obtained patterns of
vegetation changes since long term trends have shown fluctuations with no instantaneous effects
on vegetation. Other biophysical traits such as the properties of soil, soil moisture levels, and
temperature could contribute to the spatial-temporal changes of vegetation. To improve
classification of vegetation this study recommends using high resolution NDVI data,
Hyperspectral bands, or Hyperion data. The loss of vegetation mainly those related to human
activities is an indication of rangeland degradation; therefore, rangeland managers should revise
management strategies in order to enhance long-term carbon sequestration potentials.

CHAPTER FIVE
133
References
Angassa, A. & Beyene, F. (2003). Current range condition in southern Ethiopia in relation to traditional management strategies: The perceptions of Borana pastoralists, Tropical Grasslands, 37, 53–59. Angassa, A. & Oba, G. (2008). Herder Perceptions on Impacts of Range Enclosures, Crop Farming, Fire Ban and Bush Encroachment on the Rangelands of Borana, Southern Ethiopia, Hum. Ecol., 36, 201–215. doi:10.1007/s10745-007-9156-z. Angassa. A. (2002). The effect of clearing bushes and shrubs on range condition in Borana, Ethiopia. Tropical Grassland, 36, 69–76. Augustine, D.J. (2010). Spatial versus temporal variation in precipitation in a semiarid ecosystem,” Landscape Ecol., 25(6). doi:10.1007/s10980-010-9469-y. Bongers F. & Tennigkeit, T. (2010). Degraded Forests in Eastern Africa, Management and Restoration, pp. 1–22. Earthscan, London.
Brink, A.B., Bodart, C., Brodsky, L., Defourney, P., Ernst, C., Donney, F., Lupi, A. & Tuckova, K. (2014). Anthropogenic pressure in East Africa—Monitoring 20 years of land cover changes by means of medium resolution satellite data. International Journal of Applied Earth Observation and Geoinformation, 28, 60–69. doi:10.1016/j.jag.2013.11.006.
Brinkmann, K., Dickhoefer, U., Schlecht, E. & Buerkert, A. (2011). Quantification of aboveground rangeland productivity and anthropogenic degradation on the Arabian Peninsula using Landsat imagery and field inventory data. Remote Sensing and Environment, 115, 465–474.doi: 10.1016/j.rse.2010.09.016. Cheung, W.H., Senay, G.B. & Singh, A. (2008). Trends and spatial distribution of annual and seasonal rainfall in Ethiopia,” International Journal of Climatology, 1723–1734. doi: 10. 1002/joc.1623. Coppock, D.L. (1994). The Borana Plateau of Southern Ethiopia: Synthesis of Pastoral Research, Development and Change, 1980–91; International Livestock Centre for Africa: Addis Ababa. Ethiopia. 393. Elias, M., Hensel, O., Richter, U., Hülsebusch, C., Kaufmann, B. & Wasonga, O. (2015). Land Conversion Dynamics in the Borana Rangelands of Southern Ethiopia: An Integrated Assessment Using Remote Sensing Techniques and Field Survey Data,” Environments, 2, 1–31. doi:10.3390/environments2010001. EMA. (2014). Ethiopian Meteorological Agency. Recorded Rainfall and Temperature Data of Yabelo and Dire Districts in Borana Rangeland; Ethiopian Meteorological Agency: Addis Ababa, Ethiopia.Unpublished data.

CHAPTER FIVE
134
Evans, J. & Geerken, R. (2004). Discrimination between climate and human-induced dryland degradation, Journal of Arid Environments, 57, 535–554. doi: 10.1016/S0140-1963(03)00121-6. Fensholt, R., Langanke, T., Rasmussen, K., Reenberg, A., Prince, S.D., Tucker, C., Scholes, R.J., Le, Q.B., Bondeau, A., Eastman, R., Epstein, H., Gaughan, A.E., Hellden, U., Mbow, C., Olsson, L., Paruelo, J., Schweitzer, C., Seaquist, J. & Wessels, K. (2012). “Greenness in semi-arid areas across the globe 1981-2007 - an Earth Observing Satellite based analysis of trends and drivers,” Remote Sens. Environ., 121, 144–158. doi.org/10.1016/j.rse.2012.01.017. Foody, G.M. (2002). Status of land cover classification accuracy assessment, Remote Sensing of Environment, 185–201. doi: 10.1016/S0034-4257(01)00295-4. Foody, G.M. (2003). Remote sensing of tropical forest environments: Towards the monitoring of environmental resources for sustainable development, Int. J. Remote Sensing., 24(20), 4035–4046. doi: 10.1080/0143116031000103853. Fox, S.C., Hoffman, M.T. & Hoare, D. (2005). The phenological pattern of vegetation in Namaqualand, South Africa and its climatic correlates using NOAA-AVHRR NDVI data, South African Geographical Journal, 87(2), 85–94. doi: 10.1080/03736245.2005.9713831. Funk, C.C. & Brown, M.E. (2006). Intra-seasonal NDVI change projections in semi-arid Africa, Remote Sensing of Environment, 101, 249–256. doi: 10.1016/j.rse.2005.12.014. Gamoun, M. (2013). Vegetation change in variable rangeland environments: the relative contribution of drought and soil type in arid rangelands. Ekológia (Bratislava), 32(1), 148–157. doi.org/10.2478/eko-2013-0013. Gu, Y., Hunt, E., Wardlow, B., Basara, J.B., Brown, J.F. & Verdin J.P. (2008). Evaluation of MODIS NDVI and NDWI for vegetation drought monitoring using Oklahoma Mesonet soil moisture data, Geophysical Research Letters, 35(L22401), 1−5, doi: 10.1029/2008GL035772. Gunnula, W., Kosittrakun, M., Righetti, T.L. & Weerathaworn, P. (2011). Normalized difference vegetation index relationships with rainfall patterns and yield in small plantings of rain-fed sugarcane, Australian Journal of Crop Science, 5(13), 1845–1851. Haile, G., Assen, M. & Ebro, A. (2010). Land use/cover dynamics and its implications since the 1960s in the Borana rangelands of Southern Ethiopia. Livestock Research for Rural Development, 22, 132. http://www.lrrd.org/lrrd22/7/hail22132.htm (accessed on 8 March 2013). Herrmann, S.M., Anyamba, A. & Tucker, C.J. (2005). Recent trends in vegetation dynamics in the African Sahel and their relationship to climate. Global Environmental Change, 15, 394–404. doi:10.1016/j.gloenvcha.2005.08.004. Huete, A.R. (1988). “A Soil-Adjusted Vegetation Index (SAVI),” Remote Sensing of Environment, 25, 295–309.

CHAPTER FIVE
135
Jackson, R.D. & Huete, A.R. (1991). Interpreting vegetation indices, Preventive Veterinary Medicine, 11,185–200. Lambin, E.F., Geist, H.J. & Lepers, E. (2003) Dynamics of land use and land cover change in tropical regions. Annual Review of Environment and Resources 28, 205–241. Levin, N. (2015). Human factors explain the majority of MODIS-derived trends in vegetation cover in Israel: a densely populated country in the eastern Mediterranean. Reg Environ Change. doi: 10.1007/s10113-015-0848-4. Lieth, H., Berlekamp, J., Fuest, S. & Riediger, S. (1999). Climate Diagram World Atlas. Climate and Biosphere. CD No.1. Backhuys Publishers, Leiden, Belgium. Liu, J., Pattey, E., Miller, J.R., McNairn, H., Smith, A. & Hu, B. (2010). Estimating crop stresses, aboveground dry biomass and yield of corn using multi-temporal optical data combined with a radiation use efficiency model. Remote Sensing of Environment, 114, 1167–1177.doi: 10.1016/j.rse.2010.01.004. Meier, U. (2001). Growth stages of mono-and dicotyledonous plants BBCH Monograph, Federal Biological Research Centre for Agriculture and Forestry. Neely, C., Bunning, S. & Wilkes, A. (2009). Review of evidence on drylands pastoral systems and climate change: Implications and opportunities for mitigation and adaptation. FAO, Land and Water Discussion Paper 8, pp. 1–38, Rome, Italy. www.fao.org/uploads/media/LWdisc_paper8_temp.pdf. Nemani, R.R., Keeling, C.D., Hashimoto, H., Jolly, W.M., Piper, S.C., Tucker, C.J., Myneni, R. B. & Running, S.W. (2003). Climate-Driven Increases in Global Terrestrial Net Primary Production from 1982 to 1999. Science, 300(5625) 1560–1563. Pettorelli, N., Vik, J.O., Mysterud, A., Gaillard, J.M., Tucker, C.J. & Stenseth, N.C. (2005). Using the satellite-derived NDVI to assess ecological responses to environmental change, Trends Ecology and Evolution, 20(9) 503–510. doi 10.1016/j.tree.2005.05.011. Pratt, D.J., Greenway, P.J. & Gwynne, M.D. (1966). A classification of East Africa Rangeland, with an Appendix on terminology. Journal of Applied Ecology, 3(2), 369–383.
Sakamoto, T., Yokozawa, M., Toritani, H., Shibayama, M., Ishitsuka, N. & Ohno, H. (2005). A crop phenology detection method using time-series MODIS data, Remote Sensing of Environment, 96, 366–374. doi:10.1016/j.rse.2005.03.008.
Solano, R., Didan, K., Jacobson, A. & Huete, A. (2010). MODIS Vegetation Index User’s Guide (MOD13 Series), Version 2.00, May 2010 (Collection 5), The University of Arizona 1–38. http://vip.arizona.edu.
Tache, B. & Oba, G. (2010). “Is Poverty Driving Borana Herders in Southern Ethiopia to Crop Cultivation?” Hum Ecol., 38, 639–649. doi: 10. 1007/s1075-010-9349-8.
CHAPTER FIVE
136
Tefera, S., Snyman, H.A. & Smit, G.N. (2007). Rangeland dynamics in southern Ethiopia: (1) Botanical composition of grasses and soil characteristics in relation to land-use and distance from water in semi-arid Borana rangelands. Journal of Environmental Management, 85, 429–442. doi:10.1016/j.jenvman.2006.10.007.
Tian, F., Fensholt, R., Verbesselt, J., Grogan, K., Horion, S. & Wang, Y. (2015). Evaluating temporal consistency of long-term global NDVI datasets for trend analysis. Remote Sensing of Environment, 163, 326–340. doi:10.1016/j.rse.2015.03.031.
Todd, S.W., Hoffer, R.M. & Milchunas, D.G. (1998). Biomass estimation on grazed and un-grazed rangelands using spectral indices. International Journal of Remote Sensing, 19(3), 427–438.
UN. (2011). Global drylands: A UN system-wide response. Prepared by the Environment Management Group, Chapter 1- 4, pp.14–129. UNEP. (2009). Climate change in the African drylands: Options and opportunities for adaptation and mitigation. UNEP, UNCCD and United Nations Development Programme. UNON Publishing Services Section, Nairobi, ISO 14001:2004 – certified, pp. 17–44. Vrieling, A., de Beurs, K.M. & Brown, M.E. (2011). Variability of African farming systems from phenological analysis of NDVI time series, Climate Change, 109, 455–477. doi:10. 1007/s10584-011-0049-1. WRI. (2000). Pilot Analysis of Global Ecosystems Grassland Ecosystems. White, R.P. Murray, S. & Rohweder, M. (Eds.), World Resources Institute, 1–70. http://www.wri.org/wr2000.

CHAPTER SIX
137
6. General discussion of the methods and findings of the study
6.1. Introduction
This study investigated the extent and nature of land use and land cover changes in the Borana
rangeland, because land use and land cover changes can be regarded as the major cause of
greenhouse gas emissions and changes in the carbon sink potential of rangeland areas. The study
comprises a series of four papers:
- a review of greenhouse gas emissions and carbon sink potentials in African rangeland
ecosystems,
- an analysis of the land conversion dynamics in the Borana rangelands of Southern
Ethiopia: An Integrated Assessment Using Remote Sensing Techniques and Field Survey
Data,
- an analysis of the determinants of land use change for cultivation expansion at Darito
agro-pastoral rangeland in Borana Ethiopia using GPS/GIS and multiple linear regression
modelling, and
- an analysis of changes on vegetation using phenological observations of crops, rainfall
and NDVI data in the Borana rangelands, Ethiopia.
6.2. Methods and key findings
In this general discussion, “cultivated land” means all crop fields cultivated by farmers to
produce agricultural crops and where the previous “natural” or spontaneous vegetation has been
removed to make way for cropping. In contrast, “rangeland” refers to all land where the
“natural” or spontaneous vegetation has not been removed, thus comprising the categories
grassland, bushland, woodland, and shrub/grass (with seasonal water logging) used in the
previous chapters.
A schematic conceptual model was developed, based on a thorough literature review of
greenhouse gas emissions and carbon sequestration in rangelands (Figure 2.1), capturing the
major human land-use activities, and the major associated natural – biotic and abiotic - processes
in rangelands, and how these influence greenhouse gas emissions and carbon sequestration. The
model illustrates various pathways contributing to greenhouse gas emissions and carbon sink
capacity. The major land use systems such as livestock husbandry, agriculture activity, and

CHAPTER SIX
138
extraction of plant biomass as the main anthropogenic rangeland use activities were discussed.
Range fires are considered as an anthropogenic management tool used in both cropping- and
livestock-based rangeland for clearing bushes or removal of old senescent vegetation of low feed
quality to allow animals to graze safely. The natural activity of soil microbes is also considered
because it contributes to nutrient fluxes (both directly and indirectly). The GHGs are released
following the decomposition of biomass, while macro-decomposers insects such as termites
release CH4 and CO2 during digestion of feed ingested hence adding to carbon stock dynamics.
Similarly, high temperature and low precipitation evidently intensify nutrient fluxes in the
rangelands (Lal 2004). Therefore, human actions on land and natural processes in ecosystem are
interlinked and they have potential to influence emissions and sink relationships.
A number of studies exist in the scientific literature describing the impacts of change in land use
(from natural landscape to agricultural use) on GHG emissions and carbon sink potential (Conant
et al., 2001; Guo & Gifford 2002; McDermot & Elavarthi 2014). Depending on the type of land
use change, the pathways and the resulting impacts can be very different. Bush-clearing removes
above ground plant biomass and below ground bush- and tree-root biomass will be decomposed
and the carbon bound will enter a more short term cycle (Lal 2002). Crop farming will reduce
soil organic matter because the soil lies bare at times during the year and will hence contribute to
the volatilization of stable carbon pools (Lal 2015). Water holding capacity has been shown to be
reduced in cropland as compared to ecosystems covered by permanent vegetation (Lal 2004).
Permanent grassland ecosystems have shown to have the capacity to store soil organic carbon
(Neely et al., 2009). Land-use planners and decision makers must hence be able to constantly
monitor land-use changes in order to make informed decisions on future rangeland use and likely
effects on emissions and carbon stocks. Rangelands are used by various interest groups; many
different stakeholders are usually involved (Reid et al., 2014). Land-use is therefore
heterogeneous and even differs between regions and locations at relatively small scales.
Therefore, generating site specific information about land use and land cover changes is needed
to guide decisions on rangeland management which aim to offset greenhouse gas emissions and
enhance carbon sink potential (Ciais et al., 2011; Reynolds et al., 2011; Bestelmeyer et al.,
2015).

CHAPTER SIX
139
Land use and land cover changes were therefore analysed using remotely sensed data in five
locations on the Borana rangelands, while socio-economic information investigated the main
drivers behind the changes. Crop cultivation is becoming an important land use option for
Borana agro-pastoralists in Southern Ethiopia and the area of land under cultivation has been
increasing over time. The land cover analyses showed to what extent cropland has encroached
onto rangeland from 1985 to 2011 (Table 3.2 and 3.3). Cultivated land has increased (+ 12.49%)
much in Darito on land formerly covered by spontaneous vegetation and grassland, and the
proportion of bushland decreased (-10.04%) (Table 3.2 and Figure 3.2). Compared to the land
cover changes in the sites around Mega (Figure 3.3), there were slight decreases and increases in
cultivated land (± 3%), while bushland decreased to a much larger extent than in Darito (up to -
31.32 %) (Table 3.3). We could also detect an increase in grassland and shrub/bushland with
seasonal floods in the low-lying areas of the rangeland (Figure 3.3). Relating to the cause/effect
pathways shown in the schematic model (Figure 2.1), it can be assumed that the observed land
cover changes have the potential to contribute considerably to greenhouse gas emissions and to a
decrease of carbon sink capacity in the respective areas. Slash and burn is a common practice to
clear farms in preparation for new fields and certainly contributes to GHG emissions and a
decrease in the proportion of vegetation biomass and carbon sink potential. On the other hand,
conservation measures such as soil water conservation, composting manure, and establishing
enclosures (as they have been adopted by Did mega and Haralo agro-pastoralists), may decrease
emissions and increase carbon sink potential. However, in areas where agro-pastoralists do not
engage in either of the above practices, increased cultivation activities will have severe effects on
carbon sink potential. Therefore, actions to reduce emissions associated with land use and land
cover changes and to enhance sink capacity of terrestrial ecosystems are important in the
mitigation of climate change (IPCC 2007). Conservation practices (if employed strategically),
may have the potential to cushion– though probably not to fully reduce- the effect.
Amongst the evidence for the impacts of cultivation on rangelands are the expansion of gully
erosion and an increase in bare land, following both a growth in cultivation as shown in this
analysis and grazing pressure over the past decades (Coppock 1994). Areas with increased bare
land are close to areas with high cropland encroachment into rangeland (cf. Figure 3.2 and 3.3).
Apart from that, fertilizer use (e.g. Diammonium phosphate (DAP) (NH4)2HPO4) in these semi-
CHAPTER SIX
140
arid to sub humid rangelands could exacerbate emissions if this added fertilizer is not used by
plants and N-volatilization occurs (Lal 2001). The observed cultivation activities (and their
management) decrease levels of soil organic carbon stored in the rangelands and cause a
deterioration of the ecosystem. Extraction of wood for charcoal production, construction and
fencing is another cause of vegetation loss. The observed land use can contribute to GHG
emissions and deterioration of carbon sink capacity across the sites (Figure 2.1). These findings
are important to rangeland development practitioners because they need to design actions to
enhance carbon sequestration capacity for each specific site.
While rainfall records did not correlate with the spatial and temporal trends of the increased
number of new farmers participating in cultivation from 1975 to 2011 (Figure 3.7), the intensity
of drought during the 1980s and 1990s possibly changed land use. Information from
participatory surveys helped to ascertain the events associated with droughts such as shrinking
pasture, livestock mortality, and food shortages, recalled by the agro-pastoralists. These findings
are in accordance with Desta and Coppock (2004); Solomon et al. (2007); Tache and Oba
(2010), who documented that farming activity in the Borana rangelands is viewed as a strategy
pastoralists employ to rebuild their livestock-based economies- especially after incidences of
drought that worsened pasture, livestock production and led to livestock losses. Apart from that,
the social economic surveys help in elucidation the temporal trend for increasing demand for
cultivation land in the five study areas (Figure 3.5). This could be linked to events such as policy
changes during the 1970s, land tenure and privatization of pastoral land into ranches,
demographic changes and income differences. Based on the present analyses, it can be deduced
that the socio-economic and environmental constraints have largely contributed to land use and
land cover changes in the area. Therefore, policy makers and rangeland managers can use this
information as an input to devise more specific policy options for the improvement of rangeland
management in the Borana. Geo-spatial, social, economic and rainfall analyses assisted in
detecting the nature and extent of land cover changes, the driving forces behind land use changes
and their ecological effects in the five study sites on the Borana rangeland.
As shown in the previous section, cropland expansion onto rangelands was most obvious in
Darito. In all other study sites, cropland had either not expanded or had only marginally

CHAPTER SIX
141
expanded onto rangeland (cf. Table 3.2 and 3.3). Of all five study sites, the cropland expansion
at Darito was the largest and mostly encroached onto grassland and bushland (Figure 3.2). Thus
monitoring the characteristics of land selected for agriculture over the period 1985 to 2014
seemed the most fitting and specific way of monitoring retrospective cropland expansion into
rangeland. A combination of methods, such as participatory mapping using a global positioning
system (GPS), were used to locate and generate polygons of land areas acquired by farmers for
crop farming. Using surface and overlay analyses by ArcGIS, thematic map layers such as soil,
slope, elevation, rainfall, and dry-river drainage were incorporated and linked to farming pattern.
Accordingly, as shown in chapter four, the method shows how changes in land use (at higher
resolution), based on farmers' information and participatory GPS mapping could be recorded.
The method is potential in landscape management as the trends in cultivated areas expansion
could be mapped and to predict the direction of changes after combining other thematic maps
layers (Figure 4.4). The method enabled the study to quantify the years in which and the number
of hectares of rangeland was taken into cultivation (Figure 4.3) Thus, other events such as
droughts, policy changes or population growth within a given community could be linked to
these changes. Comparing the methods used in chapter three, change detection computed
changed areas within a specified time and over a larger scale (Figure 3.2 and 3.3) while the
participatory GPS mapping focused on a higher spatial resolution. The methods in chapter four
permitted to connect of farming expansion with geo-bio-physical conditions such as soil, rainfall,
distance from the dry seasonal river, slope and elevation (Figure 4.4), and also indicated the land
cover types most often converted for agriculture (Figure 4.5). The factors identified could limit
or permit land use changes in any terrestrial ecosystem. For example, Li et al. (2013)
demonstrated how biophysical conditions in the Jinn river catchment area in China influenced
land use changes.
Moreover, the study could characterize ages of farms under cultivation in relation to size of land
area and elevation (Figure 4.7). This information is useful to rangeland managers because
knowing the location of old and new farms fields and sizes could help to identify in which years
the cultivation activities increased substantially. Indeed, the methods used in chapter three and
four demonstrated how land use change process can be studied at different spatial and temporal
scales, and offered a more comprehensive understanding of the process. In formulating land use

CHAPTER SIX
142
policy and designing strategies for resource management, evidence from local to national level is
essential in guiding decisions. Land use change is influenced by many different factors and
consequently is very site specific (Spera et al., 2014). As demonstrated in chapter four, slope and
elevation in particular were significant predictor variables in influencing cultivation expansion.
In addition, due to heterogeneity in rangeland ecosystems, incorporating other possible
determining factors such as the presence of woody vegetation or crown structure –would have
been useful in characterizing farming pattern. For example, the presence of grassland, bushland
and woodland may have had different influences on farming expansion in the study area.
However, we did not quantify crown cover or the proportion of woody vegetation in this study. If
remote sensing data such as that from LiDAR -data could be used for quantification it will help
to assess how patterns of vegetation influence land use in ecosystems (Goetz et al., 2009).
The study so far has shown that land use changes occur heterogeneously and that land use
planners need site specific information about land use trends on the ground at an appropriate
spatial and temporal resolution. This information should be available at low cost when
attempting to reconcile income and livelihood considerations for the population on national (or
even regional) and emission reduction and carbon sequestration targets. Vegetation index data
(NDVI) is continuously provided by satellites systems and are available at fortnightly intervals
with a large spatial coverage. Chapter five therefore demonstrated how NDVI data in
combination with rainfall data, cropping calendars and crop phenology observation could be
used as a purely remote sensing-based monitoring system for land use changes. In order to detect
the dynamics in land use in the study areas, samples were taken from widely agro-pastoral areas
and a mix of purely-pastoral and agro-pastoral areas. The vegetation community identified
includes woodland, bushland, and grassland together with cultivated land covered by crops.
NDVI units were computed and plotted over a whole vegetation cycle using pixels that were
known to depict cultivated land (Figure 5.12). These NDVI timelines were then correlated with
phenological pattern of crops on cropland throughout the vegetation period; the idea being that
during times when land was prepared for planting, cultivated land would be bare and would thus
have a considerably different NDVI value from all other land cover types still covered with
spontaneous vegetation. The phenological information of crops allowed the vegetation to be
characterized using minimum and maximum NDVI scores (Figure 5.11). Classification of

CHAPTER SIX
143
vegetation using NDVI median values was consistently carried out for the years 2002 and 2012
to determine the extent of changes in vegetation. Change detection revealed pixels changed from
one vegetation cover type in 2002 but which had been altered to another vegetation type by
2012. The extent of loss and gain could thus be shown and linked with the existing land use in
the areas (Figure 5.8 and 5.9). The negative NDVI trends corresponded to loss of vegetation in
areas and those lands were converted to cultivation or the vegetation was removed for various
causes (i.e. firewood, charcoal production and building purposes).
In widely agro-pastoral areas, the NDVI residuals were higher than in purely-pastoral and agro-
pastoral areas, where a negative NDVI trend was observed (Figure 5.5). Rainfall records were
useful in explaining the effects on vegetation dynamics. In earlier studies, (Funk & Brown 2006;
Herrmann et al., 2005) stated that rainfall is the major factor influencing vegetation greening in
arid and semi-arid areas. However, this study found that (as distinct from their interpretations)
rainfall was only a significant proxy for predicting vegetation greening for a few of the years
observed (Table 5.2). Despite this relatively insignificant correlation for many of the years
tested, rainfall could still be one influencing factor but there are other factors, (for example: soil
moisture and temperature) that could also have influenced vegetation distribution, growth form
and composition and hence greening. Using NDVI proxy as an indicator of land cover and land
use change in this study, the results from the analyses attempt to show the extent of vegetation
changes and associated causes. Such information could assist in estimating above ground green
biomass and rangeland productivity if combined with other ground data. Rangeland managers
can identify degradation trends and propose pathways to enhance conservation (Pettorelli et al.,
2014). Specifically, the satellite data used in chapter three enabled the classification of land
cover types but had a limited ability to detect greening trends due to the heterogeneity of
rangelands and a resolution. By introducing the time series moderate resolution vegetation index
data in chapter five, the greening trends and (in particular) the extent of cultivation expansion
onto natural rangelands and the loss of natural vegetation could be identified. The temporal
resolution of MODIS data at 16 days' composite was sufficient for observing the growth cycle of
crops using phenology pattern and helped to differentiate cultivated land with crops from natural
rangeland using NDVI scores because they differ between vegetation types. Apart from that,

CHAPTER SIX
144
degraded areas could also be detected. Such information illustrates the potential for carbon
storage on vegetation upon change in land use and management.
6.3. Study limitation and suggestions
The methods and data sources used were effective; however, the study design and
implementation had some shortcomings and presented some challenges. The schematic model in
chapter two demonstrated the pathways exacerbating GHGs emissions but did not provide
quantified data about the emissions and carbon sequestration for each specific land use. Though
it is expensive to generate such data, for inventory purposes it would be helpful to quantify site
specific GHG emitted and carbon sequestered, following a particular land use alternation and/or
management changes. Livestock census data was not included in the analysis in chapter three,
because of inadequacy of household specific data and inaccuracy of records. The participatory
GPS mapping of cropping patterns in chapter four only covered those fields under cultivation by
the respective farmer at the time of the study but excluded those fields which may have been
under cultivation previously but had been abandoned again. Including a record of such fields in
the participatory exercise would have improved the strength of the method and to understand the
conditions of those fields. Houghton and Goodale (2004) showed that carbon may re-accumulate
in those abandoned cropland areas as the vegetation in the ecosystem reverts to its originality. As
shown in chapter five, the performance of MODIS NDVI data in characterising vegetation was
insufficient to generate a mathematical algorithm for automated classification of vegetation types
due to mixed pixel effects, e.g. croplands extending into grassland or bushland and where the
landscape is very heterogeneous especially during the dry season months in the September 2002
and 2012 maps. If a management tool for real-time observation and differentiation of crops from
natural rangeland were to be set up it would require NDVI data of higher spatial resolution,
multispectral bands, or data from the Hyperion instrument on the EO-1 (Earth Observing-1) so
that the aforementioned mixed pixel effects could be reduced and the distinction would hence
become sharper.
6.4. Conclusion and recommendations
This thesis has produced comprehensive information about the dynamics in land use and the
resulting land cover and vegetation changes from selected pastoral and agro-pastoral areas in the
Borana rangeland. The study showed the extent of cultivation expansion and the corresponding

CHAPTER SIX
145
loss of vegetation. Such changes reduce ecosystems' resilience, soil organic carbon storage
potential and decrease the capacity of rangeland to sink carbon. The expansion of bare land into
the rangeland is connected to lack of or inadequate management practices. The local dynamics
observed in this study has both short and long term contribution on global change. It is important
for rangeland stake holders to consider the influence of internal and external forces whilst
revising land use policy. In concluding the interpretation of the findings of this study, the
methods used were effective but the further steps are suggested: (a) quantifying the below
ground carbon which is more decisive for the overall carbon sink potential in more grass
dominated rangeland where less woody vegetation is present, (b) examining the trade-offs of
privatizing rangelands into plantation or ranches and resultant effects on temporal land use, (c)
estimations of GHG emissions related to a particular land use is necessary for greenhouse gas
inventory and mitigation options, and a final point, (d) harnessing local knowledge and
integrating it with scientific information is crucial for understanding ecosystem dynamics in a
holistic way.

CHAPTER SIX
146
References
Bestelmeyer, B.T., Okin, G.S., Duniway, M.C., Archer, S.R., Sayre, N.F., Williamson, J.C. & Herrick, J.E. (2015). Desertification, land use, and the transformation of global drylands. Frontiers in Ecology and the Environment, 13(1), 28–36. doi:10.1890/140162.
Ciais, P., Bombelli, A., Williams, M., Piao, S.L., Chave, J., Ryan, C.M., Henry, M., Brender, P. & Valentini, R. (2011). The carbon balance of Africa: synthesis of recent research studies. Phil. Trans. R. Soc. A. 369, 1–20.
Conant, R.T., Paustian, K. & Elliott, E.T. (2001). Grassland management and conversion into grassland: effects on soil carbon. Ecological Applications, 11(2), 343–355.
Coppock, D.L. (1994). (Ed.). The Borana Plateau of Southern Ethiopia: Synthesis of pastoral research, development and change, 1980 -91.ILA (International Livestock Centre for Africa), Addis Ababa. Ethiopia, 393. Desta, S. & Coppock, D.L. (2004). Pastoralism under pressure: Tracking system change in southern Ethiopia. Human Ecology, 32, 485–486. Funk, C.C. & Brown, M.E. (2006). Intra-seasonal NDVI change projections in semi-arid Africa. Remote Sensing of Environment, 101, 249–256. doi: 10.1016/j.rse.2005.12.014.
Goetz, S.J, Baccini, A., Laporte, N.T., Johns. T., Walker, W., Kellndorfer J., Houghton R.A. & Sun M. (2009). Mapping and monitoring carbon stocks with satellite observations: a comparison of methods. Carbon Balance and Management, 4(2), 1–7. doi:10.1186/1750-0680-4-2.
Guo, L.B. & Gifford, R.M. (2002). Soil carbon stocks and land use change: a meta analysis. Global Change Biology, 8(4), 345–360. doi:10.1046/j.1354-1013.2002.00486.x.
Herrmann, S.M., Anyamba, A. & Tucker, C.J. (2005). Recent trends in vegetation dynamics in the African Sahel and their relationship to climate. Global Environmental Change, 15, 394–404. doi:10.1016/j.gloenvcha.2005.08.004.
Houghton, R.A. & Goodale, C.L. (2004). Effects of Land-Use Change on the Carbon Balance of Terrestrial Ecosystems. Ecosystems and Land Use Change Geophysical Monograph (Vol. 153). 85–98. doi:10.1029/153GM08 85.
IPCC. (2007). Climate Change 2007: Mitigation. Contribution of Working Group III to the Fourth Assessment Report of the Intergovernmental Panel on Climate Change [Metz, B., Davidson, O.R., Bosch, P.R., Dave, R. & Meyer, L.A. (Eds.)], Cambridge University Press, Cambridge, United Kingdom and New York, NY, USA, XXX.
Lal, R. (2001). Potential of desertification control to sequester Carbon and mitigate the greenhouse effect. Climate Change, 51, 35–72.

CHAPTER SIX
147
Lal, R. (2002). Soil carbon dynamics in cropland and rangeland. Environmental Pollution, 116(3), 353–362. doi:10.1016/S0269-7491(01)00211-1.
Lal, R. (2004). Soil carbon sequestration impacts on global climate change and food security. Science (New York, N.Y.), 304(5677), 1623–1627. doi:10.1126/science.1097396.
Lal, R. (2015). Restoring Soil Quality to Mitigate Soil Degradation. Sustainability, 7(5), 5875–5895. doi:10.3390/su7055875.
Li, Z., Liu, W. & Zheng, F. (2013). The land use changes and its relationship with topographic factors in the Jing river catchment on the Loess Plateau of China. SpringerPlus, 2(Suppl 1):S3. 1–6. doi:10.1186/2193-1801-2-S1-S3.
McDermot, C. & Elavarthi. S. (2014). Rangelands as Carbon Sinks to Mitigate Climate Change: A Review. Journal of Earth Science & Climatic Change, 05(08), 1–12. doi:10.4172/2157-7617.1000221.
Neely, C., Bunning, S. & Wilkes, A. (2009). Review of evidence on drylands pastoral systems and climate change: Implications and opportunities for mitigation and adaptation. Land and Water Discussion Paper 8. (Eds.). FAO, Rome, Italy, 1–38.
Pettorelli, N., Safi, K. & Turner, W. (2014). Satellite remote sensing, biodiversity research and conservation of the future. Philosophical Transactions of the Royal Society Biological Sciences, 369(20130190), 1–5. doi: http://dx.doi.org/10.1098/rstb.2013.0190.
Reid, R.S., Fernández-Giménez, M.E. & Galvin, K.A. (2014). Dynamics and Resilience of Rangelands and Pastoral Peoples Around the Globe. Annual Review of Environment and Resources, 39(1), 217–242. doi:10.1146/annurev-environ-020713-163329. Reynolds, J.F., Grainger, A., Stafford Smith, D.M., Bastin, G., Garcia-Barrios, L., Fernández, R.J., Janssen, M.A., Jürgens, N., Scholes, R.J., Veldkamp, A., Verstraete, M.M., Von Maltitz, G. & Zdruli, P. (2011). Scientific concepts for an integrated analysis of desertification. Land Degradation & Development, 22(2), 166–183. doi:10.1002/ldr.1104. Solomon, T.B, Snyman, H.A. & Smit, G.N. (2007). Cattle-rangeland management practices and perceptions of pastoralists towards rangeland degradation in the Borana zone of southern Ethiopia. Journal of Environmental Management, 82, 481–494.
Spera, S.A, Cohn, A.S., VanWey, L.K., Mustard, J.F., Rudorff, B.F., Risso, J. & Adami, M. (2014). Recent cropping frequency, expansion, and abandonment in Mato Grosso, Brazil had selective land characteristics. Environmental Research Letters, 9(064010), 1–12. doi:10.1088/1748-9326/9/6/064010.
Tache, B. & Oba, G. (2010). Is poverty driving Borana herders in southern Ethiopia to crop cultivation? Human Ecology, 38, 639–649.
APPENDICES
148
Appendices
i. Household questionnaire A specific household questionnaire sheet used during gathering of socio-economic data of the households and probing the reasons behind land use and land cover changes 1985 to 2012: August 2012 to November 2012
Date: __________________________ Name of interviewer___________________
Location Country Region Village Address GPS Latitude Longitude Altitude
A. Respondent’s socio-demographic characteristics
[The purpose of this section is to get an insight about the general characteristics of households, social economic activities and how these variables influences resource use and land conversion]
Name 1. Age
TICK TO THE APPROPRIATE RESPONSE 2. Sex 1. M
2. F 3. Marital status 1. Single
2. Married 3. Never married
4. Education level 1. Basic primary edu. 2. Secondary edu. 3. Tertiary edu. 4. None edu.
WRITE & TICK THE APPROPRIATE RESPONSE 5. Size household (no).
5.1 Childrens (1month to 18 yrs) 1. M 2. F 5.2 Young (19-45yrs) 1. M 2. F 5.3 Adults (+45yrs) 1. M 2. F
Total 6. Number of pupils/children go to
school 1. M
2. F
TICK TO THE APPROPRIATE RESPONSE 7. What do you do for living? 1. Crop farming
2. Livestock farming 3. Crop & livestock farming 4. Petty trade 5. Wage employment 6. Others/specify
SOURCES OF INCOME 8. What is the main source of
income? 9. How much do you earn per
month
1. 2. 3. 4.
ETB/ $

APPENDICES
149
B. Main economic activity specifically Crop Farming Activities [This section probes the economic activities, specifically historic trends in farming activities. The intention is to know when cultivation started, how it expands and the reasons. The cultivation is operated in terms of range management and the likely effects of crop farming on rangelands]
10. Do you practice crop farming? 1. Yes [ ], 2. No [ ]
11. If yes, when did you start farming activities? [______________] 12. What type of economic activity you have been doing over the past years?
1. __________, 2. ___________, 3. ___________, 4.____________, 5. ____________ 13. Why did you decide to start grow crops? What drivers behind this?
1. _____________, 2. __________________, 3. ____________________ 14. What is the size of your farm land?[______________________________hectare] 15. What types of crops do you cultivate/grow?
1. _________, 2. __________, 3. ___________, 4. ______________ 16. Why do you grow these crops?
1. __________, 2. ___________, 3. ___________, 4. __________, 5. ___________ 17. How much do you harvest per ha/convert local estimates into hectare for accuracy estimates?
1. _____________, 2. ________________ 18. How often do you cultivate in this area/land/farm?
1. Every year [ ], 2. After one year [ ], 3. After two years [ ], 4. After three years [ ], 5. After four years [ ], 6. Others /specify [ ]
19. Do you think that the piece of land you use for cultivation is enough to satisfy your daily needs? 1. Yes [ ], 2. No [ ], 3. Others/specify [ ]
20. If not, what do you do to acquire additional piece(s) of land? 1._______________, 2. ________________, 3. _________________
21. Do you use any of the following agricultural/agro-forestry/farming techniques in the fields you cultivate?
21.1. Tree grafting [ ], 1.Yes [ ], 2. No [ ], 3. N/A to what I cultivate [ ] 21.2. Composting [ ], 1.Yes [ ], 2. No [ ], 3. N/A to what I cultivate [ ] 21.3. Seedling Nurseries [ ], 1.Yes [ ], 2. No [ ], 3. N/A to what I cultivate [ ] 21.4. Direct sowing [ ], 1.Yes [ ], 2. No [ ], 3. N/A to what I cultivate [ ] 21.5. Water harvesting [ ], 1.Yes [ ], 2, No [ ] 3. N/A to what I cultivate [ ] 21.6. Terracing [ ], 1.Yes [ ], 2. No [ ], 3. N/A to what I cultivate [ ] 21.7. Soil water conservation practices [ ], 1.Yes [ ], 2. No [ ], 3. N/A to what I cultivate [ ]
22. If not, how do you involve in managing rangeland? 1.______________, 2. ______________, 3. ______________, 4. _____________
23. How do you prepare your land for cropping? 1. Slush and burn [ ], 2. Ploughing [ ], 3. Sowing without clearing [ ], 4. Burning [ ], 5. Others/specify [ ]
24. In either of the above, do you think this is the best way of managing land? 1. Yes [ ], 2. No [ ]
25. Please, explain how you manage your land or farm. 1. _____________, 2. ______________, 3. ____________________
26. Have your ever experience any problems from grazing livestock’s in your crop farm(s)? 1. Yes [ ], 2. No [ ]
27. If yes, what do you do to protect your crops from grazing livestock? 1. ____________________, 2. ________________, 3. ____________________
28. What do you think needs to be done to improve farming activities? 1. ______________, 2. _____________, 3. _____________, 4. _______________
29. Are there large scale farming activities in this village/community? 1. Yes [ ], 2. No [ ]
30. If yes, what types of crops are grown here? 1. ___________________________, 2. ________________________________
31. If yes, when did they begin? _______________________________ 32. What do you think would be the likely benefits or losses as a result of larger scale farming in this area?
1. ___________________, 2. _____________________, 3. ___________________ 33. Are these farms owned by government or not?
1. Yes [ ], 2. No [ ], 3. Don’t know [ ] 34. Do you know if there is any restriction that controls or govern land use pattern in this area?
1. Yes [ ], 2. No [ ], 3. Don’t know [ ] 1. If yes, what are those restrictions? 1, ___________, 2._________, 3. ________, 4.___________
APPENDICES
150
C. Livestock farming [This part intends to capture information on livestock ownership, grazing patterns and management changes]
35. Do you have livestock? 1. Yes [ ], 2. No [ ]
36. If yes, how many and type cattle’s you have? Number livestock owned per
household Cattles Goats Sheep Camel Donkey Total
Total 1. Where do you graze? 1, _________, 2. ____________________, 3. _________________ 37. How do you graze?
1. Herding [ ], 2. Tethering [ ], 3. Zero grazing [ ], 4. Paddocking [ ], 5. Rotation grazing [ ] 38. Are there any restrictions to grazing land?
1. Yes [ ], 2. No [ ] 1. If yes, what are these? 1, _____________, 2. __________________, 3. ___________________ 39. Do you have enough grazing land?
1. Yes [ ], 2. No [ ] 40. If no, would you like to reduce the numbers of cattle you have so that you can be able to feed them?
1. Yes [ ], 2. No [ ] 41. Do you cultivate fodder for your cattle’s?
1. Yes [ ], No [ ] 42. If yes, please mention what trees fodder or grass you cultivate for your cattle.
1.__________________, 2. _____________________, 3. ____________________ 43. How do you manage grazing? Explain please.
1.___________________, 2. __________________, 3. ____________________ 44. Do you involve in land management?
1. Yes [ ], No [ ] 1. If yes, how do you involve? 1, ______________, 2. ____________, 3. __________________
45. Does this village have a land use plan? 1. Yes [ ], No [ ], 3. Don’t know [ ]
46. What policies govern natural resources uses and management in this area? 1. _____________, 2. _____________, 3. _______________, 4. _______________
47. In your views, what do you think is needed to be done to improve range management and livelihoods? 1. _____________, 2. _____________, 3. _______________, 4. _______________
48. List the names of tree species found in this area, conservation and uses.
No. Type of tree species (local or scientific name)
Uses Conservation status
Rank
1 2
49. List the names of wild animals found here and the uses. ________, 2. _________, 3. ____________

APPENDICES
151
ii. Key informant interviews local communities
Topic: Land uses, crop farming and its impacts on carbon sequestration in the Borana rangeland (1980-2011). (30 – 45 minutes)
Objectives:
a) To delineate the historical and the current trends in land uses and b) To specifically analyse how farming in the rangelands expand over time.
1) What changes have you seen in terms of land uses? (1980-2011) 2) What natural resources do you have in this community? 3) How are they distributed? 4) How do you classify land in this community/region? 5) How do you use? 6) How is it managed? 7) Which regulations control land uses in this area? 8) Is there farming activities in this community/area? 9) When did it start? 10) What crops are grown? 11) How many seasons do you have? 12) How big the farms are? 13) Could you please locate where exactly the areas of farmlands were? 14) Does crop farming increase over time or there is no different? Changes (1980-2011) 15) What do you think about this type of land use? 16) Who owns these farms? 17) Does cropping activities have caused dependence or independence of other activities? 18) What problems have you experienced since the beginning of farming activities? 19) What restrictions are in place managing land use and/ from cropping? 20) What mechanisms are commonly applied in managing farms 21) Is it good for the rangeland? 22) It there large scale farming activities in the areas? 23) Who owns those farms? 24) What benefits do you get out of this larger scale farming activities? 25) What are the challenges facing rangeland management? 26) What would you recommend about land uses in the rangeland?

APPENDICES
152
iii. Key informant interviews officials
A checklist of questions used during interviewing conservation official, Kebele administrative leaders and development agency in the Borana Rangeland: August 2012 to November 2012 (30 – 45 minutes) Topic: Land uses, crop farming and its impacts on carbon sequestration in the Borana rangeland (1980-2011). Objectives:
a) To delineate and ascertain the historical and the current trends in land uses, and b) To specifically analyse how farming in the rangelands has been growing over time.
1) What changes have you seen in terms of land uses? (1980-2011) 2) What natural resources do you have in this community? 3) How are they distributed? 4) How do you classify land in this community/region? 5) How do you use? 6) How is it managed? 7) Which regulations control land uses in this area? 8) Is there farming activities in this community/area? 9) When did it start? 10) What crops are grown? 11) How many seasons do you have? 12) How big the farms are? 13) Could you please locate where exactly the areas of farmlands were? 14) Does crop farming increase over time or there is no different? Changes (1980-2011) 15) What do you think about this type of land use? 16) Who owns these farms? 17) Does cropping activities have caused dependence or independence of other activities? 18) What problems have you experienced since the beginning of farming activities? 19) What restrictions are in place managing land use and/ from cropping? 20) What mechanisms are commonly applied in managing farms 21) Is it good for the rangeland? 22) It there large scale farming activities in the areas? 23) Who owns those farms? 24) What benefits do you get out of this larger scale farming activities? 25) What are the challenges facing rangeland management? 26) What would you recommend about land uses in the rangeland?

APPENDICES
153
iv. Checklist questions for focus group discussion community members
A checklist of questions used during conducting focus group discussion interviews with community members in the sites of the Borana Rangeland: August 2012 to November 2012 (60 – 120 minutes)
Topic: Land uses, crop farming and its impacts on carbon sequestration in the Borana rangeland (1980-2011).
Objectives:
a) To delineate the historical trend of cropping activities and the current trends in land use specifically to analyse how farming in the rangelands expand over time.
b) Approach: To undertake interviews with community in the study site
1. How do you classify your land resource? 2. Could you please draw a map and locate cover land classes? (resource mapping) 3. How do you use these classes/ land cover types? 4. Why do you use this area for this purpose? 5. What changes have you seen in terms of land uses/ cover types? 6. Dou you involve in crop farming/ the trend in cropping activities in this area? 7. How many cropping seasons do you exist? 8. What type of crops grown in this community? 9. Do land reserved for farming is sufficient people’s use? 10. How do you practice and manage farming? 11. Have you seen/note any changes in terms of expansions of land uses for cropping? 12. What are the driving pressures for this expansion? 13. How does cropping influence other activities? 14. Do people settle in one area for cropping? 15. Are there any restrictions concerning land use? 16. Is there is large scale farming? 17. Are there any supports from government or social groups in supporting cropping? 18. Do you have any social groups? 19. Are there reliable markets for harvested crops? 20. What are the ownership patterns of land in this community/ regulations/ policies? 21. What are other livelihood activities in this area? 22. Transect walk to see different land cover classes/ land cover types: photos, note geographic coordinates.

APPENDICES
154
v. Rainfall sheet
A specific sheet composed of the rainfall seasons calendar that was used to interview specific cropping history of the Borana agro-pastoralists: August 2012 to December 2012 and February 2014 to May 2014
1. Site information and Name……………………………………………………………
PLOT Record Sheet
DATE----------------------.2012 Time Interviewer
PLOT NAME
GPS TRACK File Name
Latitude
Longitude
Photo File Name / No.
SOIL (Sand, Loam, Clay, Silt)
Topography/Elevation
2. Land use over time specific cropping history
YEARS CONSIDERED AS DROUGHT YEARS BY DIFFERENT SOURCES
ETP
GA
DA
YEA
R
CROP I (SEASON) CROP II (SEASON) CROP III (SEASON)
Mel
es Z
enaw
i
Hai
lem
aria
m
Des
aleg
n
2014
2013
2012
2011
2010
2009
2008
Lib
an J
alde
ssa
2007
2006
2005
2004
2003
2002
2001
2000
Abb
a G
ada
Boru
Mad
h
1999
1998
1997
1996
1995

APPENDICES
155
1994
1993
1992 A
bba
Gad
a Bo
ru G
uyo
1991
Men
gist
u H
aile
Mar
iam
1990
1989
1988
1987
1986
1985
1984
Abb
a G
ada
Jilo
Aga
1983
1982
1981
1980
1979
1978
1977
Hai
le S
elas
sie
1976
Abb
a G
ada
Gob
a B
ule
1975
1974
1973
1972
1971
1970
1969
1968
3. Land use over time specific cropping history
Delineation of croplands polygons of few farmers in the Borana rangeland (how it is growing over years either spatial or temporal)
1. Size (ha) ………………………………..year………………………. 2. Location 1…………………………………year……………………… 3. Location 2…………………………………year……………………....

APPENDICES
156
vi. Phenology sheet
A specific sheet composed of rainfall seasons and a sheet used to identify specific phenological developmental stages of crops and activities involved February to May 2014
1. Seasonal calendar according to the Borana
Months J F M A M J J A S O N D Borana Boona hagaya
(long dry season) Gaana
(long rainy season) Adolessa
(short dry season) Hagaya
(short rainy season)
2. List of activities undertaken in the fields
(a) Clearing, (b) tilling, (c) seeding, (d) weeding, (f) harvesting
Put a number that corresponds to specific activity (s) and crop phenology
Crops Haricot beans Maize Barley Teff Wheat Sorghum
Months Activ Pheno Activ Phen Activ Pheno Activ Pheno Activ Pheno Activ Pheno
Jan.
Feb.
March
April
May
June
July
Aug.
Sept.
Oct.
Nov.
Dec.
Activ. = Activities and Pheno. = Phenological developmental stage

APPENDICES
157
vii. BBCH-scale
The specific BBCH-scale used to guide during identification of the phenological developmental stages of plant/crops grown at Darito site in Borana rangeland Ethiopia February to May 2014.
Stages Principal growth stage BBCH-identification
Maize 0 seeding (dry seed) 00, 05, 07 0 germination 09 1 leaf development & tillering (two leaves, three leaves) 10-19 3 stem elongation 30-39 5 inflorescence emergence, heading 51-59 6 flowering, anthesis 61-69 7 development of fruit 71-79 8 ripening 83-89 9 harvesting (senescence) 97-99
Soybean 0 dry seed to germination (00, 08,09) 000-009 1 leaf development (10 -19) 100-119 2 formation of side shoots (21-29) 201-229-2N9 4 development of harvestable vegetative plants parts & shoot (49) 409 5 inflorescence emergence (main shoots) flower buds visible (51-59) 501-509 6 flowering main (shoots) about 40% flower opens & decline (60-69) 600-609 7 development of fruits & seeds (70-79) 700-709 8 ripening of fruits and seeds (80-89) 800-809 9 senescence, above parts of plant dead and harvested product (91-99) 901-909 Barley, wheat, teff and Sorghum 0 dry seed, cracking stage & germination 00-09 1 leaf development one to two leaves 10-19 2 tillering one to three max number of tillering detectable 20-29 3 stem elongation 30-39 4 booting (flag leaf sheath opening) 41-49 5 inflorescence emergence , heading 80% the fruit can be seen 51-59 6 flowering, anthesis the flower can be seen in inflorescence 61-69 7 development of fruit, grains reach ½ of their final size , grains reach
final stage but still green to late milk 71-77
8 ripening, grains content solid, grain hard, difficult to divide with thumbnail
83-89
9 senescence, over ripe, grain very hard, grains loosening in day-time, plant dead and collapsing, harvested products
92-99