Embed Size (px)
Citation preview
Assessing trends in observed and modelled climate extremes over
Australia in relation to future projections
Extremes in a changing climate, KNMI, The Netherlands,
14th-15th May, 2008
Lisa Alexander, Julie Arblaster and Rob Smalley
Aims
Given that changes in climate extremes have
greater impact on society and ecosystems than
changes in mean climate:
1. Can global climate models adequately reproduce
observed climate extremes over Australia?
2. If so, how are these extremes projected to change
in the future?
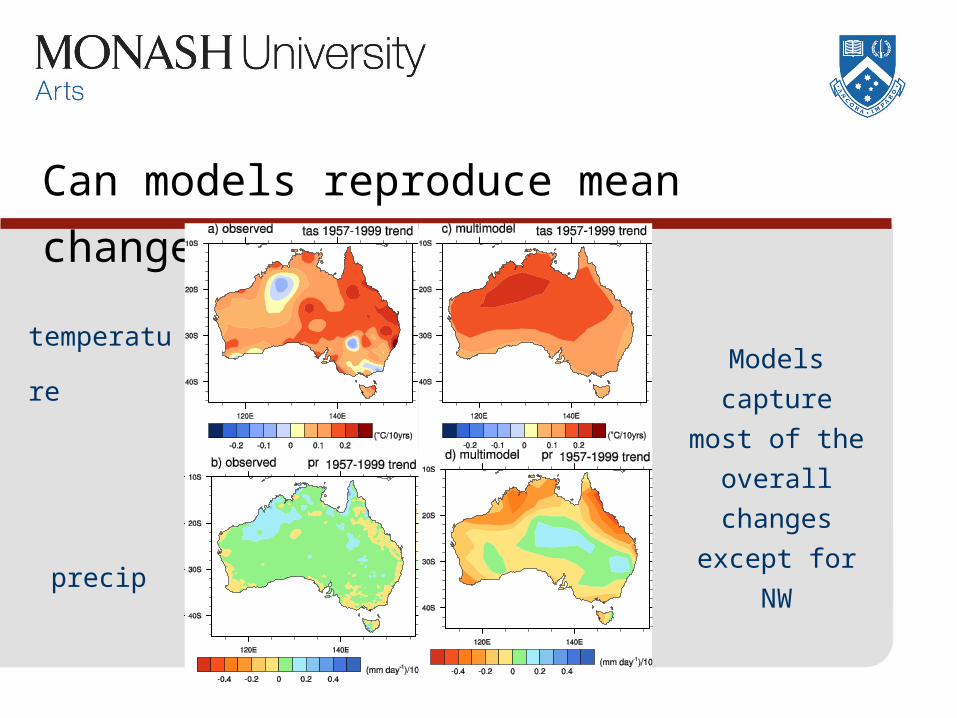
Can models reproduce mean change?
Models capture
most of the
overall
changes
except for NW
temperature
precip
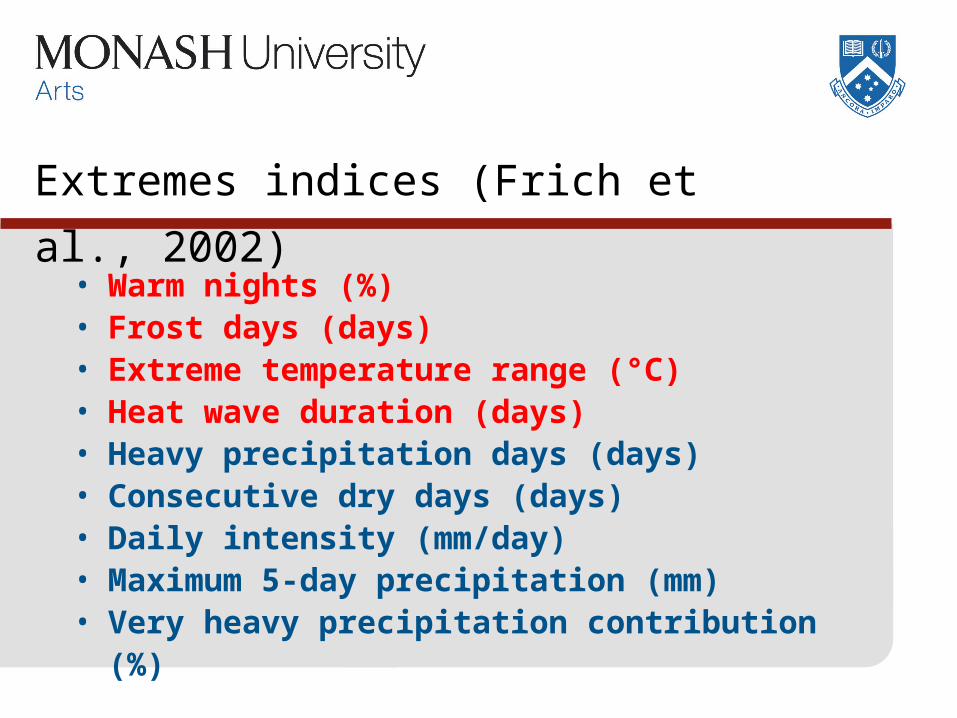
Extremes indices (Frich et al., 2002)
• Warm nights (%)• Frost days (days)• Extreme temperature range (°C)• Heat wave duration (days)• Heavy precipitation days (days)• Consecutive dry days (days)• Daily intensity (mm/day)• Maximum 5-day precipitation (mm)• Very heavy precipitation contribution (%)
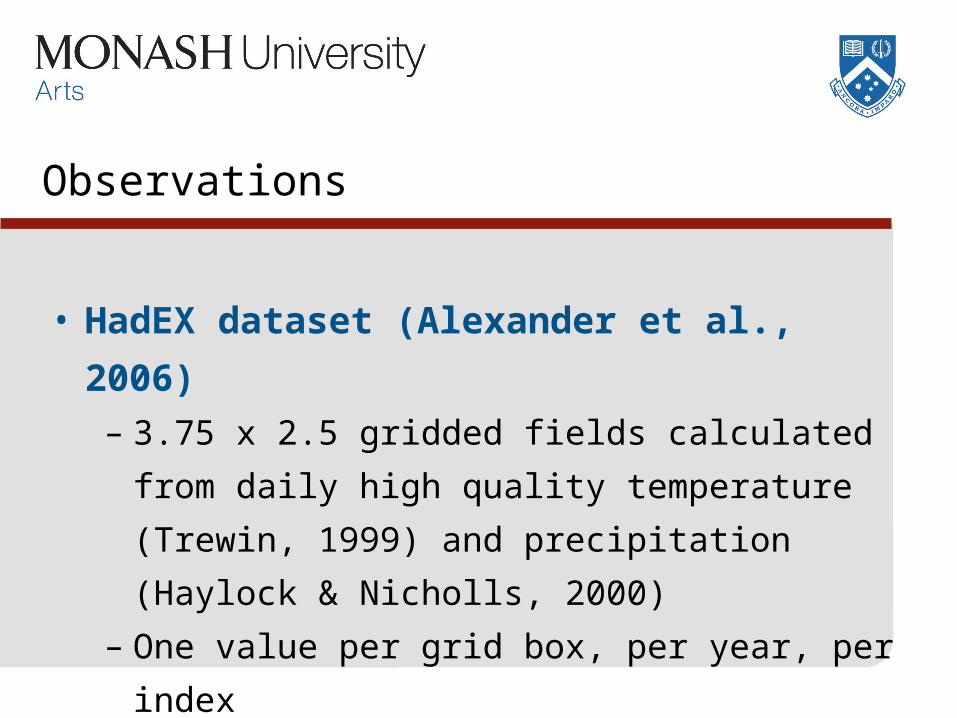
Observations
• HadEX dataset (Alexander et al., 2006)
– 3.75 x 2.5 gridded fields calculated from daily
high quality temperature (Trewin, 1999) and
precipitation (Haylock & Nicholls, 2000)
– One value per grid box, per year, per index
– www.hadobs.org
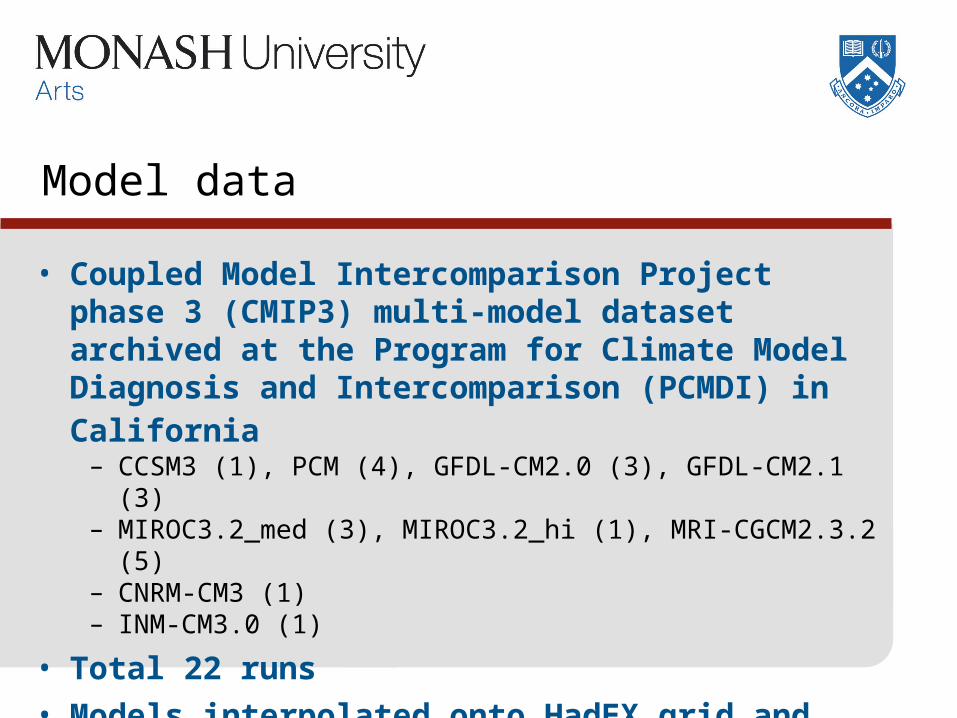
Model data
• Coupled Model Intercomparison Project phase 3 (CMIP3) multi-model dataset archived at the Program for Climate Model Diagnosis and Intercomparison (PCMDI) in California
– CCSM3 (1), PCM (4), GFDL-CM2.0 (3), GFDL-CM2.1 (3)– MIROC3.2_med (3), MIROC3.2_hi (1), MRI-CGCM2.3.2 (5)– CNRM-CM3 (1)– INM-CM3.0 (1)
• Total 22 runs
• Models interpolated onto HadEX grid and masked to observational grid points
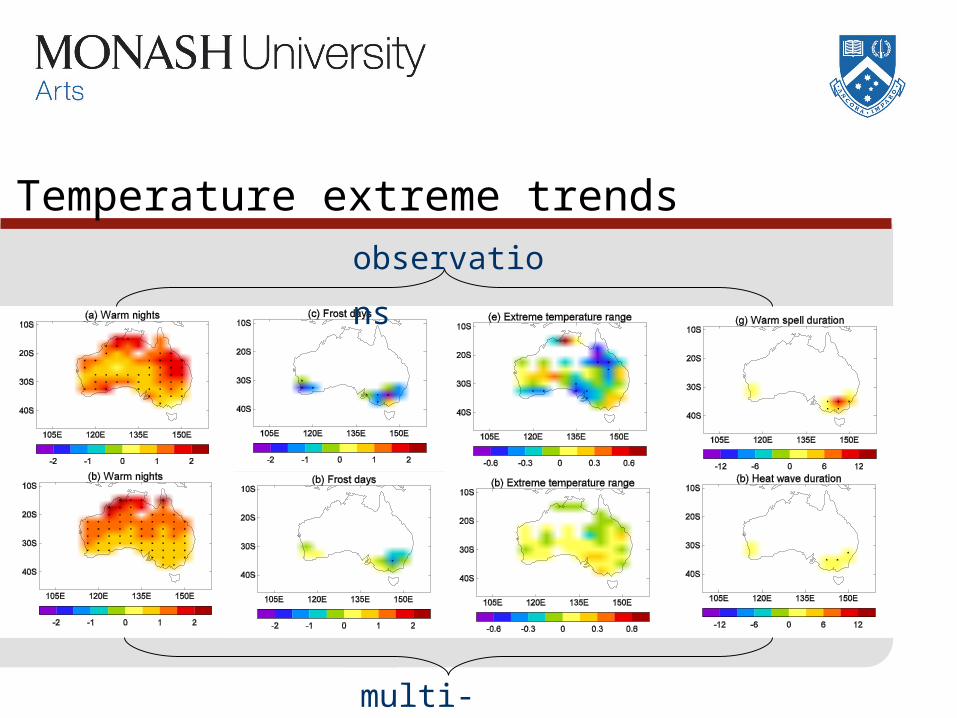
Temperature extreme trendsobservations
multi-model
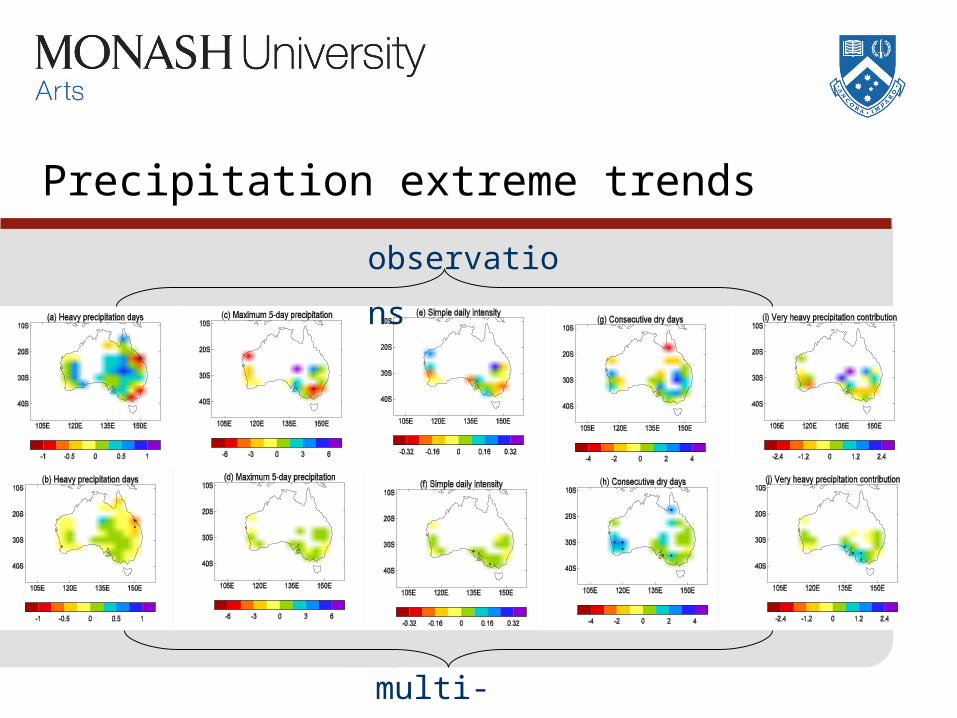
Precipitation extreme trends
observations
multi-model
data
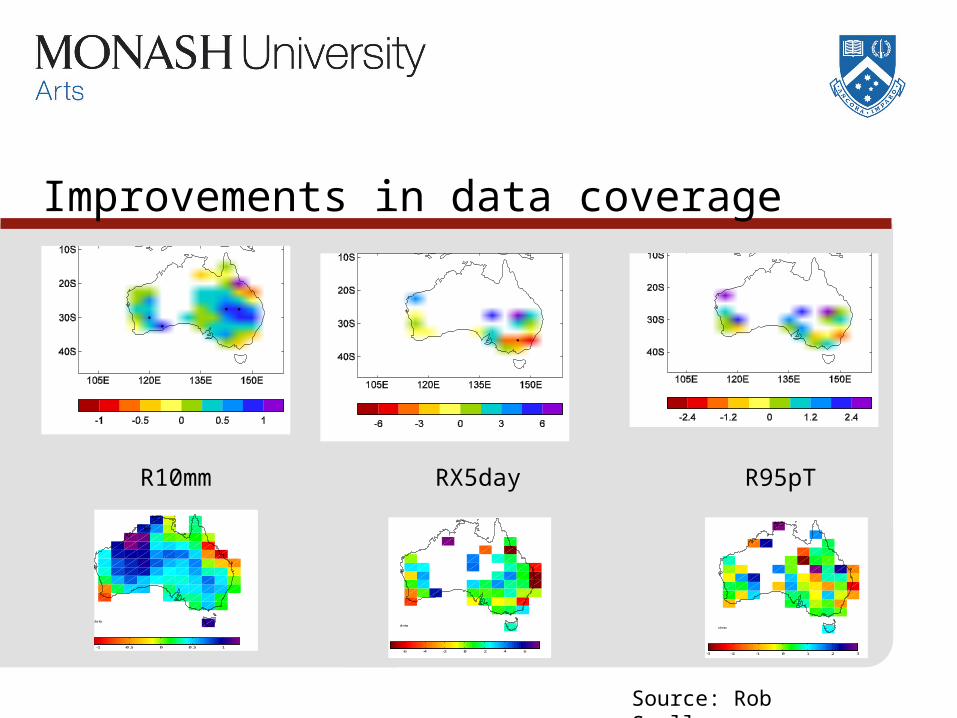
-3 -2 -1 0 1 2 3
data
-6 -4 -2 0 2 4 6
data
-1 -0.5 0 0.5 1
R10mm RX5day R95pT
Improvements in data coverage
Source: Rob Smalley
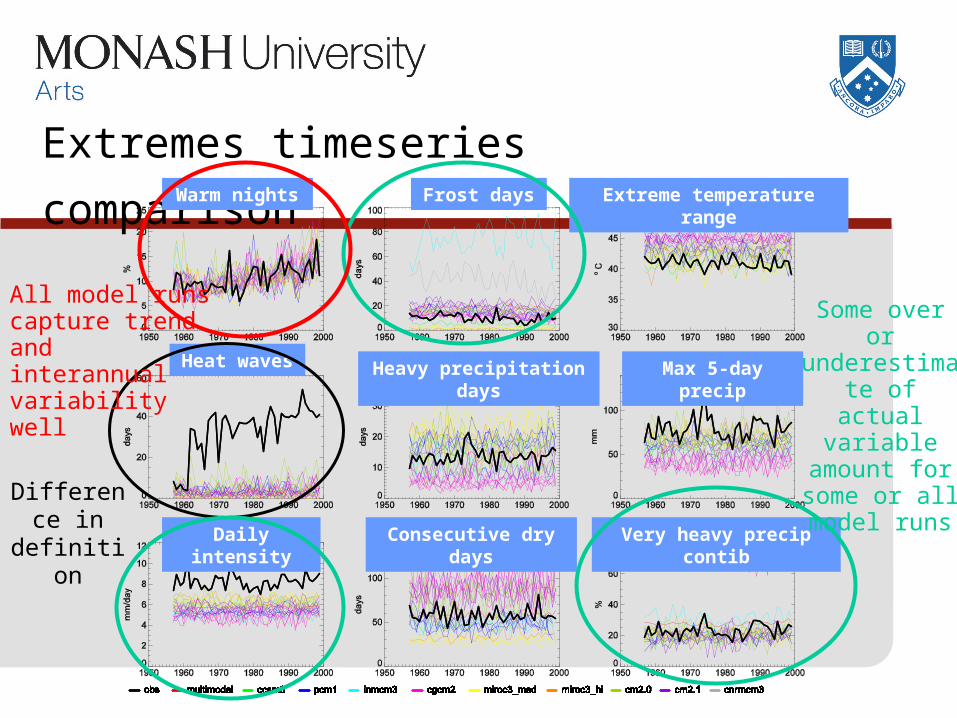
Extremes timeseries comparisonWarm nights Frost days Extreme temperature range
Max 5-day precipHeavy precipitation daysHeat waves
Daily intensity Consecutive dry days
Very heavy precip contib
Difference in
definition
Some over or underestimate
of actual variable
amount for some or all model runs
All model runs capture trend and interannual variability well
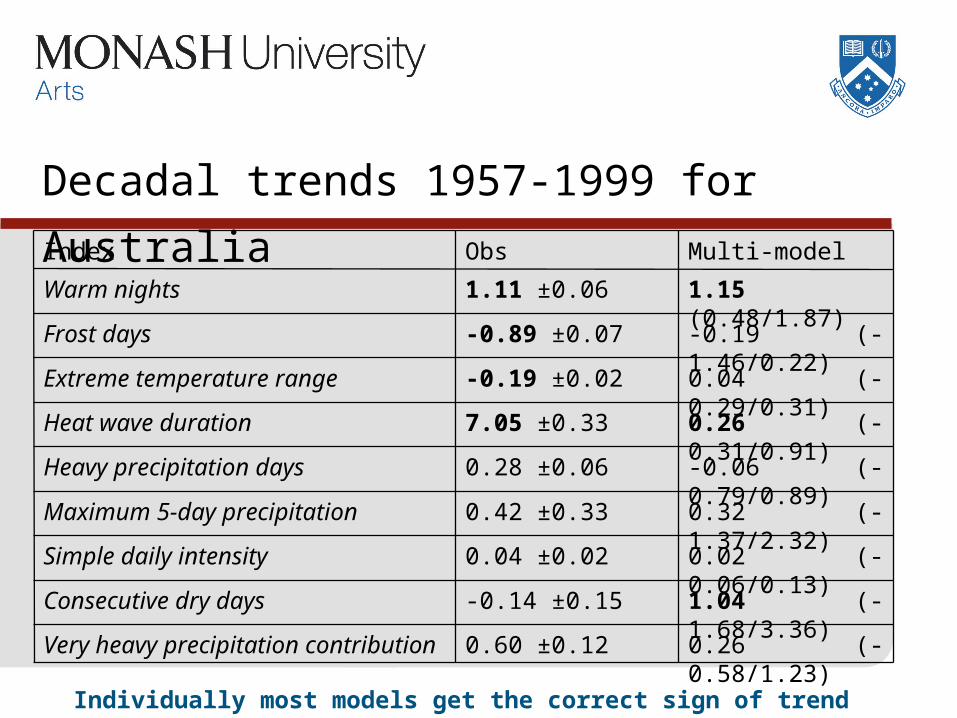
Decadal trends 1957-1999 for Australia
Individually most models get the correct sign of trend (except for CDD)
0.26 (-0.58/1.23)0.60 ±0.12Very heavy precipitation contribution
1.04 (-1.68/3.36)-0.14 ±0.15Consecutive dry days
0.02 (-0.06/0.13)0.04 ±0.02Simple daily intensity
0.32 (-1.37/2.32)0.42 ±0.33Maximum 5-day precipitation
-0.06 (-0.79/0.89)0.28 ±0.06Heavy precipitation days
0.26 (-0.31/0.91)7.05 ±0.33Heat wave duration
0.04 (-0.29/0.31)-0.19 ±0.02Extreme temperature range
-0.19 (-1.46/0.22)-0.89 ±0.07Frost days
1.15 (0.48/1.87)1.11 ±0.06Warm nights
Multi-modelObsIndex
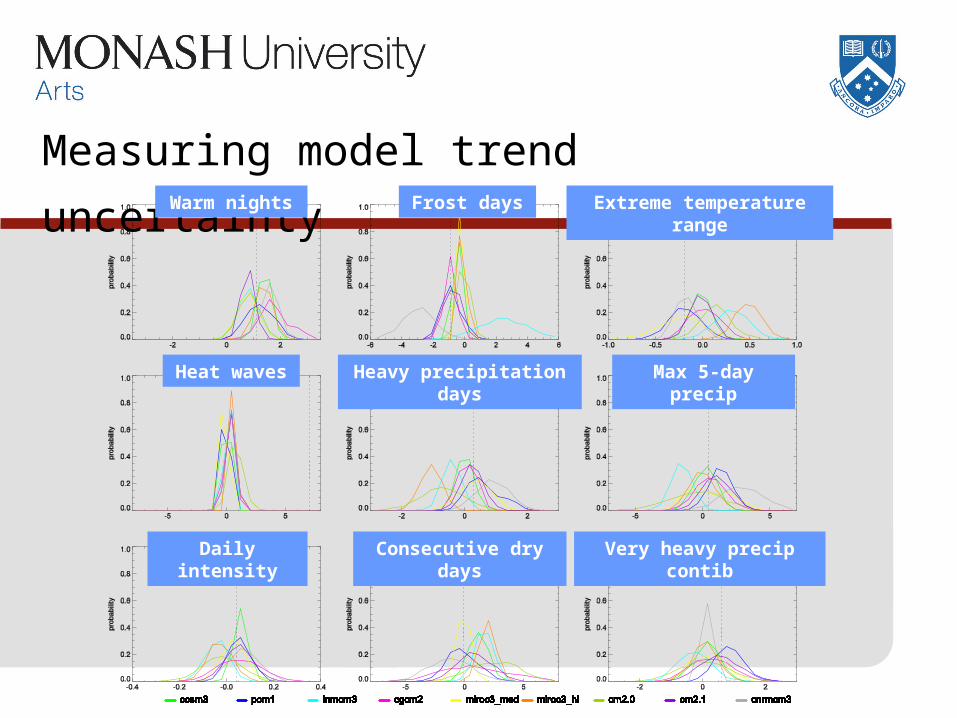
Measuring model trend uncertaintyWarm nights Frost days Extreme temperature range
Heavy precipitation days Max 5-day precip
Daily intensity Consecutive dry days Very heavy precip contib
Heat waves
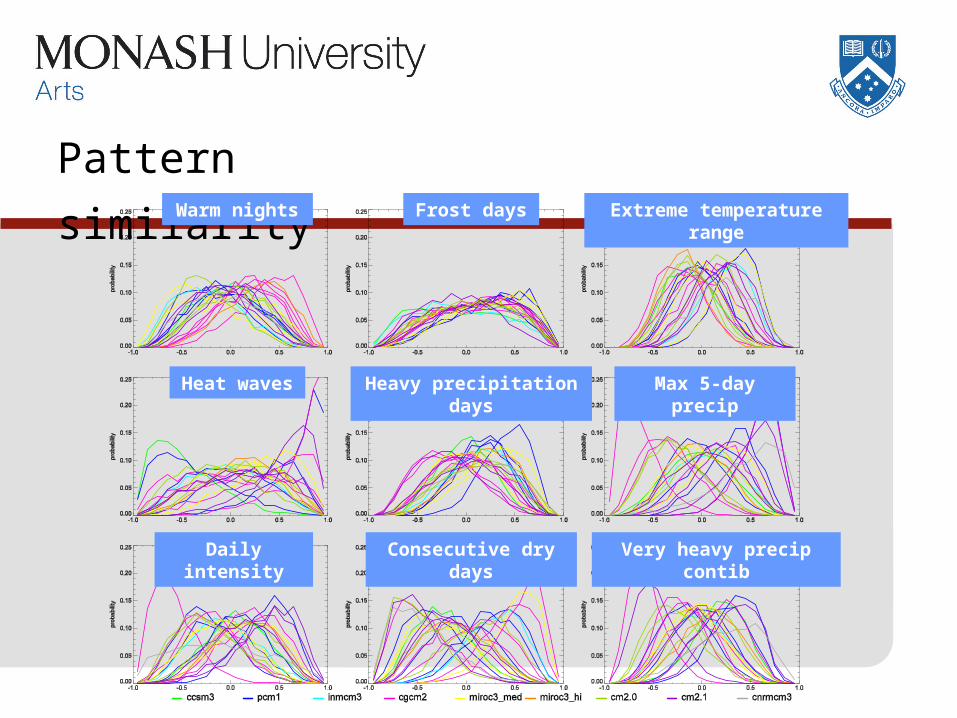
Pattern similarityWarm nights Frost days Extreme temperature range
Heat waves Heavy precipitation days Max 5-day precip
Daily intensity Consecutive dry days
Very heavy precip contib
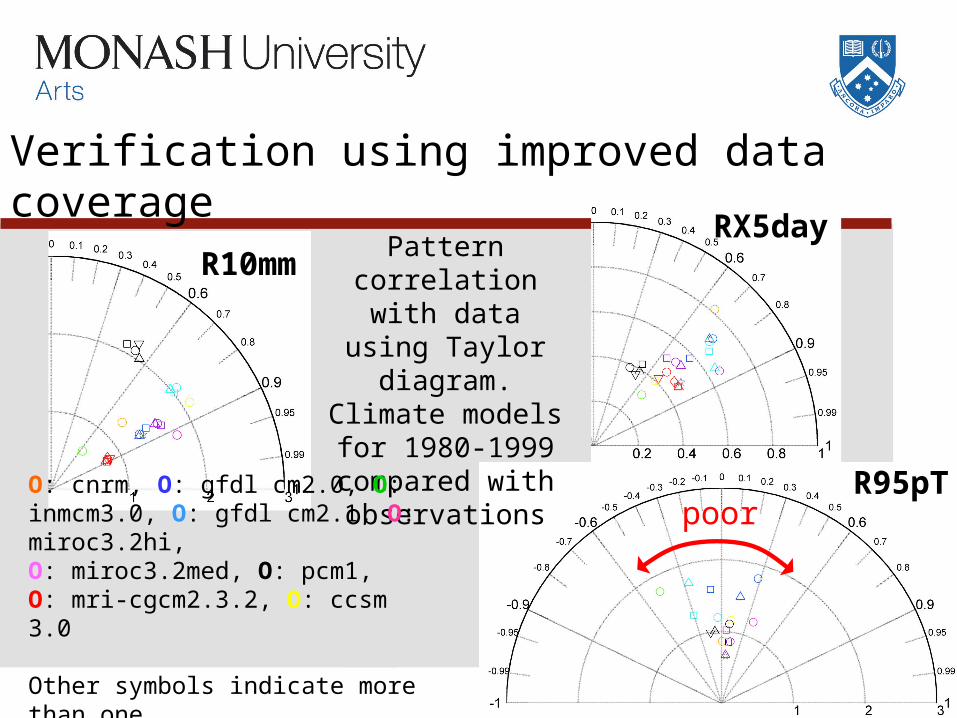
Verification using improved data coverage
R10mmRX5day
R95pTpoor
Pattern correlation with data
using Taylor diagram.Climate models for
1980-1999compared with observations
O: cnrm, O: gfdl cm2.0, O: inmcm3.0, O: gfdl cm2.1, O: miroc3.2hi, O: miroc3.2med, O: pcm1, O: mri-cgcm2.3.2, O: ccsm 3.0
Other symbols indicate more than onemodel run for each model
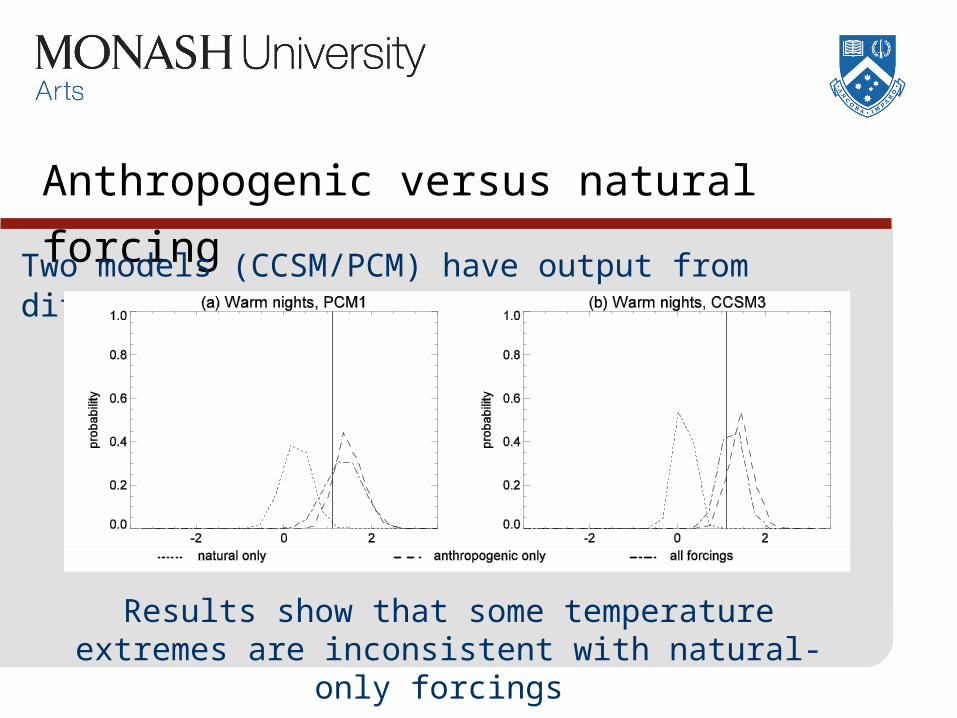
Anthropogenic versus natural forcing
Two models (CCSM/PCM) have output from different forcings
Results show that some temperature extremes are inconsistent with natural-only forcings
Interim conclusions
• Trends in and interannual variability of warm nights are very well captured by all models
• Within uncertainty ranges the multi-model trends overlap with observations (except for heat wave duration because of differences in definition)
• However caution is required when interpreting some of the model projections
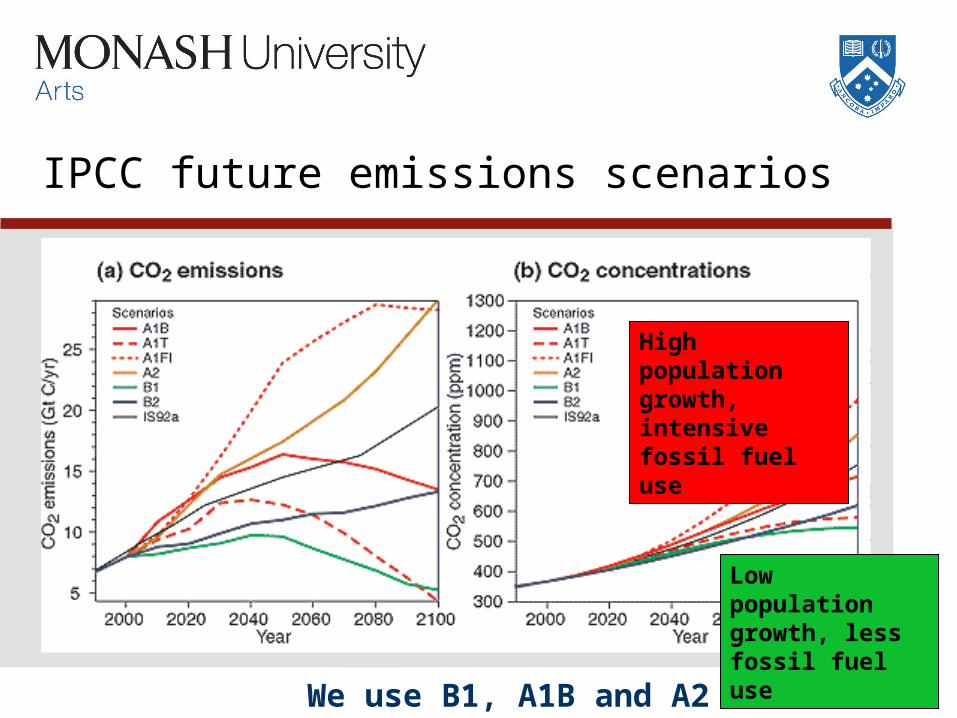
Low population growth, less fossil fuel use
Low population growth, less fossil fuel use
IPCC future emissions scenarios
We use B1, A1B and A2
High population growth, intensive fossil fuel use
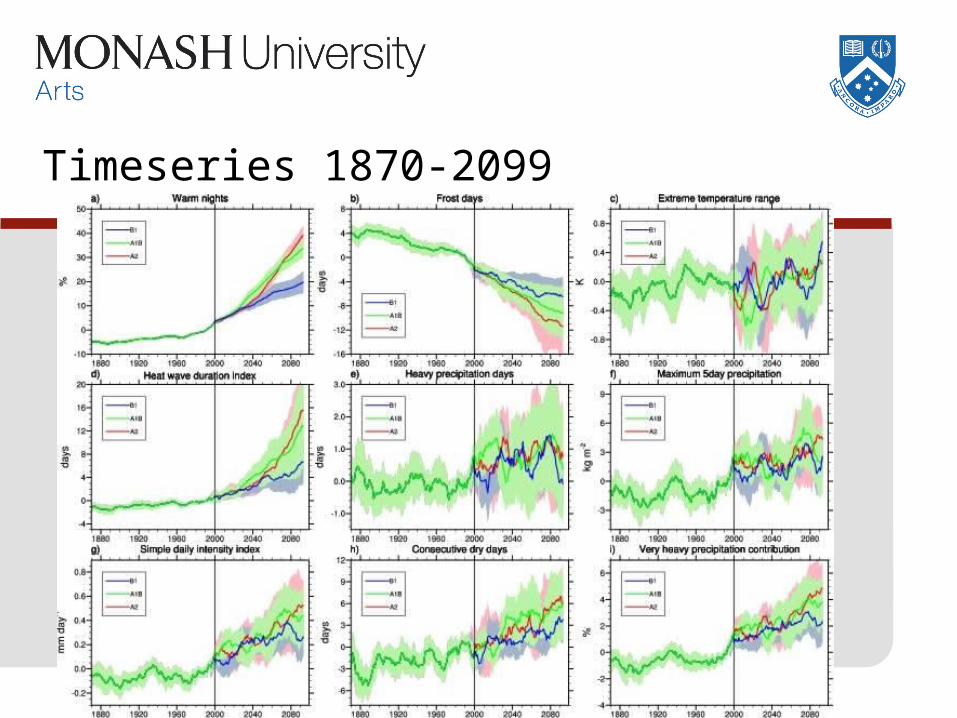
Timeseries 1870-2099
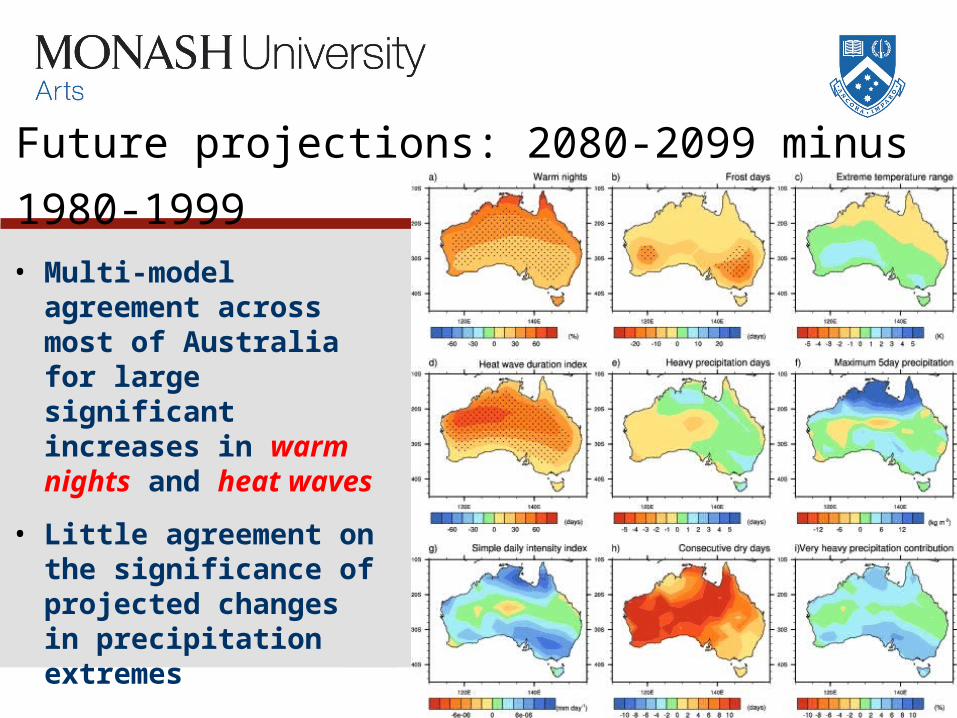
Future projections: 2080-2099 minus 1980-1999
• Multi-model agreement across most of Australia for large significant increases in warm nights and heat waves
• Little agreement on the significance of projected changes in precipitation extremes
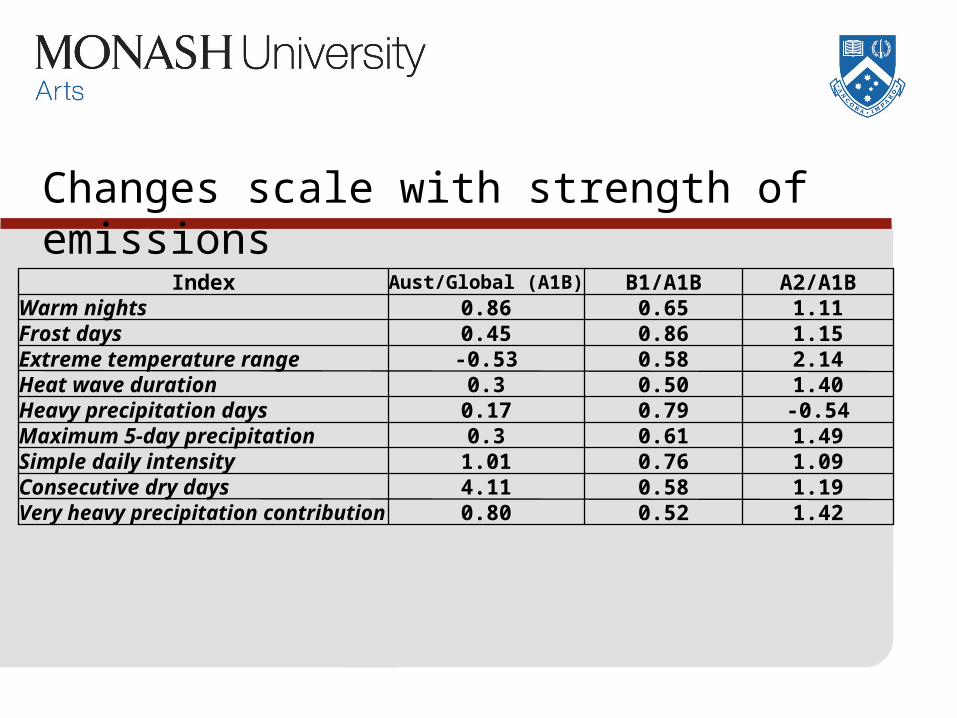
Changes scale with strength of emissions
1.420.520.80Very heavy precipitation contribution1.190.584.11Consecutive dry days1.090.761.01Simple daily intensity1.490.610.3Maximum 5-day precipitation-0.540.790.17Heavy precipitation days1.400.500.3Heat wave duration2.140.58-0.53Extreme temperature range1.150.860.45Frost days1.110.650.86Warm nights
A2/A1BB1/A1BAust/Global (A1B)Index
Conclusions (I) obs/model comparison
• Generally global climate models are able to simulate the magnitude of observed trends of climate extremes and interannual variability over Australia, particularly for temperature extremes BUT some indices are not well reproduced
• Very few models showed significant skill at reproducing the observed spatial pattern of trends
• Two models with output from different forcings showed that some changes in temperature indices were consistent with an anthropogenic response
Conclusions (II) future projections
• Multi-model agreement for substantial increases in warm nights and heatwaves and decreases in frosts projected by the end of the century irrespective of scenario used
• Much longer dry spells interspersed with periods of increased precipitation BUT much less inter-model agreement
• In general, the magnitude of changes in both temperature and precipitation indices were found to scale with strength of emissions
• But more work is required to improve both the observational coverage and the robustness of projections
Alexander and Arblaster (2008), Int. J. Climatol. (in press)