Embed Size (px)
Citation preview

Solid Earth, 9, 75–90, 2018https://doi.org/10.5194/se-9-75-2018© Author(s) 2018. This work is distributed underthe Creative Commons Attribution 3.0 License.
Assessment and monitoring of land degradation using geospatialtechnology in Bathinda district, Punjab, IndiaNaseer Ahmad and Puneeta PandeyCentre for Environmental Sciences and Technology, Central University of Punjab, Bathinda, Punjab-151001, India
Correspondence: Puneeta Pandey ([email protected])
Received: 13 December 2016 – Discussion started: 2 January 2017Revised: 29 November 2017 – Accepted: 27 December 2017 – Published: 8 February 2018
Abstract. Land degradation leads to alteration of ecologi-cal and economic functions due to a decrease in productivityand quality of the land. The aim of the present study wasto assess land degradation with the help of geospatial tech-nology – remote sensing (RS) and geographical informationsystem (GIS) – in Bathinda district, Punjab. The severity ofland degradation was estimated quantitatively by analyzingthe physico-chemical parameters in the laboratory to deter-mine saline or salt-free soils and calcareous or sodic soils andfurther correlating them with satellite-based studies. The pHvaried between 7.37 and 8.59, electrical conductivity (EC)between 1.97 and 8.78 dSm−1 and the methyl orange ortotal alkalinity between 0.070 and 0.223 (HCO−3 ) gL−1 asCaCO3. The spatial variability in these soil parameters wasdepicted through soil maps generated in a GIS environment.The results revealed that the soil in the study area was ex-posed to salt intrusion, which could be mainly attributed to ir-rigation practices in the state of Punjab. Most of the soil sam-ples of the study area were slightly or moderately saline witha few salt-free sites. Furthermore, the majority of the soilsamples were calcareous and a few samples were alkalineor sodic in nature. A comparative analysis of temporal satel-lite datasets of Landsat 7 ETM+ and Landsat 8 OLI_TIRSof 2000 and 2014, respectively, revealed that the water bodyshowed a slight decreasing trend from 2.46 km2 in 2000 to1.87 km2 in 2014, while the human settlements and otherbuilt-up areas expanded from 586.25 to 891.09 km2 in a spanof 14 years. The results also showed a decrease in area un-der barren land from 68.9847 km2 in 2000 to 15.26 km2 in2014. A significant correlation was observed between thedigital number (DN) of the near-infrared band and pH andEC. Therefore, it is suggested that the present study can beapplied to projects with special relevance to soil scientists,
environmental scientists and planning agencies that can usethe present study as baseline data to combat land degradationand conserve land resources in an efficient manner.
1 Introduction
Land degradation is the process that makes land unsuitablefor human beings as well as for soil ecosystems (Kimpeand Warkentin, 1998), occurs in arid, semi-arid and sub-humid areas as a result of anthropogenic activities and cli-matic variations (Barbero-Sierra et al., 2015), and eventuallysubjects livelihoods and sustainable development to severerisks (Fleskens and Stringer, 2014). Land use and land cover(LULC) change is a prime issue for scientists concernedwith global environmental change (Muñoz-Rojas et al., 2015;Ochoa et al., 2016). Land use activities have a consider-able influence on the people, posing serious consequencesfor social, economic and ecological aspects of human soci-ety (Burchinal, 1989; FAO, 1997). The alteration in ecolog-ical and economic functions due to the decrease in the pro-ductivity and quality of the land (Hill et al., 2005) can leadto decline in the biological productivity of land due to cli-mate change and human activities (Zhang et al., 2014). Landdegradation poses a great threat to food security and damagesthe environmental safety of land as well as influences the sus-tainable development of society and economy (Zhao et al.,2013). Degradation can lead to exhaustion of other naturalresources in both developed and developing countries and af-fect arid, dry and even sub-humid areas (Omuto et al., 2014;Stringer and Harris, 2014). Soil degradation takes place notonly as a result of interaction between physico-chemical andbiological factors comprising topography, soil properties and
Published by Copernicus Publications on behalf of the European Geosciences Union.

76 N. Ahmad and P. Pandey: Assessment and monitoring of land degradation
climatic features (Brevik et al., 2015; Taguas et al., 2015) butalso includes human factors and land use management prac-tices (Khaledian et al., 2017; Camprubi et al., 2015; Costaet al., 2015; Cerda et al., 2016). Inappropriate land use prac-tices have been attributed as one of the major causes of landdegradation by various researchers (Biro et al., 2013; DeSouza et al., 2013; Pallavicini et al., 2015; Mohawesh et al.,2015). A major form of inadequate land use is the one lead-ing to environmental land use conflicts that develop on soilsused for activities not in compliance with the natural poten-tial of the soil. This is characterized by a deviation betweenthe actual and natural uses set by land capability. Environ-mental land use conflicts and their consequences for landdegradation have been recently studied by various authors(Pacheco et al., 2014, 2016; Valera et al., 2016; Valle Junioret al., 2014a, b, 2015). The resilience and stability of land-scape are affected to a great extent by the soil system, whichin turn is affected by the inherent balance between inputs andnutrient loss and carbon (Amundson et al., 2015).
Land degradation is a severe problem due to which 1.5billion people are threatened (Nachtergaele et al., 2010) andabout 1.9 billion hectares of land and 250 million people areaffected worldwide (Low, 2013). There is an increasing trendin severity of degradation, covering most of the world’s landarea, which includes 30 % forests, 20 % cultivated areas and10 % grasslands undergoing degradation (Bai et al., 2008).According to Barrett and Hollington (2006), approximately10 to 20 million people live on land affected by salts withpoor productivity and under alarming threats of ecosystemdestruction. Every year, approximately 6 million hectares ofagricultural land becomes unproductive due to various pro-cesses of soil degradation (Asio et al., 2009). A target of zeronet land degradation at Rio+20 was set by the United Na-tions Convention to Combat Desertification (UNCCD) heldin Brazil in 2012, aimed at reducing the rate of land degrada-tion and promoting the rate of restoration of already degradedland (Easdale, 2016).
According to an estimation of the Indian Council ofAgricultural Research (ICAR, 2010), about 120.40 millionhectares (out of 328.73 million hectares) of land in the coun-try is affected by land degradation. In the state of Pun-jab, 2.33 % (1172.84 km2) of the land area is considered aswasteland, the highest area under wasteland being the Muk-tsar district (186.8 km2), followed by Ferozpur (148.1 km2),Bathinda (144.4 km2) and Gurdaspur (94.5 km2). Change de-tection studies of LULC have proven to be very effective inassessing the potential adverse impacts on environment (Lehet al., 2013). Hence, it becomes essential to devise effec-tive strategies for land management at the landscape level byanalysing the extent of land degradation using model simu-lation studies for LULC dynamics (Gessesse et al., 2015).
LULC change analysis is very important for assessmentand recognition of potential impacts and the developmentof planning strategies and land management practices (Lehet al., 2013). The dynamics of LULC not only include the
damage by agriculture but also degradation of historic valuesand conservation functions (Ohta and Nakagoshi, 2011). Asa result of LULC changes, the landscape suffers from seri-ous problems such as soil erosion, flood and drought, reduc-ing productivity of land or land degradation (Firdaus et al.,2014). LULC affects soil’s physical and chemical propertiesin such a way that areas going through continuous cultiva-tion but lacking appropriate management practices have lowfertility levels due to over-utilization (Majule, 2003). Thesechanges in LULC associated with intensive agricultural prac-tices in semi-arid areas and even in high-rainfall areas (Mis-ana et al., 2003) have a significant impact on soil chemicaldegradation (Maitima et al., 2009). Being a critical problemin many developing countries (Ananada and Herath, 2003),land degradation has serious consequences on social, eco-nomical and environmental aspects of society. Informationon LULC changes and their impacts is essential for manage-ment of land as it avails key environmental data and infor-mation for resource management. Thus, it becomes very im-portant for decision and policy-makers to propose remedialanalysis of LULC change and land degradation.
In comparison to other states, the land area of Punjab un-der different wasteland categories is less (State of Environ-ment Punjab, 2007) but land degradation assessment andmonitoring is essential to improve understanding and as-sistance in decision-making processes. Hence, this researchuses both remote sensing methods and physico-chemicalanalysis of soil for assessing the severity of land degrada-tion. Being a serious problem worldwide, the managementof degraded land can be carried out using a more appro-priate approach by evaluating the spatial variability in soilproperties, including chemical properties of degraded land,and mapping such variations (Cambardella et al., 1994). Forexample, soil pH is an important property determining theavailability and toxicity of nutrients. A better considerationof the spatial variability in soil properties like pH, EC and or-ganic carbon would facilitate advanced agricultural and envi-ronmental management practices by identification of propersites for management (Cambardella et al., 1994). Digital soilmapping is critical when quantifying the relationship be-tween soil types and their associated surrounding environ-ment. Mapping soil characteristics allows the spatial distribu-tion evaluation of physico-chemical properties and presenta-tion in a form that users can deal with efficiently and interpretin a better way (Sheng, 2010).
In addition to land degradation assessment and land usecover dynamics, this research also included the study of spa-tial variability in soil pH, electrical conductivity (EC) and al-kalinity using the digital soil mapping interpolation methodin agricultural and non agricultural soils of the Bathindadistrict in Punjab, India. The results obtained by both ap-proaches have been correlated to get a better picture of theextent of land degradation in Bathinda, a semi-arid town innorthwestern India.
Solid Earth, 9, 75–90, 2018 www.solid-earth.net/9/75/2018/

N. Ahmad and P. Pandey: Assessment and monitoring of land degradation 77
Overall, there is a dearth of literature regarding land degra-dation studies for the Bathinda region of Punjab, India. Fur-ther, sufficient quantitative data on current land use practicesare lacking. Whatever data exist are scattered and are noteasily available to researchers, planners and policy-makers,hindering the complete assessment of land degradation prob-lems. So far, no study in which multispectral Landsat satelliteimages (Landsat_7 ETM+ and Landsat_8 OLI_TIRS) havebeen used to assess the changes in land cover features overthe study area has been reported. Also, no work has beenreported on examining the spatial variations in selected soilproperties such as pH, EC and alkalinity. Therefore, a frame-work is needed to develop an appropriate database to encour-age integrated planning at different levels. Based on this ap-proach, it becomes essential to integrate the LULC changein the spatial variability in selected soil properties. Althoughthe present study does not explain the causes and manifesta-tions of land degradation, the present study would still helpto identify areas vulnerable to land degradation. Hence, thestudy was carried out to fulfil the following objectives:
i. to perform spatial–temporal analysis of selected soil pa-rameters such as pH, EC and alkalinity as well as the na-ture of soil (saline or salt-free and calcareous or sodic).
ii. to study the spatial variability in selected soil parame-ters through digital soil mapping using the inverse dis-tance weighting (IDW) interpolation method.
iii. to integrate satellite data and field-based soil data to as-sess severity of land degradation quantitatively in theBathinda district, Punjab.
iv. to carry out change detection analysis of temporalsatellite datasets of Landsat 7 ETM+ and Landsat 8OLI_TIRS for 2000 and 2014.
v. to perform correlation analysis between soil parametersand satellite data for 2014.
2 Materials and method
2.1 Study area
Bathinda is one of the historical and important cotton-producing towns of northwestern India, situated in the Malwaregion of southern Punjab. The total area extent of the dis-trict is about 336 725 ha (3367.25 km2) and lies between29◦ 33′–30◦ 36′ N latitude and 74◦ 38′–75◦ 46′ E longitude.Wheat, paddy and cotton are the main crops of the district,while the main horticulture crops are grapes, kinnow, jujube,guava, etc. Management practices in the region include landpreparation, seed rate and seed treatment, sowing, irrigation,drainage (safeguard against excess water), fertilizer applica-tion, and weed control measures to raise better quality andyield of the crop. Almost 98 % of agricultural land is irri-gated in the state (Kaur, 2015). The total area practiced with
irrigation is about 297 123 ha, constituting 100 % of the netsown area.
However, one of the major environmental concerns ofthe Bathinda district is soil degradation including soil ero-sion, waterlogging, sand dunes and salinization. Saliniza-tion is one of the most serious problems and occurs nat-urally in irrigated water and soil, particularly in semi-aridand arid regions. (Sheng, 2010). The groundwater irrigationpracticed predominantly in the Bathinda district is one ofthe main factors of soil salinization, which in turn leads toland degradation (El Baroudy, 2011). Additional salts maybe introduced through agricultural fertilizers. Salt-affectedsoils are widespread, especially in arid, semi-arid and somesub-humid regions. The two main constraints that are presentin irrigated agricultural lands include salinity and waterlog-ging (Koshal, 2012), both widespread in the study area. TheBathinda region shows typical conditions of desertificationand soil salinization; hence, effective means of combatingsoil salinization and desertification need to be pursued. Fromthe study area, a total of 21 sites (Fig. 1) were randomly se-lected for soil sample collection (at a depth of 15–25 cm) forthe analysis of physico-chemical parameters. The geograph-ical coordinates of the sampling sites were recorded usinga Garmin eTrex20 GPS device. From the study area, a totalof 21 sites (Fig. 1) were selected randomly using a GPS de-vice for soil sample collection (at a depth of 15–25 cm) forthe analysis of chemical parameters. For each correspondingsampling location, a composite sample was made by thor-oughly mixing at least four samples within a 30 m area of thesite.
2.2 Satellite data
The least-clouded multispectral Landsat satellite images ofthe years 2000 and 2014 (Table 1) were procured from theUnited States Geological Survey (USGS, 2015; http://www.usgs.gov) and Global Land Cover Facility (GLCF, 2015;http://www.glcf.umd.edu).
2.3 Software used
Satellite image processing software, Earth Resources DataAnalysis System (ERDAS) version 9.1 Imagine (HexagonGeospatial – formerly ERDAS, Inc.) and ArcGIS 10.1 (Envi-ronmental Systems Research Institute (ESRI) product) wereused to process, classify, analyse and display the satellite im-ages.
2.4 LULC map of Bathinda
The false colour composite (FCC) of multi-temporal Landsatsatellite images of the years 2000 and 2014 was generated ona 1 : 50000 scale. In addition, unsupervised classification us-ing the ISODATA algorithm was carried out to gain an ideaof spectral variability in classes. In this method, the sepa-ration of clusters of pixels was made based on statistically
www.solid-earth.net/9/75/2018/ Solid Earth, 9, 75–90, 2018
78 N. Ahmad and P. Pandey: Assessment and monitoring of land degradation
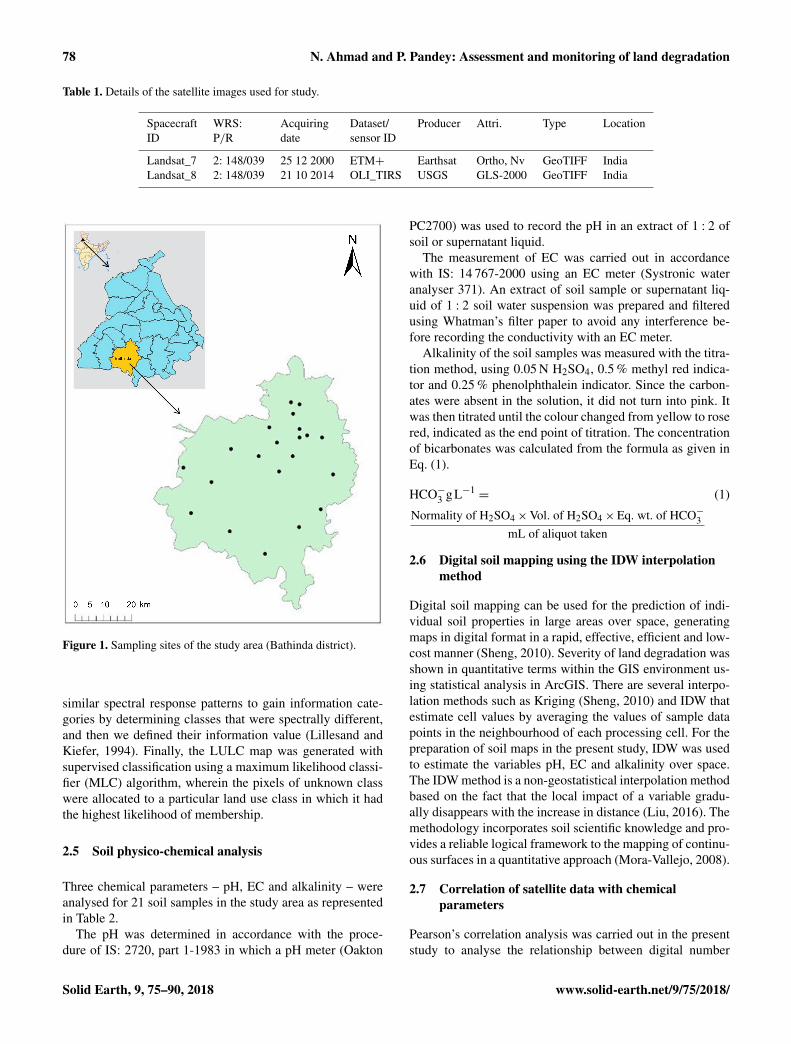
Table 1. Details of the satellite images used for study.
Spacecraft WRS: Acquiring Dataset/ Producer Attri. Type LocationID P/R date sensor ID
Landsat_7 2: 148/039 25 12 2000 ETM+ Earthsat Ortho, Nv GeoTIFF IndiaLandsat_8 2: 148/039 21 10 2014 OLI_TIRS USGS GLS-2000 GeoTIFF India
Figure 1. Sampling sites of the study area (Bathinda district).
similar spectral response patterns to gain information cate-gories by determining classes that were spectrally different,and then we defined their information value (Lillesand andKiefer, 1994). Finally, the LULC map was generated withsupervised classification using a maximum likelihood classi-fier (MLC) algorithm, wherein the pixels of unknown classwere allocated to a particular land use class in which it hadthe highest likelihood of membership.
2.5 Soil physico-chemical analysis
Three chemical parameters – pH, EC and alkalinity – wereanalysed for 21 soil samples in the study area as representedin Table 2.
The pH was determined in accordance with the proce-dure of IS: 2720, part 1-1983 in which a pH meter (Oakton
PC2700) was used to record the pH in an extract of 1 : 2 ofsoil or supernatant liquid.
The measurement of EC was carried out in accordancewith IS: 14 767-2000 using an EC meter (Systronic wateranalyser 371). An extract of soil sample or supernatant liq-uid of 1 : 2 soil water suspension was prepared and filteredusing Whatman’s filter paper to avoid any interference be-fore recording the conductivity with an EC meter.
Alkalinity of the soil samples was measured with the titra-tion method, using 0.05 N H2SO4, 0.5 % methyl red indica-tor and 0.25 % phenolphthalein indicator. Since the carbon-ates were absent in the solution, it did not turn into pink. Itwas then titrated until the colour changed from yellow to rosered, indicated as the end point of titration. The concentrationof bicarbonates was calculated from the formula as given inEq. (1).
HCO−3 gL−1= (1)
Normality of H2SO4×Vol. of H2SO4×Eq. wt. of HCO−3mL of aliquot taken
2.6 Digital soil mapping using the IDW interpolationmethod
Digital soil mapping can be used for the prediction of indi-vidual soil properties in large areas over space, generatingmaps in digital format in a rapid, effective, efficient and low-cost manner (Sheng, 2010). Severity of land degradation wasshown in quantitative terms within the GIS environment us-ing statistical analysis in ArcGIS. There are several interpo-lation methods such as Kriging (Sheng, 2010) and IDW thatestimate cell values by averaging the values of sample datapoints in the neighbourhood of each processing cell. For thepreparation of soil maps in the present study, IDW was usedto estimate the variables pH, EC and alkalinity over space.The IDW method is a non-geostatistical interpolation methodbased on the fact that the local impact of a variable gradu-ally disappears with the increase in distance (Liu, 2016). Themethodology incorporates soil scientific knowledge and pro-vides a reliable logical framework to the mapping of continu-ous surfaces in a quantitative approach (Mora-Vallejo, 2008).
2.7 Correlation of satellite data with chemicalparameters
Pearson’s correlation analysis was carried out in the presentstudy to analyse the relationship between digital number
Solid Earth, 9, 75–90, 2018 www.solid-earth.net/9/75/2018/

N. Ahmad and P. Pandey: Assessment and monitoring of land degradation 79
Table 2. Analysis of soil parameters.
S. no. Parameter Method Instrument Reference
1 pH IS: 2720, part 1-1983 pH meter (Oakton PC2700) IS (1987)2 Electrical conductivity (EC) IS: 14 767-2000 EC meter (Systronic water analyser 371). IS (2000)3 Alkalinity IS: 2035 (part 23) – Titration assemblage Gupta (2007)
Reaffirmed 2003
(DN) values of satellite data and physico-chemical param-eters of soil. The correlation was not based on time series ofdigital number (DN) or on average values; rather, the DN val-ues corresponding to geographical coordinates of samplingsites were considered for the present study. The Pearson’scorrelation coefficient determines the strength of a linear as-sociation or relationship between two data variables. Statis-tical significance of the correlation coefficients between DNand pH and between EC and pH, DN/EC was statisticallytested at the 0.5 significance level. The DNs of the satelliteimage at the respective sampling sites were correlated withthe pH and EC readings to gain an idea about the efficacyof satellite data in relation to laboratory analysis of soil sam-ples.
3 Results and discussion
3.1 LULC map of Bathinda
The FCC image was prepared for the 2000 Landsat ETM+satellite data using the “432 RGB” band combination(Fig. 2a) while the band combination of “543 RGB” was usedfor the Landsat 8 satellite image (Fig. 2b) for 2014.
Followed by preparation of FCCs and visual interpreta-tion, LULC maps of Bathinda were prepared for 2000 and2014 as given in Fig. 3a and b using the Iterative Self-Organizing Data Analysis Technique (ISODATA).
After unsupervised classification, in which an insight wasgained about spectral variability in classes, supervised clas-sification of FCC images of both the temporal datasets of theLandsat image was carried out for 2000 and 2014 as givenin Fig. 4a and b using the MLC algorithm. The agriculturallands with crops and without crops were assigned dark greenand light green, respectively. The blue colour was assigned tothe water bodies while the red and yellow colours were givento settlements and trees/forest cover, respectively.
3.2 Accuracy assessment
Accuracy assessment is often carried out to quantify the reli-ability of a classified image using a reference dataset. Accu-racy is a measure of agreement between standard informationat a given location and the information at same location onthe classified image. Kappa is a measure of the differencebetween the observed agreement of two maps as reported by
overall accuracy and the agreement that might be contributedsolely by chance matching of two maps. The overall classi-fication accuracy of the Landsat image (supervised classifi-cation) of 2000 was 96.48 % and the overall kappa statisticwas 0.947 (Table 3a). Similarly, for the Landsat image (su-pervised classification) of 2014, accuracy was 97.66 % witha kappa statistic of 0.964 (Table 3b). These values indicatethat the results were appreciably better than random of thevalues contained in an error matrix (Jensen, 1996).
3.3 Change detection analysis
To analyse changes between different land features for a pe-riod of 14 years, supervised images of both 2000 and 2014were used as input images and the changes were highlightedas a 20 % increase (blue colour) and 20 % decrease in the fi-nal map (pink colour) depicting change detection (Fig. 5).The other classes included unclassified, unchanged, someincreased and some decreased, which were pointed out inblack. The increased portion predominantly indicated the ex-pansion of settlements with little increase in vegetation. Thedecreased portion depicted the decrease in overall land areaunder agriculture (with or without crops).
Table 4 describes the change detection in the total area(km2) covered by different LULC between the years 2000and 2014 procured from Landsat satellite data.
Post classifications, changes in areas of different groundfeatures in square kilometres (km2) over a period of 14 years,were evaluated (Table 4). The area under water body, humansettlements and built-up areas, agricultural land, trees/forestcover, and barren land was 1.87, 891.09, 2399.79, 45.73 and15.26 km2, respectively. The water body showed a slight de-creasing trend from 2.46 km2 in 2000 to 1.87 km2 in 2014.Human settlements and other built-up areas expanded from586.25 to 891.09 km2 in the 14-year time span. This couldalso be attributed to increasing urbanization in the city ofBathinda during the past 14 years.
3.4 Laboratory analysis for soil parameters
The pH, EC and alkalinity values of the soil samples col-lected from the sampling sites of the study area are given inTable 5.
All 21 soil samples collected from different locationsof the study area were mostly alkaline in nature. None ofthe sampling sites were neutral or acidic. Soil pH ranged
www.solid-earth.net/9/75/2018/ Solid Earth, 9, 75–90, 2018

80 N. Ahmad and P. Pandey: Assessment and monitoring of land degradation
Figure 2. FCC of Landsat ETM+ of (a) 2000 and (b) 2014.
Figure 3. LULC map of Bathinda using unsupervised classification for (a) 2000 and (b) 2014.
lowest in the military cantonment (pH= 7.37) and highestin Jaisingh Walla (pH= 8.59) in the study area (Table 5).EC ranged between 1.97 dSm−1 in Badal and 8.78 dSm−1
in Rampura Phul. Around 60–70 % of soil samples wereslightly or moderately saline. The rest of the samples werecategorized as salt-free with values less than 4.
Phenolphthalein alkalinity was absent due to the absenceof carbonate ions (CO2−
3 ). Alkalinity was then determinedwith methyl alkalinity, which indicated the presence of bi-carbonate (HCO3−) ions. The methyl orange or total alka-linity of soils in the study area was in the range of 0.070 to0.223 (HCO3−) gL−1 as CaCO3. The results revealed that
Solid Earth, 9, 75–90, 2018 www.solid-earth.net/9/75/2018/

N. Ahmad and P. Pandey: Assessment and monitoring of land degradation 81
Figure 4. LULC map (supervised classification) of Bathinda for (a) 2000 and (b) 2014.
Table 3. Accuracy assessment report.
(a) Accuracy totals (year 2000)a
S. no. Class Reference Classified Number Producer’s User’sname totals totals correct accuracy accuracy
1 Unclassified 115 114 114 – –2 Water 0 0 0 – –3 Human settlements and built-up areas 10 13 9 90.00 % 69.23 %4 Agricultural land 43 40 40 93.02 % 100.00 %5 Agricultural land without crops 81 85 81 100.00 % 95.29 %6 Trees/forest cover 0 0 0 – –7 Barren land 7 4 3 42.86 % 75.00 %8 Totals 256 256 247
(b) Accuracy totals (year 2014)b
S. no. Class Reference Classified Number Producer’s User’sname totals totals correct accuracy accuracy
1 Unclassified 128 128 128 – –2 Water 0 0 0 – –3 Human settlements and built-up areas 38 39 18 100.00 % 97.44 %4 Agricultural land 67 70 66 98.51 % 94.29 %5 Agricultural land without crops 21 18 17 80.95 % 94.44 %6 Trees/forest cover 1 1 1 100.00 % 100.00 %7 Barren land 1 0 0 42.86 % 75.00 %8 Totals 256 256 250
a Overall classification accuracy= 96.48 %. Kappa (K^) statistic: conditional kappa for each category was also obtained. The overall kappa statisticwas 0.947.b Overall classification accuracy= 97.66 %. Kappa (K^) statistic: from the results the overall kappa statistic (conditional kappa for each category ofthe year 2014) was 0.964.
www.solid-earth.net/9/75/2018/ Solid Earth, 9, 75–90, 2018

82 N. Ahmad and P. Pandey: Assessment and monitoring of land degradation
Table 4. Change detection in different LULC (km2) between 2000 and 2014.
S. no. LULC class Area (km2) Area (km2) Change detection (km2)in 2000 in 2014 between 2000 and 2014
1. Water 2.46 1.8783 0.58 (decrease)2. Human settlements and built-up areas 586.25 891. 10 304.85 (increase)3. Agricultural land 3002.23 2399.80 602.44 (decrease)4. Trees/forest cover 29.43 45.73 16.30 (increase)5. Barren land 68.98 15.26 53.7243 (decrease)
Table 5. Soil physico-chemical parameters.
S. no. Coordinates of pH EC Methyl orange alkalinity Soil typesampling sites (dSm−1) (HCO−3 ) gL−1 as CaCO3
1 30◦09′.565′′ N, 74◦58′.381′′ E 8.11 4.04 0.161 Calcareous, slightly saline2 29◦59′.405′′ N, 75◦05′.534′′ E 7.78 2.63 0.161 Calcareous, salt-free3 30◦04′.925′′ N, 75◦14′.015′′ E 8.44 2.50 0.140 Alkali or sodic soils, salt-free4 30◦12′.180′′ N, 75◦16′.372′′ E 8.20 8.78 0.161 Calcareous or saline, moderately saline5 30◦57′.144′′ N, 74◦01′.408′′ E 7.84 8.17 0.122 Calcareous, moderately saline6 30◦01′.264′′ N, 74◦54′.360′′ E 7.90 5.89 0.109 Calcareous, slightly saline7 30◦17′.524′′ N, 75◦06′.198′′ E 8.13 4.10 0.101 Calcareous, slightly saline8 30◦02′.168′′ N, 75◦09′.108′′ E 7.37 4.01 0.122 Calcareous, slightly saline9 30◦13′.384′′ N, 74◦57′.736′′ E 7.87 2.83 0.109 Calcareous, salt-free10 30◦11′.618′′ N, 74◦57′.340′′ E 8.15 2.15 0.140 Calcareous, salt-free11 30◦12′.716′′ N, 74◦57′.695′′ E 7.95 4.73 0.092 Calcareous, slightly saline12 30◦10′.968′′ N, 74◦57′.624′′ E 7.94 3.04 0.162 Calcareous, salt-free13 30◦10′.174′′ N, 74◦51′.830′′ E 8.59 4.11 0.131 Alkali or sodic soils, slightly saline14 30◦02′.696′′ N, 74◦37′.411′′ E 8.23 1.97 0.092 Calcareous, salt-free15 30◦10′.480′′ N, 74◦50′.240′′ E 8.44 4.71 0.223 Alkali or sodic soils, slightly saline16 30◦04′.588′′ N, 74◦45′.288′′ E 8.39 6.23 0.140 Alkali or sodic soils, slightly saline17 30◦14′.192′′ N, 74◦52′.135′′ E 8.45 4.12 0.109 Alkali or sodic soils, slightly saline18 30◦14′.346′′ N, 74◦55′.956′′ E 7.87 4.28 0.070 Calcareous, slightly saline19 30◦10′.350′′ N, 74◦57′.20′′ E 8.31 4.70 0.092 Calcareous, slightly saline20 30◦10′.350′′ N, 74◦57′.65′′ E 7.92 4.12 0.122 Calcareous, slightly saline21 30◦10′.660′′ N, 74◦58′.68′′ E 7.94 4.02 0.131 Calcareous, slightly saline
soils contain a larger proportion of sodium, potassium andmagnesium and are thus infertile.
3.5 Generation of soil maps
Digital soil mapping was used for the prediction of spa-tial variability in individual soil properties in the study area,where maps could be generated in digital format in a rapid,effective, efficient, and low-cost manner (Sheng, 2010). Landdegradation severity was shown as spatial distribution of pH,EC and alkalinity in quantitative terms via IDW interpola-tion methods using the statistical analysis tool in the ArcGISsoftware. Based on the pH values, a soil map for samplingsites was composed with the ArcGIS 10.1 software (Fig. 6a).Similarly, on the basis of EC and alkalinity values, soil mapswere composed as shown in Fig. 6b and c, respectively, de-picting the severity of land degradation in terms of salinity.
Regions like Gidderbaha, Mehma Sarja and Lakhi jungleto the west of the study area showed a large percentage ofsoils that were alkaline or sodic in nature (Fig. 6a). Regionslike Poohla, the military cantonment and Patel Nagar werecalcareous or saline in nature. None of the sampling sites inthe study area were acidic.
Based on EC values, it could be observed from the map(Fig. 6b) that in the study area, the maximum area was oc-cupied by slightly saline soils, and some of the regions likeRampura Phul were moderately saline. Only a few of the siteswere salt-free.
Based on alkalinity, it was observed from the map (Fig. 6c)that most of the study area was less alkaline, ranging between0.07 and 0.131 (HCO−3 ) gL−1 as CaCO3 and only a few sitessuch as Lakhi jungle and Mehma Sarja were slightly morealkaline ranging between 0.178 and 0.223 (HCO−3 ) gL−1 asCaCO3. But in general, all the sampling sites had a low rangeof alkalinity.
Solid Earth, 9, 75–90, 2018 www.solid-earth.net/9/75/2018/

N. Ahmad and P. Pandey: Assessment and monitoring of land degradation 83
Figure 5. Change detection map of the Bathinda district.
Table 6. Correlation (r) between the digital number of band 5 andsoil physico-chemical parameters.
DN pH EC
DN 1 – –pH 0.477 1 –EC 0.285 −0.003 1
3.6 Correlation between physico-chemical parametersand satellite data analysis for 2014
Based on the results obtained from the soil analysis, an at-tempt was made to establish correlation (Pearson’s r) forband 3 (green), band 5 (near infrared, NIR) and band 7(short-wave infrared, SWIR) of the Landsat 8 satellite imagefor the year 2014 with soil pH and EC. The DN of corre-sponding sites was statistically correlated with the physico-chemical parameters at the 0.5 significance level. The DNvalues used in the correlation matrix were the same as thevalues of band 5 (NIR band) of the pixels for the 2014 im-age. This correlation analysis has been given in Table 6.
No significant correlation was observed between soilphysico-chemical parameters and visible (band 3) and SWIR(band 7) of the satellite image; hence, the values are not re-ported here. The NIR band (band 5), however, exhibited sig-nificant correlation with physico-chemical parameters com-
pared to the rest of the bands, thus proving it to be a betterindicator of soil quality.
4 Discussion
4.1 LULC map of Bathinda: image classification andaccuracy assessment
Digital image classification helped in identifying, delineatingand mapping LULC into a number of classes. Classes iden-tified included water bodies, human settlements and built-upareas, agricultural land, trees/forest cover, and barren land.Multispectral data were used for classification and the cat-egorization on a numerical basis related with the spectralpattern of the data for each and every pixel (Lillesand andKiefer, 1994).
4.2 Change detection analysis
The change detection study deals with the comparison ofaerial photographs or satellite images of a region taken at dif-ferent time periods (Petit et al., 2001), performed on a tempo-ral scale to access landscape change caused by anthropogenicactivities on the land (Gibson and Power, 2000). In order tounderstand landscape patterns for proper land managementand decision-making improvements, it is necessary to con-sider the changes and interactions between human activitiesand natural phenomena (Prakasam, 2010). Change detectionby remote sensing has proven to be a cost- effective methodfor creating LULC inventories and monitoring land changeover time (Coppin et al., 2004; Fry et al., 2011).
The results of the present study revealed that area underbarren land decreased from 68.98 km2 in 2000 to 15.26 km2
in the year 2014. This could be due to expansion of settle-ments and built-up areas (Silambarasan et al., 2014) or partlydue to increased vegetation. The settlement expansion onagricultural and forest land is affecting humans by exposingforest ecosystems and having negative impacts of habitat de-struction within the forest ecosystem (Stimson et al., 2005).Inappropriate land use is regarded as one of the chief agentsof land degradation, which has been previously observed byvarious researchers (Biro et al., 2013; De Souza et al., 2013;Pallavicini et al., 2015; Mohawesh et al., 2015). However,since settlements and barren land exhibit similar spectral re-flectance, slight mixing may have occurred between the twoLULC classes. Opeyemi (2008) conducted the evaluation ofchange detection in LULC of Ilorin and its environs in theKwara state, Nigeria, and ultimately concluded that the rapidgrowth in built-up land was one of the reasons for LULC.The extension of urban land could be due to a major lossof croplands (Jin-Song, 2009). While studying the land usepatterns in the Khed Tehsil of the Pune district, Jadhav andNagarale (2011) also concluded that population growth, ur-banization and expansion of the transportation network werethe socio-economic factors that changed the land use patterns
www.solid-earth.net/9/75/2018/ Solid Earth, 9, 75–90, 2018

84 N. Ahmad and P. Pandey: Assessment and monitoring of land degradation
Figure 6. (a) Soil map of the Bathinda district on the basis of pH values. (b) Soil map of the Bathinda district on the basis of EC values.(c) Soil map of the Bathinda district on the basis of alkalinity values.
of Khed Tehsil. In his study on the urban expansion and lossof agricultural land of Saharanpur city, India, Fazal (2000)concluded that rapid conversion of agricultural areas to non-agricultural uses occurred due to land price increases for mar-ket operations. Verheye and Paul (1997) revealed that manyhouseholds, especially in developing countries, depend onland and other natural resources to achieve their long-term
aspirations of socio-economic development. Such interactionbetween environment and land use activities shows consid-erable impacts on soil erosion, human vulnerability and thefundamental processes of the ecosystem comprising nutrientcycling (Sala et al., 2000; Foley et al., 2005). Usually thesprawl takes place on urban fringe or along transportationroutes (Silambarasan et al., 2014). Such expansion reinforces
Solid Earth, 9, 75–90, 2018 www.solid-earth.net/9/75/2018/
N. Ahmad and P. Pandey: Assessment and monitoring of land degradation 85
segregation of income and economic disproportion betweenurban and suburban communities (Wu, 2006). This high ur-ban sprawl has led to increased urban land use, and con-versely, to a decrease in barren land in the form of settlement(Ali, 2011). In the present study, an increase in vegetationwas observed in 2014 compared to 2000, which could be dueto recent plantation programmes organized in the region atvarious educational, institutional and municipal levels. Suchplantations may act as “foster ecosystems” (Lugo, 1988) andaccelerate the development of genetic and biochemical di-versity on degraded sites (Verma et al., 1982). Sadeghraveshet al. (2016) suggested adopting spatial planning and estimat-ing ecological potential at local, regional and national levelsand adapting the applications to land resources to minimizeland degradation by way of analyzing desertification strate-gies using the linear assignment method. Further, the strate-gies to prevent improper change of land use, developmentand reclamation of plant cover and to control overchargingof groundwater resources were identified as the most impor-tant strategies for combating desertification.
4.3 Laboratory analysis for chemical parameters
Land degradation results in damage to the physical, chem-ical and biological soil properties, which leads to a declinein productivity (Chartres, 1987). Thus, considering physico-chemical parameters is essential to assess land degradation.
In this study, most of the soil samples were calcareousor saline, while some of the other samples were alkaline orsodic (http://www.dird-pune.gov.in/phec.htm; DIRD, 2014),which may indicate high soil calcium contents. High cal-cium contents maintain the soil in aggregated form andadequate physical conditions, in agreement with the find-ings of Abbas and Khan (2007), who stated that remotelysensed data integrated with ground-truthing verification andphysico-chemical analysis is a useful tool for the assessmentof soil salinity and alkalinity. Remote sensing has been rec-ommended for its potential to detect, map and monitor degra-dation issues (Sujatha et al., 2000) including their spread andeffect with time (Sommer et al., 1998).
Based on the EC values given by Ghassemi et al. (1995),we found that some parts of the study area were slightlysaline, some moderately saline and a few areas were salt-free. The saline nature of the soil revealed that these containsodium as soluble salts (usually as SO2−
4 or chloride). Soilsusually contain calcium and magnesium over sodium, and,as a result, these soils usually have good aeration and ag-gregate stability (Mathew, 2014). The EC and total salt con-tent of a soil extract are the most widely used parametersfor describing soil salinity (Liu et al., 2006). Although thereare several soil / water ratios, such as 1 : 1, 1 : 2, 1 : 5, 1 : 10,and also saturation used in EC measurements of soil extract(Zhang et al., 2003), 1 : 5 is the most popular in China. TheEC is correlated with soil properties in such a way that itaffects the organic carbon by the amount of cation exchange
capacity and percentage of clay in the low-density vegetationareas (Vagen et al., 2006).
The study of different soil physico-chemical propertieswas helpful in the assessment of land degradation (Raina,1999). Our results showed that soil is affected by inappropri-ate activities taking place during the past decades, includingloss of soil fertility, erosion, soil salinization etc. Due to landdegradation, vulnerable populations and fragile ecosystemsare affected, with irreversible results (Bisaro et al., 2014).The consequences of land degradation may lead to vegeta-tion loss, soil degradation, and pollution of soil, water andair, which need to be addressed to curb further degradation(Novara et al., 2013; Batjes et al., 2014; Olang et al., 2014;Srinivasarao et al., 2014). Since the whole state of Punjabis intensively cultivated with 80 % of water resources beingused for irrigation, the irrigation and overdrafting are someof the main causes of salinization or intrusion of various saltsinto the soil system (Tiwana, 2007). Groundwater irrigationpractised predominantly in the Bathinda district is one of themain factors of soil salinization, which in turn leads to landdegradation (El Baroudy, 2011). Salt remains in the soil whenwater is taken up by plants or lost to evaporation, causingsoil salinity (Slinger and Tenison, 2007). The zones receiv-ing low rainfall, with shallow water table depth and hot anddry moisture regions in the irrigated areas of the old alluvialplains are found to be primarily affected by salt soils (Manuaand Sharma, 2005).
With the help of the IDW interpolation method, the evalu-ation of the spatial variability in soil properties (pH, EC andalkalinity) and mapping these variations was carried out bygenerating soil maps for the precise determination of fluctu-ations in soil behaviour. Such evaluations would help for op-timum fertilizer recommendation by appropriate use of nu-trients that contribute in enhancing crop quantity and qual-ity, while being environmentally sustainable (Miransari andMackenzie, 2010).
Although the degree of salinity was not too high that thesoil quality could be affected, some remedial measures mustbe adopted to prevent any problem that might affect the qual-ity of the land as well as yields in the near future. In such re-gions where irrigation is a common practice, remote sensingcan be used as a valuable tool for obtaining relevant data onsoil salinity (Al Khaier, 2003). Symeonakis et al. (2016) pro-posed that land degradation is a dynamic process and shouldnot be based on static datasets, rather its assessment shouldincorporate various temporal datasets while devising param-eters as indicators of environmental sensitivity. Thus, accord-ing to Behmanesh et al. (2016), various criteria for map-ping environmentally sensitive areas were climate, vegeta-tion, soil, groundwater and socio-economic characteristics ofland over different time periods.
www.solid-earth.net/9/75/2018/ Solid Earth, 9, 75–90, 2018

86 N. Ahmad and P. Pandey: Assessment and monitoring of land degradation
4.4 Correlation analysis
According to our results, the correlation coefficients be-tween soil salinity (EC) and related DN values using Land-sat data were helpful in calculating and ascertaining the sig-nificant relation between satellite data and soil salinity. Thesalt-affected soils in arid regions show a high reflectance,especially when a salt crust (whitish colour) is formed.(Alavi-Panah and Goossens, 2001). Furthermore, Mehrjardiet al. (2008) proved that the correlation between DNs ofsatellite images and soil salinity could be an efficient pa-rameter for assessing the land degradation by preparing soilsalinity maps from remotely sensed data.
5 Conclusions
We found that the area under human settlements and built-upareas expanded by about 10.56 % between 2000 and 2014.The land under agricultural practices decreased from 3002.23to 2399.79 km2. The increased human settlements indicatedthe alarming growth of human population and the associ-ated increased pressure on land resources due to rising pop-ulation. Areas under trees/forest cover increased markedlyfrom 29.4345 to 45.7326 km2. This indicates recent plan-tation measures adopted by various agencies in the region.The soil physico-chemical analysis proved to be very use-ful in assessing the degree of salinization. Most of the re-gions had calcareous soil with slight to moderate salinityand none of the sampling sites were highly saline. Correla-tion studies analyzing the response between the spectral re-sponse of the soil and the physico-chemical parameters (pH,EC and alkalinity) revealed that band 5 was a good indi-cator of physico-chemical parameters of soil. Thus, the useof multi-temporal, multi-sensor and multi-spectral remotelysensed data in a GIS environment to assess the extent of landdegradation would help in sound decision-making towardsrestoration of degraded lands and conservation of land re-sources. The present study is a useful tool for analysis ofenvironmental sensitivity on a regional scale and the identi-fication of hotspots of land degradation. Although it does notprovide a detailed insight into the causes and manifestationsof land degradation, this study may help to identify areasvulnerable to land degradation. This would also be helpfulto achieve better results with limited investment and avoidwastage of natural resources.
Data availability. The research data are available upon request tothe corresponding author.
Competing interests. The authors declare that they have no conflictof interest.
Acknowledgements. The authors express their gratitude to theNational Remote Sensing Centre, Hyderabad, for providingIRS P6 LISS-III data to carry out the present study. The study wassupported by the Central University of Punjab, Bathinda, underthe UGC fellowship for the M. Phil.-Ph. D. course for researchscholars (CUPB/MPH-PHD/SEES/EVS/2013-14/17).
Edited by: Miriam Muñoz-RojasReviewed by: Fernando Pacheco, Sunday Adeniyi,Ferhat Türkmen, and two anonymous referees
References
Abbas, A. and Khan, S.: Using remote sensing techniques for ap-praisal of irrigated soil salinity, in: International Congress onModelling and Simulation (MODSIM), edited by: Oxley, L. andKulasiri, D., Modelling and Simulation Society of Australia andNew Zealand, Brighton, 2632–2638, 2007.
Al Khaier, F.: Soil Salinity Detection Using Satellite Remote Sens-ing, International Institute for Geo-Information Science andEarth Observation, Enschede, the Netherlands, 2003.
Alavi Panah, S. K. and Goossens, R.: Relationship between theLandsat TM, MSS data and soil salinity, J. Agric. Sci. Technol.,3, 21–23, 2001.
Ali, K. O., Hashim, N., Rostam, K., and Jusoh, H.: Spatial growthof the semi-squatter settlement in Tripoli, Libya, InternationalJournal of Research and Reviews in Applied Sciences, 9, 478–485, 2011.
Amundson, R., Berhe, A. A., Hopmans, J. W., Olson, C.,Sztein, A. E., and Sparks, D. L.: Soil science, soil and hu-man security in the 21st century, Science, 348, 1261071,https://doi.org/10.1126/science.1261071, 2015.
Ananda, J. and Herath, G.: Soil erosion in developing countries:a socio-economic appraisal, J. Environ. Manage., 68, 343–353,2003.
Asio, V. B., Jahn, R., Perez, F. O., Navarrete, I. A., andAbit Jr., S. M.: A review of soil degradation in the Philippines,Annals of Tropical Research, 31, 69–94, 2009.
Bai, Z. G., Dent, D. L., Olsson, L., and Schaepman, M. E.: Globalassessment of land degradation and improvement, identificationby remote sensing, Report No. 12, 2008/01, ISRIC, Wageningen,70 pp., 2008.
Barbero-Sierra, C., Marques, M. J., Ruiz-Pérez, M., Escadafal, R.,and Exbrayat, W.: How is desertification research addressed inSpain? Land versus soil approaches, Land Degrad. Dev., 26,423–432, https://doi.org/10.1002/ldr.2344, 2015.
Barrett-Lennard, E. G. and Hollington, P. A.: Development of a na-tional program on saline agriculture for Pakistan, available at:http://www.cazs.bangor.ac.uk/salinity/reports/Nationalprogram.htm (last access: 9 July 2016), 2006.
Batjes, N. H.: Projected changes in soil organic carbon stocks uponadoption of recommended soil and water practices in the UpperTana River Catchment, Kenia, Land Degrad. Dev., 25, 278–287,https://doi.org/10.1002/ldr.2141, 2014.
Behmanesh, B., Barani, H., Sarvestani, A. A., Shahraki, M. R., andSharafatmandrad, M.: Rangeland degradation assessment: a newstrategy based on the ecological knowledge of indigenous pas-
Solid Earth, 9, 75–90, 2018 www.solid-earth.net/9/75/2018/

N. Ahmad and P. Pandey: Assessment and monitoring of land degradation 87
toralists, Solid Earth, 7, 611–619, https://doi.org/10.5194/se-7-611-2016, 2016.
Biro, K., Pradhan, B., Buchroithner, M., and Makeschin, F.: Landuse/Land cover change analysis and its impact on soil propertiesin the northern part of Gadarif region, Sudan, Land Degrad. Dev.,24, 90–102, https://doi.org/10.1002/ldr.1116, 2013.
Bisaro, A., Kirk, M., Zdruli, P., and Zimmermann, W.: Globaldrivers setting desertification research priorities: insights froma stakeholder consultation forum, Land Degrad. Dev., 25, 5–6,https://doi.org/10.1002/ldr.2220, 2014.
Brevik, E. C., Cerda, A., Mataix-Solera, J., Pereg, L., Quinton, J. N.,Six, J., and Van Oost, K.: The interdisciplinary nature of soil,Soil, 1, 117–129, https://doi.org/10.5194/soil-1-117-2015, 2015.
Burchinal, L. S.: Lecture notes and steps in conducting a survey,presented at: the 2nd Annual Forestry Extension Workshop onthe Methodologies and Techniques in Conductive Forestry Ex-tension Program, 21 March 1989, Khartoum state, Sudan, 1989.
Cambardella, C. A., Moorman, T. B., Novak, J. M., Parkin, T. B.,Karlen, D. L., Turco, R. F., and Konopka, A. E.: Field scalevariability of soil properties in central Iowa soils, Soil Sci. Soc.Am. J., 58, 1501–1511, 1994.
Camprubi, A., Zarate, I. A., Adholeya, A., Lovato, P. E., and Cal-vet, C.: Field performance and essential oil production of myc-orrhizal rosemary in restoration low-nutrient soils, Land Degrad.Dev., 26, 793–799, https://doi.org/10.1002/ldr.2229, 2015.
Cerda, A., Gonzalez-Pelayo, O., Gimenez-Morera, A., Jordan, A.,Pereira, P., Novara, A., Brevik, E. C., Prosdocimi, M., Mahmood-abadi, M., Keesstra, S., Garcia, Orenes, F., and Ritsema, C.: Theuse of barley straw residues to avoid high erosion and runoff rateson persimmon plantations in Eastern Spain under low frequency– high magnitude simulated rainfall events, Soil Res., 54, 154–165, https://doi.org/10.1071/SR15092, 2016.
Chartres, C. J.: Australia’s land resources at risk: In land degrada-tion – problems and policies, Chap. 1.1., in: Physical and Bio-logical Aspects Of Land Degradation, University of Cambridge,Melbourne, Australia, 7–26, 1987.
Coppin, P., Jonckheere, I., Nackaerts, K., Muys, B., and Lam-bin, E.: Digital change detection methods in ecosystem mon-itoring: a review, Int. J. Remote Sens., 25, 1565–1596,https://doi.org/10.1080/0143116031000101675, 2004.
Costa, J. L., Aparicio, V., and Cerdà, A.: Soil physical qualitychanges under different management systems after 10 yearsin the Argentine humid pampa, Solid Earth, 6, 361–371,https://doi.org/10.5194/se-6-361-2015, 2015.
de Kimpe, C. R. and Warkentin, B. P.: Soil functions and the fu-ture of natural resources, in: Towards Sustainable Land Use: Fur-thering Cooperation Between People and Institutions, edited by:Blume, H. P., Eger, H., Fleischhauer, E., Hebel, A., Reij, C., andSteiner, K. G., Adv. Geoecol., 1, 3–10, 1998.
De Souza, R. G., Da Silva, D. K. A., De Mello, C. M. A.,Goto, B. T., Da Silva, F. S. B., Sampaio, E. V. S. B.,and Maia, L. C.: Arbuscular mycorrhizal fungi in re-vegetated mined dunes, Land Degrad. Dev., 24, 147–155,https://doi.org/10.1002/ldr.1113, 2013.
Directorate of Irrigation Research & Development (DIRD): Labo-ratory testing procedures for soil and water samples, availableat: http://www.dird-pune.gov.in/phec.htm, last access: 6 Novem-ber 2014.
Easdale, M. H.: Zero net livelihood degradation – the quest for amultidimensional protocol to combat desertification, SOIL, 2,129–134, https://doi.org/10.5194/soil-2-129-2016, 2016.
El Baroudy, A. A.: Monitoring land degradation us-ing remote sensing and GIS techniques in an area ofthe middle Nile Delta, Egypt, Catena, 87, 201–208,https://doi.org/10.1016/j.catena.2011.05.023, 2011.
FAO: State of the World’s Forest, Situation and Prospects for ForestConservation and Development, Rome, Italy, 1997.
Fazal, S.: Urban expansion and loss of agricultural land – a GISbased study of Saharanpur city, India, Environ. Urban., 12, 133–149, https://doi.org/10.1177/095624780001200211, 2000.
Firdaus, R., Nakagoshi, N., Idris, A., and Raharjo, B.: The relation-ship between land use/land cover change and land degradationof a natural protected area in Batang Merao Watershed, Indone-sia, in: Designing Low Carbon Societies in Landscapes, Springer,Tokyo, Japan, 239–251, 2014.
Fleskens, L. and Stringer, L. C.: Land management and policy re-sponses to mitigate desertification and land degradation, LandDegrad. Dev., 25, 1–4, https://doi.org/10.1002/ldr.2272, 2014.
Foley, J. A., De Fries, R., Asner, G. P., Barford, C., Bonan, G.,Carpenter, S. R., Chapin, F. S., Coe, M. T., Daily, G. C., andGibbs, H. K.: Global consequences of land use, Science, 309,570–574, https://doi.org/10.1126/science.1111772, 2005.
Fry, J., Xian, G., Jin, S., Dewitz, J., Homer, C., Yang, L., and Wick-ham, J. D.: Completion of the 2006 national land cover databasefor the conterminous United States, Photogramm. Eng. Rem. S.,77, 858–864, 2011.
Gessesse, B., Bewket, W., and Brauning, A.: Model-basedcharacterization and monitoring of runoff and soil ero-sion in response to land use/land cover changes in theModjo Watershed, Ethiopia, Land Degrad. Dev., 26, 711–724,https://doi.org/10.1002/ldr.2276, 2015.
Ghassemi, F., Jakeman, A. J., and Nix, H. A.: Salinization of Landand Water Resources: Human Causes, Management and CaseStudies, Centre for Resources and Environmental Studies, ANU,Canberra, University of New South Wales Press, Sydney, Aus-tralia, p. 562, 1995.
Gibson, P. and Power, C.: Introductory Remote Sensing: Digital Im-age Processing and Applications, Route ledge, 92–112, availableat: http://bibliotecadigital.ciren.cl/ (last access: 13 July 2016),2000.
Global Land Cover Facility (GLCF): Data & Products: Imageryand products, available at: http://www.glcf.umd.edu/, last access:17 December 2015.
Gupta, P. K.: Methods in Environmental Analysis Water Soil andAir, 2nd edn., Bharat Printers, Jodhpur, India, 229–231, 2007.
Hill, M. J., Braaten, R., Veitch, S. M., Lees, B. G., and Sharma, S.:Multi-criteria decision analysis in spatial decision support: theASSESS analytic hierarchy process and the role of quantitativemethods and spatially explicit analysis, Environ. Modell. Softw.,20, 955–976, https://doi.org/10.1016/j.envsoft.2004.04.014,2005.
ICAR (Indian Council of Agricultural Research): State of IndianAgriculture, 2012–2013, A report of Department of Agricultureand Cooperation, New Delhi, 9, 2010.
IS (Indian Standard): Methods of test for soils, Determination of pHvalue, IS: 2720-1, 1983, Bureau of Indian Standards, New Delhi,India, 1987.
www.solid-earth.net/9/75/2018/ Solid Earth, 9, 75–90, 2018

88 N. Ahmad and P. Pandey: Assessment and monitoring of land degradation
IS (Indian Standard): Method of test for soils, Determination of thespecific electrical conductivity of soils, IS: 14767-2000, Bureauof Indian Standards, New Delhi, India, 2000.
Jadhav, M. R. S. and Nagarale, V.: Changing land use pattern:a case study of Khedtahsil of the Pune district, Maharashtra state,Golden Research Thoughts, 1, 1–4, 2011.
Jensen, J. R.: Introductory Digital Image Processing: A RemoteSensing Perspective, 2nd edn., Prentice Hall, Inc., Upper SaddleRiver, New Jersey, USA, 1996.
Jin-Song, D., Ke, W., Jun, L. I., and Yan-Hua, D.: Urbanland use change detection using multi sensor satellite im-ages. Soil Science Society of China, Pedosphere, 19, 96–103,https://doi.org/10.1016/S1002-0160(08)60088-0, 2009.
Kaur, B., Vatta, K., and Sidhu, R. S.: Optimising Irrigation WaterUse in Punjab Agriculture: role of Crop Diversification and Tech-nology, Ind. Jn. Agri. Econ., 70, 307–318, 2015.
Khaledian, Y., Kiani, F., Ebrahimi, S., Brevik, E. C., andAitkenhead-Peterson, J.: Assessment and monitoringof soil degradation during land use change using mul-tivariate analysis, Land Degrad. Dev., 28, 128–141,https://doi.org/10.1002/ldr.2541, 2017.
Koshal, A. K.: Satellite image analysis of salinity areas throughGPS, Remote sensing and GIS, in: 14th Annual InternationalConference and Exhibition on Geospatial Technology and Ap-plications, India Geospatial Forum, 7–9 Febuary, 2012, Gurgoan,India, 1–13, 2012.
Leh, M., Bajwa, S., and Chaubey, I.: Impact of land use change onerosion risk: an integrated remote sensing, geographic informa-tion system and modelling methodology, Land Degrad. Dev., 24,409–421, https://doi.org/10.1002/ldr.1137, 2013.
Lillesand, T. M. and Kiefer, R. W.: Remote Sensing and Image In-terpretation, 3rd edn., John Wiley and Sons, New York, 161–163,1994.
Liu, G. M., Yang, J. S., and Yao, R. J.: Electrical conductivity insoil extracts: chemical factors and their intensity, Institute ofSoil Science, Chinese Academy of Sciences, Nanjing (China),Pedosphere, 16, 100–107, https://doi.org/10.1016/S1002-0160(06)60031-3, 2006.
Liu, W., Du, P., Zhao, Z., and Zhang, L.: An adaptive weightingalgorithm for interpolating the soil potassium content, Sci. Rep.-UK, 6, 23889, https://doi.org/10.1038/srep23889, 2016.
Low, P. S. (Ed.): Economic and social impacts of deser-tification, land degradation and drought, White Paper I.UNCCD 2nd Scientific Conference, prepared with the con-tributions of an international group of scientists, avail-able at: https://profiles.uonbi.ac.ke/jmariara/files/unccd_white_paper_1.pdf (last access: 16 September 2016), 2013.
Lugo, A. E.: The future of the forest: ecosystem re-habilitation in the tropics, Environment, 30, 41–45,https://doi.org/10.1080/00139157.1988.9930900, 1988.
Maitima, J. M., Mugatha, S. M., Reid, R. S., Gachimbi, L. N., Ma-jule, A., Lyaruu, H., and Mugisha, S.: The linkages between landuse change, land degradation and biodiversity across East Africa,African Journal of Environmental Science and Technology, 3,310–325, 2009.
Majule, A. E.: A study on land use types, soils and linkage be-tween soils and biodiversity along the slopes of Mt. Kiliman-jaro, Tanzania, available at: www.Lucideastafrica.org (last ac-cess: 8 September 2017), 2003.
Manua, A. K. and Sharma, R. C.: Computerized database on saltaffected soils of Haryana state, J. Indian Soc. Remote, 33, 447–455, https://doi.org/10.1007/BF02990017, 2005.
Mathew, J.: Wizard Geography for General Studies, 7th ed., CareerClassics, New Delhi, India, 55, 2014.
Mehrjardi, R. T., Taze, M., Mahmoodi, S., and Saheb, J. E.: Accu-racy assessment of soil salinity map in Yazd-Ardakan Plain, Cen-tral Iran, based on landsat ETM+ image, Am. Eurasian J. Agric.Environ. Sci., 3, 708–712, 2008.
Miransari, M. and Mackenzie, A. F.: Wheat (Triticum aestivum L.)grain N uptake as affected by soil total and mineral N, for thedetermination of optimum N fertilizer rates for wheat production,Commun. Soil Sci. Plan., 41, 1644–1653, 2010.
Misana, S. B., Majule, A. E., and Lyaruu, H. V.: Linkages betweenchanges in land use, biodiversity and land degradation on theslopes of Mount Kilimanjaro, Tanzania, LUCID Working pa-per No. 38, International Livestock Research Institute, Nairobi,2003.
Mora-Vallejo, A., Claessens, L., Stoorvogel, J., andHeuvelink, G. B.: Small scale digital soil map-ping in Southeastern Kenya, Catena, 76, 44–53,https://doi.org/10.1016/j.catena.2008.09.008, 2008.
Mohawesh, Y., Taimeh, A., and Ziadat, F.: Effects of land usechanges and soil conservation intervention on soil properties asindicators for land degradation under a Mediterranean climate,Solid Earth, 6, 857–868, https://doi.org/10.5194/se-6-857-2015,2015.
Munoz-Rojas, M., Jordan, A., Zavala, L. M., Dela, R. D., Abd-Elmabod, S. K., and Anaya-Romero, M.: Impact of land useand land cover changes on organic carbon stocks in Mediter-ranean soils (1956–2007), Land Degrad. Dev., 26, 168–179,https://doi.org/10.1002/ldr.2194, 2015.
Nachtergaele, F., Petri, M., Biancalani, R., Van Lynden, G., andVan Velthuizen, H.: Global Land Degradation Information Sys-tem (GLADIS), Beta Version, An information database for landdegradation assessment at global level, Land Degradation As-sessment in Dry lands Technical Report, no. 17, FAO, Rome,Italy, 2010.
Novara, A., Gristina, L., Guaitoli, F., Santoro, A., and Cerdà,A.: Managing soil nitrate with cover crops and bufferstrips in Sicilian vineyards, Solid Earth, 4, 255–262,https://doi.org/10.5194/se-4-255-2013, 2013.
Ochoa, P. A., Fries, A., Mejia, D., Burneo, J. I., Ruiz-Sinoga, J. D.,and Cerda, A.: Effects of climate, land cover and topography onsoil erosion risk in a semiarid basin of the Andes, Catena, 140,31–42, https://doi.org/10.1016/j.catena.2016.01.011, 2016.
Ohta Y. and Nakagoshi N.: Analysis of Factors Affecting the Land-scape Dynamics of Islands in Western Japan, n: Landscape Ecol-ogy in Asian Cultures, edited by: Hong, S. K., Kim, J. E., Wu,J., and Nakagoshi N., Ecol. Res. Monogr. Springer, Tokyo, 169–185, https://doi.org/10.1007/978-4-431-87799-8_12, 2011.
Olang, L. O., Kundu, P. M., Ouma, G., and Furst, J.: Impact of landcover change scenarios on storm runoff generation: a basis formanagement of the Nyando basin, Kenya, Land Degrad. Dev.,25, 267–277, https://doi.org/10.1002/ldr.2140, 2014.
Omuto, C. T., Balint, Z., and Alim, M. S.: A framework for nationalassessment of land degradation in the drylands: a case study ofSomalia, Land Degrad. Dev., 25, 105–119, 2014.
Solid Earth, 9, 75–90, 2018 www.solid-earth.net/9/75/2018/

N. Ahmad and P. Pandey: Assessment and monitoring of land degradation 89
Opeyemi, Z. A.: Monitoring the growth of settlements in Ilorin,Nigeria (a GIS and remote sensing approach), Int. Arch. Pho-togramm., 37, 225–232, 2008.
Pacheco, F. A. L. and Sanches Fernandes, L. F.: Environmental landuse conflicts in catchments: a major cause of amplified nitrate inriver water, Sci. Total Environ., 548, 173–188, 2016.
Pacheco, F. A. L., Varandas, S. G. P., Sanches Fernandes, L. F.,and Valle Junior, R. F.: Soil losses in rural watersheds with en-vironmental land use conflicts, Sci. Total Environ., 485–486C,110–120, 2014.
Pallavicini, Y., Alday, J. G., and Martinez-Ruiz, C. F.: Factorsaffecting herbaceous richness and biomass accumulation pat-terns of reclaimed coal mines, Land Degrad. Dev., 26, 211–217,https://doi.org/10.1002/ldr.2198, 2015.
Petit, C., Scudder, T., and Lambin, E.: Quantifying pro-cesses of land-cover by remote sensing, resettlementand rapid land-cover change in south-eastern Zimbabweremote sensing, Int. J. Remote Sens., 22, 3435–3456,https://doi.org/10.1080/01431160010006881, 2001.
Prakasam, C.: Land use and land cover change detection throughremote sensing approach: a case study of Kodaikanaltaluk, TamilNadu, International Journal of Geomatics and Geosciences, 1,150–158, 2010.
Raina, P.: Soil degradation assessment through remote sensingand its impact on fertility status of soils of Western Rajasthan,Agropedology, 9, 30–40, 1999.
Sadeghravesh, M. H., Khosravi, H., and Ghasemian, S.: As-sessment of combating-desertification strategies usingthe linear assignment method, Solid Earth, 7, 673–683,https://doi.org/10.5194/se-7-673-2016, 2016.
Sala, O. E., Chapin III, F. S., Armesto, J. J., Berlow, E.,Bloomfield, J., Dirzo, R., Huber-Sanwald, E., Huen-neke, L. F., Jackson, R. B., and Kinzig, A.: Global biodi-versity scenarios for the year 2100, Science, 287, 1770–1774,https://doi.org/10.1126/science.287.5459.1770, 2000.
Sheng, J., Ma, L., Jiang, P. A., Li, B., Huang, F., and Wu, H.: Digi-tal soil mapping to enable classification of the salt-affected soilsin desert agro-ecological zones, Agr. Water Manage., 97, 1944–1951, 2010.
Silambarasan, K., Vinaya, M. S., and Babu, S. S.: Urban sprawlmapping and landuse change detection in and around UdupiTown: a remote sensing based approach, Int. J. Sci. Res. Eng.Technol., 2, 815–820, 2014.
Slinger, D. and Tenison, K.: Salinity Glove Box Guide: NSW Mur-ray & Murrumbidgee Catchments, in: Irrigation Salinity Causesand Impacts, October 2009, NSW Department of Primary Indus-tries, available at: http://www.dpi.nsw.gov.au/primefacts (last ac-cess: 15 April 2016), 2007.
Sommer, S., Hill, J., and Megier, J.: The potential of remote sensingfor monitoring rural land use changes and their effects on soilconditions, Agr. Ecosyst. Environ., 67, 197–209, 1998.
Srinivasarao, C. H., Venkateswarlu, B., Lal, R., Singh, A. K.,Kundu, S., Vittal, K. P. R., Patel, J. J., and Patel, M. M.:Long-term manuring and fertilizer effects on depletion of soilorganic carbon stocks under pearl millet-cluster bean-castorrotation in western India, Land Degrad. Dev., 25, 173–183,https://doi.org/10.1002/ldr.1158, 2014.
Stimson, H. C., Breshears, D. D., Ustin, S. L., and Ke-fauver, S. C.: Spectral sensing of foliar water conditions
in two co-occurring conifer species: Pinus edulis and Ju-niperus monosperma, Remote Sens. Environ., 96, 108–118,https://doi.org/10.1016/j.rse.2004.12.007, 2005.
Stringer, L. C. and Harris, A.: Land degradation in Dolj county,southern Romania: environmental changes, impacts and re-sponses, Land Degrad. Dev., 25, 17–28, 2014.
Sujatha, G., Dwivedi, R. S., Sreenivas, K., and Venkatarat-nam, L.: Mapping and monitoring of degraded lands in partof Jaunpur district of Uttar Pradesh using temporal space-borne multispectral data, Int. J. Remote Sens., 21, 519–531,https://doi.org/10.1080/014311600210722, 2000.
Symeonakis, E., Karathanasis, N., Koukoulas, S., and Panagopou-los, G.: Monitoring sensitivity to land degradation and deser-tification with the environmentally sensitive area index: thecase of Lesvos Island, Land Degrad. Dev., 27, 1562–1573,https://doi.org/10.1002/ldr.2285, 2016.
Taguas, E. V., Arroyo, C., Lora, A., Guzmán, G., Vanderlinden, K.,and Gómez, J. A.: Exploring the linkage between spontaneousgrass cover biodiversity and soil degradation in two olive orchardmicrocatchments with contrasting environmental and manage-ment conditions, SOIL, 1, 651–664, https://doi.org/10.5194/soil-1-651-2015, 2015.
Tiwana, N. S., Jerath, N., Ladhar, S. S., Singh, G., and Paul, R.:State of Environment Punjab, A Report by Punjab State Coun-cil for Science and Technology (PSCST), Chandigarh in col-laboration with The Energy & Resources Institute (TERI), 83,New Delhi, available at: http://www.punenvis.nic.in (last access:17 May 2016), 2007.
United States Geological Survey (USGS): EarthExplorer – USGSQuery and order satellite images, aerial photographs, and carto-graphic products through the U.S. Geological Survey, availableat: http://www.usgs.gov/, last access: 17 December 2015.
Vagen, T. G., Shepherd, K. D., and Walsh, M. G.: Sens-ing landscape level change in soil fertility following de-forestation and conversion in the highlands of Madagas-car using Vis-NIR spectroscopy, Geoderma, 133, 281–294,https://doi.org/10.1016/j.geoderma.2005.07.014, 2006.
Valera, C. A., Valle Junior, R. F., Varandas, S. G. P., SanchesFernandes, L. F., and Pacheco, F. A. L.: The role of envi-ronmental land use conflicts in soil fertility: a study on theUberaba River basin, Brazil, Sci. Total Environ., 562, 463–473,https://doi.org/10.1016/j.scitotenv.2016.04.046, 2016.
Valle Junior, R. F., Varandas, S. G. P., Sanches Fernandes, L. F., andPacheco, F. A. L.: Environmental land use conflicts: a threat tosoil conservation, Land Use Policy, 41, 172–185, 2014a.
Valle Junior, R. F., Varandas, S. G. P., Sanches Fernandes, L. F.,and Pacheco, F. A. L.: Groundwater quality in rural watershedswith environmental land use conflicts, Sci. Total Environ., 493,812–827, 2014b.
Valle Junior, R. F., Varandas, S. G. P., Pacheco, F. A. L.,Pereira, V. R., Santos, C. F., Cortes, R. M. V., and Fernan-des, L. F. S.: Impacts of land use conflicts on riverine ecosystems,Land Use Policy, 43, 48–62, 2015.
Verheye, W. and Paul, W.: Land Use Planning for Sustainable De-velopment, University of Gent, Belgium, 1997.
Verma, S. C., Jain, R. K., Rao, M. V., Misra, P. N., and Murty, A. S.:Influence of canopy on soil composition of man-made forest inalkali soil of Banthra (Lucknow), Indian For., 108, 431–437,1982.
www.solid-earth.net/9/75/2018/ Solid Earth, 9, 75–90, 2018
90 N. Ahmad and P. Pandey: Assessment and monitoring of land degradation
Wu, J.: Environmental amenities, urban sprawl, and communitycharacteristics, J. Environ. Econ. Manag., 52, 527–547, 2006.
Zhang, Y. B., Deng, A. Y., and Zhuang, T. C.: Relation between soilsalinity in intertidal zone and electric conductivity, Ecol. Envir.,12, 164–165, https://doi.org/10.5846/stxb201305311254, 2003.
Zhang, J., Niu, J., Bao, T., Buyantuyev, A., Zhang, Q., Dong, J.,and Zhang, X.: Human induced dryland degradation in Ordosplateau, China, revealed by multi-level statistical modelling ofnormalized difference vegetation index and rainfall time series,J. Arid Land, 6, 219–229, https://doi.org/10.1007/s40333-013-0203-x, 2014.
Zhao, X., Dai, J., and Wang, J.: GIS-based evaluation andspatial distribution characteristics of land degradation in Bi-jiang watershed, International Conference on Combating LandDegradation in Agricultural Areas (ICCLD’10) Zian City,PR China, 11–15 October 2010, Springer Plus, 2, S8,https://doi.org/10.1186/2193-1801-2-S1-S8, 2013.
Solid Earth, 9, 75–90, 2018 www.solid-earth.net/9/75/2018/


![Land degradation [autosaved]](https://img.pdfslide.net/doc/110x75/55871382d8b42ae2508b45bf/land-degradation-autosaved.jpg)