Embed Size (px)
Citation preview
Assessment for Effective Intervention37(1) 34 –49© 2011 Hammill Institute on DisabilitiesReprints and permission: http://www. sagepub.com/journalsPermissions.navDOI: 10.1177/1534508411413254http://aei.sagepub.com
Article
The Peabody Picture Vocabulary Test–Revised (PPVT-R) was introduced by L. M. Dunn and Dunn (1981) as a mea-sure of receptive vocabulary for children. Since its intro-duction, it has been widely used in research and practice (e.g., Pankratz, Morrison, & Plante, 2004). The examinee is asked to indicate on a stimulus plate which of four drawings corresponds to a spoken word (noun, verb, or adjective). Because of the special response requirements of the tasks, it is reasonable to expect that perceptual organization and decision-making ability may account for a certain amount of individual variability in performance, although, at least in children, PPVT-R performance loads primarily on verbal comprehension-related factors (Culbert, Hamer, & Klinge, 1989; D’Amato, Gray, & Dean, 1988). The utility of the test has been appraised for a variety of clinical groups and pur-poses. Ease of administration and scoring and the fact that the test does not require a verbal response make it appealing for assessing language as well as general intellectual ability in children with intellectual disabilities, severe language impairments, or emotional and behavioral disorders (Ollen-dick, Finch, & Ginn, 1974; Pasnak, Willson-Quayle, & Whitten, 1998).
The PPVT-R has often been used as a measure of lexical (i.e., word) knowledge in studies investigating sources of
individual variability in reading achievement (for a recent review see Joshi, 2005). In addition to the theoretical expec-tation that strong vocabulary knowledge would facilitate flu-ency and reading comprehension (Dixon, LeFevre, & Twilley, 1988; Frost, Madsbjerg, Niedersoe, Olofsson, & Sorensen, 2005), several recent empirical findings appear to support this thesis (Vellutino, Tunmer, Jaccard, & Chen, 2007; Verhoeven, van Leeuwe, & Vermeer, 2011; Yovanoff, Duesbery, Alonzo, & Tindal, 2005). Furthermore, some authors argued that the benefits from an extensive oral lan-guage vocabulary extend far beyond reading comprehension to promote future academic success (Beck & McKeown, 1991; Biemiller, 1999). In recent studies, measures of lexical/semantic knowledge including PPVT-R were found to account for significant amounts of variance in reading com-prehension scores even after controlling for age, word/nonword reading skills, automatized naming, and listening
413254 AEI37110.1177/1534508411413254Simos et al.Assessment for Effective Intervention© 2011 Hammill Institute on Disabilities
Reprints and permission: http://www.sagepub.com/journalsPermissions.nav
1University of Crete, Rethimno, Crete, Greece2Institute of Language and Speech Processing
Corresponding Author:Panagiotis G. Simos, Department of Psychology, University of Crete, Rethimno, 74100, Crete, Greece Email: [email protected]
Psychometric Evaluation of a Receptive Vocabulary Test for Greek Elementary Students
Panagiotis G. Simos1, Georgios D. Sideridis1, Athanassios Protopapas2, and Angeliki Mouzaki1
AbstractAssessment of lexical/semantic knowledge is performed with a variety of tests varying in response requirements. The present study exemplifies the application of modern statistical approaches in the adaptation and assessment of the psychometric properties of the Peabody Picture Vocabulary Test–Revised (PPVT-R) Greek. Confirmatory factor analyses applied to data from a large sample of elementary school students (N = 585) indicated the existence of a single vocabulary dimension and differential item functioning procedures pointed to minimal bias due to gender or ethnic group. Rasch model–derived indices of item difficulty and discrimination were used to develop a short form of the test, which was administered to a second sample of 900 students. Convergent and discriminant validity were assessed through comparisons with the Wechsler Intelligence Scales for Children–III Vocabulary and Block design subtests. Short- and long-term stability of individual scores over a 6-month period were very high, and the utility of the test as part of routine educational assessment is attested by its strong longitudinal predictive value with reading comprehension measures. It is concluded that the Greek version of the PPVT-R constitutes a reliable and valid assessment of vocabulary for Greek students and immigrants who speak Greek.
Keywordslanguage tests, PPVT, Rasch model, item difficulty
at University of Athens on June 15, 2012aei.sagepub.comDownloaded from
Simos et al. 35
comprehension or nonverbal intelligence, in elementary edu-cation students (Protopapas, Sideridis, Mouzaki, & Simos, 2007) and young adults (Braze, Tabor, Shankweiler, & Mencl, 2007). Word knowledge may account for discrepan-cies between decoding and reading comprehension skills (Oakhill, Cain, & Bryant, 2003). While vocabulary measures cannot substitute print-based comprehension measures in the assessment of text-related reading difficulties, they may pro-vide useful information regarding individual weaknesses in lexical knowledge, which could then be targeted as part of comprehensive remediation programs. Recently, there has been an increasing evidence-based trend to develop reading interventions using a flexible group approach based on pat-terns of linguistic and cognitive strengths and weaknesses of individual students (Denton & Vaughn, 2010; Elbaum, Vaughn, Hughes, & Moody, 2000; Vaughn & Linan-Thompson, 2003).
In this context, it is necessary to identify valid indices of both the depth and breadth of lexical knowledge (Ouellette, 2006), which, according to one view, should reflect the exis-tence of lexical entries associated with redundant (phonologi-cal, orthographic, and semantic) information (Perfetti, 2007; Perfetti & Hart, 2001). Notably, vocabulary measures sub-sume most comprehension variance at a comparatively higher psychometric reliability and greater ease of test con-struction, administration, and scoring (Protopapas, Mouzaki, Sideridis, Kotsolakou, & Simos, in press; Protopapas, Simos, Sideridis, & Mouzaki, in press). Vocabulary measures such as the PPVT are thus important in the assessment of clinically and academically relevant verbal skills in a wide age range. The present study evaluated the psychometric properties of the Greek adaptation of the PPVT-R (reliability, concur-rent and predictive validity, internal structure, and item bias) addressing the need of sensitive measures of lexical knowl-edge for psychologists, speech therapists, and special educa-tors. A short version of the test was derived through Rasch model–based item-level analyses offering professionals greater flexibility in the design of comprehensive, yet rela-tively brief, assessment batteries for specific weaknesses that can become targets of effective educational interventions.
Importance of the StudyIn view of the demonstrated utility and predictive value of the PPVT-R for both clinical and research purposes, a detailed investigation of its psychometric adequacy is desirable. This is particularly important given the fact that the validity of the PPVT-R has been questioned on the grounds that it is influenced by motivational factors (Zigler, Abelson, & Seitz, 1973), characteristics of the examiners (Lasky, Felice, Moyer, Buddington, & Elliot, 1973), or students’ placement (Seitz, Abelson, Levine, & Zigler, 1975). In light of the above concerns, it is important to examine the validity of the PPVT-R for a range of popula-tions and assessment purposes. Despite reported gender and
ethnic differences in PPVT total scores (Qi, Kaiser, Milan, & Hancock, 2006; Wolf & Gow, 1985/1986), bias at the item level remains understudied. So far, very few studies have tested for item bias across populations (Colarusso, McLeskey, & Gill, 1977; Jensen, 1974), none of which have employed the Rasch model, which is arguably most appropriate for the detection of such biases affording non-linear modeling and control for ability levels.
In addition to possible bias, instrument dimensionality and stability are also important. Unidimensionality of the PPVT has traditionally been assessed using standard factor-analytic techniques, instead of the more appropriate proce-dures that accommodate dichotomous data (i.e., based on polychoric correlations; Ball, Payne, & Hallahan, 1973; D’Amato et al., 1988). Only recently have such analytical advances been implemented in statistical software (e.g., EQS; Bentler, 2000). So far, the items of the PPVT have not been calibrated across grades and tested over time. The sta-bility of the normative distribution of scores must be assessed if the measure is to be used as a longitudinal pre-dictor of disability or achievement; however, there are few data bearing on this issue (e.g., Naglieri & Pfeiffer, 1983; Scruggs, Mastropieri, & Argulewicz, 1983). Finally, and in conjunction with potential biases, the invariance of the one-factor model to explain data from various populations has not been established. This would entail tests of measure-ment invariance across populations, such as those repre-sented by different age groups or grades (for a description see G. Dunn, Everitt, & Pickles, 2002).
The present study complements and extends previous studies by examining specific psychometric attributes of the PPVT-R through Rasch and Confirmatory Factor Analysis (CFA) models, to address the aforementioned concerns. As such, it provides added support for the utility of PPVT-R in educational contexts. The investigation of dimensional sta-bility and gender and ethnic (immigrant status) bias is par-ticularly important in this respect as it ensures a solid psychometric foundation for the professional using PPVT-R with diverse student populations. The type of data used in the present study (including additional standardized mea-sures of vocabulary, nonverbal intelligence and reading achievement, obtained both concurrently and longitudi-nally) and the analysis procedures may also serve as a model for similar validation studies in other languages. Finally, the study addresses the need for a brief measure of receptive vocabulary for school-aged children in Greek that can be used for both clinical and research purposes.
MethodParticipants
Pilot study. Pilot data on the entire translated version of PPVT-R Form L were collected from two groups. The first group included 50 children 6 to 7 years old, attending
at University of Athens on June 15, 2012aei.sagepub.comDownloaded from
36 Assessment for Effective Intervention 37(1)
regular classrooms, without a history of learning difficulties (based on the school records and teacher report) in four public schools in Athens and rural Rethymno, Crete, aiming primarily to assess the appropriateness of the first 49 items of the test. Selection of classrooms and students within each school followed a stratified randomized procedure. Given that the test is also intended for use with adults, a second group of 70 young adults (age range 18–38 years; 35 men) was tested, including college students and residents of Ath-ens and Rethymno (a town with a population of approxi-mately 20,000, on the island of Crete). This sample included an intentional overrepresentation (55%) of persons with 9 years of formal education or fewer. Adult participants were recruited through ads posted in the university and in local companies. Quantitative as well as qualitative data from the adult participants were used to identify plates that might be culturally inappropriate or require modifications in the cor-responding target words.
Cohort 1. The adapted version of the PPVT-R (based on the pilot data) was administered to 585 students attending Grades 2 to 4 in Crete, Athens, and the island of Zakynthos (Time 1; see Table 1). School selection followed a stratified randomized approach in an effort to include units representa-tive of urban (seven schools), rural (three schools), and semi-urban areas (seven schools). Children were selected randomly from each class but only those whose parents gave written permission for participating in the research were included in the study. There were 537 Greek students and 48 of Albanian origin (immigrants) who had attended Greek schools since Grade 1 and had adequate language skills (i.e., comparable to typical Greek students based on teacher report). A subset of 500 students were retested 6 months later in order to estimate the long-term stability of PPVT-R scores (Time 2). Finally, 24 months after the initial assessment (Time 3), a measure of
reading comprehension (Test of Reading Performance; Side-ridis & Padeliadu, 2000) was also available for 494 of these students, in addition to PPVT-R scores, in order to establish the predictive validity of the test.
The sample described in Table 1 includes students with-out history of learning disability (based on school records and teacher report), attending regular public school class-rooms. All students were administered the WISC-III Vocabulary and Block Design subtests (in order to screen for potential undiagnosed intellectual disability) achieving standard scores > 4 and Greek as their primary language. Parental occupation of participants was classified into five major occupational levels intended to reflect in part the edu-cational level of the parent as well. Level A included profes-sionals in disciplines that require higher education degree, including teachers (corresponds roughly to Level I used by L. Dunn et al., 1986); Level B included mainly clerical workers whose position did not require higher education degree (corresponds roughly to Levels II and IV in L. Dunn et al., 1986); Level C included primarily small private (including family) business owners; Level D included homemakers (in our samples it applies to mothers only); and Level E included laborers, farmers, and unemployed persons (Levels III and IV in L. Dunn et al., 1986).
Cohort 2. The Short version of the PPVT-R, developed using procedures described in more detail below, was administered to a separate sample of 916 children in Grades 1 to 6. This sample was obtained from four broad geograph-ical regions of Greece (Thessaloniki, Thessaly, Attiki, and Crete) and was representative of the Greek student popula-tion in terms of type of geographical region and parent edu-cation level. Detailed demographic information is presented in Table 2. All students had Greek as their primary language, no history of learning disability (based on teacher report),
Table 1. Demographic Information for Cohort 1
Age Range (Months)
Variable 87–95 96–104 105–113 114–123 124–131 132–139 140–147
Mean (SD) age (in months) 92 (2.4) 100 (2.6) 109 (2.5) 118 (2.8) 128 (2.2) 135 (2.3) 143 (2.1)n 130 126 124 139 117 107 108Grade G2 54 (G2)
71 (G3) 96 (G3) 27 (G4)
G4 G5 49 (G5) 58 (G6)
G6
Gender (boys/girls) 63/67 59/67 59/65 68/71 50/67 55/52 52/56Occupation (father, %
Levels A/B/C/Ea)11/51/20/18 14/50/22/14 12/50/24/14 9/41/28/22 9/47/28/16 11/50/21/18 10/40/30/20
Occupation (mother, % Levels A/B/C/D/Ea)
12/48/11/26/3 14/48/7/27/4 16/45/16/20/3 10/47/13/27/3 12/48/12/26/2 14/44/19/19/4 11/46/12/27/4
IQb 9.5 (2.3) 9.6 (2.4) 9.8 (2.4) 9.5 (2.4) 9.7 (2.4) 9.9 (2.5) 9.5 (2.3)
a. Level A: professionals in disciplines that require higher education degree; Level B: mainly clerical workers whose position did not require higher educa-tion degree; Level C: primarily small private (including family) business owners; Level D: homemakers (mothers only); and Level E: laborers, farmers, and unemployed persons.b. Mean standard score of Wechsler Intelligence Scale for Children (WISC)–III Vocabulary and Block Design.
at University of Athens on June 15, 2012aei.sagepub.comDownloaded from

Simos et al. 37
attended regular public school classrooms, and scored in the average or above average range (no less than 2 SDs below the population mean) on an IQ index composed of standard (z) scores on Wechsler Intelligence Scales for Children (WISC)–III Vocabulary and Raven Progressive Matrices Short Forms. Parental occupation was classified as for Cohort 1.
MeasuresWord reading accuracy was measured with the Test of Reading Performance (TORP; Sideridis & Padeliadu, 2000)–subscale 5, which is a list of 40 printed words to be read aloud without time pressure. Pseudoword reading accu-racy was measured with TORP–subscale 6, which is a list of 19 printed pseudowords to be read aloud without time pres-sure. Reading comprehension was measured with TORP–subscale 13, which includes six passages of increasing length and two to four multiple-choice questions after each passage. Expressive vocabulary was tested with the vocabu-lary subtest of the Greek standardization of WISC-III (Georgas, Paraskevopoulos, Bezevegis, & Giannitsas, 1997), in which children provide word definitions. Nonverbal intelligence was tested with the Block Design subtest of the WISC-III, in which children re-creategeometric designs using two-colored blocks. Details of the assessment mea-sures are reported in Sideridis, Mouzaki, Simos, and Protopapas (2006) and Protopapas et al. (2007); see Protopapas, Simos et al. (in press) for measure reliability information. All measures were administered at Time 1 and all but WISC-III Block Design at Time 3. Only the PPVT-R was administered at Time 2.
Procedures
All children were tested individually by a group of Psychology graduates with prior experience in the adminis-tration of psychometric tests, who underwent an additional 1-week custom training program. Training included super-vised administration of the test battery to the study coordi-nators and to at least two students (not included in the final sample) under supervision by the study coordinators with rigorous pass–fail criteria monitored on a structured check-list. Research assistants who committed more than three administration errors in three mock testing sessions were excluded from the research group. Students who made one to three errors were given additional training and repeated the mock assessments until they demonstrated flawless administration.
Participation in the project was voluntary and partici-pants were aware that they could decline to respond to any item or that they could terminate their involvement at any time. Short breaks were taken as required. Participant responses were recorded manually and entered into an SPSS database by a separate group of research assistants. Spot-checks for data entry accuracy were performed on 5% of the cases and error rates at the item level were estimated to be less than 1%. Cases with any missing item-level data for PPVT-R full and short forms were not included in fur-ther analyses (five cases that were excluded from Cohort 1 and nine cases from Cohort 2 are not included in the sam-ples reported here).
Based on the pilot data, extensive modifications were deemed necessary in the structure of the test in order to
Table 2. Demographic Information for Cohort 2
Age Range (Months)
Variable 75–82 83–90 91–98 99–107 108–116 117–125 126–134
Mean (SD) age (in months)
79 (2.2) 87 (2.3) 94 (2.1) 103 (2.5) 112 (2.6) 121 (2.6) 130 (2.3)
n 130 129 114 150 150 118 132Grade G1 G1 (60)
G2 (69)G2 G3 G3 (40)
G4 (110)G4 (70)G5 (48)
G5 (68)G6 (62)
Gender (boys/girls) 64/66 65/64 58/56 80/70 63/87 64/54 69/63Occupation (father, %
Levels A/B/C/Ea)16/46/8/25 14/39/16/31 15/40/9/37 11/42/10/41 16/41/13/30 21/34/12/33 18/32/15/34
Occupation (mother, % Levels A/B/C/D/Ea)
20/36/6/30/8 17/18/5/50/10 22/33/-/35/10 13/30/7/38/12 22/24/3/43/8 26/35/2/27/10 22/34/4/34/6
IQb .05 (.66) !.05 (.64) .03 (.73) .007 (.70) .02 (.72) .03 (.67) .08 (.74)
a. Level A: professionals in disciplines that require higher education degree; Level B: mainly clerical workers whose position did not require higher educa-tion degree; Level C: primarily small private (including family) business owners; Level D: homemakers (mothers only); and Level E: laborers, farmers, and unemployed persons.b. Mean standard score of Wechsler Intelligence Scale for Children (WISC)–III Vocabulary and Block Design. Estimated IQ (z score) based on WISC-III Vocabulary and Raven Progressive Matrices Short Forms
at University of Athens on June 15, 2012aei.sagepub.comDownloaded from
38 Assessment for Effective Intervention 37(1)
accommodate linguistic and cultural differences. Pilot data from children aged 6 to 7 years indicated that the first 49 items in the original version were very easy for this age range (correct response rate was >85% for all items). Accordingly, administration of the test to Cohort 1 children started with Item 50 (the starting point for children aged 6.5 years in the English version of PPVT-R). Pilot data from the adult group indicated that two of the original plates (Items 65 and 69) contained culturally unfamiliar stimuli and were excluded from the Greek adaptation, leaving a total of 173 plates. For 44 of the stimulus plates, the Greek translation of the original target word was judged to be ambiguous/polysemous or dramatically different in subjective familiar-ity compared with the English original. For those plates, the target word was substituted with a word depicted by one of the remaining three pictorial stimuli, having a single domi-nant meaning in Greek and an estimated familiarity closer to the original English word. Changes in the order of pre-sentation for several items were also deemed necessary based on item difficulty (percentage correct responses aver-aged across the two pilot data sets). Finally, a more lenient stopping rule (eight failures in 10 consecutive trials) was adopted to increase the sensitivity of the measurements. In case of an incorrect response within the first six items (Items 50–55), the examiner administered items reversely (starting from Item 49), until a basal of 6 consecutive cor-rect responses was reached. It should be noted, however, that only 130 plates were ever administered and these con-stitute the final full version of the PPVT-R to be used in the age range of Cohort 1 (Items 50–173 plus Items 44–49, which were used only occasionally for reverse administra-tion purposes). Standard administration procedures were used for WISC-III Block Design and Vocabulary subtests.
Selection of items for the short form was based on (a) item–total correlation coefficients and (b) item difficulty estimates obtained using the Rasch model (Rasch, 1980; Smith & Smith, 2004). The latter index was also used to determine changes in the order of presentation for items included in the short form.
Data AnalysesDimensionality using the Rasch model. Two different meth-
ods were used to test the hypothesis that individual variabil-ity across PPVT-R items can be modeled by a single underlying factor (Rasch model–based analyses and confir-matory factor analysis [CFA]). Given the dichotomous nature of the data at the item level, the Rasch model may be considered more appropriate. The model postulates that the difference between the ability of the person and the diffi-culty of the item defines one’s probability of success in solving an item correctly. The formula used to estimate the probability of person n solving item i correctly is
Pni
(xni
= 1/Bn, D
i) = , (1)
where Pni
(xni
= 1/Bn, D
i) is the probability of person n
getting item i correct (rather than not getting it correct) given a person’s ability B and item difficulty D in logits; e ! 2.71828 (Bond & Fox, 2001; Rasch, 1980; Smith & Smith, 2004; Wright & Stone, 2003). For example, if a very capable person who scores 2 logits on the ability scale encounters an easy item (e.g., with a difficulty level D = "1), his or her probability of responding correctly to this item would be 93%. For an item of average difficulty (with D = 0), this person’s probability of responding cor-rectly would drop to 88%.
Dimensionality using CFA methods. As an alternative to Rasch model–based analyses, we also tested a one-factor CFA model. Employing the conventional CFA model with polychoric correlations would violate the assumption that the 0–1 scoring of PPVT-R items represents a categorical variable of a truly continuous underlying trait that is nor-mally distributed. To overcome this problem, we used item parceling (Abu-Alhija & Wisenbaker, 2006; Bandalos, 2002; Kisthton & Widaman, 1994; Nasser & Wisenbaker, 2003). To ensure normality and adequate variance across items, random subsets of six items each were created (Holt, 2004), resulting in 29 parcels.
Model invariance across grades using CFA. Given that the issue of dimensionality is of primary importance in the present study, it was crucial to establish that all measured items load on the unitary PPVT-R dimension equally well across grades. Measurement invariance was defined proba-bilistically as
P(X | #, G) = P(X | #), (2)
where Xs are the observed scores, # is the matrix of latent variables, and G represents group membership (grade). Equation (2) would imply that PPVT-R may be interpreted in a similar fashion as reflecting a single underlying dimen-sion, at least for Grades 2 to 4. We used two complemen-tary methods to evaluate dimensionality: the Rasch model is appropriate with dichotomous data and the CFA would be equally appropriate if used correctly (using item parceling as we did).
Effects of age and gender on PPVT-R total scores. The unidimensionality of the Greek-adapted version of the PPVT-R and the applicability of the single-factor structure across grades (age groups) ensure that it is meaningful to use item-total scores as indices of receptive vocabulary knowl-edge. We further assessed the effects of demographic vari-ables on this ability using an analysis of variance (ANOVA) on the cross-sectional data with age and gender as the
ee
B D
B D
n i
n i
( )
( )
!
!+1
at University of Athens on June 15, 2012aei.sagepub.comDownloaded from
Simos et al. 39
between-subjects variables. In addition, multiple linear regression analyses were used to compare the magnitude of age effects with previous studies on English-speaking students.
Test–retest reliability, convergent, discriminant, and predic-tive validity. The stability of PPVT-R scores was assessed on a subset of 500 students who were retested at a 6-month interval (Time 2). The concurrent validity of PPVT-R total scores was assessed based on the matrix of Pearson correla-tion coefficients between the PPVT-R and scores on another vocabulary measure (WISC-III Vocabulary scale), a mea-sure of nonverbal intelligence (WISC-III Block Design), and various reading achievement measures.
Estimation of item bias using the Rasch model. Bias at the item level was assessed separately as a function of ethnic group (native Greeks, immigrants) and gender on data col-lected from Cohort 1 (at Time 1). The differential item func-tioning (DIF) procedure was used, which examines whether the probability of success for a given item varies across groups (see Elder, McNamara, & Congdon, 2004). Given the relatively small size of the immigrant group (n = 48), we used the standardized mean difference (SMD) estimate (Wang & Chen, 2004) calculated using the following formula:
ti1
= , (3)
with d1 and d
2 indicating the probabilities that Group 1 and
Group 2 will score correctly on item i and s12
, s22
the stan-dard error for each group. SMD estimates >1.0 were con-sidered significant, indicating the presence of group bias for a particular item (Onwuegbuzie, Levin, & Leech, 2003; Thompson, 1996; Wilkinson & the APA Task Force on Sta-tistical Inference, 1999). All analyses examining differen-tial item functioning were carried out with the Winsteps 3.65 software (Linacre, 2008).
Development of a short form for PPVT-R. Selection of PPVT-R items for construction of a short form of the test was based on estimates of item difficulty (using Rasch model parameter estimates) and estimates of the contribu-tion of the individual scores on each item to the total PPVT-R scores (item–total correlations).
ResultsDimensionality Using the Rasch Model
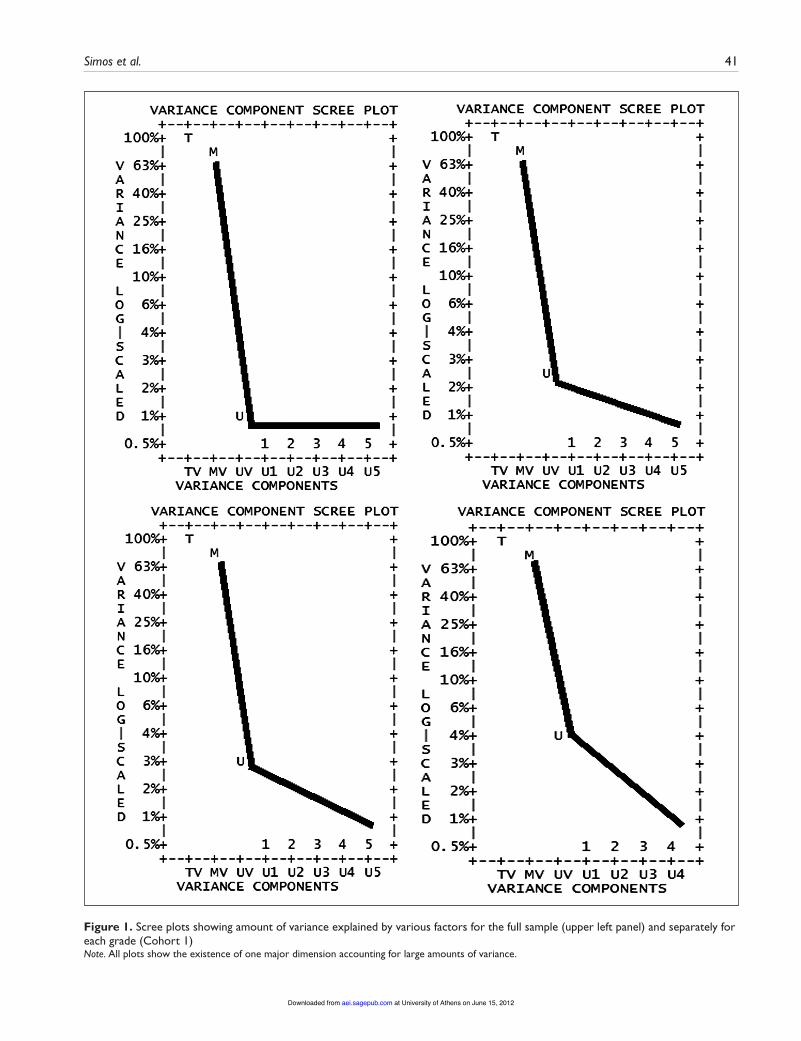
In the Rasch approach, one conducts an analysis of the residuals and evaluates the extent to which they vary along a single latent dimension as opposed to more than one (Linacre, 2007). Fitting the residuals to a unidimensional model, 98.8% of item variance was explained by the single factor. The remaining variance (1.2%) was modeled as a function of three more factors, each accounting for a negli-gible proportion (<1%). Thus, the principal components
analysis of the residuals using the Rasch model pointed to the existence of a single dimension in the PPVT-R (see Table 3 for standardized estimates). The Scree plot for the model computed on the entire Cohort 1 data set at Time 1 is shown in Figure 1.
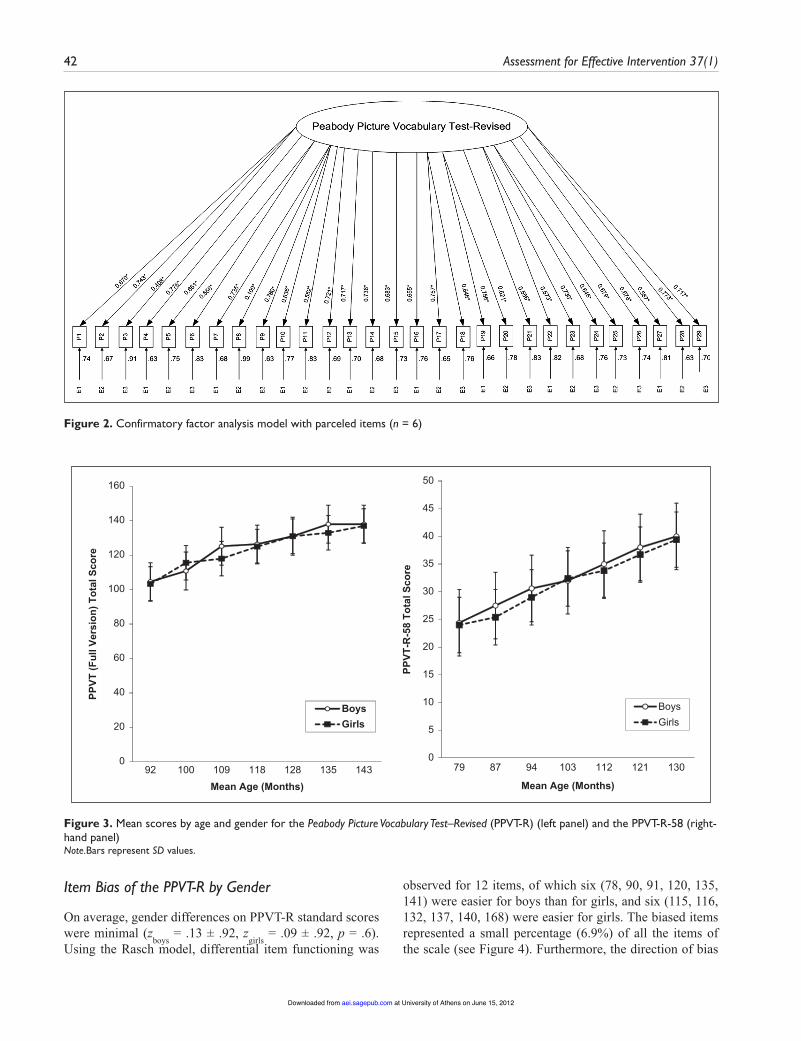
Dimensionality Using CFAUsing the method of parceling described above, the single-factor, 29-parcel model fit the entire Cohort 1 data set col-lected at Time 1—RMSEA = 4.4% (95% CI = 3.9%–4.8%), CFI = .952, GFI = .906, IFI = .952—although the chi-square statistic was significant, $2(377) = 795.921, p < .01, as expected with very large sample sizes. All measurement paths were statistically significant at p <.01, suggesting their necessity in the stochastic part of the model. The results are shown in Figure 2. The results of conventional analyses were consistent with this conclusion as indicated, for instance, by Cronbach’s % for the entire set of items ranging between .92 and .98 across age groups.
Effects of Demographic VariablesVisual inspection of the distribution of individual PPVT-R scores and Kolmogorov-Smirnov tests (p > .4 in all cases) indicated good approximation to normality. ANOVAs with gender and age group as between-subjects variables were computed separately for students aged 87 to 123 (for the first four age levels—Time 1 data) and 124 to 147 months (for the remaining three age levels—Time 3 data). In both analyses, there were significant effects of age, F(3, 518) = 56.03, p < .0001, &2 = .24, and F(2, 284) = 8.03, p < .001, &2 = .05, respectively (see Figure 3). The main effect of gender and the age by gender interaction did not reach significance. The lin-ear term for age was significant in both analyses (p < .0001; the quadratic term was not significant). Bonferroni-corrected pairwise comparisons between age groups (collapsed across gender) revealed significant (p < .0001) increases in mean PPVT-R scores between the following consecutive age groups: 1 (87–95 months)"2 (96–104 months, p < .0001), 2 (96–104 months)"3 (105–113 months, p < .0001), and 5 (124–131 months)"6 (132–139 months, p < .006).
To compare the effects of demographic variables with previous findings reported in the literature, PPVT-R raw score was entered as a dependent variable into a multiple linear regression with age, age2, and gender as independent variables, entered in this order. The results of this analysis are shown in Table 4. To facilitate comparisons with the results of Farkas and Beron (2004), we set the intercept at 36 months (i.e., 36 was subtracted from each age prior to the analysis) and gender was coded as 1 for girls and 0 for boys. The results indicate that Greek children gain approxi-mately 1.8 PPVT-R raw points per year within the age range examined. The rate of gain with age is decelerating, as shown by the negative, statistically significant, coefficient
d d
s si i
i i
1 2
12
22
!+
at University of Athens on June 15, 2012aei.sagepub.comDownloaded from
40 Assessment for Effective Intervention 37(1)
for the quadratic trend. Our estimates for the linear and qua-dratic effects of age are similar to those of Farkas & Beron. In particular, their estimates for age effects lie within our corresponding 95% confidence intervals. As in the preced-ing analyses, no significant gender effects were found. Although girls apparently scored 1.2 points lower than boys on average according to this analysis, which is in the oppo-site direction from the findings of Farkas and Beron, the corresponding coefficient was not statistically significant, and inclusion of gender in the equation accounted for a neg-ligible additional 0.1% of PPVT-R variance. Finally, we compared our estimated PPVT-R raw scores (using the regression coefficient shown in Table 4) to estimated scores using the corresponding coefficients from Farkas and Beron (also shown in Table 4), calculated at monthly intervals between the ages of 88 and 146 months. Our estimates were on average 17.8 points higher than those of Farkas and Beron. This difference was quite stable (maximum devia-tion = 2.0 points, RMS = 0.750), as expected from the close match between the age effects coefficients.
Test–Retest Reliability, Convergent, Discriminant, and Predictive Validity
The 6-month test–retest correlation coefficients for the total PPVT-R score ranged between r = .65 and r = .86 across age groups. The stability of raw scores for students with Block Design standard scores <5 (N = 19) was also very high (r = .86).
Correlation coefficients at Time 1 between PPVT-R (age-corrected z scores) and WISC-III subtest standard scores were, as expected, greater for Vocabulary (r = .56) than Block Design (r = .33). Moreover, PPVT-R scores were stronger predictors of reading comprehension (r = .56) than were word reading accuracy (r = .36) or pseudoword reading accu-racy (r = .19), regardless of age. These relations were quite stable over time: at Time 3 correlation coefficients of PPVT-R scores with WISC-III Vocabulary, Word Reading Accuracy, Pseudoword Reading Accuracy, and Reading Comprehension scores were r = .62, r = 22, r = 35, and r = .43, respectively (Block Design was not administered at Time 3).
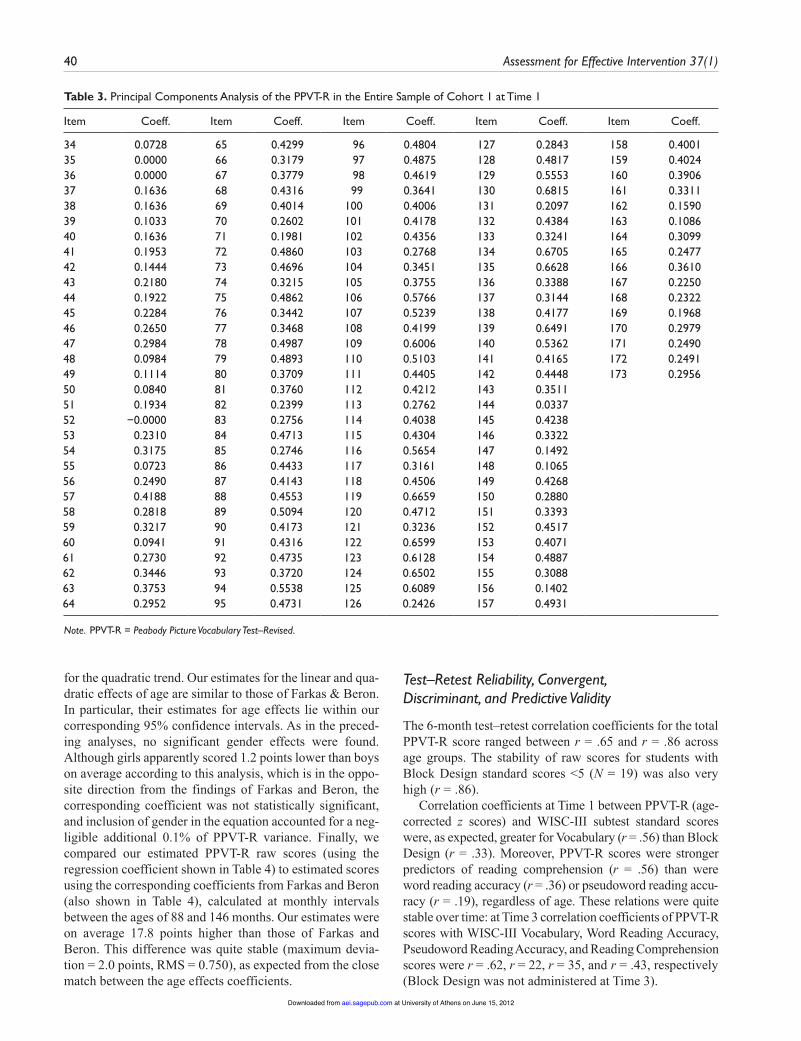
Table 3. Principal Components Analysis of the PPVT-R in the Entire Sample of Cohort 1 at Time 1
Item Coeff. Item Coeff. Item Coeff. Item Coeff. Item Coeff.
34 0.0728 65 0.4299 96 0.4804 127 0.2843 158 0.400135 0.0000 66 0.3179 97 0.4875 128 0.4817 159 0.402436 0.0000 67 0.3779 98 0.4619 129 0.5553 160 0.390637 0.1636 68 0.4316 99 0.3641 130 0.6815 161 0.331138 0.1636 69 0.4014 100 0.4006 131 0.2097 162 0.159039 0.1033 70 0.2602 101 0.4178 132 0.4384 163 0.108640 0.1636 71 0.1981 102 0.4356 133 0.3241 164 0.309941 0.1953 72 0.4860 103 0.2768 134 0.6705 165 0.247742 0.1444 73 0.4696 104 0.3451 135 0.6628 166 0.361043 0.2180 74 0.3215 105 0.3755 136 0.3388 167 0.225044 0.1922 75 0.4862 106 0.5766 137 0.3144 168 0.232245 0.2284 76 0.3442 107 0.5239 138 0.4177 169 0.196846 0.2650 77 0.3468 108 0.4199 139 0.6491 170 0.297947 0.2984 78 0.4987 109 0.6006 140 0.5362 171 0.249048 0.0984 79 0.4893 110 0.5103 141 0.4165 172 0.249149 0.1114 80 0.3709 111 0.4405 142 0.4448 173 0.295650 0.0840 81 0.3760 112 0.4212 143 0.3511 51 0.1934 82 0.2399 113 0.2762 144 0.0337 52 !0.0000 83 0.2756 114 0.4038 145 0.4238 53 0.2310 84 0.4713 115 0.4304 146 0.3322 54 0.3175 85 0.2746 116 0.5654 147 0.1492 55 0.0723 86 0.4433 117 0.3161 148 0.1065 56 0.2490 87 0.4143 118 0.4506 149 0.4268 57 0.4188 88 0.4553 119 0.6659 150 0.2880 58 0.2818 89 0.5094 120 0.4712 151 0.3393 59 0.3217 90 0.4173 121 0.3236 152 0.4517 60 0.0941 91 0.4316 122 0.6599 153 0.4071 61 0.2730 92 0.4735 123 0.6128 154 0.4887 62 0.3446 93 0.3720 124 0.6502 155 0.3088 63 0.3753 94 0.5538 125 0.6089 156 0.1402 64 0.2952 95 0.4731 126 0.2426 157 0.4931
Note. PPVT-R = Peabody Picture Vocabulary Test–Revised.
at University of Athens on June 15, 2012aei.sagepub.comDownloaded from
Simos et al. 41
Figure 1. Scree plots showing amount of variance explained by various factors for the full sample (upper left panel) and separately for each grade (Cohort 1)Note. All plots show the existence of one major dimension accounting for large amounts of variance.
at University of Athens on June 15, 2012aei.sagepub.comDownloaded from
42 Assessment for Effective Intervention 37(1)
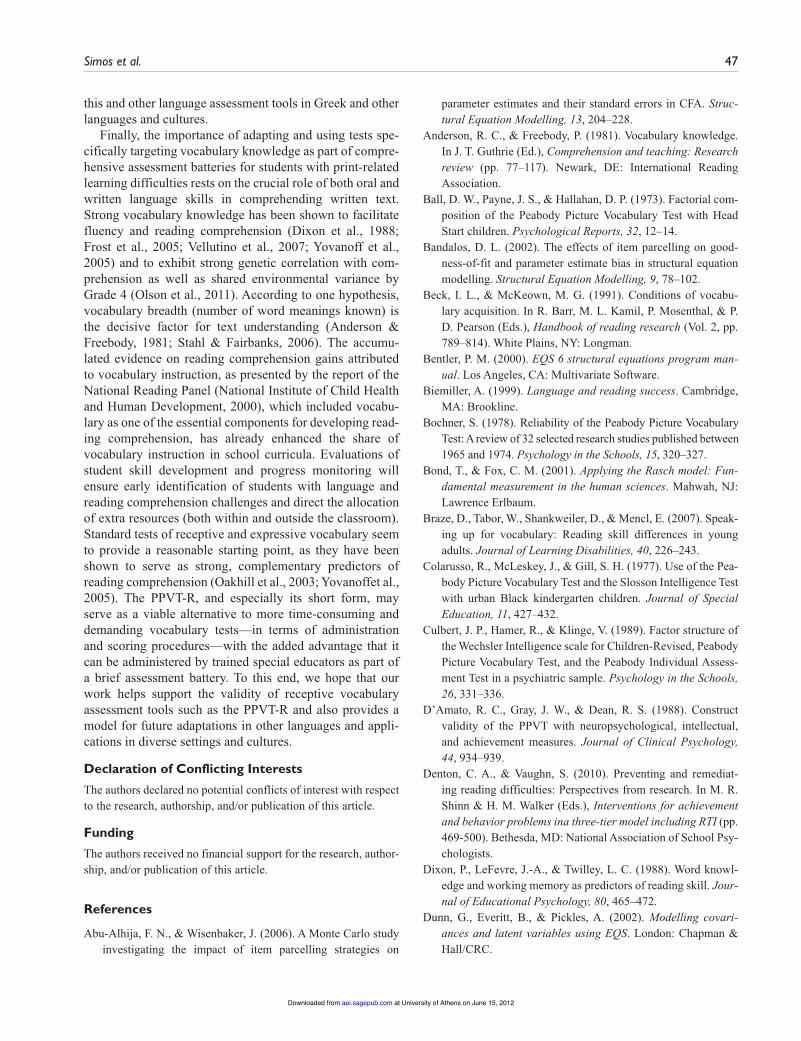
Figure 2. Confirmatory factor analysis model with parceled items (n = 6)
0
20
40
60
80
100
120
140
160
92 100 109 118 128 135 143
PPVT
(Ful
l Ver
sion
) Tot
al S
core
Mean Age (Months)
BoysGirls
0
5
10
15
20
25
30
35
40
45
50
79 87 94 103 112 121 130
PPVT
-R-5
8 To
tal S
core
Mean Age (Months)
BoysGirls
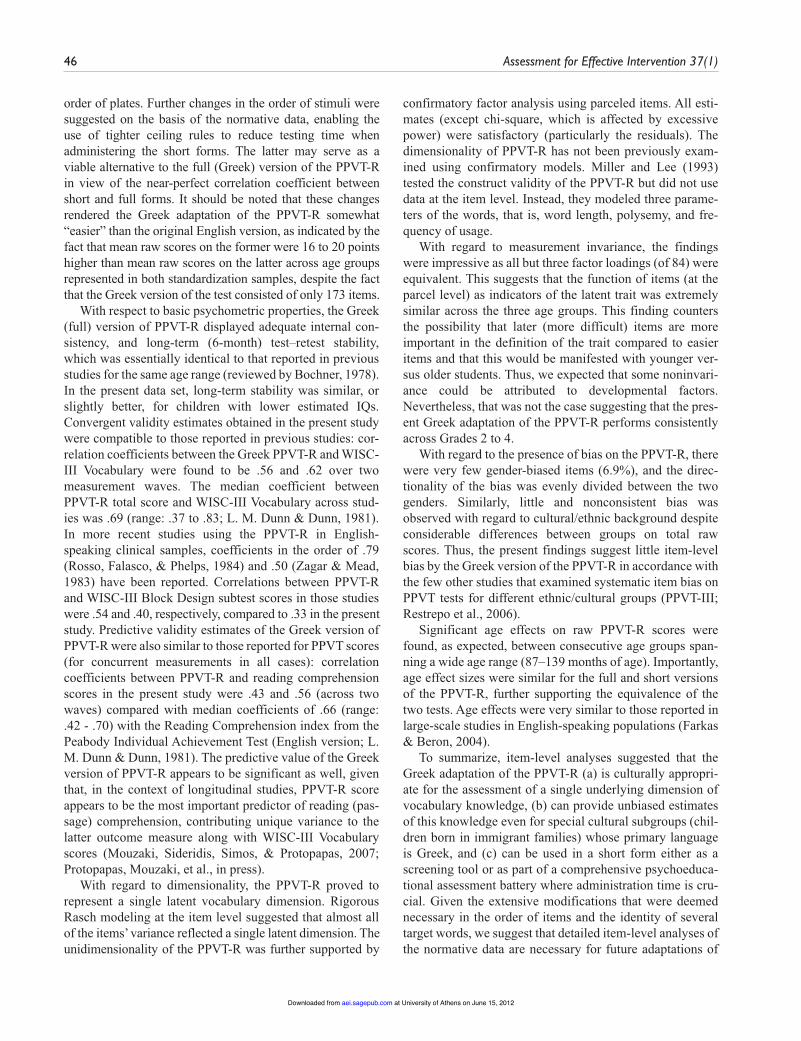
Figure 3. Mean scores by age and gender for the Peabody Picture Vocabulary Test–Revised (PPVT-R) (left panel) and the PPVT-R-58 (right-hand panel)Note.Bars represent SD values.
Item Bias of the PPVT-R by Gender
On average, gender differences on PPVT-R standard scores were minimal (z
boys = .13 ± .92, z
girls = .09 ± .92, p = .6).
Using the Rasch model, differential item functioning was
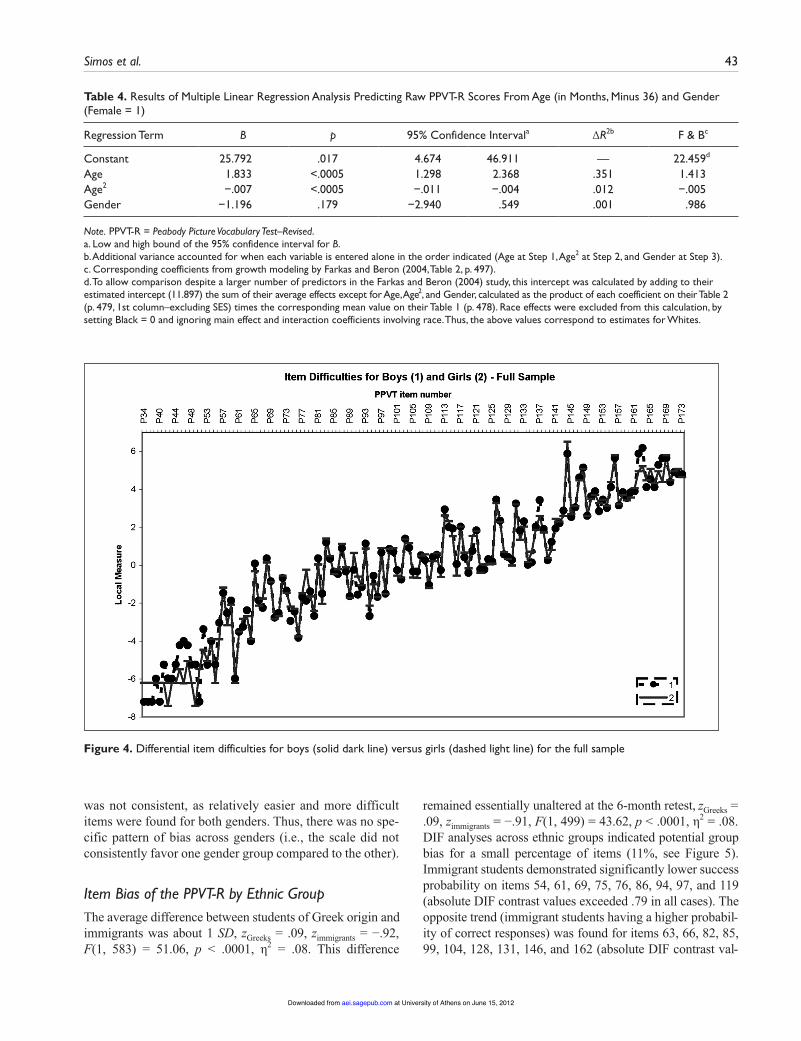
observed for 12 items, of which six (78, 90, 91, 120, 135, 141) were easier for boys than for girls, and six (115, 116, 132, 137, 140, 168) were easier for girls. The biased items represented a small percentage (6.9%) of all the items of the scale (see Figure 4). Furthermore, the direction of bias
at University of Athens on June 15, 2012aei.sagepub.comDownloaded from
Simos et al. 43
was not consistent, as relatively easier and more difficult items were found for both genders. Thus, there was no spe-cific pattern of bias across genders (i.e., the scale did not consistently favor one gender group compared to the other).
Item Bias of the PPVT-R by Ethnic GroupThe average difference between students of Greek origin and immigrants was about 1 SD, zGreeks = .09, zimmigrants = ".92, F(1, 583) = 51.06, p < .0001, &2 = .08. This difference
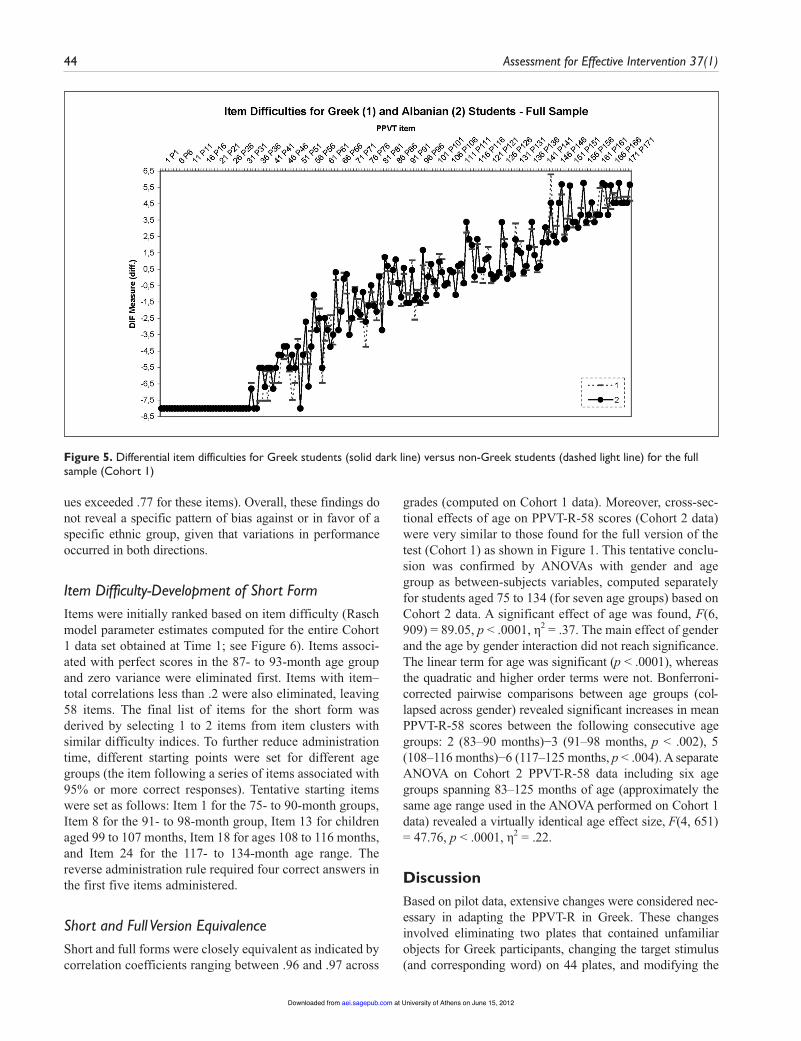
remained essentially unaltered at the 6-month retest, zGreeks = .09, zimmigrants = ".91, F(1, 499) = 43.62, p < .0001, &2 = .08. DIF analyses across ethnic groups indicated potential group bias for a small percentage of items (11%, see Figure 5). Immigrant students demonstrated significantly lower success probability on items 54, 61, 69, 75, 76, 86, 94, 97, and 119 (absolute DIF contrast values exceeded .79 in all cases). The opposite trend (immigrant students having a higher probabil-ity of correct responses) was found for items 63, 66, 82, 85, 99, 104, 128, 131, 146, and 162 (absolute DIF contrast val-
Table 4. Results of Multiple Linear Regression Analysis Predicting Raw PPVT-R Scores From Age (in Months, Minus 36) and Gender (Female = 1)
Regression Term B p 95% Confidence Intervala !R2b F & Bc
Constant 25.792 .017 4.674 46.911 — 22.459d
Age 1.833 <.0005 1.298 2.368 .351 1.413Age2 !.007 <.0005 !.011 !.004 .012 !.005Gender !1.196 .179 !2.940 .549 .001 .986
Note. PPVT-R = Peabody Picture Vocabulary Test–Revised.a. Low and high bound of the 95% confidence interval for B. b. Additional variance accounted for when each variable is entered alone in the order indicated (Age at Step 1, Age2 at Step 2, and Gender at Step 3). c. Corresponding coefficients from growth modeling by Farkas and Beron (2004, Table 2, p. 497).d. To allow comparison despite a larger number of predictors in the Farkas and Beron (2004) study, this intercept was calculated by adding to their estimated intercept (11.897) the sum of their average effects except for Age, Age2, and Gender, calculated as the product of each coefficient on their Table 2 (p. 479, 1st column–excluding SES) times the corresponding mean value on their Table 1 (p. 478). Race effects were excluded from this calculation, by setting Black = 0 and ignoring main effect and interaction coefficients involving race. Thus, the above values correspond to estimates for Whites.
Figure 4. Differential item difficulties for boys (solid dark line) versus girls (dashed light line) for the full sample
at University of Athens on June 15, 2012aei.sagepub.comDownloaded from
44 Assessment for Effective Intervention 37(1)
ues exceeded .77 for these items). Overall, these findings do not reveal a specific pattern of bias against or in favor of a specific ethnic group, given that variations in performance occurred in both directions.
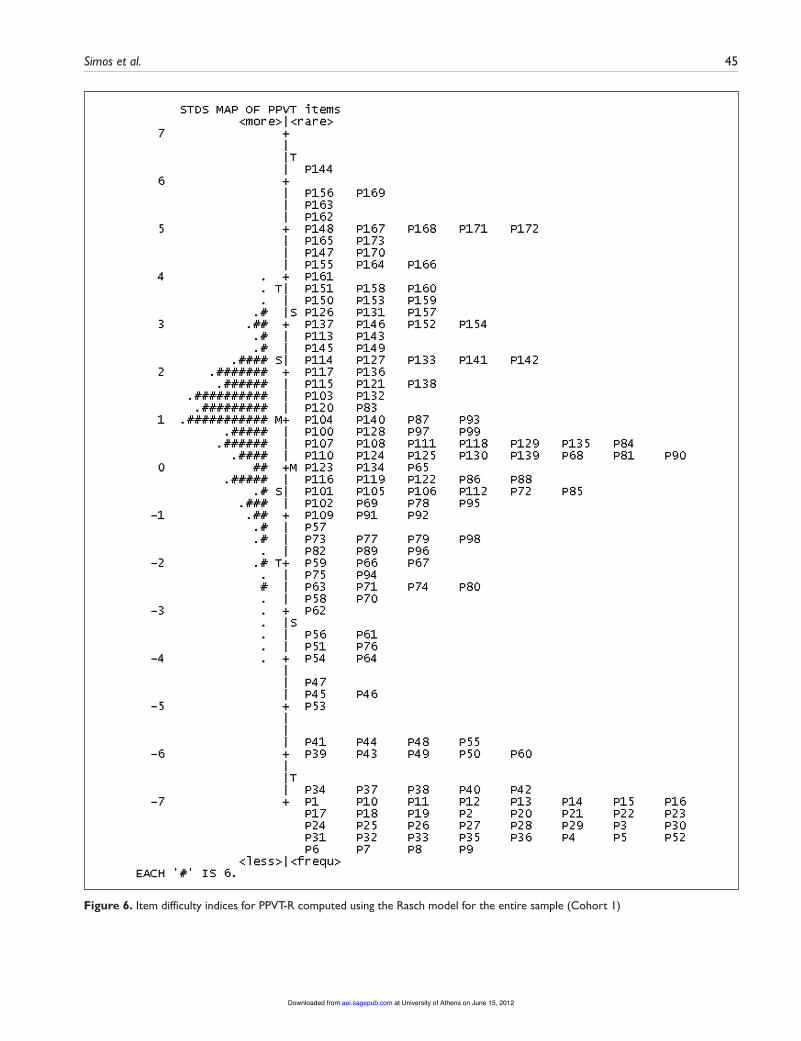
Item Difficulty-Development of Short FormItems were initially ranked based on item difficulty (Rasch model parameter estimates computed for the entire Cohort 1 data set obtained at Time 1; see Figure 6). Items associ-ated with perfect scores in the 87- to 93-month age group and zero variance were eliminated first. Items with item–total correlations less than .2 were also eliminated, leaving 58 items. The final list of items for the short form was derived by selecting 1 to 2 items from item clusters with similar difficulty indices. To further reduce administration time, different starting points were set for different age groups (the item following a series of items associated with 95% or more correct responses). Tentative starting items were set as follows: Item 1 for the 75- to 90-month groups, Item 8 for the 91- to 98-month group, Item 13 for children aged 99 to 107 months, Item 18 for ages 108 to 116 months, and Item 24 for the 117- to 134-month age range. The reverse administration rule required four correct answers in the first five items administered.
Short and Full Version EquivalenceShort and full forms were closely equivalent as indicated by correlation coefficients ranging between .96 and .97 across
grades (computed on Cohort 1 data). Moreover, cross-sec-tional effects of age on PPVT-R-58 scores (Cohort 2 data) were very similar to those found for the full version of the test (Cohort 1) as shown in Figure 1. This tentative conclu-sion was confirmed by ANOVAs with gender and age group as between-subjects variables, computed separately for students aged 75 to 134 (for seven age groups) based on Cohort 2 data. A significant effect of age was found, F(6, 909) = 89.05, p < .0001, &2 = .37. The main effect of gender and the age by gender interaction did not reach significance. The linear term for age was significant (p < .0001), whereas the quadratic and higher order terms were not. Bonferroni-corrected pairwise comparisons between age groups (col-lapsed across gender) revealed significant increases in mean PPVT-R-58 scores between the following consecutive age groups: 2 (83–90 months)"3 (91–98 months, p < .002), 5 (108–116 months)"6 (117–125 months, p < .004). A separate ANOVA on Cohort 2 PPVT-R-58 data including six age groups spanning 83–125 months of age (approximately the same age range used in the ANOVA performed on Cohort 1 data) revealed a virtually identical age effect size, F(4, 651) = 47.76, p < .0001, &2 = .22.
DiscussionBased on pilot data, extensive changes were considered nec-essary in adapting the PPVT-R in Greek. These changes involved eliminating two plates that contained unfamiliar objects for Greek participants, changing the target stimulus (and corresponding word) on 44 plates, and modifying the
Figure 5. Differential item difficulties for Greek students (solid dark line) versus non-Greek students (dashed light line) for the full sample (Cohort 1)
at University of Athens on June 15, 2012aei.sagepub.comDownloaded from
Simos et al. 45
Figure 6. Item difficulty indices for PPVT-R computed using the Rasch model for the entire sample (Cohort 1)
at University of Athens on June 15, 2012aei.sagepub.comDownloaded from
46 Assessment for Effective Intervention 37(1)
order of plates. Further changes in the order of stimuli were suggested on the basis of the normative data, enabling the use of tighter ceiling rules to reduce testing time when administering the short forms. The latter may serve as a viable alternative to the full (Greek) version of the PPVT-R in view of the near-perfect correlation coefficient between short and full forms. It should be noted that these changes rendered the Greek adaptation of the PPVT-R somewhat “easier” than the original English version, as indicated by the fact that mean raw scores on the former were 16 to 20 points higher than mean raw scores on the latter across age groups represented in both standardization samples, despite the fact that the Greek version of the test consisted of only 173 items.
With respect to basic psychometric properties, the Greek (full) version of PPVT-R displayed adequate internal con-sistency, and long-term (6-month) test–retest stability, which was essentially identical to that reported in previous studies for the same age range (reviewed by Bochner, 1978). In the present data set, long-term stability was similar, or slightly better, for children with lower estimated IQs. Convergent validity estimates obtained in the present study were compatible to those reported in previous studies: cor-relation coefficients between the Greek PPVT-R and WISC-III Vocabulary were found to be .56 and .62 over two measurement waves. The median coefficient between PPVT-R total score and WISC-III Vocabulary across stud-ies was .69 (range: .37 to .83; L. M. Dunn & Dunn, 1981). In more recent studies using the PPVT-R in English-speaking clinical samples, coefficients in the order of .79 (Rosso, Falasco, & Phelps, 1984) and .50 (Zagar & Mead, 1983) have been reported. Correlations between PPVT-R and WISC-III Block Design subtest scores in those studies were .54 and .40, respectively, compared to .33 in the present study. Predictive validity estimates of the Greek version of PPVT-R were also similar to those reported for PPVT scores (for concurrent measurements in all cases): correlation coefficients between PPVT-R and reading comprehension scores in the present study were .43 and .56 (across two waves) compared with median coefficients of .66 (range: .42 - .70) with the Reading Comprehension index from the Peabody Individual Achievement Test (English version; L. M. Dunn & Dunn, 1981). The predictive value of the Greek version of PPVT-R appears to be significant as well, given that, in the context of longitudinal studies, PPVT-R score appears to be the most important predictor of reading (pas-sage) comprehension, contributing unique variance to the latter outcome measure along with WISC-III Vocabulary scores (Mouzaki, Sideridis, Simos, & Protopapas, 2007; Protopapas, Mouzaki, et al., in press).
With regard to dimensionality, the PPVT-R proved to represent a single latent vocabulary dimension. Rigorous Rasch modeling at the item level suggested that almost all of the items’ variance reflected a single latent dimension. The unidimensionality of the PPVT-R was further supported by
confirmatory factor analysis using parceled items. All esti-mates (except chi-square, which is affected by excessive power) were satisfactory (particularly the residuals). The dimensionality of PPVT-R has not been previously exam-ined using confirmatory models. Miller and Lee (1993) tested the construct validity of the PPVT-R but did not use data at the item level. Instead, they modeled three parame-ters of the words, that is, word length, polysemy, and fre-quency of usage.
With regard to measurement invariance, the findings were impressive as all but three factor loadings (of 84) were equivalent. This suggests that the function of items (at the parcel level) as indicators of the latent trait was extremely similar across the three age groups. This finding counters the possibility that later (more difficult) items are more important in the definition of the trait compared to easier items and that this would be manifested with younger ver-sus older students. Thus, we expected that some noninvari-ance could be attributed to developmental factors. Nevertheless, that was not the case suggesting that the pres-ent Greek adaptation of the PPVT-R performs consistently across Grades 2 to 4.
With regard to the presence of bias on the PPVT-R, there were very few gender-biased items (6.9%), and the direc-tionality of the bias was evenly divided between the two genders. Similarly, little and nonconsistent bias was observed with regard to cultural/ethnic background despite considerable differences between groups on total raw scores. Thus, the present findings suggest little item-level bias by the Greek version of the PPVT-R in accordance with the few other studies that examined systematic item bias on PPVT tests for different ethnic/cultural groups (PPVT-III; Restrepo et al., 2006).
Significant age effects on raw PPVT-R scores were found, as expected, between consecutive age groups span-ning a wide age range (87–139 months of age). Importantly, age effect sizes were similar for the full and short versions of the PPVT-R, further supporting the equivalence of the two tests. Age effects were very similar to those reported in large-scale studies in English-speaking populations (Farkas & Beron, 2004).
To summarize, item-level analyses suggested that the Greek adaptation of the PPVT-R (a) is culturally appropri-ate for the assessment of a single underlying dimension of vocabulary knowledge, (b) can provide unbiased estimates of this knowledge even for special cultural subgroups (chil-dren born in immigrant families) whose primary language is Greek, and (c) can be used in a short form either as a screening tool or as part of a comprehensive psychoeduca-tional assessment battery where administration time is cru-cial. Given the extensive modifications that were deemed necessary in the order of items and the identity of several target words, we suggest that detailed item-level analyses of the normative data are necessary for future adaptations of
at University of Athens on June 15, 2012aei.sagepub.comDownloaded from
Simos et al. 47
this and other language assessment tools in Greek and other languages and cultures.
Finally, the importance of adapting and using tests spe-cifically targeting vocabulary knowledge as part of compre-hensive assessment batteries for students with print-related learning difficulties rests on the crucial role of both oral and written language skills in comprehending written text. Strong vocabulary knowledge has been shown to facilitate fluency and reading comprehension (Dixon et al., 1988; Frost et al., 2005; Vellutino et al., 2007; Yovanoff et al., 2005) and to exhibit strong genetic correlation with com-prehension as well as shared environmental variance by Grade 4 (Olson et al., 2011). According to one hypothesis, vocabulary breadth (number of word meanings known) is the decisive factor for text understanding (Anderson & Freebody, 1981; Stahl & Fairbanks, 2006). The accumu-lated evidence on reading comprehension gains attributed to vocabulary instruction, as presented by the report of the National Reading Panel (National Institute of Child Health and Human Development, 2000), which included vocabu-lary as one of the essential components for developing read-ing comprehension, has already enhanced the share of vocabulary instruction in school curricula. Evaluations of student skill development and progress monitoring will ensure early identification of students with language and reading comprehension challenges and direct the allocation of extra resources (both within and outside the classroom). Standard tests of receptive and expressive vocabulary seem to provide a reasonable starting point, as they have been shown to serve as strong, complementary predictors of reading comprehension (Oakhill et al., 2003; Yovanoffet al., 2005). The PPVT-R, and especially its short form, may serve as a viable alternative to more time-consuming and demanding vocabulary tests—in terms of administration and scoring procedures—with the added advantage that it can be administered by trained special educators as part of a brief assessment battery. To this end, we hope that our work helps support the validity of receptive vocabulary assessment tools such as the PPVT-R and also provides a model for future adaptations in other languages and appli-cations in diverse settings and cultures.
Declaration of Conflicting InterestsThe authors declared no potential conflicts of interest with respect to the research, authorship, and/or publication of this article.
FundingThe authors received no financial support for the research, author-ship, and/or publication of this article.
References
Abu-Alhija, F. N., & Wisenbaker, J. (2006). A Monte Carlo study investigating the impact of item parcelling strategies on
parameter estimates and their standard errors in CFA. Struc-tural Equation Modelling, 13, 204–228.
Anderson, R. C., & Freebody, P. (1981). Vocabulary knowledge. In J. T. Guthrie (Ed.), Comprehension and teaching: Research review (pp. 77–117). Newark, DE: International Reading Association.
Ball, D. W., Payne, J. S., & Hallahan, D. P. (1973). Factorial com-position of the Peabody Picture Vocabulary Test with Head Start children. Psychological Reports, 32, 12–14.
Bandalos, D. L. (2002). The effects of item parcelling on good-ness-of-fit and parameter estimate bias in structural equation modelling. Structural Equation Modelling, 9, 78–102.
Beck, I. L., & McKeown, M. G. (1991). Conditions of vocabu-lary acquisition. In R. Barr, M. L. Kamil, P. Mosenthal, & P. D. Pearson (Eds.), Handbook of reading research (Vol. 2, pp. 789–814). White Plains, NY: Longman.
Bentler, P. M. (2000). EQS 6 structural equations program man-ual. Los Angeles, CA: Multivariate Software.
Biemiller, A. (1999). Language and reading success. Cambridge, MA: Brookline.
Bochner, S. (1978). Reliability of the Peabody Picture Vocabulary Test: A review of 32 selected research studies published between 1965 and 1974. Psychology in the Schools, 15, 320–327.
Bond, T., & Fox, C. M. (2001). Applying the Rasch model: Fun-damental measurement in the human sciences. Mahwah, NJ: Lawrence Erlbaum.
Braze, D., Tabor, W., Shankweiler, D., & Mencl, E. (2007). Speak-ing up for vocabulary: Reading skill differences in young adults. Journal of Learning Disabilities, 40, 226–243.
Colarusso, R., McLeskey, J., & Gill, S. H. (1977). Use of the Pea-body Picture Vocabulary Test and the Slosson Intelligence Test with urban Black kindergarten children. Journal of Special Education, 11, 427–432.
Culbert, J. P., Hamer, R., & Klinge, V. (1989). Factor structure of the Wechsler Intelligence scale for Children-Revised, Peabody Picture Vocabulary Test, and the Peabody Individual Assess-ment Test in a psychiatric sample. Psychology in the Schools, 26, 331–336.
D’Amato, R. C., Gray, J. W., & Dean, R. S. (1988). Construct validity of the PPVT with neuropsychological, intellectual, and achievement measures. Journal of Clinical Psychology, 44, 934–939.
Denton, C. A., & Vaughn, S. (2010). Preventing and remediat-ing reading difficulties: Perspectives from research. In M. R. Shinn & H. M. Walker (Eds.), Interventions for achievement and behavior problems ina three-tier model including RTI (pp. 469-500). Bethesda, MD: National Association of School Psy-chologists.
Dixon, P., LeFevre, J.-A., & Twilley, L. C. (1988). Word knowl-edge and working memory as predictors of reading skill. Jour-nal of Educational Psychology, 80, 465–472.
Dunn, G., Everitt, B., & Pickles, A. (2002). Modelling covari-ances and latent variables using EQS. London: Chapman & Hall/CRC.
at University of Athens on June 15, 2012aei.sagepub.comDownloaded from
48 Assessment for Effective Intervention 37(1)
Dunn, L., Padilla, E., Lugo, D., & Dunn, L. (1986). Test de Vocab-ulario en Imagenes Peabody–Adaptacion Hispanoamericana [Peabody Picture Vocabulary Test–Latin American adapta-tion]. Circle Pines, MN: American Guidance Service.
Dunn, L. M., & Dunn, L. M. (1981). Peabody Picture Vocabu-lary Test–Revised. Circle Pines, MN: American Guidance Service.
Elbaum, B., Vaughn, S., Hughes, M. T., & Moody, S. W. (2000). How effective are one to-one tutoring programs in reading for elementary students at risk for reading failure? A meta-analysis of the intervention research. Journal of Educational Psychology, 92, 605–619.
Elder, C., McNamara, T., & Congdon, P. (2004). Rasch techniques for detecting bias in performance assessments: An example comparing the performance of native and non-native speakers on a test of academic English. In. E. Smith and R. Smith (Eds.), Introduction to Rasch measurement: Theory, models and applications (pp. 419–444). Maple Grove, MN: JAM Press.
Farkas, G., & Beron, K. (2004). The detailed age trajectory of oral vocabulary knowledge: Differences by class and race. Social Science Research, 33, 464–497.
Frost, J., Madsbjerg, S., Niedersoe, J., Olofsson, A., & Sorensen, P. M. (2005). Semantic and phonological skills in predicting read-ing development: From 3–16 years of age. Dyslexia, 11, 79–92.
Georgas, D. D., Paraskevopoulos, I. N., Bezevegis, I. G., & Giannitsas, N. D. (1997). Greek WISC–III: Wechsler intelli-gence scales for children [in Greek]. Athens, Greece: Ellinika Grammata.
Holt, J. K. (2004, October). Item parcelling in structural equa-tion models for optimum solutions. Paper presented at the 2004 Annual Meeting of the Mid-Western Educational Research Association, Columbus, OH.
Jensen, A. R. (1974). How biased are culture-loaded tests? Genetic Psychology Monographs, 90, 185–244.
Joshi, R. M. (2005). Vocabulary: A critical component of compre-hension. Reading and Writing Quarterly, 21, 209 –219.
Kisthton, J. M., & Widaman, K. F. (1994). Unidimensional versus domain representative parcelling of questionnaire items: An empirical example. Educational and Psychological Measure-ment, 54, 757–765.
Lasky, D. I., Felice, A., Moyer, R. C., Buddington, J. F., & Elliot, E. S. (1973). Examiner effects with the Peabody Picture Vocabulary test. Journal of Clinical Psychology, 29, 456–457.
Linacre, J. M. (2008). A user’s guide to Winsteps Rasch-model computer programs. Chicago, IL: MESA Press. Retrieved from http://www.winsteps.com/winman/index.htm?copyright.htm
Miller, L. T., & Lee, C. J. (1993). Construct validation of the Pea-body Picture Vocabulary Test–Revised: A structural equation model of the acquisition order of words. Psychological Assess-ment, 5, 438–441.
Mouzaki, A., Sideridis, G. D., Simos, P. G., & Protopapas, A. (2007, July). The importance of vocabulary in longitudinal prediction of reading comprehension by word-level skills.
Poster presented at the 14th Annual Meeting of the Society for the Scientific Study of Reading. Prague, Czech Republic.
Naglieri, J. A., & Pfeiffer, S. I. (1983). Stability, concurrent and predictive validity of the PPVT-R. Journal of Clinical Psy-chology, 39, 965–967.
Nasser, F., & Wisenbaker, J. (2003). A Monte Carlo investigation on the impact of item parceling on measures of fit in confirma-tory factor analysis. Educational and Psychological Measure-ment, 63, 729–757.
National Institute of Child Health and Human Development. (2000). Report of the National Reading Panel. Teaching chil-dren to read: An evidence-based assessment of the scientific research literature on reading and its implications for reading instruction (NIH Publication No. 00-4769). Washington, DC: Government Printing Office.
Oakhill, J. V., Cain, K., & Bryant, P. E. (2003). The dissociation of word reading and text comprehension: Evidence from compo-nent skills. Language and Cognitive Processes, 18, 443–468.
Ollendick, T. H., Finch, A. J., Jr., & Ginn, F. W. (1974). Com-parison of Peabody, Leiter, WISC, and academic achieve-ment scores among emotionally disturbed children. Journal of Abnormal Child Psychology, 2, 47–51.
Olson, R. K., Keenan, J. M., Byrne, B., Samuelsson, S., Coventry, W. L., Corley, R., . . . Hulslander, J. (2011). Genetic and envi-ronmental influences on vocabulary and reading development. Scientific Studies of Reading, 15, 26–46.
Onwuegbuzie, A. J., Levin, J. R., & Leech, N. L. (2003). Do effect-size measures measure up? A brief assessment. Learn-ing Disabilities: A Contemporary Journal, 1, 37–40.
Ouellette, G. P. (2006). What’s meaning got to do with it: The role of vocabulary in word reading and reading comprehension. Journal of Educational Psychology, 98, 554–566.
Pankratz, M., Morrison, A., & Plante, E. (2004). Difference in standard scores of adults on the Peabody Picture Vocabulary Test. Journal of Speech, Language and Hearing Research, 47, 714–718.
Pasnak, R., Willson-Quayle, A., & Whitten, J. W. (1998). Mild retardation, academic achievement, and Piagetian or psycho-metric tests of reasoning. Journal of Developmental and Phys-ical Disabilities, 10, 23–33.
Perfetti, C. A. (2007). Reading ability: Lexical quality to compre-hension. Scientific Studies of Reading, 11, 357–384.
Perfetti, C. A., & Hart, L. (2001). The lexical bases of comprehen-sion skill. In D. S. Gorien (Ed.), On the consequences of mean-ing selection: Perspectives on resolving lexical ambiguity (pp. 67–86). Washington, DC: American Psychological Association.
Protopapas, A., Mouzaki, A., Sideridis, G. D., Kotsolakou, A., & Simos, P. G. (in press). The role of vocabulary in the context of the simple view of reading. Reading & Writing Quarterly.
Protopapas, A., Sideridis, G. D., Mouzaki, A., & Simos, P. G. (2007). The development of lexical mediation in the relation-ship between text comprehension and word reading skills in Greek. Scientific Studies of Reading, 11, 165–197.
at University of Athens on June 15, 2012aei.sagepub.comDownloaded from
Simos et al. 49
Protopapas, A., Simos, P. G., Sideridis, G. D., & Mouzaki, A. (in press). The components of the simple view of reading: A con-firmatory factor analysis. Reading Psychology.
Qi, C. H., Kaiser, A. P., Milan S., & Hancock, T. (2006). Language performance of low income African American and European American preschool children on the PPVT-III. Language, Speech, and Hearing Services in the Schools, 37, 5–16.
Rasch, G. (1980). Probabilistic models for some intelligence and attainment tests. Chicago, IL: University of Chicago Press.
Restrepo, M. A., Schwanengflugel, P. J., Blake, J., Neuharth-Pritchett, S., Cramer, S. E., & Ruston, H. P. (2006). Perfor-mance on the PPVT-III and the EVT: Applicability of the measures with African American and European American pre-school children. Language, Speech, and Hearing Services in the Schools, 37, 17–27.
Rosso, M., Falasco, S. L., & Phelps, L. (1984). Implications of regression analysis and correlational data between subtests of the WISC-R and the PPVT-R for a delinquent population. Journal of Clinical Psychology, 40, 811–814.
Scruggs, T., Mastropieri, M., & Argulewicz, E. N. (1983). Sta-bility of performance on the PPVT-R for three ethnic groups attending a bilingual kindergarten. Psychology in the Schools, 20, 433–435.
Seitz, V., Abelson, W. D., Levine, E., & Zigler, E. (1975). Effects of place of testing on the Peabody Picture Vocabulary Test scores of disadvantaged Head Start and non-Head Start chil-dren. Child Development, 46, 481–486.
Sideridis, G. D., Mouzaki, A., Simos, P. G., & Protopapas, A. (2006). Classification of students with reading comprehension difficulties: The roles of motivation, affect, and psychopathol-ogy. Learning Disability Quarterly, 29, 159–180.
Sideridis, G. D., & Padeliadu, S. (2000). An examination of the psychometric properties of the Test of Reading Performance using structural equation modeling. Psychological Reports, 86, 789–801.
Smith, E. V., & Smith, R. M. (2004). Introduction to Rasch mea-surement: Theory, models and applications. Maple Grove, MN: JAM Press.
Stahl, S. A., & Fairbanks, M. M. (2006). The effects of vocabu-lary instruction. In K. A. Dougherty-Stahl & M. C. McKenna (Eds.), Reading research at work (pp. 226–261). New York, NY: Guilford.
Thompson, B. (1996). AERA editorial policies regarding statisti-cal significance testing: Three suggested reforms. Educational Researcher, 25, 26–30.
Vaughn, S., & Linan-Thompson, S. (2003). Group size and time allotted to intervention: Effects for students with reading dif-ficulties. In B. R. Foorman (Ed.), Preventing and remediat-ing reading difficulties (pp. 299–324). Baltimore, MD: York Press.
Vellutino, F. R., Tunmer, W. E., Jaccard, J. J., & Chen, R. (2007). Components of reading ability: Multivariate evidence for a convergent skills model of reading development. Scientific Studies of Reading, 11, 3–32.
Verhoeven, L., van Leeuwe, J., & Vermeer, A. (2011). Vocabulary growth and reading development across the elementary school years. Scientific Studies of Reading, 15, 8–25.
Wang, W., & Chen, H. (2004). The standardized mean difference within the framework of item response theory. Educational and Psychological Measurement, 64, 201–223.
Wilkinson & the APA Task Force on Statistical Inference. (1999). Statistical methods in psychology journals: Guidelines and explanations. American Psychologist, 54, 594–604.
Wolf, M., & Gow, D. (1985/1986). A longitudinal investigation of gender differences in language and reading development. First Language 6, 81–110.
Wright, B. D., & Stone, M. H. (2003). Five steps to science: Observing, scoring, measuring, analyzing, and applying. Rasch Measurement Transactions, 17, 912–913.
Yovanoff, P., Duesbery, L., Alonzo, J., & Tindal, G. (2005). Grade-level invariance of a theoretical causal structure predicting read-ing comprehension with vocabulary and oral reading fluency. Educational Measurement: Issues and Practice, 24, 4–12.
Zagar, R., & Mead, J. D. (1983). Analysis of a short test battery for children. Journal of Clinical Psychology, 39, 590–597.
Zigler, E., Abelson, W. D., & Seitz, V. (1973). Motivational factors in the performance of economically disadvantaged children on the Peabody Picture Vocabulary Test. Child Development, 44, 294–303.
About the Authors
Panagiotis G. Simos, PhD, is a professor of developmental neuro-psychology at the University of Crete. His current interests include learning disabilities, neuropsychology, and brain imaging using magnetoencephalography and magnetic resonance imaging.
Georgios D. Sideridis, PhD, is an associate professor of research methods and applied statistics at the University of Crete. His research interests lie in the area of motivation and emotions in students with and without learning disabilities.
Athanassios Protopapas, PhD, is an associate professor of cogni-tive science at the University of Athens. His current interests include the perception of written and spoken words and phonetic category learning.
Angeliki Mouzaki, PhD, is a lecturer of special education at the University of Crete. Her research interests focus on language, reading and spelling development and disorders, as well as assess-ment and interventions for learning disabilities.
at University of Athens on June 15, 2012aei.sagepub.comDownloaded from