Embed Size (px)
DESCRIPTION
Assessment Methods for Ammonia H o t-Sp o ts (Working Group 3). Expert Workshop under the UNECE Convention on Long-range Transboundary Air Pollution 4-6 Dec 2006, Edinburgh, Scotland. Outline. What is a hot-spot? How can they be assessed? Objectives Tools Modelling Uncertainties - PowerPoint PPT Presentation
Citation preview
Assessment Methods for Ammonia Hot-Spots
(Working Group 3)
Expert Workshop under the UNECE Convention on Long-range Transboundary Air Pollution
4-6 Dec 2006, Edinburgh, Scotland
Outline
• What is a hot-spot?• How can they be assessed?
• Objectives• Tools
• Modelling• Uncertainties• Research Priorities
• Integrated assessment• Models/Monitoring
• Large ammonia emission source
• Localised either in space
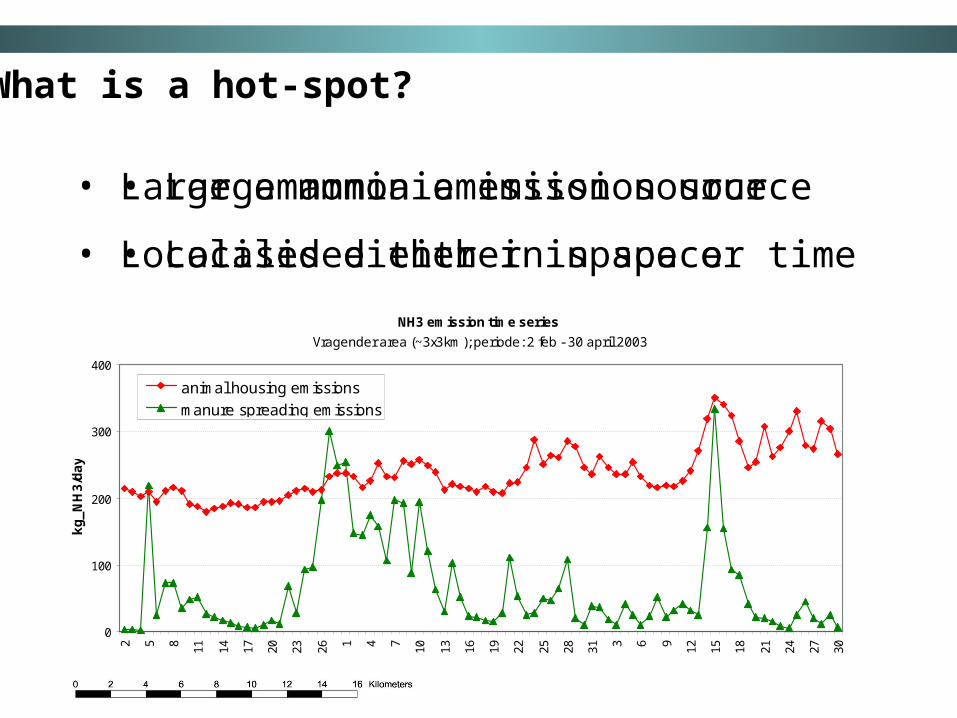
What is a hot-spot?
• Large ammonia emission source
• Localised either in space or time
NH3 emission time series
Vragender area (~3x3km); periode: 2 feb - 30 april 2003
0
100
200
300
400
2 5 8 11 14 17 20 23 26 1 4 7 10 13 16 19 22 25 28 31 3 6 9 12 15 18 21 24 27 30
kg
_N
H3
/da
y
animal housing emissions
manure spreading emissions
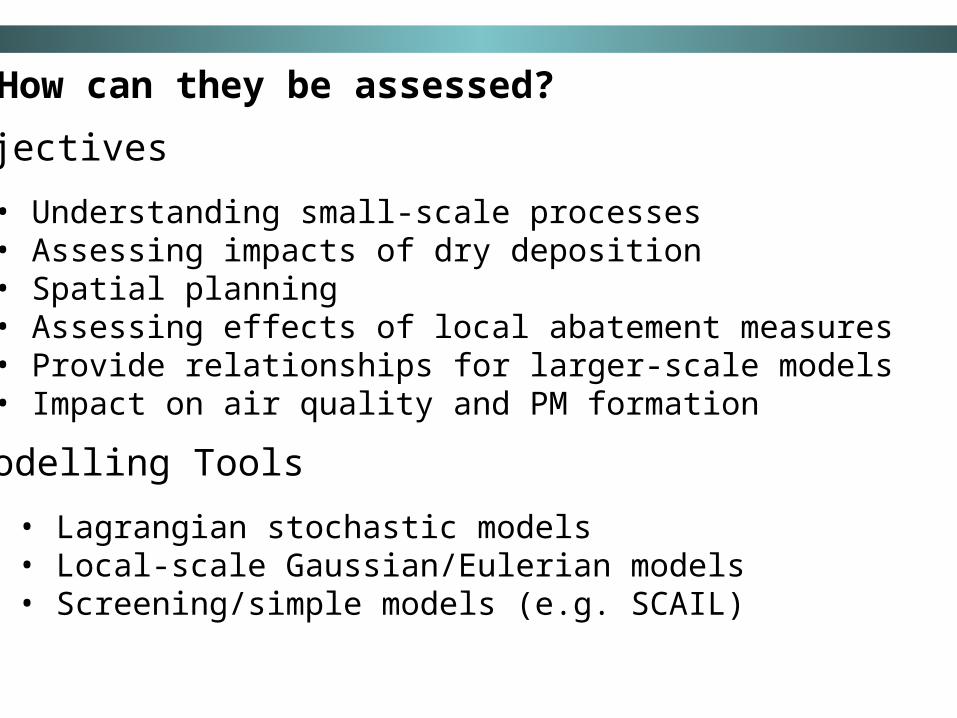
How can they be assessed?
Objectives
• Understanding small-scale processes• Assessing impacts of dry deposition• Spatial planning• Assessing effects of local abatement measures• Provide relationships for larger-scale models• Impact on air quality and PM formation
Modelling Tools
• Lagrangian stochastic models• Local-scale Gaussian/Eulerian models• Screening/simple models (e.g. SCAIL)
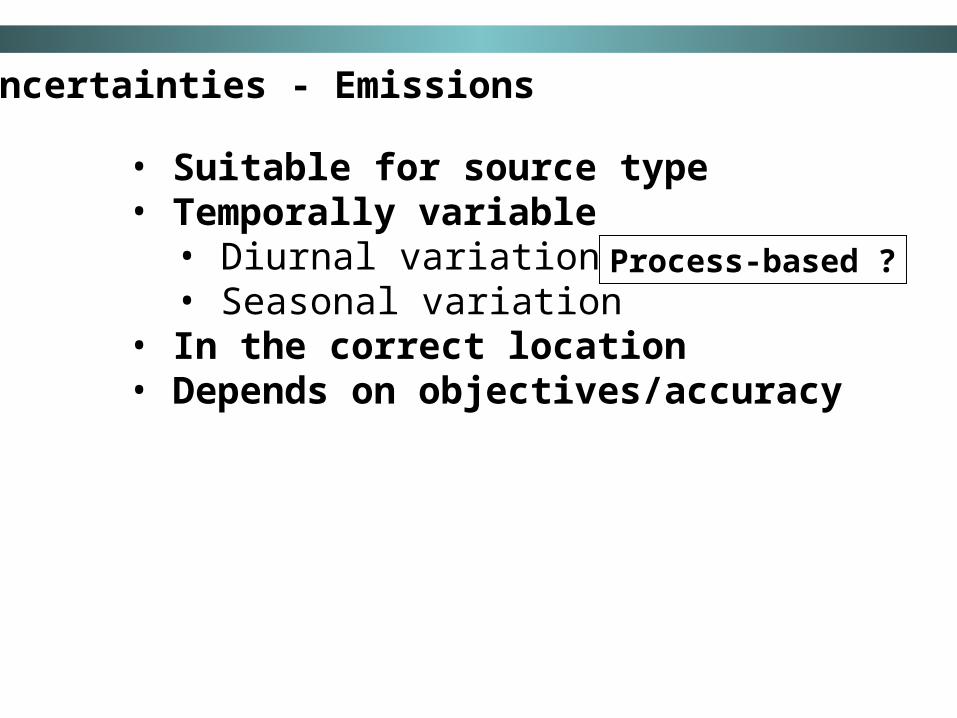
Uncertainties - Emissions
Diurnal coarse of outdoor emissions Vragender area (3x3km); 27 feb 2003
0
5000
10000
15000
20000
25000
1 3 5 7 9 11 13 15 17 19 21 23
time
g/h
_NH
3
Monthly NH3 emissions Vragender area (3x3km); period: aug. 2002- aug. 2003
0
5000
10000
15000
20000
25000
8 9 10 11 12 1 2 3 4 5 6 7 8
2002 - 2003
g/h
fertilyser emissions
cattle grazing emissions
manure application emissions
animal housing emissions
Process-based ?
• Suitable for source type• Temporally variable
• Diurnal variation• Seasonal variation
• In the correct location• Depends on objectives/accuracy
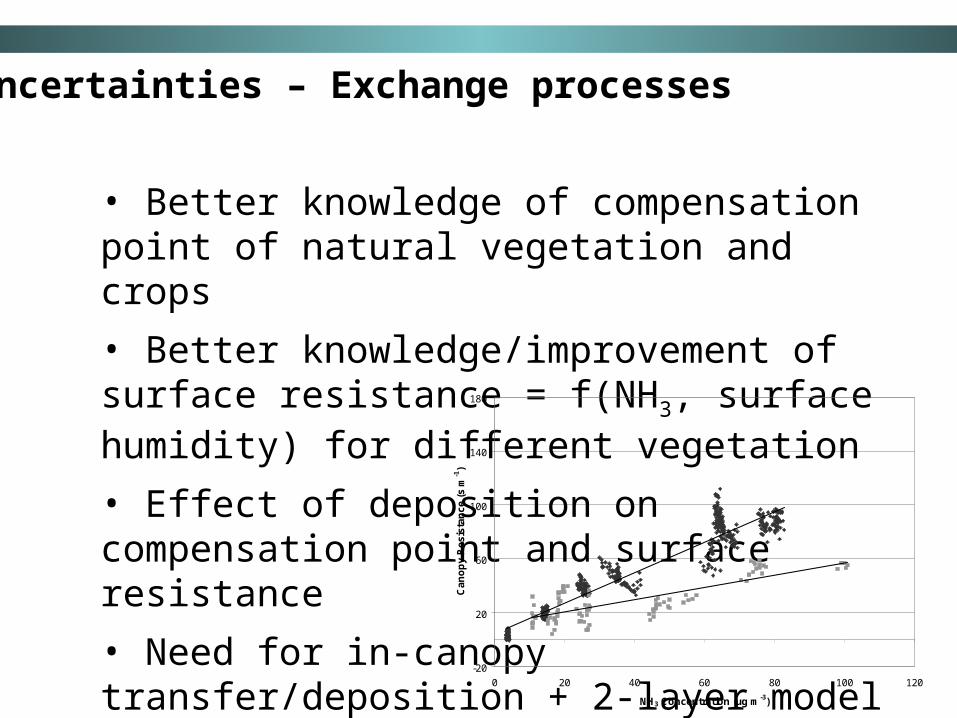
Uncertainties – Exchange processes
• Better knowledge of compensation point of natural vegetation and crops
• Better knowledge/improvement of surface resistance = f(NH3, surface humidity) for different vegetation
• Effect of deposition on compensation point and surface resistance
• Need for in-canopy transfer/deposition + 2-layer model for simpler application
-20
20
60
100
140
180
0 20 40 60 80 100 120
NH3 Concentration (µg m-3)
Ca
no
py
Re
sis
tan
ce
(s
m-1
)
DAY Rc
y = 0.4568x + 11.099
R2 = 0.62
NIGHT Rc
y = 1.1307x + 4.5938
R2 = 0.91
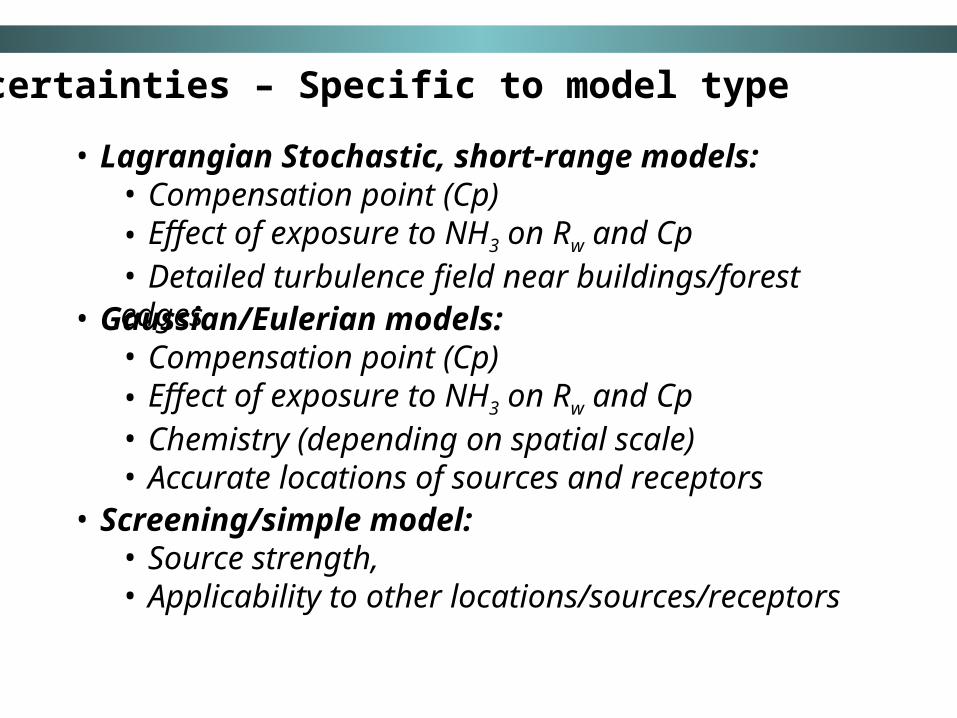
Uncertainties – Specific to model type
• Lagrangian Stochastic, short-range models:• Compensation point (Cp)• Effect of exposure to NH3 on Rw and Cp• Detailed turbulence field near buildings/forest edges
• Gaussian/Eulerian models:• Compensation point (Cp)• Effect of exposure to NH3 on Rw and Cp• Chemistry (depending on spatial scale)• Accurate locations of sources and receptors
• Screening/simple model: • Source strength, • Applicability to other locations/sources/receptors
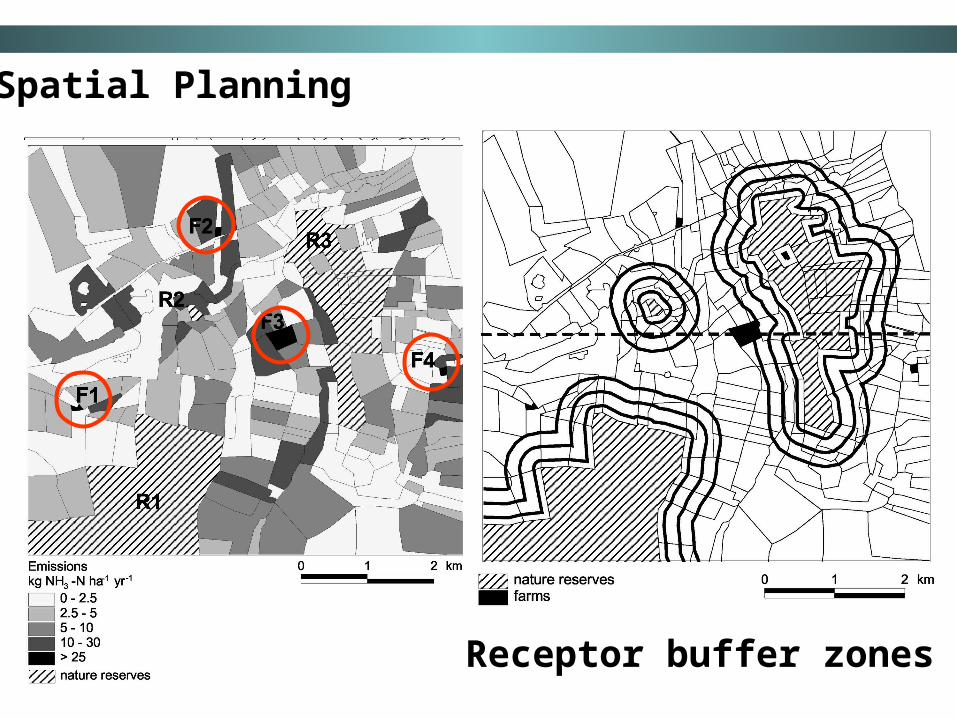
Spatial Planning
Receptor buffer zones

Linking to larger-scale modelling
• Regional scale (e.g. EMEP)
• Upscaling local interactions• Estimates of within-grid recapture
• Providing boundary conditions
• Use of local relationships at regional scale
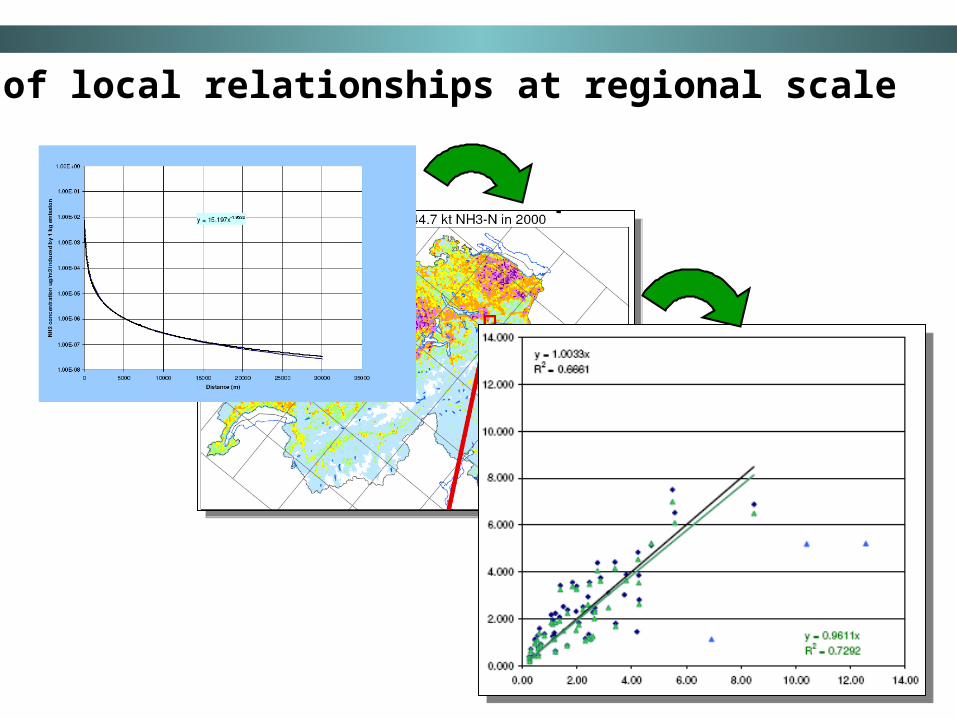
Use of local relationships at regional scale

Assessment Strategies
• Objectives
• Modelling tools
• Monitoring tools
• Integrated approaches (model + monitoring)
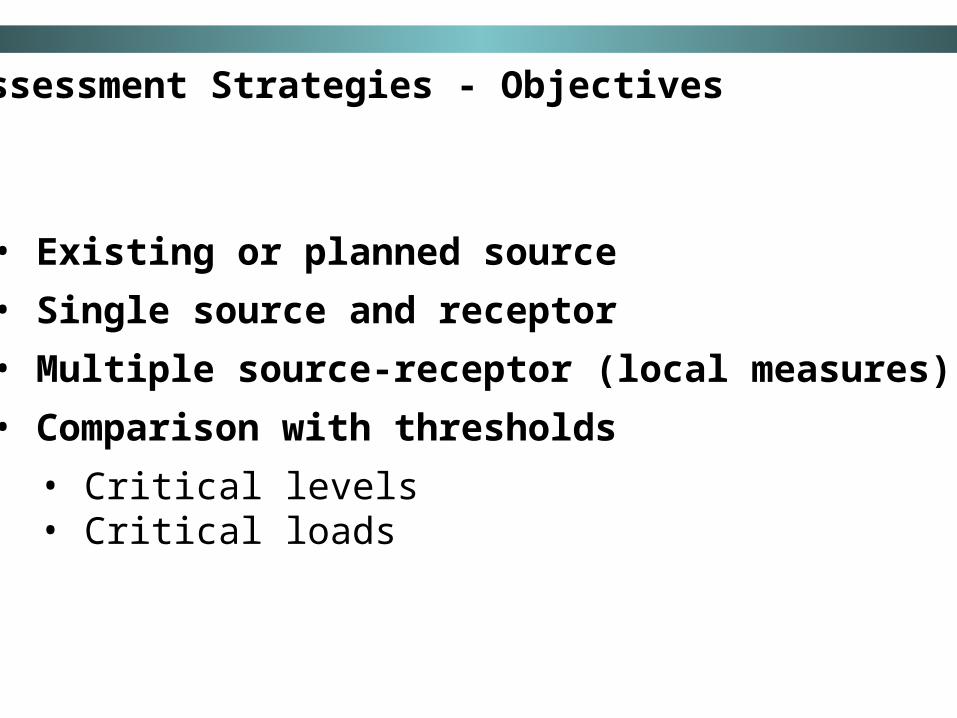
Assessment Strategies - Objectives
• Existing or planned source
• Single source and receptor
• Multiple source-receptor (local measures)
• Comparison with thresholds
• Critical levels• Critical loads
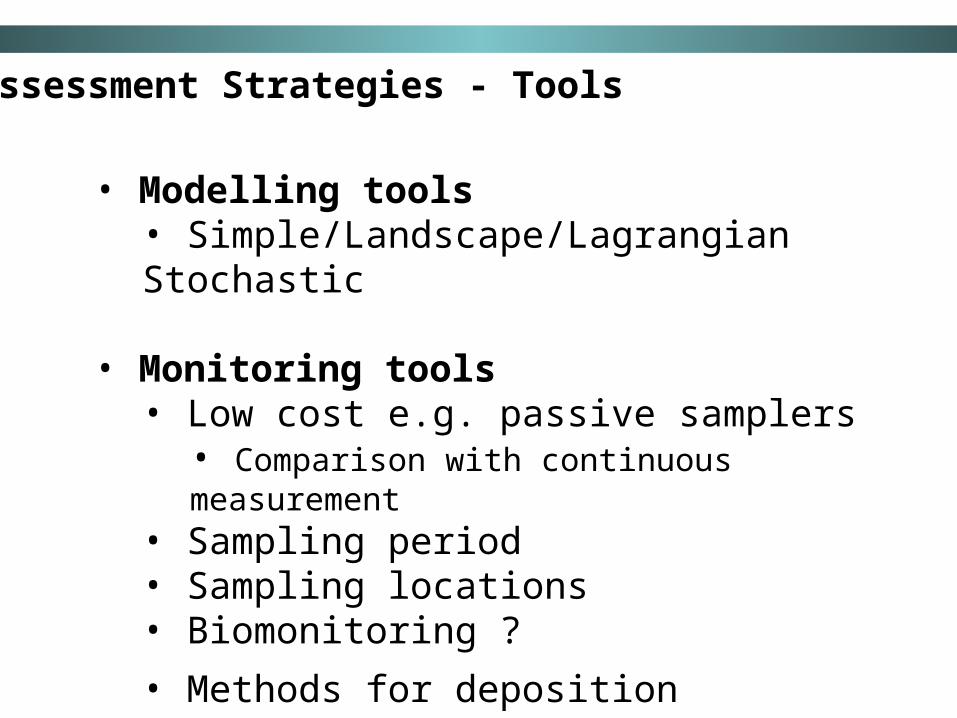
• Modelling tools• Simple/Landscape/Lagrangian Stochastic
• Monitoring tools• Low cost e.g. passive samplers
• Comparison with continuous measurement• Sampling period• Sampling locations• Biomonitoring ?
• Methods for deposition measurement
Assessment Strategies - Tools

Assessment Strategies – Integrated approach?
• Objectives (e.g. existing/planned source)
• Combined modelling and monitoring?
• Comparison with critical levels:• Measurements used to verify model predictions
• Comparison with critical loads:• Concentration measurement Deposition estimate• Deposition velocity approach probably too simplistic• Inferential modelling approach is better (and possible)
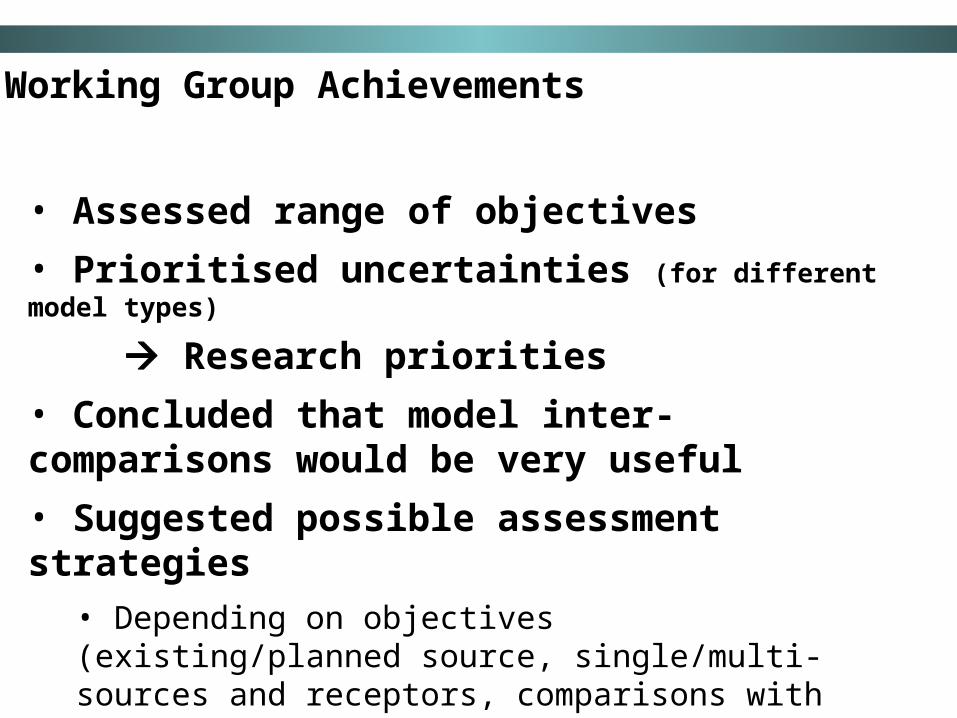
Working Group Achievements
• Assessed range of objectives
• Prioritised uncertainties (for different model types)
Research priorities
• Concluded that model inter-comparisons would be very useful
• Suggested possible assessment strategies• Depending on objectives (existing/planned source, single/multi-sources and receptors, comparisons with critical levels/loads)