Embed Size (px)
Citation preview
Clemson UniversityTigerPrints
All Theses Theses
5-2012
ASSESSMENT OF A SAFE DRIVINGPROGRAM FOR NOVICE DRIVERS ANDSMART JERSEY BARRIER DESIGN TOMINIMIZE ANIMAL-TO-VEHICLECOLLISIONSLance ClarkClemson University, [email protected]
Follow this and additional works at: https://tigerprints.clemson.edu/all_theses
Part of the Mechanical Engineering Commons
This Thesis is brought to you for free and open access by the Theses at TigerPrints. It has been accepted for inclusion in All Theses by an authorizedadministrator of TigerPrints. For more information, please contact [email protected].
Recommended CitationClark, Lance, "ASSESSMENT OF A SAFE DRIVING PROGRAM FOR NOVICE DRIVERS AND SMART JERSEY BARRIERDESIGN TO MINIMIZE ANIMAL-TO-VEHICLE COLLISIONS" (2012). All Theses. 1262.https://tigerprints.clemson.edu/all_theses/1262
ASSESSMENT OF A SAFE DRIVING PROGRAM FOR NOVICE DRIVERS AND
SMART JERSEY BARRIER DESIGN TO MINIMIZE ANIMAL-TO-VEHICLE
COLLISIONS
A Thesis
Presented to
the Graduate School of
Clemson University
In Partial Fulfillment
of the Requirements for the Degree
Master of Engineering
Master of Science
by
Lance Joseph Clark
May 2012
Accepted by:
Dr. John Wagner, Committee Chair
Dr. Cecil Huey
Dr. Timothy Burg
ii
ABSTRACT
Each year, the total number of vehicles, motorists, highway infrastructures, and
distance traveled by drivers increases on a global basis. This rise in personal and
commercial ground vehicle usage brings with it the advantages of the modern age, but it
is not without societal cost. Vehicular incidents result in tens of thousands of deaths each
year in the United States alone. For this reason, research has been performed to advance
driver safety while simultaneously providing wildlife with means to avoid animal-to-
vehicle collisions (AVC). In this thesis, two solutions are proposed: a driver education
program with classroom experiences, in-vehicle resources, and innovative assessment
tools; and a redesigned Jersey highway barrier which offers driver notification and animal
egress when wildlife cross roadways.
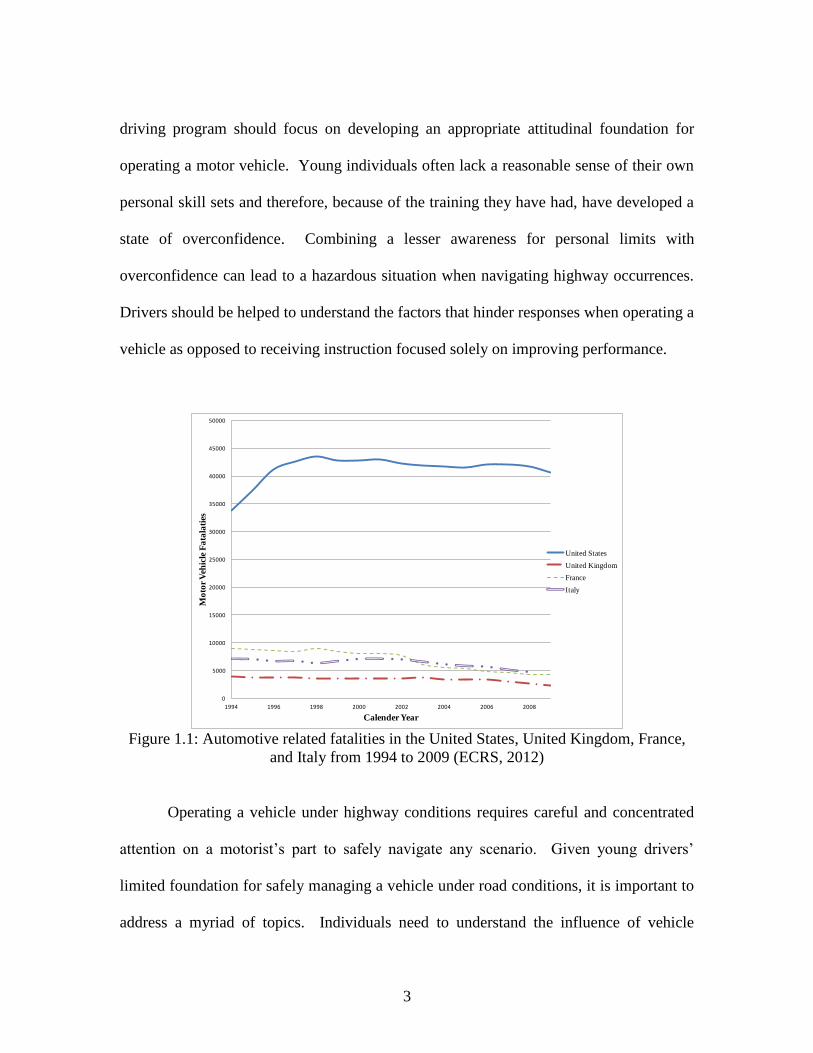
Vehicular crashes accounted annually for 41,338 and 37,648 fatalities between
1994 to 2009 in the United States and European Union, respectively (ECRS, 2012),
(FARS, 2012). In general, the skills and experiences of novice drivers do not favorably
compare to motorists with significantly greater driving time and life experiences. A safe
driving program tailored to young drivers and their at risk behaviors has been
collaboratively developed by Clemson University and the Richard Petty Driving
Experience. This program educates novice motorists using both in-vehicle and classroom
modules based on critical vehicular scenarios identified from accident databases.
Appropriate attitudinal behaviors when operating a motor vehicle, general information
for car maintenance, and vehicular control strategies are introduced during the classroom
and in-vehicle roadway events. During the safe driving program, students participate in
iii
four modules: braking to realize proper stopping technique, obstacle avoidance
curriculum to facilitate proper lane selection and collision avoidance, tailgating to learn
about following distance, and loss of control to react when a vehicle is about to become
laterally unstable. Students are evaluated using both in-vehicle instructor metrics and the
objective based questionnaires which assess critical driving skills and attitudinal
knowledge, respectively. The assessment results from twenty-six driving classes
consisting of 662 drivers, whose ages primarily ranged from 15-20 years old, were
analyzed. Overall, the participants demonstrated a nearly proficient safe driving skill
level at the completion of their respective programs as evidenced by 71.3%, 79.1%,
81.4%, and 80.6% scores during the braking, obstacle avoidance, tailgating, and loss of
control modules, respectively. Further, the students displayed while an average 16.4%
increase between the pre-and post-test scores on general automotive safety knowledge.
Barriers are commonly used on roadways to separate vehicles traveling in
opposing directions and to protect against possible head-on collisions. However, these
barriers may interfere with wildlife passage such that animals become trapped on the
road. Typically, small animals cannot find safe passage across all traffic lanes due to the
presence of solid barriers and eventually die if struck by a vehicle. The occurrence of
animal-to-vehicle collisions also presents a dangerous scenario for motorists as a driver
may intuitively swerve to avoid hitting the animal. In this study, a redesigned Jersey style
barrier, named the Clemson smart portal, will be presented and discussed. This roadway
barrier features a portal for small animal travel, along with a mechatronic-based warning
system to notify drivers of animal passage. The smart barrier concept empowers the

iv
animals to cross the roadway through the portal, while a sensor detects their presence and
activates a strobe light to alert motorists. Laboratory tests have successfully
demonstrated this new barrier’s capability to detect animal presence for various
scenarios.

v
DEDICATION
This document, and the work within it, is dedicated to my mother, Landis Clark,
my father, Joseph Clark, and my bride to be, Ashley Grice. Thank you for everything
and I love you all. Without your support, hard work, love, and God’s grace, none of this
would have happened. Thank God for you three and Jesus Christ.

vi
ACKNOWLEDGMENTS
I thank God for allowing me both the opportunity to pursue my higher education
and obtain my Master’s in Mechanical Engineering. Thank you Dr. John Wagner for this
opportunity: you believed in me and I did everything I could to deliver. Thanks go out to
Dr. Timothy Burg and Dr. Cecil Huey for serving on my committee. Additionally, a
special acknowledgment to Dr. Huey for his help throughout my years at Clemson - it
was greatly appreciated. Thanks are necessary for Dr. Kim Alexander, Dr. Philip
Pidgeon, and Ms. Eleanor Walters for their financial support, professional input and
supervision that aided the development of this research. Additionally, I would like to
thank my peers Joshua Finn, Sameer Samant, and Qimin Yao for their support of both
myself and these research endeavors. Finally, I would like to thank the Department of
Mechanical Engineering staff Michael Justice, Stephen Bass, Jamie Cole, and Gwen
Dockins for their assistance with many aspects of my work.
vii
TABLE OF CONTENTS
Title Page
TITLE PAGE i
ABSTRACT ........................................................................................................................ ii
DEDICATION .................................................................................................................... v
ACKNOWLEDGMENTS ................................................................................................. vi
LIST OF TABLES ............................................................................................................. ix
LIST OF FIGURES ............................................................................................................ x
NOMENCLATURE LIST ............................................................................................... xiii
CHAPTER
1. INTRODUCTION ................................................................................................. 1
1.1 Young Drivers and Safe Roadway Operations ..................................... 1
1.2 Assessing Young Drivers ...................................................................... 5 1.3 Highway Animal Barriers ..................................................................... 6
1.4 Thesis Organization .............................................................................. 9
2. ASSESSMENT OF A SAFE DRIVING PROGRAM
FOR NOVICE OPERATORS ........................................................................... 10
2.1 Driving and Tent Modules .................................................................. 12 2.1.1 Braking Module ................................................................ 13
2.1.2 Obstacle Avoidance Module ............................................. 14
2.1.3 Tailgating Module ............................................................. 15
2.1.4 Loss of Control ................................................................. 18 2.2 Assessment Methods ........................................................................... 20
2.2.1 Objective Evaluation of Driver -
Vehicle Performance ...................................................... 20 2.2.2 Subjective Grading Rubric ................................................ 22
2.3 Case Study-Novice Driving Program ................................................. 23 2.4 Summary ............................................................................................. 24
viii
Table of Contents (Continued)
Title Page
3. FOCUSED NOVICE DRIVER PROGRAM – ASSESSMENT
RESULTS AND DISCUSSION ........................................................................ 26
3.1 Safe Driving Program - Student Driving Activities
and Learning Tent Modules ............................................................. 28
3.1.1 In-Vehicle Modules .......................................................... 29 3.1.2 Tent Modules and Program Pre- and
Post-Tests ....................................................................... 32 3.2 Assessing Safe Driving Programs Offered in Florida,
Georgia, and North Carolina ............................................................ 33 3.3 Conclusion .......................................................................................... 39
4. A SMART JERSEY HIGHWAY BARRIER WITH PORTAL
FOR SMALL ANIMAL PASSAGE AND DRIVER ALERT .......................... 41
4.1 Types of Highway Barriers for Traffic and Animals .......................... 43
4.1.1 Traffic Barriers.................................................................. 43 4.1.2 Animal Barriers ................................................................. 45
4.2 Clemson Smart Portal ......................................................................... 48 4.2.1 Structural Design .............................................................. 49
4.2.2 Electronics Package Design .............................................. 50 4.3 Case Study: Laboratory Demonstration with
Small Animals .................................................................................. 52 4.4 Conclusion .......................................................................................... 54
5. CONCLUSIONS AND RECOMMENDATIONS .............................................. 56
5.1 Driver Training and Evaluation .......................................................... 56 5.2 Smart Jersey Barrier ............................................................................ 57
5.3 Recommendations for Future Research .............................................. 58
APPENDICES .................................................................................................................. 61
A Pre and Post Test Questions in Safe Driving Program ........................................ 61 B Objective Evaluation Metrics and Subjective Rubrics ......................................... 66 C Sample of Matlab Analytical Code for In-Vehicle
Tailgating Module Assessment 70
D Student Graphical Results .................................................................................... 78
REFERENCES ................................................................................................................. 80
ix
LIST OF TABLES
Table Page
2.1: Three safe driving programs offered in Atlanta, GA with
D<75%, 75%<NP<85%, and 85%<P where D=Developing
skill set, NP=Nearly proficient skill set, and P=Proficient
skill set with all scores out of 100% ............................................................... 25
3.1: Sampling of average scores from safe driving programs offered
between February 2010 and November 2011 where
D (Developing) < 75%, 75% < NP (Nearly
Proficient) < 85%, and 85% < P
(Proficient) and all scores
are rated out of 100% ...................................................................................... 35
4.1: Summary of Clemson portal laboratory demonstration with
animal subjects ................................................................................................ 54
B.1: Objective evaluation for the Braking Module; symbol “+”
denotes OR logic operation ............................................................................. 66
B.2: Objective evaluation for the Obstacle Avoidance Module;
symbol “+” denotes OR logic operation ......................................................... 66
B.3: Objective evaluation for the Tailgating Module; symbol “+”
denotes OR logic operation ............................................................................. 67
B.4: Objective evaluation for the Loss of Control Module; symbol
“+” denotes OR logic operation ...................................................................... 67
B.5: Subjective in-vehicle instructor evaluation for the Braking Module ............... 68
B.6: Subjective in-vehicle instructor evaluation for Obstacle
Avoidance Module .......................................................................................... 68
B.7: Subjective in-vehicle instructor evaluation for the
Tailgating Module ........................................................................................... 69
B.8: Subjective in-vehicle instructor evaluation for the Loss of
Control Module ............................................................................................... 69
B.9: Final score for safe driving program ................................................................ 70
x
LIST OF FIGURES
Figure Page
1.1: Automotive related fatalities in the United States, United
Kingdom, France, and Italy from 1994 to 2009
(ECRS, 2012) .................................................................................................... 3
1.2: Instructors discuss factors that may save young drivers’
lives during a tent module at a Richard Petty Safe
Driving Event (Charlotte, NC) .......................................................................... 4
1.3: Laboratory testing of the Clemson Smart Portal with
domesticated felines in a controlled environment
at the Godfrey-Snell Research Facility ............................................................. 8
2.1: Evaluation strategy for safe driving program participants................................ 16
2.2: A student practice run on the braking module course which
requires them to stop their vehicle prior to the stop strip ............................... 17
2.3: Student responding to signal lights while completing the
obstacle avoidance module ............................................................................. 18
2.4: Lead pickup truck equipped with a tailgating apparatus as
two student vehicles follow behind ................................................................. 19
2.5: Loss of control module offers an experience of rear and
front wheel skidding ....................................................................................... 19
2.6: Cross section of earth with cut out of height dz; vehicular
position derived in a two dimensional plane ................................................... 21
2.7: Measurable and calculated variables which define the
objective assessment’s core factors ................................................................ 23
2.8: Average module scores in four modules (braking, obstacle
avoidance, tailgating, and loss of control), grouped
according to class ............................................................................................ 25
3.1: Overview of the safe driving program with assessment ................................... 29
xi
List of Figures (Continued)
Figure Page
3.2: Two students following the lead truck outfitted with the
tailgating apparatus in the tailgating training module ..................................... 31
3.3: Students are instructed to properly maintain their motor
vehicles in the tent module which accompanies the
obstacle avoidance module ............................................................................. 33
3.4: Graphical display of scores for braking and obstacle
avoidance modules .......................................................................................... 36
3.5: Graphical display of scores for tailgating and loss of
control modules ............................................................................................... 37
3.6: Comparison of pre- and post-test scores for the individual
classes ............................................................................................................. 38
3.7: Overall scores of each safe driving program class based on
the average in-vehicle module and post-test scores per
Table 3.1 (column 11) with D (Developing) < 75%,
75% < NP (Nearly Proficient) < 85%,
and 85% < P (Proficient) ................................................................................ 39
4.1: (a) Rural roadway with Jersey barrier, and (b) Clemson University
smart portal concept ........................................................................................ 43
4.2: Roadway barriers in the United States: (a) guard rail (TLJE, 2012),
(b) Jersey barrier (ACI, 2012), (c) Fitch barrier (Enterprise
Flasher, 2012), and (d) cable guard (MDOT, 2012) ....................................... 45
4.3: Samples of dedicated animal passages for roadways: (a) wildlife
underpass (CPWS, 2012), (b) Payne prairie ecopassage
(TLJE, 2012), (c) wildlife overpass (FHWA, 2012),
and (d) wildlife culvert (Parks Canada, 2012) ................................................ 48
4.4: Clemson smart portal highway barrier - (a) concept, and
(b) laboratory prototype .................................................................................. 49
4.5: Smart portal with physical dimensions (feet) ................................................... 50
xii
List of Figures (Continued)
Figure Page
4.6: Electrical circuit for smart barrier featuring solar panel,
rechargeable battery, electrical relay, strobe light,
and passive infrared (PIR) sensor ................................................................... 52
4.7: System configuration diagram for smart barrier outlining
full functionality.............................................................................................. 53
4.8: Animals passing through the smart barrier portal during
laboratory testing ............................................................................................ 55
D.1: Example of a good driver’s headway distance, speed, and
acceleration during the in-vehicle tailgating module 78
D.2: Example of a good driver’s headway time and speed relative
to truck during the in-vehicle tailgating module 78
D.3: Example of a bad driver’s headway distance, speed, and
acceleration during the in-vehicle tailgating module 78
D.4: Example of a bad driver’s headway time and speed relative
to truck during the in-vehicle tailgating module 79

xiii
NOMENCLATURE LIST
a Car acceleration (g’s)
api Car deceleration at index i (g’s)
apj Car deceleration at index j (g’s)
ap Car deceleration (g’s)
dz Driver displacement along earth’s z axis (ft)
E Overall module score
FWS Front wheel skid
NP Nearly proficient skill set
O Objective module score
p Driver x,y position in Cartesian 2-D frame (ft)
P Proficient skill set
r Earth’s radius (ft)
RWS Rear wheel skid
SWS Steer while skidding
tr Reaction time(s)
v Car velocity (mph)
x Driver x position in Cartesian frame (ft)
xstop Length of braking zone (ft)
y Driver y position in Cartesian frame (ft)
Ψ Vehicular yaw angle (deg)
θ Driver latitudinal position (deg)
φ Driver longitudinal position (deg)
Ω Throttle control (%)
+ OR logical operator
1
CHAPTER 1
INTRODUCTION
Road safety affects virtually all individuals in the United States, Europe, and other
developing countries. Drivers who do not adhere to the rules of the road not only
endanger themselves, but also their passengers, other motorists, pedestrians, and society
in general. Poor driving behavior is most often prevalent by young drivers who lack both
experience and full attitudinal development. Younger individuals are more prone to
believe they can pilot any scenario regardless of circumstances. This faulty outlook often
proves to be dangerous and many times fatal due to their personal thresholds and lack of
knowledge regarding machine limits. Fortunately, recent research has produced a new
driver training curriculum to improve drivers’ ability to safely manage roadway
situations. In addition to driver behavior, another factor influences road safety.
The physical highway infrastructure is designed to maintain safety (e.g., Jersey
barriers, roadway safety rails) but often at an unforeseen cost. These highway devices
often have severe consequences for local wildlife. Despite recent innovations, such as
animal-only-paths that bypass vehicular traffic, there are few efforts at altering already
applied infrastructures. An innovative change to Jersey barriers has been explored both
analytically and experimentally to assuage these negative influences.
1.1 Young Drivers and Safe Roadway Operations
Each year thousands of drivers are injured or killed in car crashes. From 1994 to
2007, highway accidents accounted for over 660,000 deaths in the United States of
2
America (FARS, 2012). Vehicular crashes represent the largest endangerment to
individuals in the 15-20 years old age bracket (NHTSA, 2011). Previous driver
educational programs were intended to outfit young drivers early in their lives with the
necessary information for proper and safe operation of vehicles (Warner, 1972).
However, the effectiveness of the methods used might be questioned due to the high
annual toll of roadway accidents and human suffering. Typically, driver instruction is
restricted to a classroom environment and attempts to inform individuals on topics
ranging from general information to proper vehicle operation. However, the information
presented may be overly generic, often not specific enough to be directly applicable.
Furthermore, traditional classrooms are unable to deliver in-vehicle operating experience
(Simmons-Morton et al, 2006). Consequently, a new generation of instruction programs
has been developed to address several shortcomings of traditional training and is
validated by multiple studies.
It is important for young drivers to receive adequate “behind the wheel” time in a
vehicle to learn driving skills. This experience is the foundation of the individual’s
ultimate skill set for managing a vehicle in the complete array of roadway events that
might occur. Traditionally, in-vehicle experience was gained through supervised driving
of the family car. However, the needed operational experience of young drivers is much
more than driving through neighborhoods and secondary roads. Specific skills such as
steer while skidding, throttle control, proper headway, and brake control are difficult to
learn in only these driving conditions. Licensure processes often don’t account for
driving experience; even graduated licensing programs are prone to this issue. A safe
3
driving program should focus on developing an appropriate attitudinal foundation for
operating a motor vehicle. Young individuals often lack a reasonable sense of their own
personal skill sets and therefore, because of the training they have had, have developed a
state of overconfidence. Combining a lesser awareness for personal limits with
overconfidence can lead to a hazardous situation when navigating highway occurrences.
Drivers should be helped to understand the factors that hinder responses when operating a
vehicle as opposed to receiving instruction focused solely on improving performance.
0
5000
10000
15000
20000
25000
30000
35000
40000
45000
50000
1994 1996 1998 2000 2002 2004 2006 2008
Mo
tor
Veh
icle
Fa
tala
ties
Calender Year
United States
United Kingdom
France
Italy
Figure 1.1: Automotive related fatalities in the United States, United Kingdom, France,
and Italy from 1994 to 2009 (ECRS, 2012)
Operating a vehicle under highway conditions requires careful and concentrated
attention on a motorist’s part to safely navigate any scenario. Given young drivers’
limited foundation for safely managing a vehicle under road conditions, it is important to
address a myriad of topics. Individuals need to understand the influence of vehicle
4
limitations, vehicular parameters, and proper attitudinal response can have when driving
a motor vehicle. These general factors comprise a substantial portion of the dynamics
involved in roadway occurrences. Performance levels can vary vastly from one vehicle
to the next. For example, a large SUV will require significantly more time to stop as
compared to a lighter sports car that is designed around a different set of performance
parameters. Further, regardless of the vehicle, certain thresholds such as relative speed
and appropriate steering input must be maintained. Improper modulation of these
parameters can result from driver oversight, or might indicate a driver’s lack in
understanding for the effect his actions might have on his vehicle and surroundings.
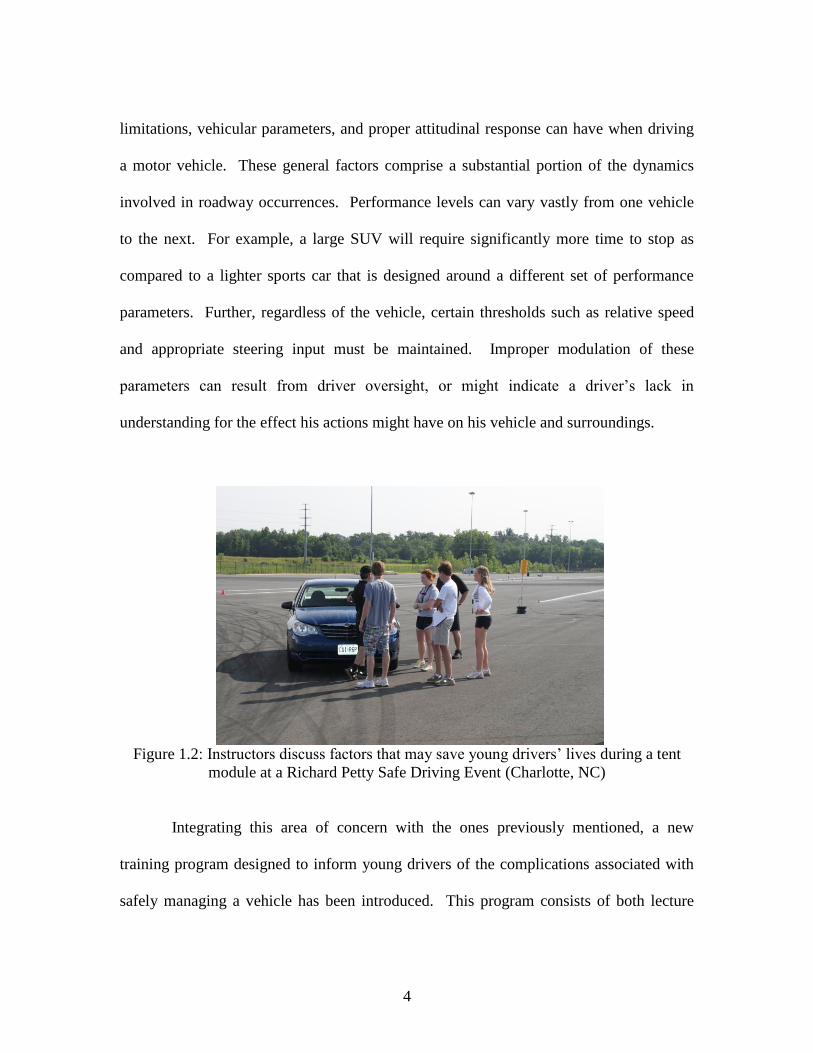
Figure 1.2: Instructors discuss factors that may save young drivers’ lives during a tent
module at a Richard Petty Safe Driving Event (Charlotte, NC)
Integrating this area of concern with the ones previously mentioned, a new
training program designed to inform young drivers of the complications associated with
safely managing a vehicle has been introduced. This program consists of both lecture
5
and in-vehicle learning experiences for young drivers. It includes instructional
environments that introduce students to many of the complications previously mentioned,
as well as additional hazards they may face. In-vehicle experiences provide both behind
the wheel time and an opportunity to experience various dangerous driving circumstances
in a simulated, safe, and controlled manner. A sampling of 480 students from this
program was evaluated, and their safe driving capabilities were assessed as a result of
their participation in the program. This demographic consisted of 19 total classes that
occurred across the entirety of the 2010 calendar year. Information gathered to judge the
participants’ capabilities was based around empirical and electronic data captured during
their in-vehicle experiences.
1.2 Assessing Young Drivers
Although it is imperative for young drivers to be prepared to safely managing
roadway events, adequately preparing them to do so requires the establishment of an
assessment method. These evaluation methods must serve two purposes: first, a metric of
measuring a driver’s threshold driving capabilities, and second, a control to allow the
effectiveness of the training program to be determined. A means to detail a motorist’s
skill set enables quantifiable measures to be established to describe performance. Drivers
are not assessed only subjectively, e.g. from bad to good, but also objectively according
to a pre- and post-test questionnaire. Also, quantified performance measures permits the
effectiveness of the safe driving program to be evaluated. Advancement of student safe
6
driving capabilities is determined using an instructor subjective rubric and participant
responses to the set of questionnaires.
Two categories must be addressed when evaluating motorists: the vehicular
dynamics involved in a driving event, and the knowledge possessed by drivers.
Subjective instructor rubrics assess the finer details of students operation of a motor
vehicle by evaluating driving events according to various driving and vehicular
parameters. However, additional aspects of participants’ safe driving comprehension can
be detailed by administrating a general driving knowledge test. This questionnaire is
administered prior to student’s experiencing the safe driving program and at the
conclusion of the program. The questionnaire consists of 14 questions regarding general
driving knowledge (refer to Appendix A). Integrating information detailing the driver
event with the participant’s driving comprehension provides a more comprehensive
assessment of a motorist’s safe driving capabilities.
1.3 Highway Animal Barriers
Highway infrastructures protect drivers from a myriad of roadway dangers but are
often not designed to safeguard both motorists and local animal populations. Many
infrastructure features protect drivers and pedestrians, but in many cases endanger
wildlife. Of these traffic safety devices, concrete barriers pose one of the greatest threats
to wildlife safety. These barriers, being a continuous medium, typically extend for miles
as they function to separate opposing flows of highway speed and dense traffic. Given
their presence along highway stretches, they often create an insurmountable obstacle for
7
animals that stray onto a road. By segregating traffic flow with these concrete dividers,
animals may become trapped on the inside shoulder where the barriers separate traffic.
After an animal encounters one of these obstacles and fails to overcome it, they are likely
to be killed before escaping back to the roadway shoulder and surrounding vegetation.
Infrastructures, known as animal barriers, have been designed to address this
complication in remote areas.
In recent years, attention has been given to developing a means to keep animals
safe from traffic flow. These facilities provide existing systems with safe passage options
for large sized animals such as deer and moose. The most common means of deterring
animal-to-vehicle collisions is a pathway either over or under roadways. Diverting
vertebrate travel around current highways has proven an effective option for deterring
wildlife-to-vehicle collisions. An alternative provision is employing a culvert as a
secondary travel route for wildlife. However, by reimagining currently implemented
Jersey barriers, a new infrastructure has been developed to empower animals to escape a
vehicular related expiration.
A new subclass of intelligent Jersey barrier design was developed and named the
Clemson Smart Portal (CSP). This new barrier consists of a passage running through its
base and an electronics system to monitor animal activities. Concrete barriers tend to
entrap wildlife on roads, but the innovative infrastructure is designed to present them a
means of egress. Animals are enabled to escape traffic through a passageway in the
smart portal’s structure. Although this option is beneficial to wildlife, it presents an
additional variable for motorists to consider. The potential of egress is wasted if wildlife
8
blindly enter additional traffic. Therefore, an electronics package was developed to
monitor the animals’ actions and notify drivers of their presence. These actions are
detected by a passive infrared (PIR) sensor that senses the motion of any warm body that
emits an appropriate phase of black body radiation. In response to these movements, a
strobe light flashes to warn drivers to the animal’s presence. This technology allows
individuals to prepare for most wildlife entering the roadway.
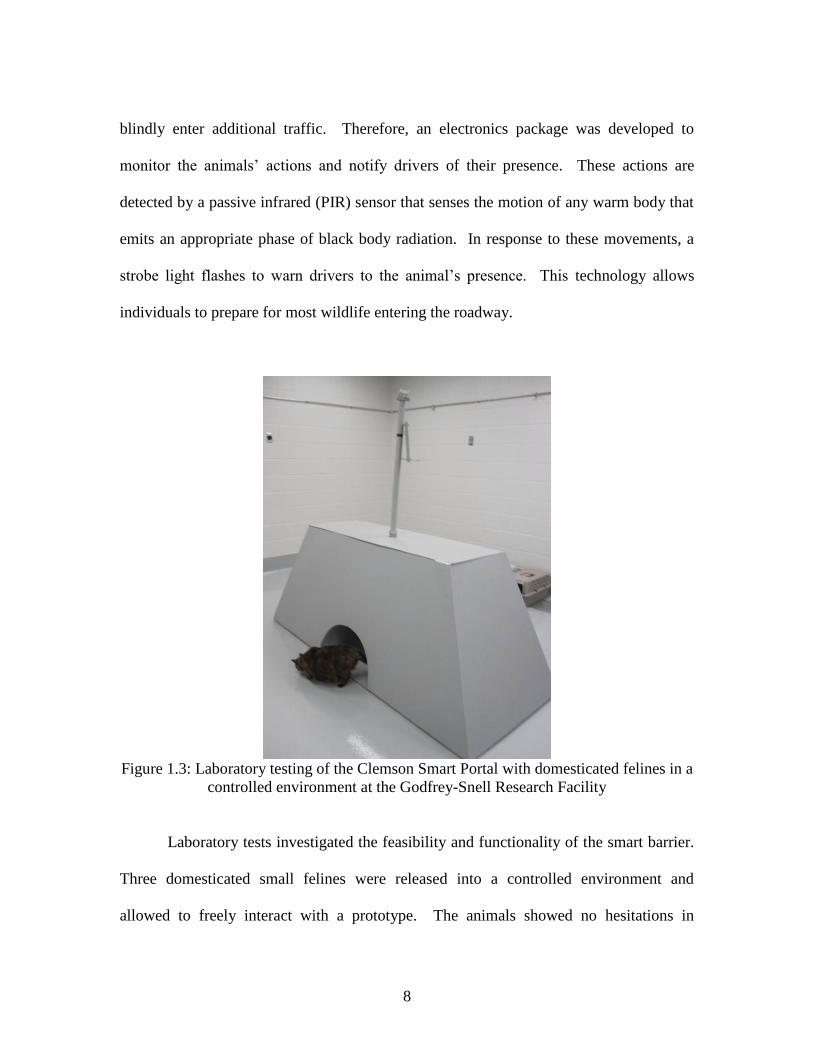
Figure 1.3: Laboratory testing of the Clemson Smart Portal with domesticated felines in a
controlled environment at the Godfrey-Snell Research Facility
Laboratory tests investigated the feasibility and functionality of the smart barrier.
Three domesticated small felines were released into a controlled environment and
allowed to freely interact with a prototype. The animals showed no hesitations in
9
engaging the apparatus and frequently employed the available passage to travel through
the unit. The equipped electronics package was repeatedly successful in detecting animal
movements and correlating these actions via a light warning system.
1.4 Thesis Organization
An array of driving safety measures will be presented in this thesis. Chapter 2
introduces the new safe driving program, with an evaluation of the program’s
effectiveness on safe driving comprehension of young drivers. Chapter 3 discloses a
more focused evaluation of the program’s effect on participants over a two-year time
period. The intelligent Jersey barrier design is discussed in Chapter 4 with laboratory
demonstrations. Conclusions and recommendation are presented in Chapter 5. Finally,
the questions of the pre- and post-tests are shown in Appendix A, the evaluation rubrics
applied throughout the safe driving program are outlined in Appendix B, a sample Matlab
code used to assess driver data is presented in Appendix C, and graphs of both good and
bad driver vehicular parameters are contained in Appendix D.
10
CHAPTER 2
ASSESSMENT OF A SAFE DRIVING PROGRAM FOR NOVICE OPERATORS
Every year, the United States and European Union are plagued by the deaths of
young drivers due to vehicular crashes; the number one rated killer of people ages 15-20
years old (NHTSA, 2011). From 2000 to 2006, 19,076 American motorists in the age
range of 15-19 years old were killed in fatal car crashes (CDC, 2012). Although statistics
have shown a decrease in the number of reported fatal accidents involving young
operators (NHTSA, 2011), more can be done to equip these novice motorists to properly
manage common driving scenarios. Instructing them on driving skills alone though is
ineffective, with studies showing it is better to teach individuals to adapt their driving
style to a given situation rather than applying a performance based training system
(MacNeil, 2006). It is important to recognize that skill based training are not ideal since
young drivers are prone to overconfidence in their driving abilities (Gregersen, 1995).
Paralleling these two studies, the most effective training programs should be empirically
based and designed to focus on factors of a specific demographic.
One critical factor for young drivers is their lack of experience and proper
attitudinal behavior (Mayhew et. al, 2002). A safe driving program has been developed
by Clemson University Automotive Safety Institute and Richard Petty Driving Institute to
directly address the safe driving problems of young motorists. By immersing them into a
controlled environment, these individuals are provided an opportunity to develop their
driving capability and comprehension.
11
Traditionally speaking, the optimal setting for young driving training is perceived
as a driver education class (Warner, 1972). However, the majority of student time comes
from in-class instruction with only a fraction of the entire time typically spent behind the
wheel of an actual car. This learning approach was based on the assumption that students
practicing at home with their family’s vehicle the classroom lessons. Some states
required anyone younger than 21 to undergo driver training similar to this format for
licensing (Williams et al., 1996). However, this method has been proven ineffective due
to the inadequate amount of supervised driving time for most young motorists (Simons-
Morton et al., 2006). The creation of educational program must be carefully
conceptualized and implemented, as many programs resulted in a negative safety impact
(Stock et al., 1983). A study completed in Denmark exemplified the implementation of a
new driver education program (Carstensen, 1993). Unlike studies based around
traditional programs, Carstensen found this system to improve crash rates. While
Cartensen’s investigation was based on an ideal case, it nonetheless presented an example
of an effective driving program designed for younger vehicle operators.
Research on the next generation of driver training programs has shown a need to
focus on drivers’ behavior, skill limitations, and safety perspectives. These are critical
driver characteristics to operate a vehicle, as studies have shown programs that focus only
on performance skill levels are optimally ineffective and possibly increase crash risks
(Senserrick, 2007). Instructional procedures applied must be realistic and practical
(Hatakka et al., 2002), and they should must contain information relative to young
drivers’ attention errors, vehicle speeds, and visual searching (McKnight, 2006). An
12
instructional environment that addresses these topics, while providing instruction and an
understanding of preventive driving, should be designed into novice operators programs
(Gregersen et al., 2003), (Berg et. al, 2004).
The remainder of the paper is organized as follows: Section 2 describes the four
training modules implemented in the instructional program. Section 3 introduces the
rubrics developed by Norfleet (2009) and Clark (et al., 2012). Section 4 offers a case
study for the assessment of the safe driving program. Finally, Section 5 contains the
summary. Appendix A presents the questions administered to students during the
program, while Appendix B covers the two assessment methods employed in this study,
and Appendix C contains a complete Nomenclature List.’
2.1 Driving and Tent Modules
The safe driving program begins by administering a pre-test to students, followed
by the participants completing multiple driving and tent modules. At the conclusion of
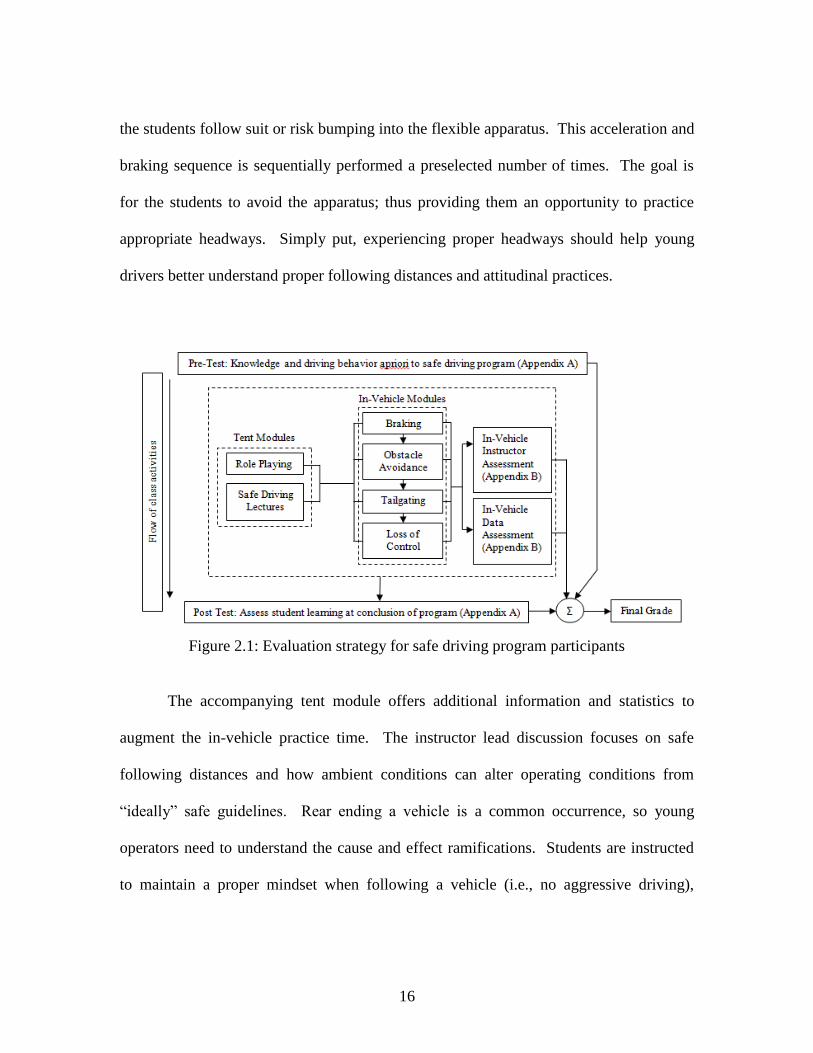
instruction the participants undertake a post-test. A schematic diagram of the learning
and assessment activities is given in Figure 2.1. The test questions are located in
Appendix A. The modules in the training program include braking, obstacle avoidance,
tailgating, and loss of control. The braking module teaches students the required skills to
safely stop a vehicle and allows them to practice in which they go from a prescribed trap
velocity to a complete stop. The obstacle avoidance module enables students to learn
how to safely drive around roadway hazards while maintaining control. The tailgating
module allows the student to experience the proper following distance for different traffic
13
scenarios, ranging from normal traffic circumstances to bumper-to-bumper rush hour
type conditions. Further, they gain first had experience with the relative distances
between vehicles and appropriate stopping distance. Finally, the loss of control module
allows students to integrate all concepts together and experience instances where the car’s
wheels begin to slip and recover vehicle control. All four in-vehicle modules have been
designed to offer real-world experiences based on the common factor leading to fatal
driving scenarios. As the students undertake each module, they rotate out of driving the
cars and into an accompanying instructional tent. Each tent event is specifically designed
to supplement the given in-vehicle scenarios. Upon completion of the tent curriculum,
the students return to the vehicles to practice.
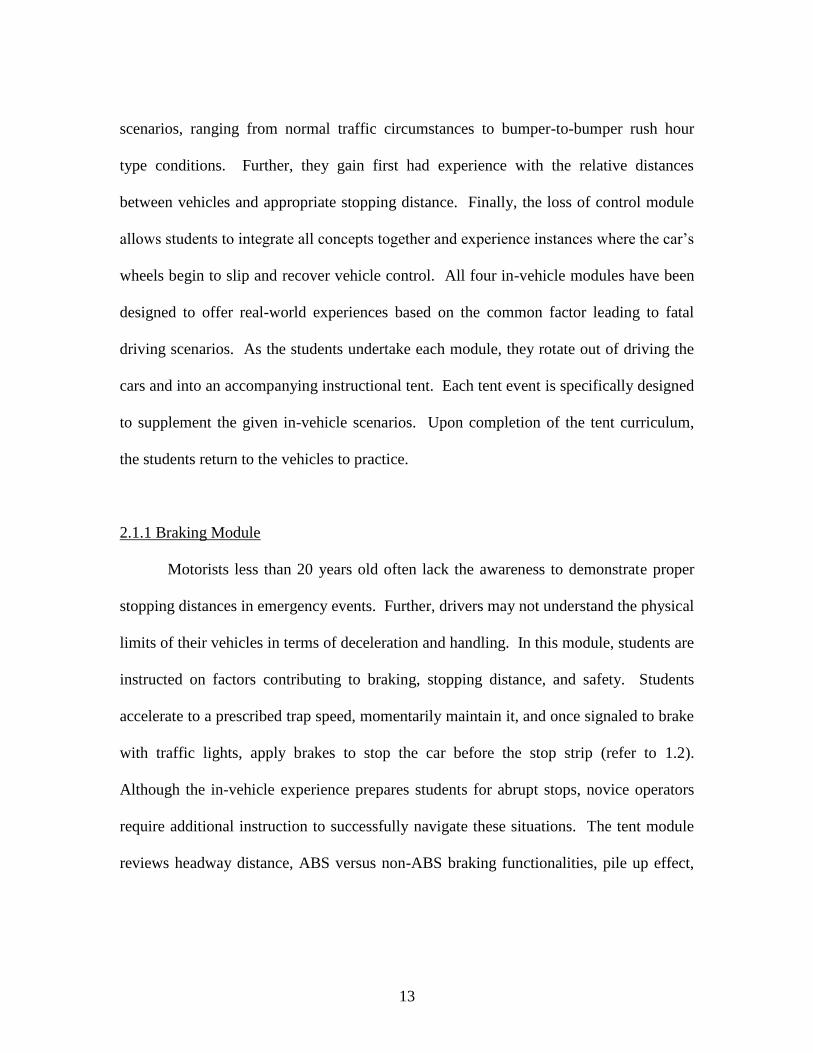
2.1.1 Braking Module
Motorists less than 20 years old often lack the awareness to demonstrate proper
stopping distances in emergency events. Further, drivers may not understand the physical
limits of their vehicles in terms of deceleration and handling. In this module, students are
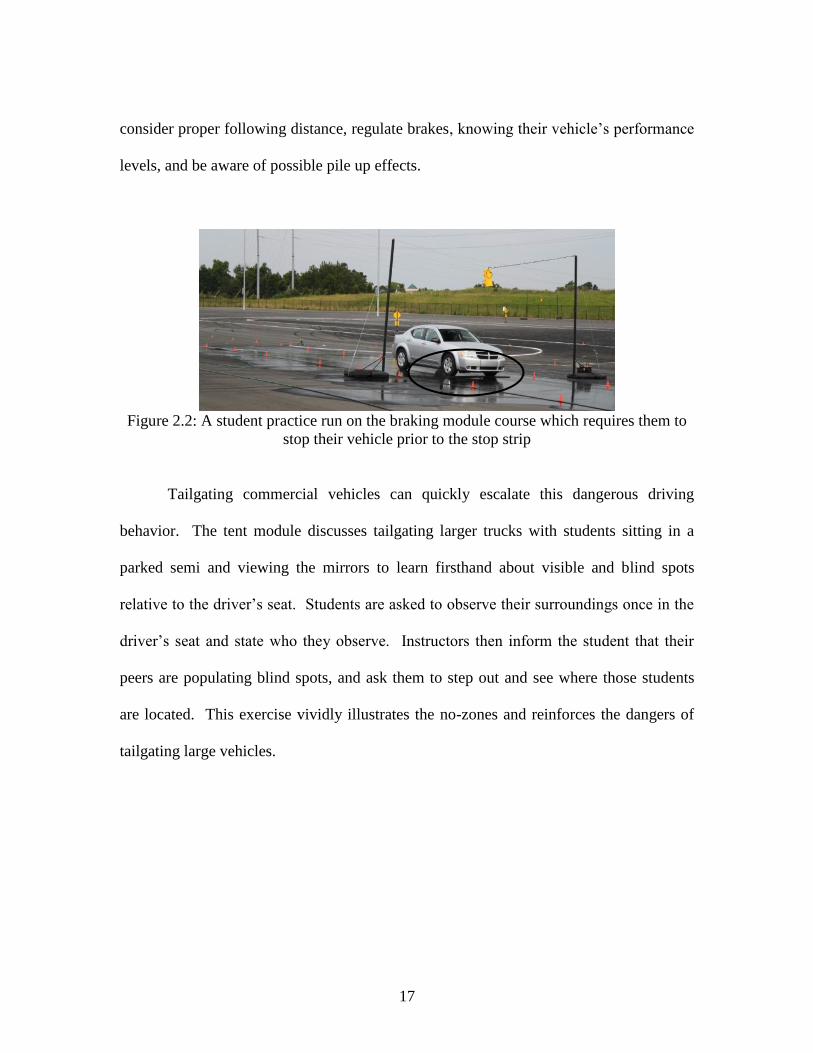
instructed on factors contributing to braking, stopping distance, and safety. Students
accelerate to a prescribed trap speed, momentarily maintain it, and once signaled to brake
with traffic lights, apply brakes to stop the car before the stop strip (refer to 1.2).
Although the in-vehicle experience prepares students for abrupt stops, novice operators
require additional instruction to successfully navigate these situations. The tent module
reviews headway distance, ABS versus non-ABS braking functionalities, pile up effect,
14
impact of loose (e.g., gravel) and slick (e.g, wet) surfaces on stopping distances,
regulating brake pressure, and stopping a vehicle without inducing a wheel skid.
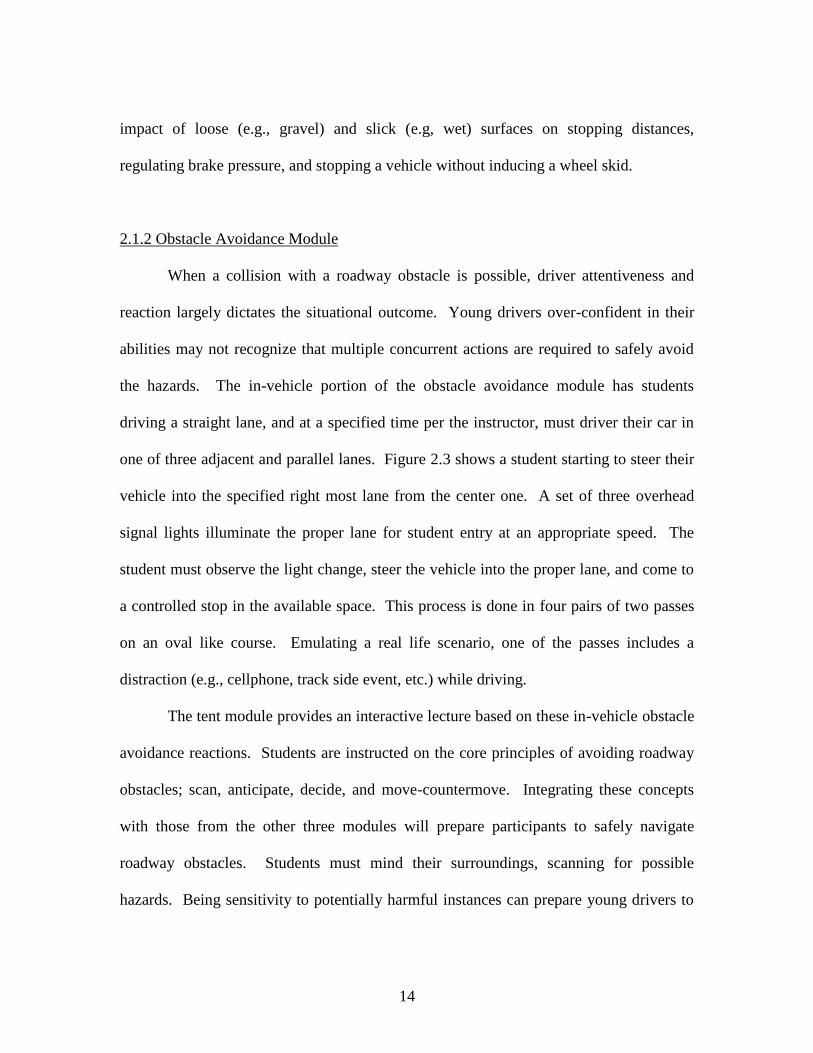
2.1.2 Obstacle Avoidance Module
When a collision with a roadway obstacle is possible, driver attentiveness and
reaction largely dictates the situational outcome. Young drivers over-confident in their
abilities may not recognize that multiple concurrent actions are required to safely avoid
the hazards. The in-vehicle portion of the obstacle avoidance module has students
driving a straight lane, and at a specified time per the instructor, must driver their car in
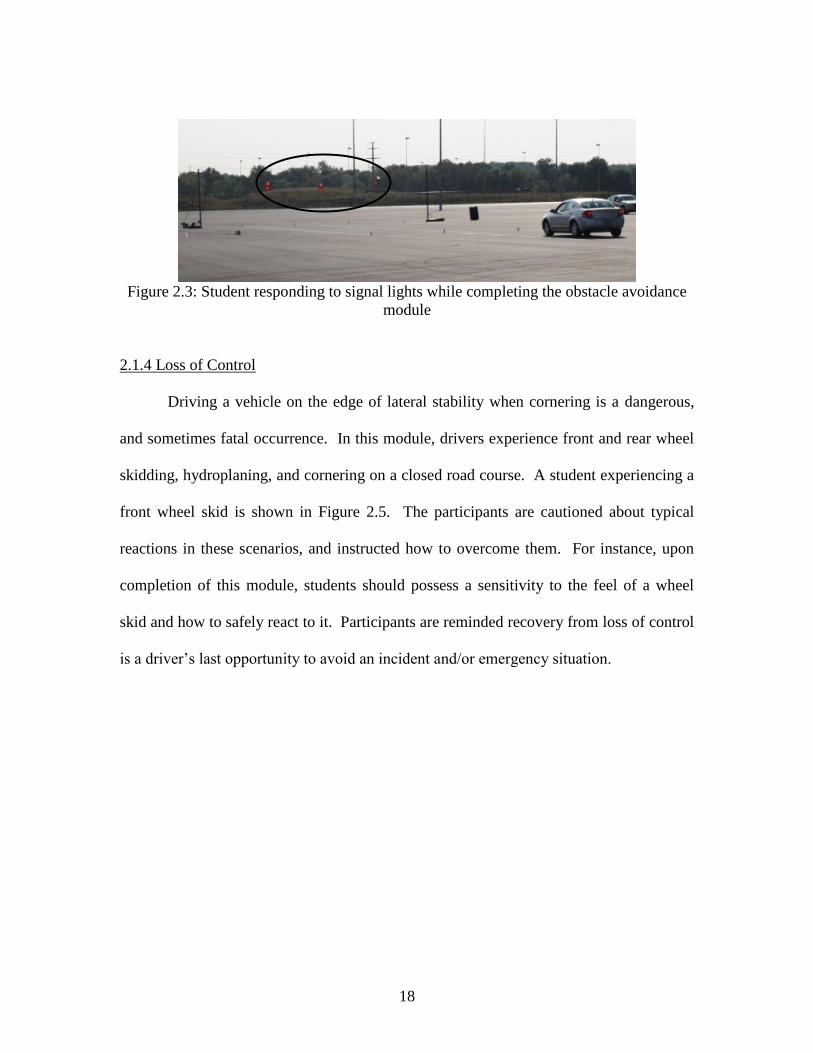
one of three adjacent and parallel lanes. Figure 2.3 shows a student starting to steer their
vehicle into the specified right most lane from the center one. A set of three overhead
signal lights illuminate the proper lane for student entry at an appropriate speed. The
student must observe the light change, steer the vehicle into the proper lane, and come to
a controlled stop in the available space. This process is done in four pairs of two passes
on an oval like course. Emulating a real life scenario, one of the passes includes a
distraction (e.g., cellphone, track side event, etc.) while driving.
The tent module provides an interactive lecture based on these in-vehicle obstacle
avoidance reactions. Students are instructed on the core principles of avoiding roadway
obstacles; scan, anticipate, decide, and move-countermove. Integrating these concepts
with those from the other three modules will prepare participants to safely navigate
roadway obstacles. Students must mind their surroundings, scanning for possible
hazards. Being sensitivity to potentially harmful instances can prepare young drivers to
15
safely respond to these conditions. Students are reminded of the need for seat belts and
proper attitude. Fatality and injury statistics are introduced to help students comprehend
safety issues. For example, 1,652 deaths and 22,372 serious injuries could be avoided at
90% public use of seat belts (NHTSA, 2010). Proper mind set is of equal importance for
safe driving. Young individuals are highly influenced by the actions of their peers.
Novice drivers may be afraid to be “self conscious” if they are pressured to act outside of
their peer’s accepted procedures. Further, their inexperience may leave them lacking a
sense of danger (Boyle and Vanderwolf, 2003), (Fell et al., 2005).
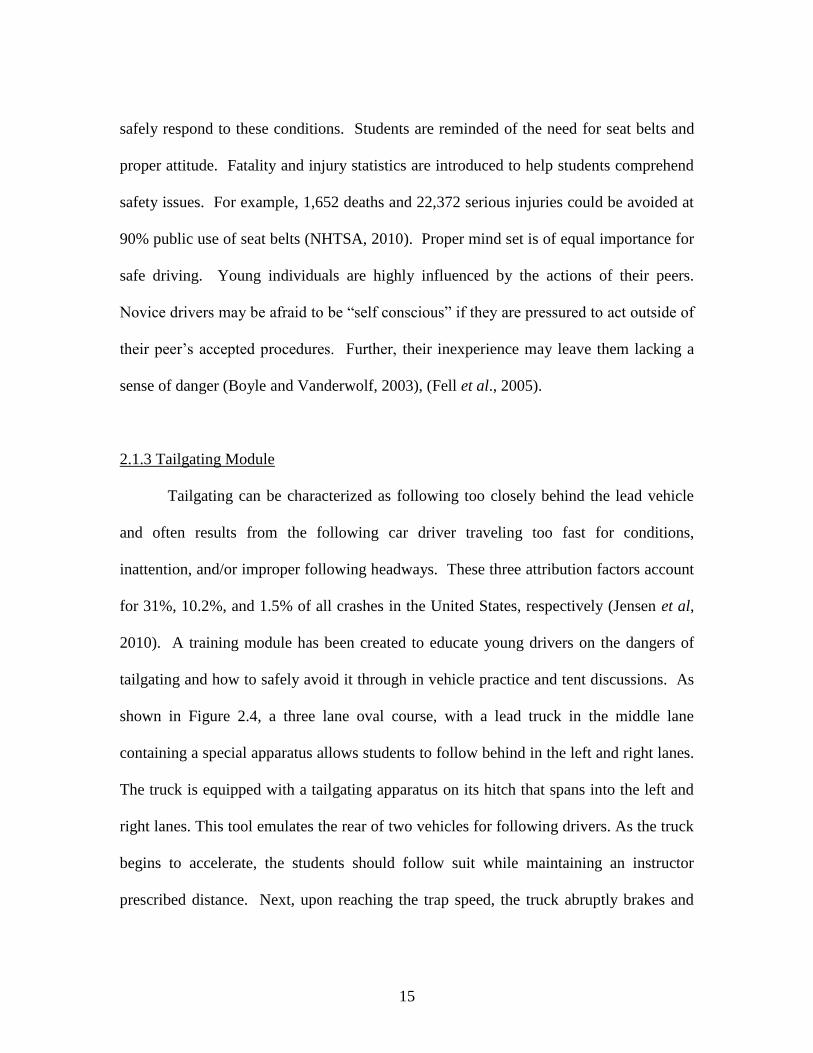
2.1.3 Tailgating Module
Tailgating can be characterized as following too closely behind the lead vehicle
and often results from the following car driver traveling too fast for conditions,
inattention, and/or improper following headways. These three attribution factors account
for 31%, 10.2%, and 1.5% of all crashes in the United States, respectively (Jensen et al,
2010). A training module has been created to educate young drivers on the dangers of
tailgating and how to safely avoid it through in vehicle practice and tent discussions. As
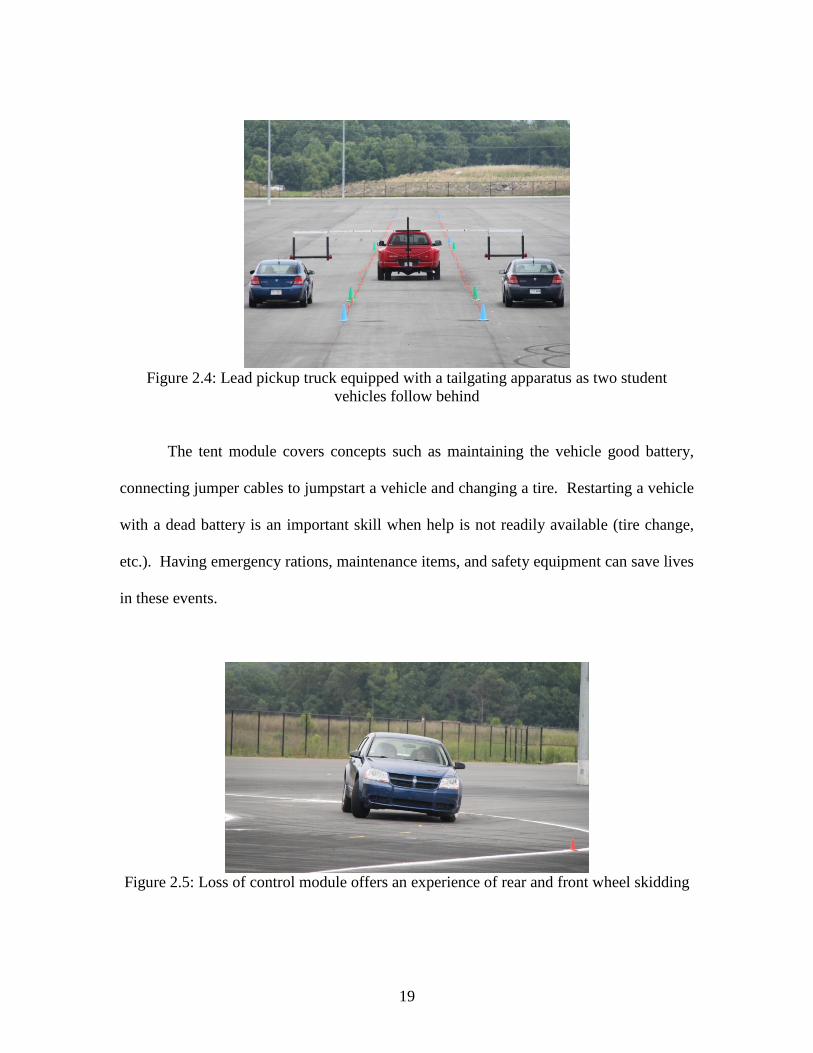
shown in Figure 2.4, a three lane oval course, with a lead truck in the middle lane
containing a special apparatus allows students to follow behind in the left and right lanes.
The truck is equipped with a tailgating apparatus on its hitch that spans into the left and
right lanes. This tool emulates the rear of two vehicles for following drivers. As the truck
begins to accelerate, the students should follow suit while maintaining an instructor
prescribed distance. Next, upon reaching the trap speed, the truck abruptly brakes and
16
the students follow suit or risk bumping into the flexible apparatus. This acceleration and
braking sequence is sequentially performed a preselected number of times. The goal is
for the students to avoid the apparatus; thus providing them an opportunity to practice
appropriate headways. Simply put, experiencing proper headways should help young
drivers better understand proper following distances and attitudinal practices.
Figure 2.1: Evaluation strategy for safe driving program participants
The accompanying tent module offers additional information and statistics to
augment the in-vehicle practice time. The instructor lead discussion focuses on safe
following distances and how ambient conditions can alter operating conditions from
“ideally” safe guidelines. Rear ending a vehicle is a common occurrence, so young
operators need to understand the cause and effect ramifications. Students are instructed
to maintain a proper mindset when following a vehicle (i.e., no aggressive driving),
17
consider proper following distance, regulate brakes, knowing their vehicle’s performance
levels, and be aware of possible pile up effects.
Figure 2.2: A student practice run on the braking module course which requires them to
stop their vehicle prior to the stop strip
Tailgating commercial vehicles can quickly escalate this dangerous driving
behavior. The tent module discusses tailgating larger trucks with students sitting in a
parked semi and viewing the mirrors to learn firsthand about visible and blind spots
relative to the driver’s seat. Students are asked to observe their surroundings once in the
driver’s seat and state who they observe. Instructors then inform the student that their
peers are populating blind spots, and ask them to step out and see where those students
are located. This exercise vividly illustrates the no-zones and reinforces the dangers of
tailgating large vehicles.
18
Figure 2.3: Student responding to signal lights while completing the obstacle avoidance
module
2.1.4 Loss of Control
Driving a vehicle on the edge of lateral stability when cornering is a dangerous,
and sometimes fatal occurrence. In this module, drivers experience front and rear wheel
skidding, hydroplaning, and cornering on a closed road course. A student experiencing a
front wheel skid is shown in Figure 2.5. The participants are cautioned about typical
reactions in these scenarios, and instructed how to overcome them. For instance, upon
completion of this module, students should possess a sensitivity to the feel of a wheel
skid and how to safely react to it. Participants are reminded recovery from loss of control
is a driver’s last opportunity to avoid an incident and/or emergency situation.
19
Figure 2.4: Lead pickup truck equipped with a tailgating apparatus as two student
vehicles follow behind
The tent module covers concepts such as maintaining the vehicle good battery,
connecting jumper cables to jumpstart a vehicle and changing a tire. Restarting a vehicle
with a dead battery is an important skill when help is not readily available (tire change,
etc.). Having emergency rations, maintenance items, and safety equipment can save lives
in these events.
Figure 2.5: Loss of control module offers an experience of rear and front wheel skidding
20
2.2 Assessment Methods
As students experience the six hour training program, their answers to questions,
reactions as observed by the instructors, and vehicle operation recorded per in-vehicle
devices are collected. Subjective and objective assessments were applied to fully
quantify each student’s performance. The developed objective method produces an
unbiased assessment of students with measurable vehicle parameters. Concurrently,
instructor evaluations consist of information observed while the student drives the
various modules. These two metrics are presented in Appendix B.
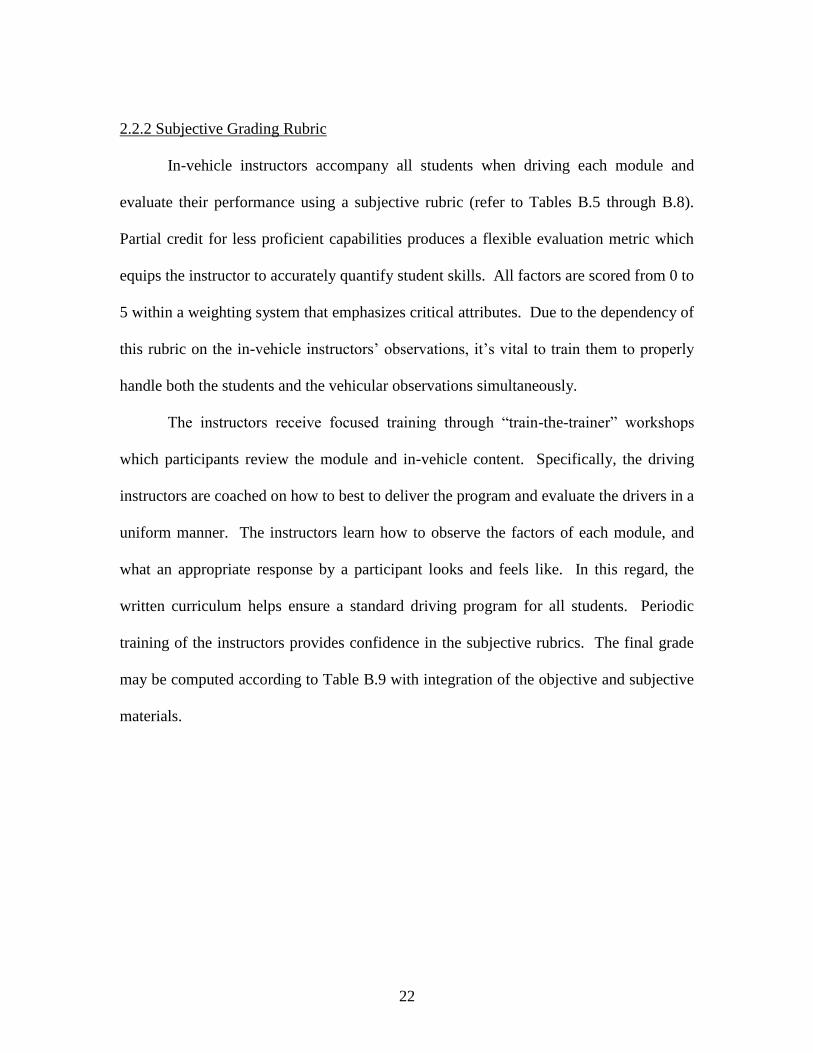
2.2.1 Objective Evaluation of Driver-Vehicle Performance
The instruction vehicles are equipped with general purpose data acquisition units
to collect data to evaluate the driver performance for each module. The availability of
vehicular data can help assess student performance as shown in Tables B.1 through B.4.
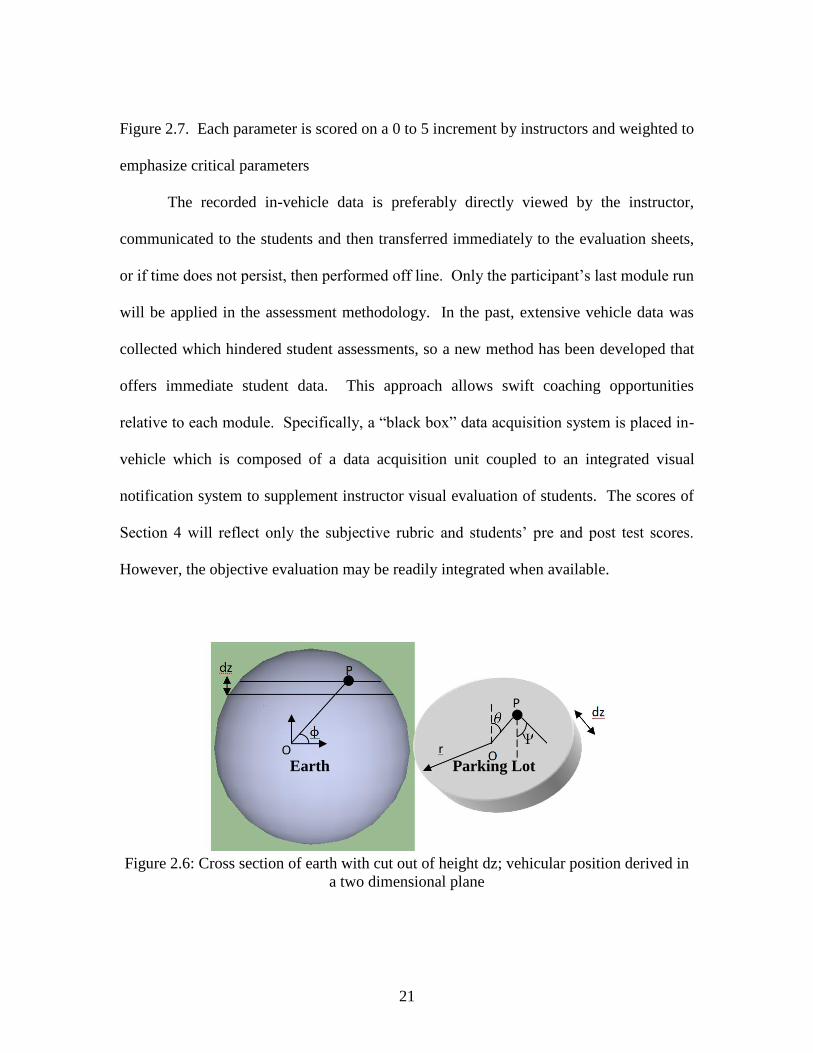
The recorded vehicle parameters included the chassis vehicular GPS coordinates (r, ,φ),
car velocity, v, and car acceleration, ap. The vehicular GPS coordinates can be
transformed into a localized (x,y) two dimensional Cartesian reference frame (refer to
Figure 2.6) by assuming relatively small displacements of the instruction vehicles along
the earth’s z axis. In this analysis, φ, φ, and . The
vehicle’s velocity is calculated based on position changes with respect to the GPS
satellite’s position. The acceleration is recorded by an integrated accelerometer, and the
remaining variables (e.g., tr, Ψ) are extracted from these known signals as shown in
21
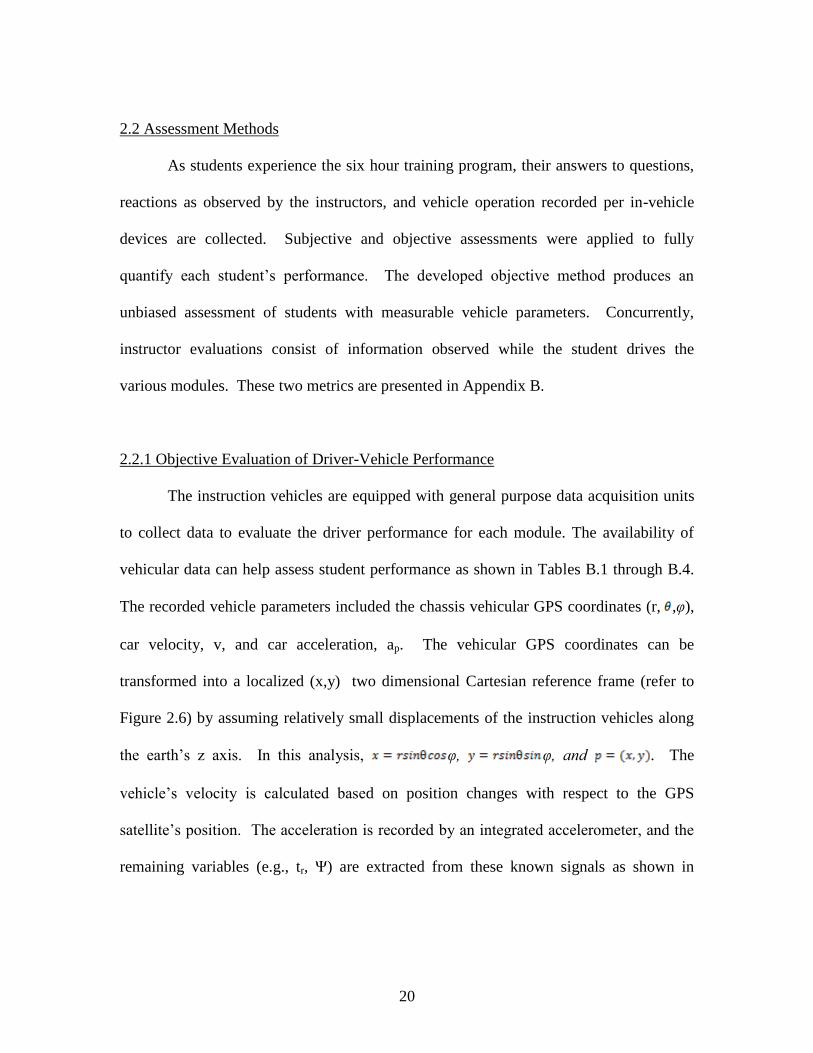
Figure 2.7. Each parameter is scored on a 0 to 5 increment by instructors and weighted to
emphasize critical parameters
The recorded in-vehicle data is preferably directly viewed by the instructor,
communicated to the students and then transferred immediately to the evaluation sheets,
or if time does not persist, then performed off line. Only the participant’s last module run
will be applied in the assessment methodology. In the past, extensive vehicle data was
collected which hindered student assessments, so a new method has been developed that
offers immediate student data. This approach allows swift coaching opportunities
relative to each module. Specifically, a “black box” data acquisition system is placed in-
vehicle which is composed of a data acquisition unit coupled to an integrated visual
notification system to supplement instructor visual evaluation of students. The scores of
Section 4 will reflect only the subjective rubric and students’ pre and post test scores.
However, the objective evaluation may be readily integrated when available.
Figure 2.6: Cross section of earth with cut out of height dz; vehicular position derived in
a two dimensional plane
Earth Parking Lot
22
2.2.2 Subjective Grading Rubric
In-vehicle instructors accompany all students when driving each module and
evaluate their performance using a subjective rubric (refer to Tables B.5 through B.8).
Partial credit for less proficient capabilities produces a flexible evaluation metric which
equips the instructor to accurately quantify student skills. All factors are scored from 0 to
5 within a weighting system that emphasizes critical attributes. Due to the dependency of
this rubric on the in-vehicle instructors’ observations, it’s vital to train them to properly
handle both the students and the vehicular observations simultaneously.
The instructors receive focused training through “train-the-trainer” workshops
which participants review the module and in-vehicle content. Specifically, the driving
instructors are coached on how to best to deliver the program and evaluate the drivers in a
uniform manner. The instructors learn how to observe the factors of each module, and
what an appropriate response by a participant looks and feels like. In this regard, the
written curriculum helps ensure a standard driving program for all students. Periodic
training of the instructors provides confidence in the subjective rubrics. The final grade
may be computed according to Table B.9 with integration of the objective and subjective
materials.
23
Figure 2.7: Measurable and calculated variables which define the objective assessment’s
core factors
2.3 Case Study-Novice Driving Program
In this paper, a case study will be presented which consists of three complete safe
driving classes at the Atlanta Motor Speedway (Atlanta, GA). Classes 1, 2, and 3
consisted of 27, 27, and 16 participants, respectively. The weather for Classes 1 (Sat,
AM) and 2 (Sat, PM) was a warm summer day with moderate precipitation and steady
winds. The temperature and winds were comparable for Class 3 but with negligible rain
fall. The average performance for the three classes in each module and program have
been summarized in Table 2.1. Classification of the participant’s safe driving skill sets
are as follows: a grade lower than 75% is labeled a developing skill, 75% to 85%
represents nearly proficient skills, and greater than 85% corresponds to a proficient skill
level.
The participants have been evaluated on the pre-test, four modules, and post-test
as previously discussed. Each class displayed low pre-test scores when compared to the
post-test values which coincides with the expectation of young drivers’ lower levels for
safe driving comprehension. The students were evaluated upon completion of each in-
Cal
cula
tions
Measurements
t
ap
r
θ
φ
System Variables
t
ap
Ѱ
tr
x
y
24
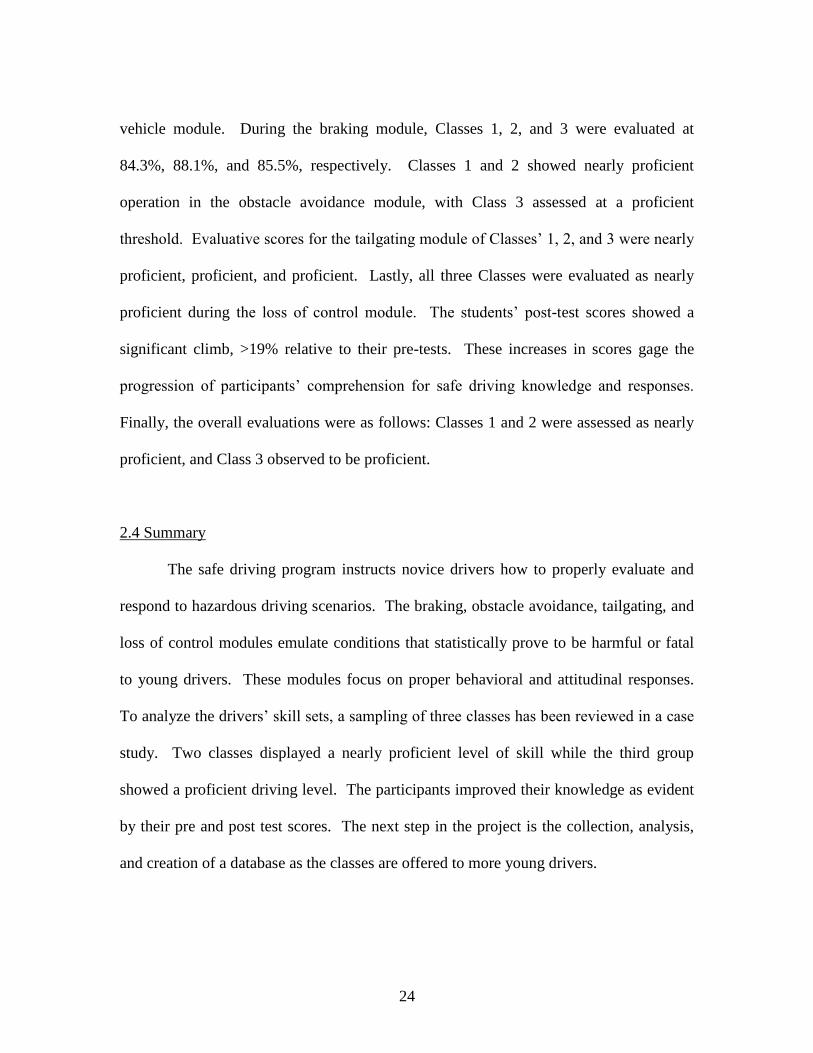
vehicle module. During the braking module, Classes 1, 2, and 3 were evaluated at
84.3%, 88.1%, and 85.5%, respectively. Classes 1 and 2 showed nearly proficient
operation in the obstacle avoidance module, with Class 3 assessed at a proficient
threshold. Evaluative scores for the tailgating module of Classes’ 1, 2, and 3 were nearly
proficient, proficient, and proficient. Lastly, all three Classes were evaluated as nearly
proficient during the loss of control module. The students’ post-test scores showed a
significant climb, >19% relative to their pre-tests. These increases in scores gage the
progression of participants’ comprehension for safe driving knowledge and responses.
Finally, the overall evaluations were as follows: Classes 1 and 2 were assessed as nearly
proficient, and Class 3 observed to be proficient.
2.4 Summary
The safe driving program instructs novice drivers how to properly evaluate and
respond to hazardous driving scenarios. The braking, obstacle avoidance, tailgating, and
loss of control modules emulate conditions that statistically prove to be harmful or fatal
to young drivers. These modules focus on proper behavioral and attitudinal responses.
To analyze the drivers’ skill sets, a sampling of three classes has been reviewed in a case
study. Two classes displayed a nearly proficient level of skill while the third group
showed a proficient driving level. The participants improved their knowledge as evident
by their pre and post test scores. The next step in the project is the collection, analysis,
and creation of a database as the classes are offered to more young drivers.
25
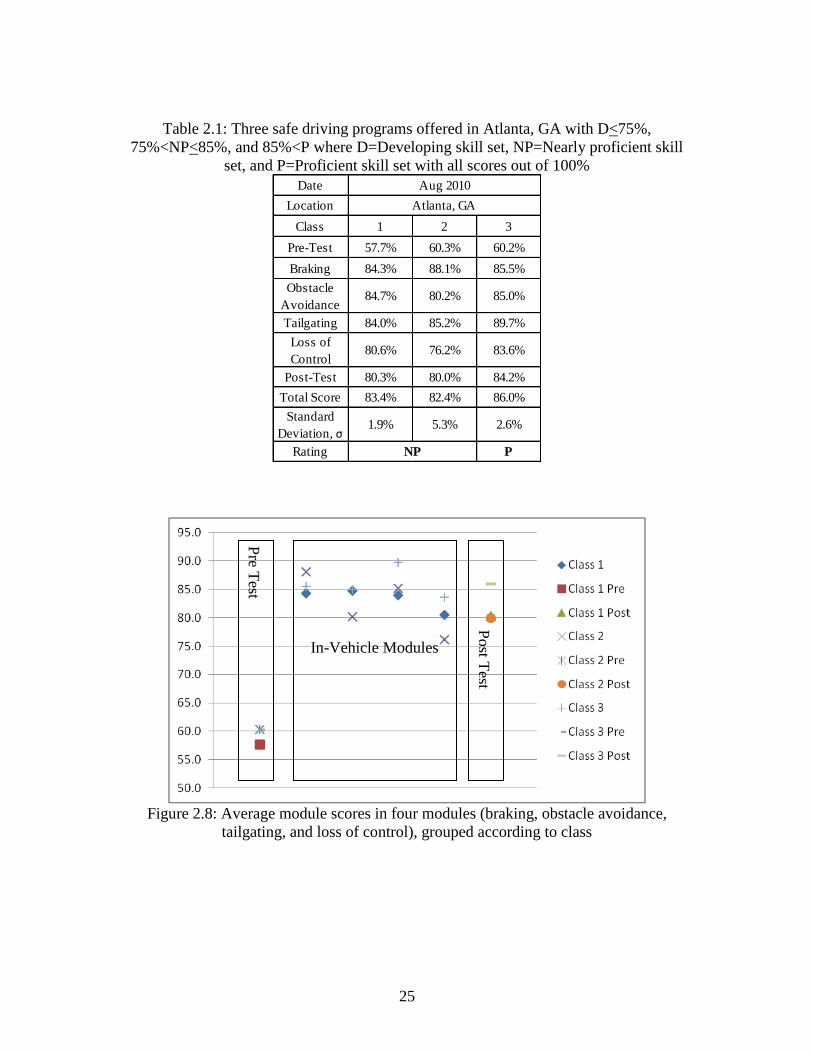
Table 2.1: Three safe driving programs offered in Atlanta, GA with D<75%,
75%<NP<85%, and 85%<P where D=Developing skill set, NP=Nearly proficient skill
set, and P=Proficient skill set with all scores out of 100%
Date
Location
Class 1 2 3
Pre-Test 57.7% 60.3% 60.2%
Braking 84.3% 88.1% 85.5%
Obstacle
Avoidance84.7% 80.2% 85.0%
Tailgating 84.0% 85.2% 89.7%
Loss of
Control80.6% 76.2% 83.6%
Post-Test 80.3% 80.0% 84.2%
Total Score 83.4% 82.4% 86.0%
Standard
Deviation, σ1.9% 5.3% 2.6%
Rating P
Aug 2010
NP
Atlanta, GA
Figure 2.8: Average module scores in four modules (braking, obstacle avoidance,
tailgating, and loss of control), grouped according to class
Pre T
est
In-Vehicle Modules
Post T
est
26
CHAPTER 3
FOCUSED NOVICE DRIVER PROGRAM -
ASSESSMENT RESULTS AND DISCUSSION
Each year, young drivers achieve state supervised licensure to operate a motor vehicle
(FHWA, 2012). The licensure process typically consists of a written, vehicle, and eye
test with or without a learner’s permit and driver’s education. Young drivers’ handling
capability and proper response to hazardous situations may not be at an acceptable level.
From 1994 to 2009, an average of 41,338 drivers per year from the 15-20 years old age
bracket were killed due to vehicular crashes in the United States (FARS, 2012). This
statistic is one contributing factor to an epidemic plaguing many developed countries:
vehicular fatalities have become the number one killer of drivers from 15-20 years old
(NHTSA, 2009). Current efforts to mitigate these vulnerabilities have not been fully
effective, as young drivers continue to be involved in accidents with high frequency
(Williams et al., 1996, CDC, 2012). Further, communities have failed to acknowledge
and/or implement the findings of these new studies in driver education programs (Lonero
et al., 2010). Consequently, studies seeking a foundation for new approaches to
providing young drivers with proper tools for safely managing highway dynamics have
become necessary.
Existing educational programs for young drivers have been ineffective, largely due to
extensive driving experience being delegated to personal exercises rather than instructor
observed activities (MacNeil, 2006, Simons-Morton et al., 2006). Widespread corporate
and individual opinion supports this argument, with popular belief that current driving
27
education infrastructures are not performing at an acceptable level (Bishop et al., 2005).
Recent attempts have been made to establish a standard measure of what driver education
programs should become (NHTSA, 2009). At Clemson University, research into an
improved safe driving program which addresses the shortcomings of current driver
education curriculums afford young motorists with attitudinal/behavioral training to
augment their ability to safely respond in dangerous instances (Jensen et al., 2011).
Additionally, the developed Clemson University/Richard Petty Driving Experience safe
driving program addresses parameters at the core of most accidents involving young
drivers while simultaneously providing in-vehicle experience. This is vital, as young
drivers generally lack sufficient operating experience and/or sensitivity to the dangers of
the road (McKnight, 2006). In this next generation program, the student’s in-vehicle
experience is comprised of four vehicular modules, described in Section 2. Student
comprehension of safe driving is evaluated using pre- and post- tests administered before
and after experiencing each module. Although this training system has demonstrated a
positive influence on young drivers, the establishment of a quantifiable assessment was
required. Researchers in Japan have shown that the driver’s risk factor may be
determinable from their acceleration patterns (Naito et al., 2009). A follow up study
ascertained the applicability of braking and steering patterns to describe a driver’s risk
factor (Miyajima et al., 2011). As a driver’s performance can be quantified through the
classification of vehicle operation variables, a supplemental assessment methodology was
designed for the safe driving program (Clark et al., 2012).
28
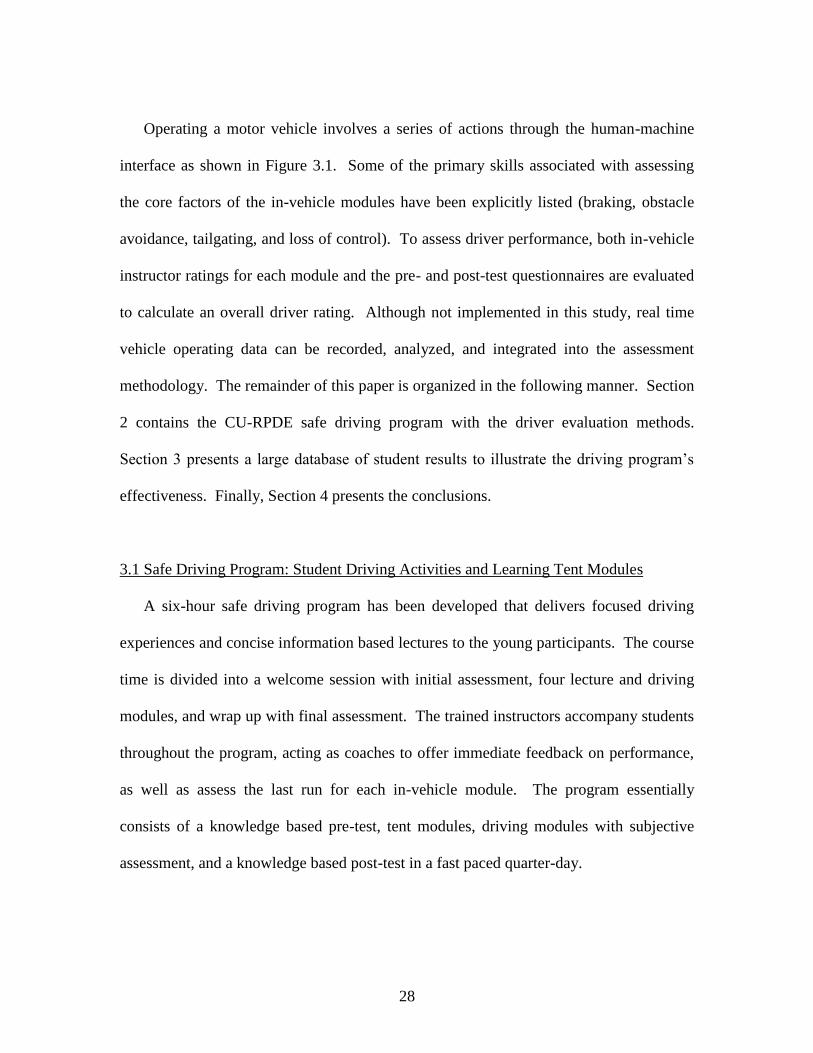
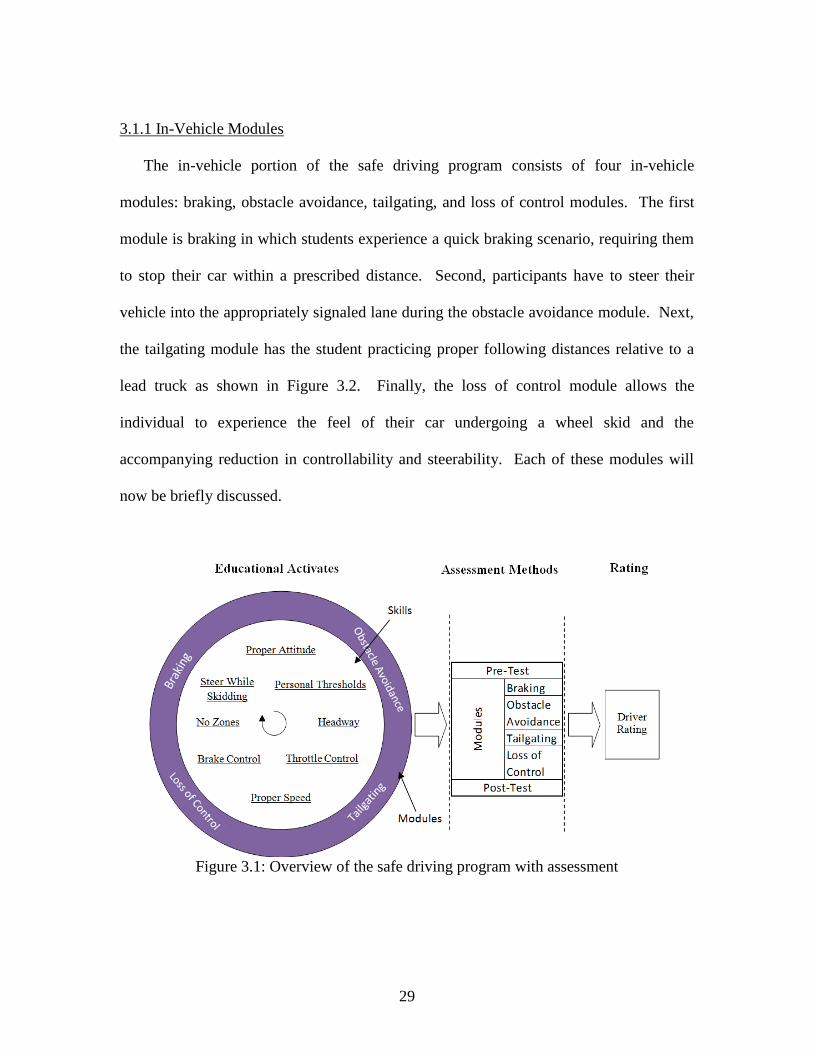
Operating a motor vehicle involves a series of actions through the human-machine
interface as shown in Figure 3.1. Some of the primary skills associated with assessing
the core factors of the in-vehicle modules have been explicitly listed (braking, obstacle
avoidance, tailgating, and loss of control). To assess driver performance, both in-vehicle
instructor ratings for each module and the pre- and post-test questionnaires are evaluated
to calculate an overall driver rating. Although not implemented in this study, real time
vehicle operating data can be recorded, analyzed, and integrated into the assessment
methodology. The remainder of this paper is organized in the following manner. Section
2 contains the CU-RPDE safe driving program with the driver evaluation methods.
Section 3 presents a large database of student results to illustrate the driving program’s
effectiveness. Finally, Section 4 presents the conclusions.
3.1 Safe Driving Program: Student Driving Activities and Learning Tent Modules
A six-hour safe driving program has been developed that delivers focused driving
experiences and concise information based lectures to the young participants. The course
time is divided into a welcome session with initial assessment, four lecture and driving
modules, and wrap up with final assessment. The trained instructors accompany students
throughout the program, acting as coaches to offer immediate feedback on performance,
as well as assess the last run for each in-vehicle module. The program essentially
consists of a knowledge based pre-test, tent modules, driving modules with subjective
assessment, and a knowledge based post-test in a fast paced quarter-day.
29
3.1.1 In-Vehicle Modules
The in-vehicle portion of the safe driving program consists of four in-vehicle
modules: braking, obstacle avoidance, tailgating, and loss of control modules. The first
module is braking in which students experience a quick braking scenario, requiring them
to stop their car within a prescribed distance. Second, participants have to steer their
vehicle into the appropriately signaled lane during the obstacle avoidance module. Next,
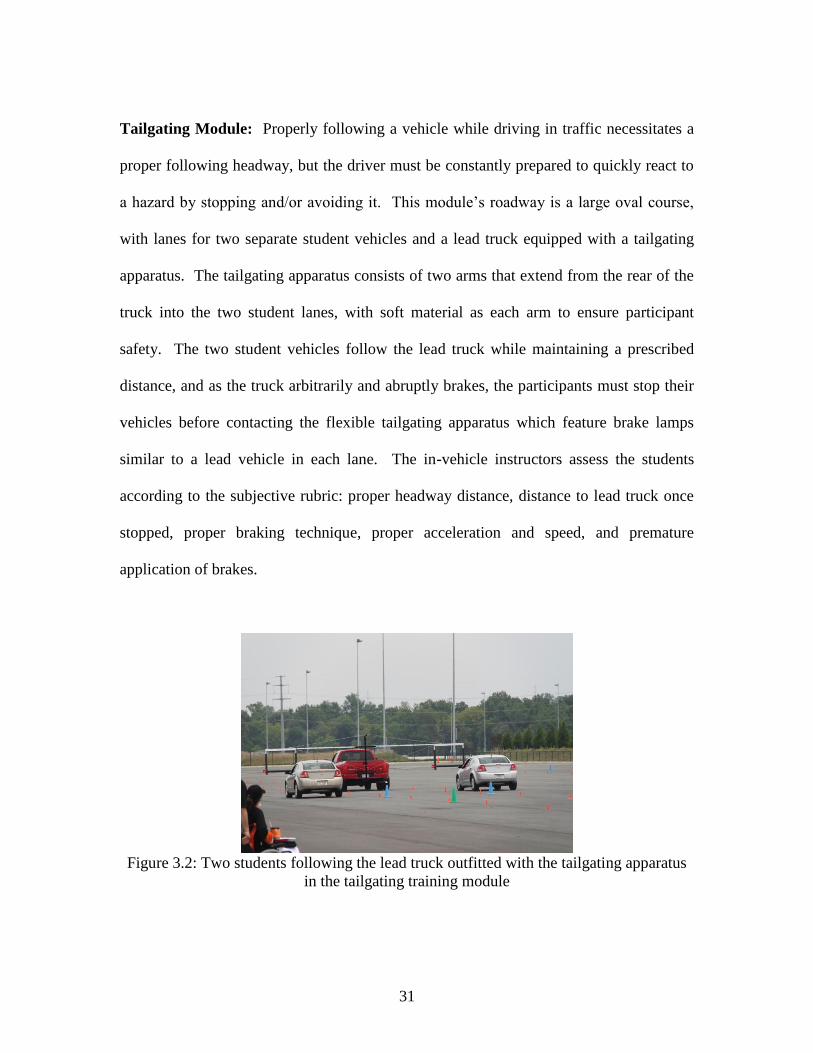
the tailgating module has the student practicing proper following distances relative to a
lead truck as shown in Figure 3.2. Finally, the loss of control module allows the
individual to experience the feel of their car undergoing a wheel skid and the
accompanying reduction in controllability and steerability. Each of these modules will
now be briefly discussed.
Figure 3.1: Overview of the safe driving program with assessment
30
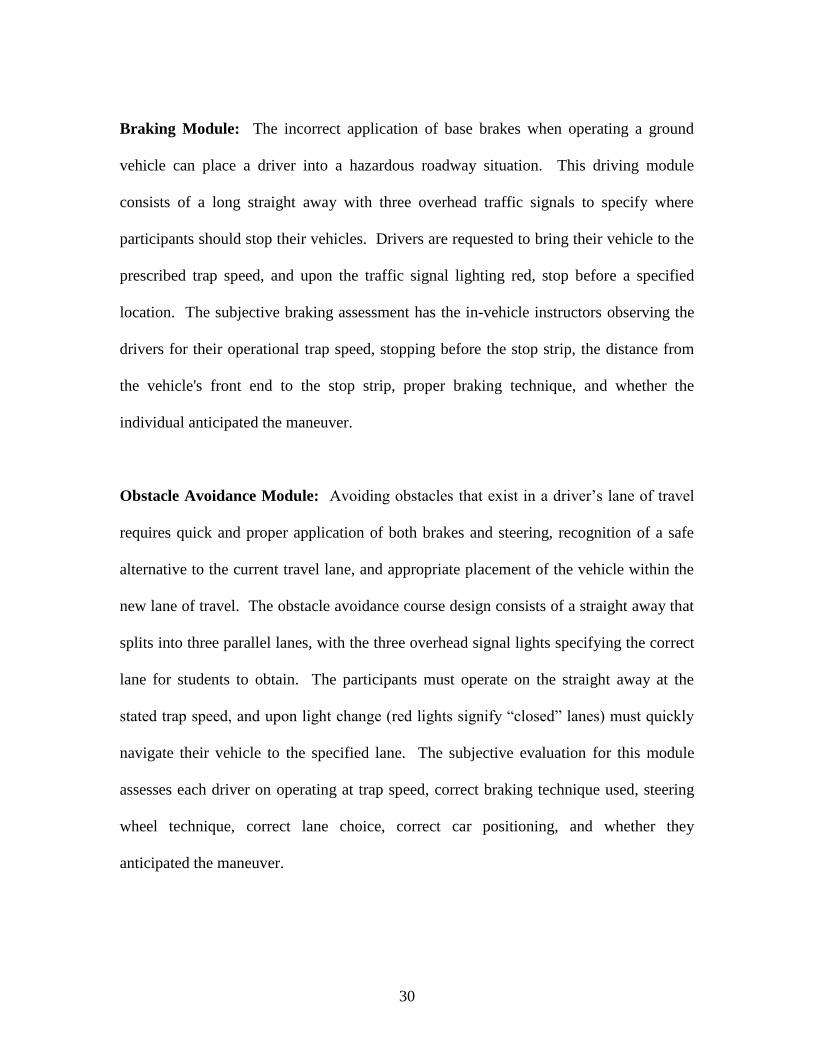
Braking Module: The incorrect application of base brakes when operating a ground
vehicle can place a driver into a hazardous roadway situation. This driving module
consists of a long straight away with three overhead traffic signals to specify where
participants should stop their vehicles. Drivers are requested to bring their vehicle to the
prescribed trap speed, and upon the traffic signal lighting red, stop before a specified
location. The subjective braking assessment has the in-vehicle instructors observing the
drivers for their operational trap speed, stopping before the stop strip, the distance from
the vehicle's front end to the stop strip, proper braking technique, and whether the
individual anticipated the maneuver.
Obstacle Avoidance Module: Avoiding obstacles that exist in a driver’s lane of travel
requires quick and proper application of both brakes and steering, recognition of a safe
alternative to the current travel lane, and appropriate placement of the vehicle within the
new lane of travel. The obstacle avoidance course design consists of a straight away that
splits into three parallel lanes, with the three overhead signal lights specifying the correct
lane for students to obtain. The participants must operate on the straight away at the
stated trap speed, and upon light change (red lights signify “closed” lanes) must quickly
navigate their vehicle to the specified lane. The subjective evaluation for this module
assesses each driver on operating at trap speed, correct braking technique used, steering
wheel technique, correct lane choice, correct car positioning, and whether they
anticipated the maneuver.
31
Tailgating Module: Properly following a vehicle while driving in traffic necessitates a
proper following headway, but the driver must be constantly prepared to quickly react to
a hazard by stopping and/or avoiding it. This module’s roadway is a large oval course,
with lanes for two separate student vehicles and a lead truck equipped with a tailgating
apparatus. The tailgating apparatus consists of two arms that extend from the rear of the
truck into the two student lanes, with soft material as each arm to ensure participant
safety. The two student vehicles follow the lead truck while maintaining a prescribed
distance, and as the truck arbitrarily and abruptly brakes, the participants must stop their
vehicles before contacting the flexible tailgating apparatus which feature brake lamps
similar to a lead vehicle in each lane. The in-vehicle instructors assess the students
according to the subjective rubric: proper headway distance, distance to lead truck once
stopped, proper braking technique, proper acceleration and speed, and premature
application of brakes.
Figure 3.2: Two students following the lead truck outfitted with the tailgating apparatus
in the tailgating training module
32
Loss of Control Module: The occurrence of a rear wheel or front wheel skid can be
hazardous for all drivers on degraded roadway surfaces, and requires the coordination of
the throttle, brake, and steering wheel to safely recover. This driving module consists of
a skid pad (80 foot diameter), and roadways featuring s-turns and water on various
surface locations. The students begin the exercise by engaging the skid pad and then
undergoing the s-turns, and experiencing alternating dry and wet surfaces. On the final
run, the subjective metric evaluates students on trap speed, proper positioning of vehicle,
adequate operating speed, correct technique, recognition of a front wheel skid and rear
wheel skid, appropriate line of sight, and anticipation of the necessary maneuvers.
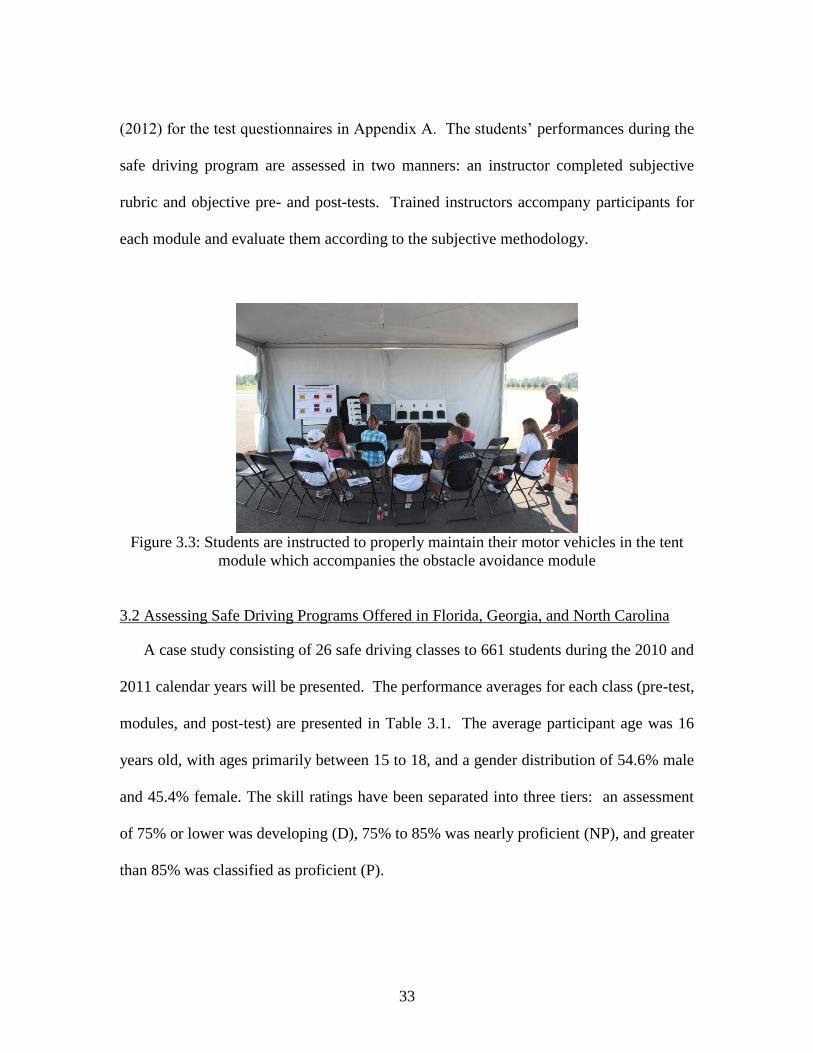
3.1.2 Tent Modules and Program Pre- and Post-Tests
Students are instructed on general vehicle maintenance and behavioral responses
when not driving the vehicles. A tent module accompanies each in-vehicle module, with
participants rotating between the driving and class room. These classroom lectures
supplement the in-vehicle experiences by emphasizing the importance of crucial driving
skills and proper behavior/attitude while driving. The tent modules also introduce
students to the topics of proper vehicle maintenance, no zones around large commercial
trucks, and the importance of seat belts, as shown in Figure 3.3. Student knowledge is
assessed before and after the safe driving program by pre-test and post-test examinations.
These multiple choice quizzes are similar, acting to capture the behavior and knowledge
pool of participants prior to the safe driving program while measuring the attitudinal
response and knowledge gained at the conclusion of the program. Refer to Clark et al.
33
(2012) for the test questionnaires in Appendix A. The students’ performances during the
safe driving program are assessed in two manners: an instructor completed subjective
rubric and objective pre- and post-tests. Trained instructors accompany participants for
each module and evaluate them according to the subjective methodology.
Figure 3.3: Students are instructed to properly maintain their motor vehicles in the tent
module which accompanies the obstacle avoidance module
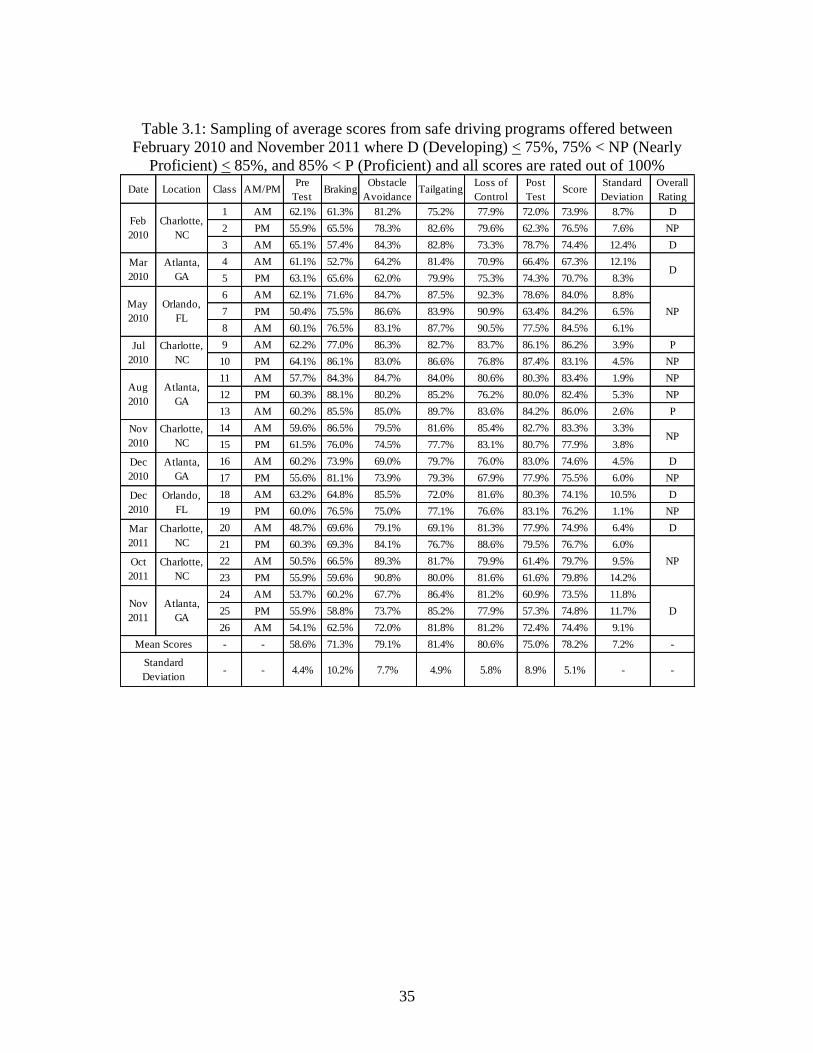
3.2 Assessing Safe Driving Programs Offered in Florida, Georgia, and North Carolina
A case study consisting of 26 safe driving classes to 661 students during the 2010 and
2011 calendar years will be presented. The performance averages for each class (pre-test,
modules, and post-test) are presented in Table 3.1. The average participant age was 16
years old, with ages primarily between 15 to 18, and a gender distribution of 54.6% male
and 45.4% female. The skill ratings have been separated into three tiers: an assessment
of 75% or lower was developing (D), 75% to 85% was nearly proficient (NP), and greater
than 85% was classified as proficient (P).
34
The participants were assessed on pre-test questionnaires, four in-vehicle modules,
and post- test questionnaires. The in-vehicle subjective evaluation by the instructors will
be discussed first followed by the two objective test measures. The braking module
results show that fourteen classes were rated as developing, eight were nearly proficient,
and the remaining four were proficient. An average score, , of 71.3% was
realized for this module, a developing skills grade, with a standard deviation,
, of 10.2%. For the obstacle avoidance module, eight classes operated
at a developing skill level, twelve displayed a nearly proficient capability, and six
demonstrated a proficient threshold. The students achieved an average score of 79.1%
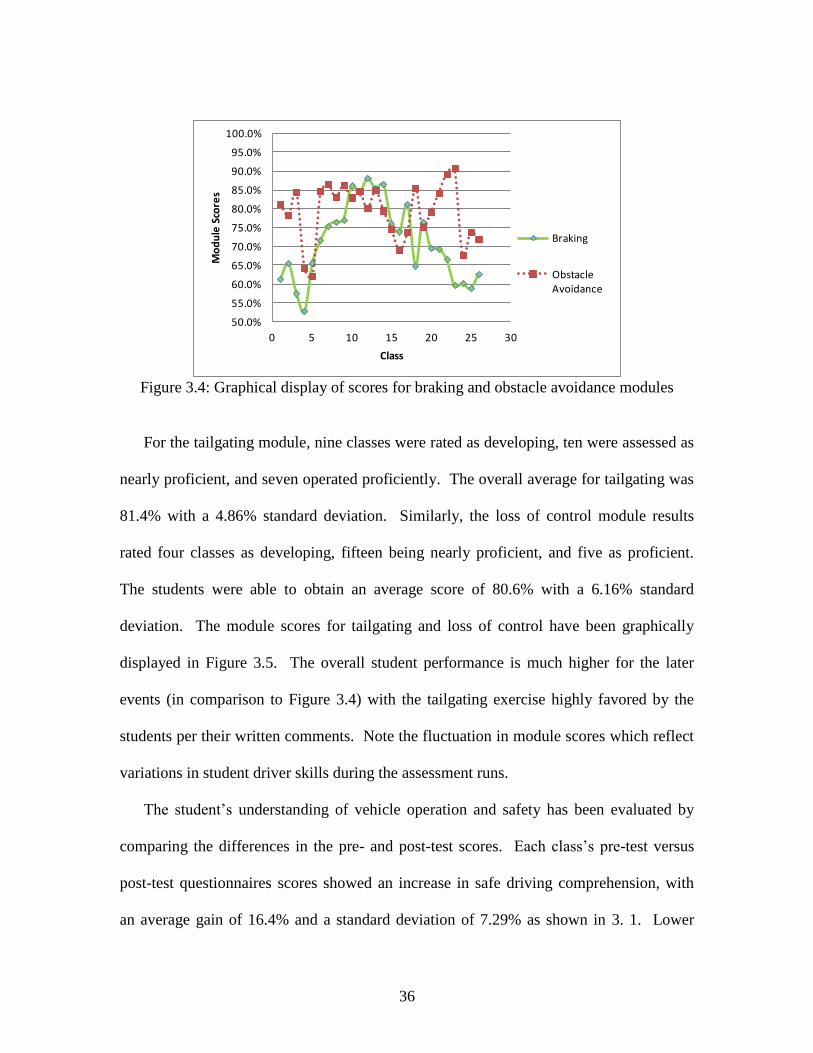
with a 7.67% standard deviation. As shown in Figure 3.4, the brake module scores were
generally lower than the obstacle avoidance exercise, which can be partially attributed to
its placements as the first driving skill. Further, the students must learn how to
effectively brake their vehicle which is not an everyday occurrence given that light
braking is typical on most roadways.
35
Table 3.1: Sampling of average scores from safe driving programs offered between
February 2010 and November 2011 where D (Developing) < 75%, 75% < NP (Nearly
Proficient) < 85%, and 85% < P (Proficient) and all scores are rated out of 100%
Date Location Class AM/PMPre
TestBraking
Obstacle
AvoidanceTailgating
Loss of
Control
Post
TestScore
Standard
Deviation
Overall
Rating
1 AM 62.1% 61.3% 81.2% 75.2% 77.9% 72.0% 73.9% 8.7% D
2 PM 55.9% 65.5% 78.3% 82.6% 79.6% 62.3% 76.5% 7.6% NP
3 AM 65.1% 57.4% 84.3% 82.8% 73.3% 78.7% 74.4% 12.4% D
4 AM 61.1% 52.7% 64.2% 81.4% 70.9% 66.4% 67.3% 12.1%
5 PM 63.1% 65.6% 62.0% 79.9% 75.3% 74.3% 70.7% 8.3%
6 AM 62.1% 71.6% 84.7% 87.5% 92.3% 78.6% 84.0% 8.8%
7 PM 50.4% 75.5% 86.6% 83.9% 90.9% 63.4% 84.2% 6.5%
8 AM 60.1% 76.5% 83.1% 87.7% 90.5% 77.5% 84.5% 6.1%
9 AM 62.2% 77.0% 86.3% 82.7% 83.7% 86.1% 86.2% 3.9% P
10 PM 64.1% 86.1% 83.0% 86.6% 76.8% 87.4% 83.1% 4.5% NP
11 AM 57.7% 84.3% 84.7% 84.0% 80.6% 80.3% 83.4% 1.9% NP
12 PM 60.3% 88.1% 80.2% 85.2% 76.2% 80.0% 82.4% 5.3% NP
13 AM 60.2% 85.5% 85.0% 89.7% 83.6% 84.2% 86.0% 2.6% P
14 AM 59.6% 86.5% 79.5% 81.6% 85.4% 82.7% 83.3% 3.3%
15 PM 61.5% 76.0% 74.5% 77.7% 83.1% 80.7% 77.9% 3.8%
16 AM 60.2% 73.9% 69.0% 79.7% 76.0% 83.0% 74.6% 4.5% D
17 PM 55.6% 81.1% 73.9% 79.3% 67.9% 77.9% 75.5% 6.0% NP
18 AM 63.2% 64.8% 85.5% 72.0% 81.6% 80.3% 74.1% 10.5% D
19 PM 60.0% 76.5% 75.0% 77.1% 76.6% 83.1% 76.2% 1.1% NP
20 AM 48.7% 69.6% 79.1% 69.1% 81.3% 77.9% 74.9% 6.4% D
21 PM 60.3% 69.3% 84.1% 76.7% 88.6% 79.5% 76.7% 6.0%
22 AM 50.5% 66.5% 89.3% 81.7% 79.9% 61.4% 79.7% 9.5%
23 PM 55.9% 59.6% 90.8% 80.0% 81.6% 61.6% 79.8% 14.2%
24 AM 53.7% 60.2% 67.7% 86.4% 81.2% 60.9% 73.5% 11.8%
25 PM 55.9% 58.8% 73.7% 85.2% 77.9% 57.3% 74.8% 11.7%
26 AM 54.1% 62.5% 72.0% 81.8% 81.2% 72.4% 74.4% 9.1%
- - 58.6% 71.3% 79.1% 81.4% 80.6% 75.0% 78.2% 7.2% -
- - 4.4% 10.2% 7.7% 4.9% 5.8% 8.9% 5.1% - -
Feb
2010
Charlotte,
NC
Mar
2010
Atlanta,
GAD
May
2010
Orlando,
FLNP
Jul
2010
Charlotte,
NC
Aug
2010
Atlanta,
GA
Nov
2010
Charlotte,
NCNP
Dec
2010
Atlanta,
GA
Dec
2010
Orlando,
FL
Mean Scores
Standard
Deviation
NPOct
2011
Charlotte,
NC
Nov
2011
Atlanta,
GAD
Mar
2011
Charlotte,
NC
36
50.0%
55.0%
60.0%
65.0%
70.0%
75.0%
80.0%
85.0%
90.0%
95.0%
100.0%
0 5 10 15 20 25 30
Mo
du
le S
core
s
Class
Braking
Obstacle Avoidance
Figure 3.4: Graphical display of scores for braking and obstacle avoidance modules
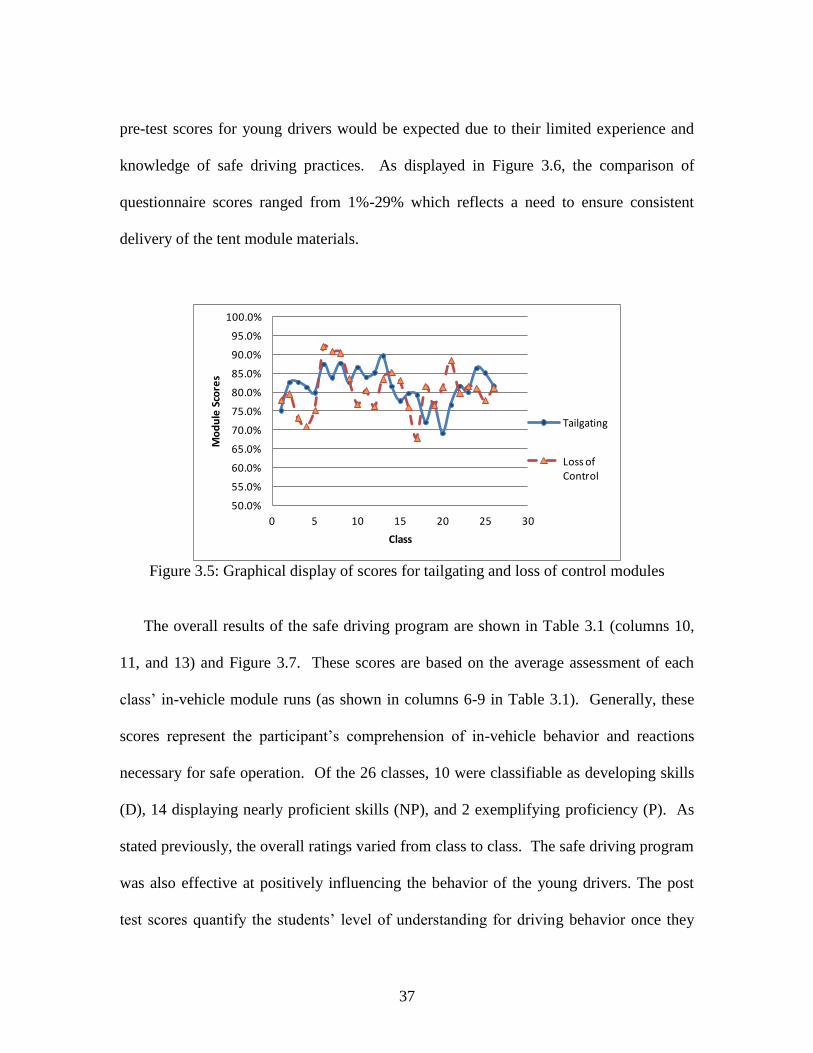
For the tailgating module, nine classes were rated as developing, ten were assessed as
nearly proficient, and seven operated proficiently. The overall average for tailgating was
81.4% with a 4.86% standard deviation. Similarly, the loss of control module results
rated four classes as developing, fifteen being nearly proficient, and five as proficient.
The students were able to obtain an average score of 80.6% with a 6.16% standard
deviation. The module scores for tailgating and loss of control have been graphically
displayed in Figure 3.5. The overall student performance is much higher for the later
events (in comparison to Figure 3.4) with the tailgating exercise highly favored by the
students per their written comments. Note the fluctuation in module scores which reflect
variations in student driver skills during the assessment runs.
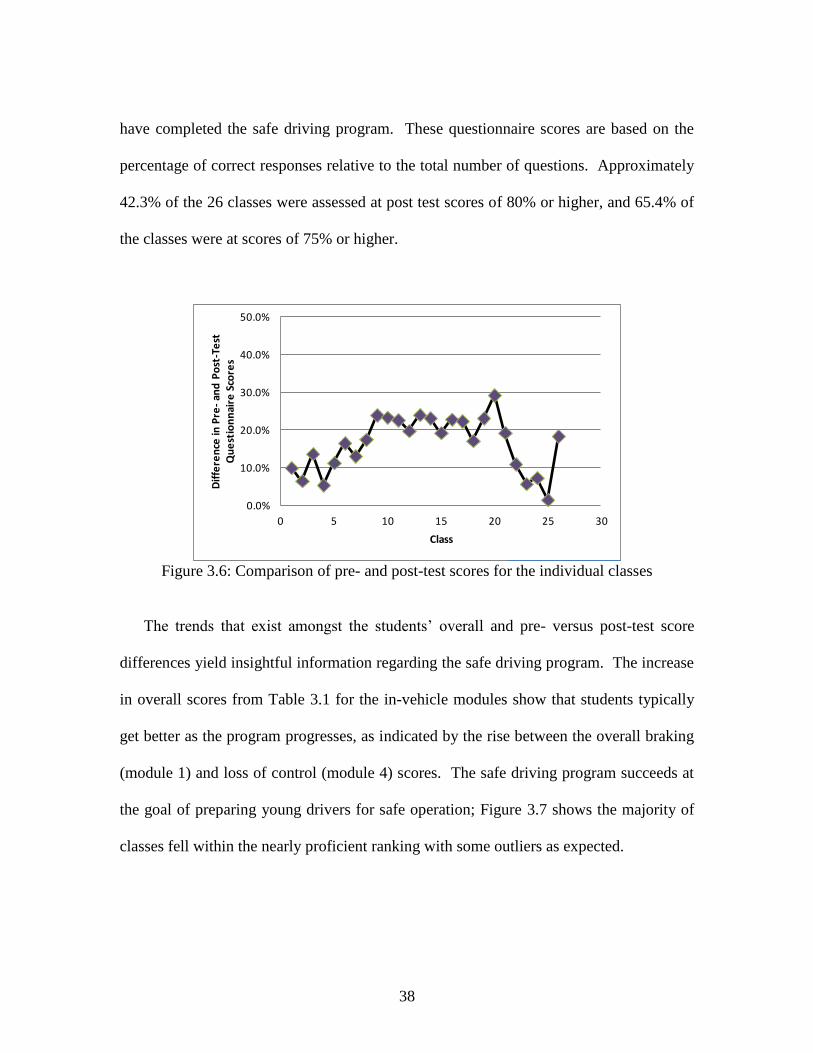
The student’s understanding of vehicle operation and safety has been evaluated by
comparing the differences in the pre- and post-test scores. Each class’s pre-test versus
post-test questionnaires scores showed an increase in safe driving comprehension, with
an average gain of 16.4% and a standard deviation of 7.29% as shown in 3. 1. Lower
37
pre-test scores for young drivers would be expected due to their limited experience and
knowledge of safe driving practices. As displayed in Figure 3.6, the comparison of
questionnaire scores ranged from 1%-29% which reflects a need to ensure consistent
delivery of the tent module materials.
50.0%
55.0%
60.0%
65.0%
70.0%
75.0%
80.0%
85.0%
90.0%
95.0%
100.0%
0 5 10 15 20 25 30
Mo
du
le S
core
s
Class
Tailgating
Loss of Control
Figure 3.5: Graphical display of scores for tailgating and loss of control modules
The overall results of the safe driving program are shown in Table 3.1 (columns 10,
11, and 13) and Figure 3.7. These scores are based on the average assessment of each
class’ in-vehicle module runs (as shown in columns 6-9 in Table 3.1). Generally, these
scores represent the participant’s comprehension of in-vehicle behavior and reactions
necessary for safe operation. Of the 26 classes, 10 were classifiable as developing skills
(D), 14 displaying nearly proficient skills (NP), and 2 exemplifying proficiency (P). As
stated previously, the overall ratings varied from class to class. The safe driving program
was also effective at positively influencing the behavior of the young drivers. The post
test scores quantify the students’ level of understanding for driving behavior once they
38
have completed the safe driving program. These questionnaire scores are based on the
percentage of correct responses relative to the total number of questions. Approximately
42.3% of the 26 classes were assessed at post test scores of 80% or higher, and 65.4% of
the classes were at scores of 75% or higher.
0.0%
10.0%
20.0%
30.0%
40.0%
50.0%
0 5 10 15 20 25 30
Dif
fere
nce
in P
re-
and
Po
st-T
est
Q
ue
stio
nn
aire
Sco
res
Class
Figure 3.6: Comparison of pre- and post-test scores for the individual classes
The trends that exist amongst the students’ overall and pre- versus post-test score
differences yield insightful information regarding the safe driving program. The increase
in overall scores from Table 3.1 for the in-vehicle modules show that students typically
get better as the program progresses, as indicated by the rise between the overall braking
(module 1) and loss of control (module 4) scores. The safe driving program succeeds at
the goal of preparing young drivers for safe operation; Figure 3.7 shows the majority of
classes fell within the nearly proficient ranking with some outliers as expected.
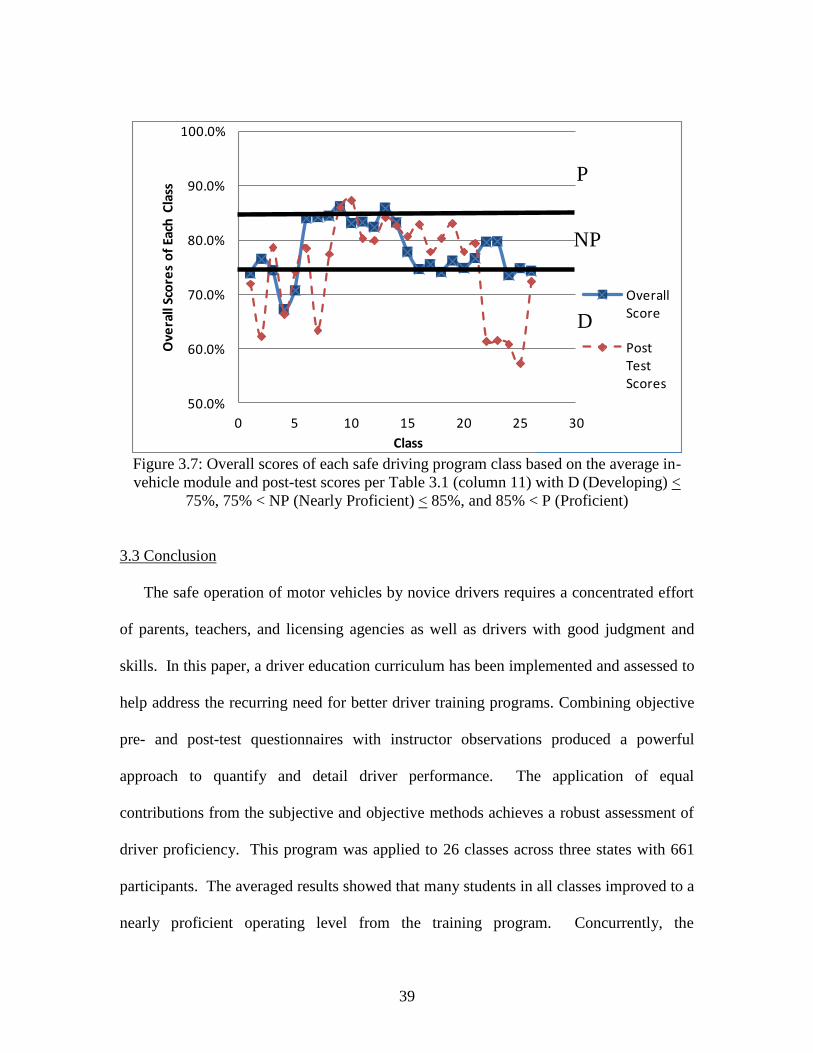
39
50.0%
60.0%
70.0%
80.0%
90.0%
100.0%
0 5 10 15 20 25 30
Ove
rall
Sco
res
of
Each
Cla
ss
Class
Overall Score
Post Test Scores
D
NP
P
Figure 3.7: Overall scores of each safe driving program class based on the average in-
vehicle module and post-test scores per Table 3.1 (column 11) with D (Developing) <
75%, 75% < NP (Nearly Proficient) < 85%, and 85% < P (Proficient)
3.3 Conclusion
The safe operation of motor vehicles by novice drivers requires a concentrated effort
of parents, teachers, and licensing agencies as well as drivers with good judgment and
skills. In this paper, a driver education curriculum has been implemented and assessed to
help address the recurring need for better driver training programs. Combining objective
pre- and post-test questionnaires with instructor observations produced a powerful
approach to quantify and detail driver performance. The application of equal
contributions from the subjective and objective methods achieves a robust assessment of
driver proficiency. This program was applied to 26 classes across three states with 661
participants. The averaged results showed that many students in all classes improved to a
nearly proficient operating level from the training program. Concurrently, the

40
effectiveness of the safe driving program is confirmed by the significant increase of post-
test scores relative to pre-test performances.
41
CHAPTER 4
A SMART JERSEY HIGHWAY BARRIER WITH PORTAL FOR SMALL ANIMAL
PASSAGE AND DRIVER ALERT
Modern transportation systems have facilitated societal transformations around
the world during the past century. However, mobility advancements have tradeoffs which
must be evaluated in terms of vehicle occupant and pedestrian safety, wildlife impact,
environmental damage, and economic cost. Vehicles offer personal mobility solutions but
they also precipitate vehicular accidents involving drivers, passengers, pedestrians, and/or
animals on a frequent basis. The introduction of multiple lane roadways which feature
concrete center barriers to protect vehicles from traffic cross-over collisions may
unfortunately result in a rise in animal fatalities. While these roads allow for
significantly higher travel speeds and reduced risk of head on accidents, the impact on the
local wildlife community may be considerable. For instance, animals may find their way
onto these roads when attempting to cross through the continuous concrete wall and
become trapped since they cannot readily find egress. Eventually the animals die when
hit by a vehicle or safely return to the roadway’s shoulder and surrounding vegetation.
To alleviate the frequency of these animal-to-vehicle collisions on roadways with solid
barriers, an alteration to the current barrier design may prove fruitful. It should be noted
that traffic engineers would likely prefer to eliminate the presence of animals from the
roadway altogether through the construction of fences parallel to the road. Although a
valid solution, the cost (initial construction and on-going maintenance) may prove to be
burdensome for the responsible agencies.
42
Current roadway barriers attempt to protect motorists from deadly head on
vehicular collisions. While guarding drivers and passengers from these accidents, it also
creates an obstacle that animals cannot likely overcome due to their lower cognitive
abilities. An altered barrier design could maintain vehicle safety and offer safe passage
for many animals on the roadway. One such traffic device reimaging exercise yields an
intelligent Jersey style barrier (an ordinary Jersey barrier has been shown in Figure 4.2b),
named the Clemson smart portal (CSP) with the general concept displayed in Figure 4.1.
This barrier may be implemented as a divider between traffic flow and simultaneously
allow animal egress across the roadway through the small oval opening at the base. These
barriers may be placed at approximately half mile intervals along the highway. In
addition, the barrier will alert drivers to an animal’s passage by visual notification using
flashing lamps; the light color can be selected using tinted hard plastic lens based on the
traffic engineer’s preference. The system functionality also facilitates the observation of
the animal types utilizing the portal, the number of animal crossings, and the roadway
conditions. Finally, signs would need to be erected at the start of the given road section
to alert drivers to the barriers and potential animal crossings.
The remainder of this paper is organized as follows. Section 2 discusses the types
of roadway barriers currently in use throughout North America. Section 3 presents the
overall design concept for the smart barrier including structural and electrical issues.
Schematics are introduced for the geometric dimensions and self-contained electronics
package. Section 4 contains a case study in which laboratory tests have been conducted
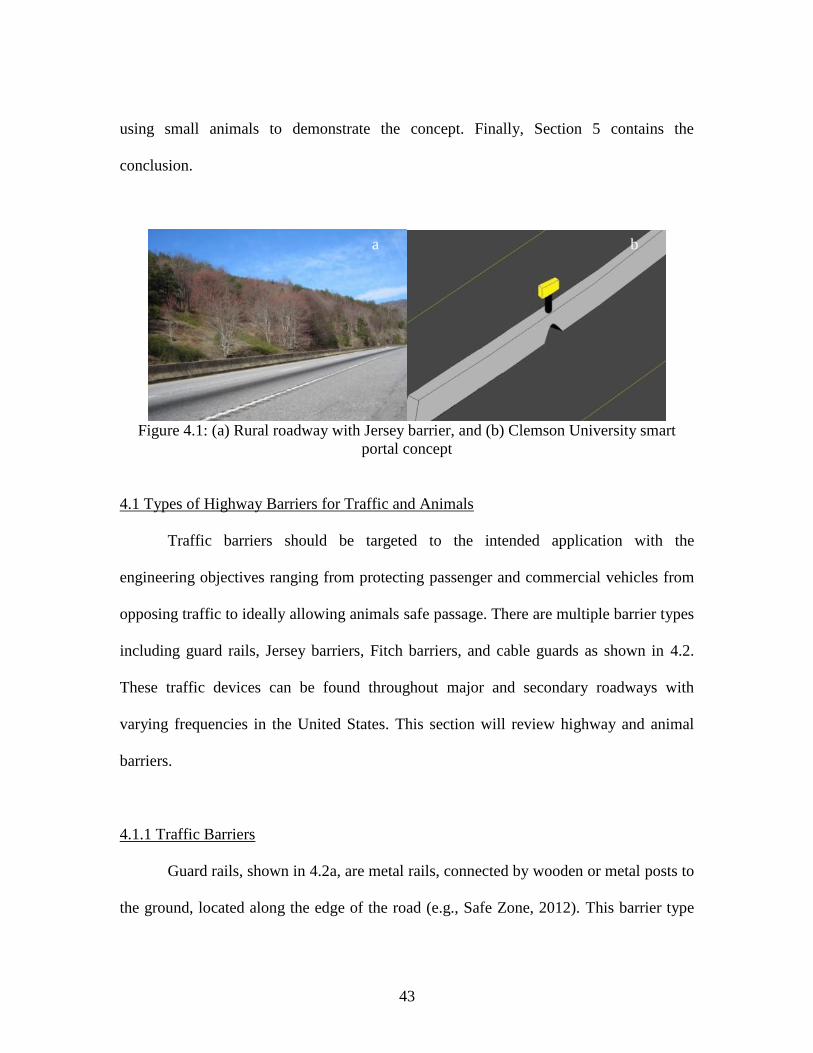
43
using small animals to demonstrate the concept. Finally, Section 5 contains the
conclusion.
Figure 4.1: (a) Rural roadway with Jersey barrier, and (b) Clemson University smart
portal concept
4.1 Types of Highway Barriers for Traffic and Animals
Traffic barriers should be targeted to the intended application with the
engineering objectives ranging from protecting passenger and commercial vehicles from
opposing traffic to ideally allowing animals safe passage. There are multiple barrier types
including guard rails, Jersey barriers, Fitch barriers, and cable guards as shown in 4.2.
These traffic devices can be found throughout major and secondary roadways with
varying frequencies in the United States. This section will review highway and animal
barriers.
4.1.1 Traffic Barriers
Guard rails, shown in 4.2a, are metal rails, connected by wooden or metal posts to
the ground, located along the edge of the road (e.g., Safe Zone, 2012). This barrier type
a b
44
redirects a vehicle back onto the roadway if a car or truck comes into contact with it. The
rails are usually designed to absorb some impact energy through deformation which often
“mangles” the original metal shape. However, standard guard rails may be too low in
height to effectively accommodate collisions with larger vehicles. A European
reimagining of the guard rail has been proposed to address collisions of both regular and
large sized vehicles (MAXI-RAIL, 2012). This guard rail design has been designated as a
“Super Rail” due to its larger than normal size. Jersey barriers, shown in Figure 4.2b, are
much like a wall, typically made of steel reinforced concrete, and act as a traffic divider
(ACI, 2012). A Jersey barrier’s structure limits a vehicle’s lateral movement to minimize
damage to the vehicle itself and prevent traffic cross-overs. The innovative smart barrier
is a modified version of a Jersey barrier.
Fitch barriers are plastic barrels filled with either water or sand as shown in
Figure 4.2c (Enterprise Flasher, 2012). They are organized with increasing sand/water
volumes so that the smallest volume barrel is positioned in the anticipated direction of the
collision. Accordingly, drivers would initially experience a lower resistance force upon
collision as the first barrier fails due to impact. The vehicle’s energy is partially
dissipated by the given barrel rupturing and releasing its contents. The subsequent barrels
that the driver then contacts will contain higher volumes of sand/water than the previous
ones allowing for more energy to be dissipated. This roadway safety approach produces
a lower initial resistance, which helps to reduce/prevent injuries to the occupants, which
then gradually offers greater resistance until the vehicle has come to a complete stop.
Cable guards, shown in Figure 4.2d, utilize steel cables held in place by metal posts to
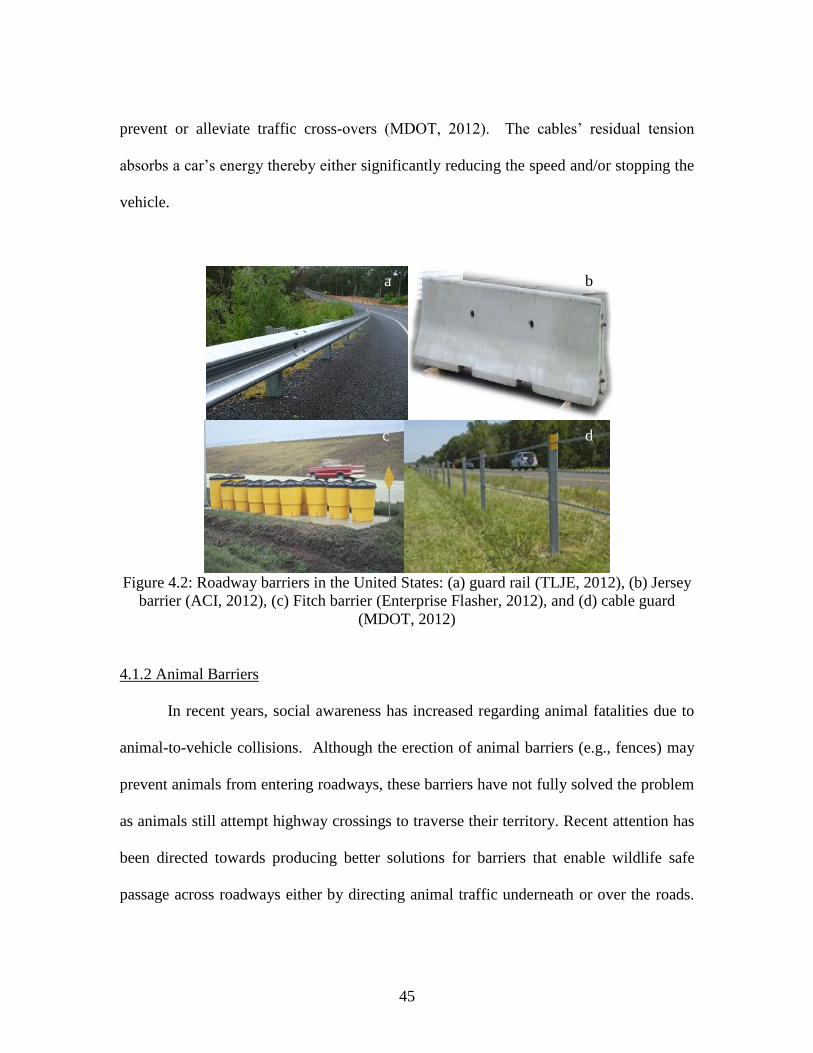
45
prevent or alleviate traffic cross-overs (MDOT, 2012). The cables’ residual tension
absorbs a car’s energy thereby either significantly reducing the speed and/or stopping the
vehicle.
Figure 4.2: Roadway barriers in the United States: (a) guard rail (TLJE, 2012), (b) Jersey
barrier (ACI, 2012), (c) Fitch barrier (Enterprise Flasher, 2012), and (d) cable guard
(MDOT, 2012)
4.1.2 Animal Barriers
In recent years, social awareness has increased regarding animal fatalities due to
animal-to-vehicle collisions. Although the erection of animal barriers (e.g., fences) may
prevent animals from entering roadways, these barriers have not fully solved the problem
as animals still attempt highway crossings to traverse their territory. Recent attention has
been directed towards producing better solutions for barriers that enable wildlife safe
passage across roadways either by directing animal traffic underneath or over the roads.
a b
c d
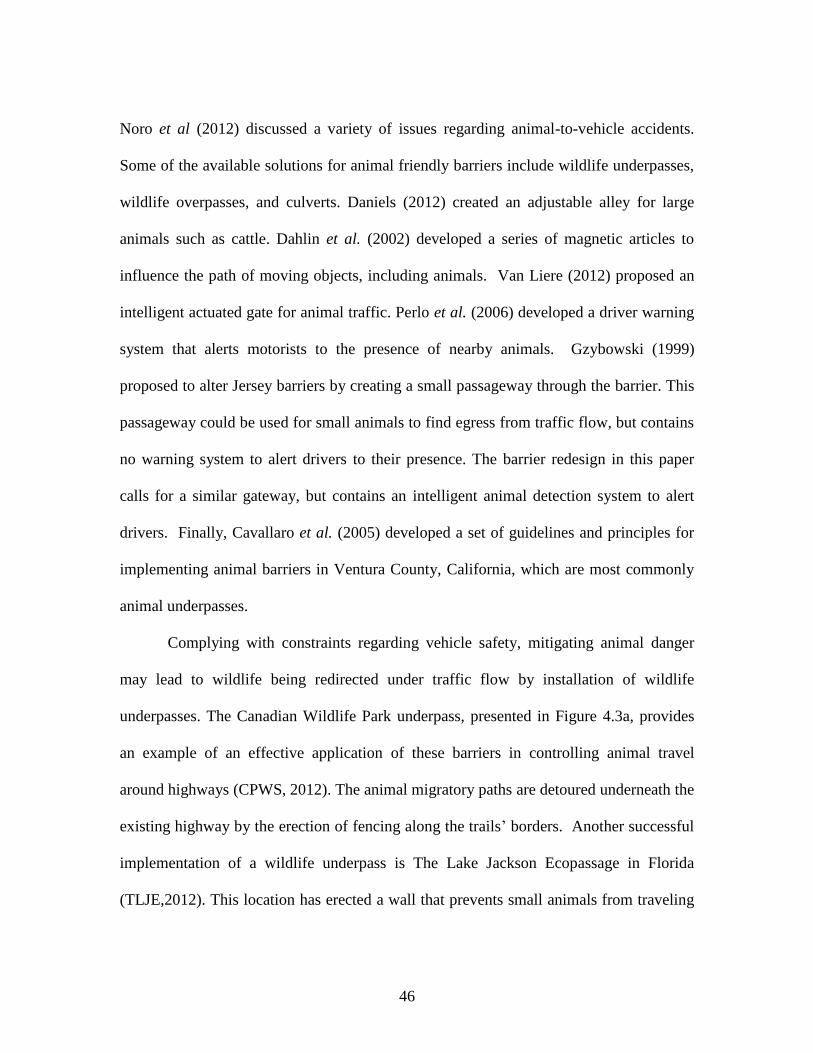
46
Noro et al (2012) discussed a variety of issues regarding animal-to-vehicle accidents.
Some of the available solutions for animal friendly barriers include wildlife underpasses,
wildlife overpasses, and culverts. Daniels (2012) created an adjustable alley for large
animals such as cattle. Dahlin et al. (2002) developed a series of magnetic articles to
influence the path of moving objects, including animals. Van Liere (2012) proposed an
intelligent actuated gate for animal traffic. Perlo et al. (2006) developed a driver warning
system that alerts motorists to the presence of nearby animals. Gzybowski (1999)
proposed to alter Jersey barriers by creating a small passageway through the barrier. This
passageway could be used for small animals to find egress from traffic flow, but contains
no warning system to alert drivers to their presence. The barrier redesign in this paper
calls for a similar gateway, but contains an intelligent animal detection system to alert
drivers. Finally, Cavallaro et al. (2005) developed a set of guidelines and principles for
implementing animal barriers in Ventura County, California, which are most commonly
animal underpasses.
Complying with constraints regarding vehicle safety, mitigating animal danger
may lead to wildlife being redirected under traffic flow by installation of wildlife
underpasses. The Canadian Wildlife Park underpass, presented in Figure 4.3a, provides
an example of an effective application of these barriers in controlling animal travel
around highways (CPWS, 2012). The animal migratory paths are detoured underneath the
existing highway by the erection of fencing along the trails’ borders. Another successful
implementation of a wildlife underpass is The Lake Jackson Ecopassage in Florida
(TLJE,2012). This location has erected a wall that prevents small animals from traveling
47
onto the road and forces them to use an open path leading under the flow of traffic.
Figure 4.3b displays the Payne’s Prairie Ecopassage wildlife underpass (USGS, 2012).
All three wildlife underpass examples have proven the design to be plausible.
When it is not possible to divert animal travel underneath existing transportation
infrastructure, it may be acceptable to provide an animal-only conduit by employing a
wildlife overpass or a covert. A wildlife overpass serves the same functionality as a
wildlife underpass, but directs animals above vehicular traffic by application of an
overhead pathway. Figure 4.3c illustrates an implementation of the wildlife overpass
using a tunnel like structure for vehicular travel and backfill for animal travel to bypass
the road. The US Highway 93 wildlife overpass (Wells, Nevada) completed in Summer
2010 has shown that while this approach can prove costly it can be effective in offering
animals with an alternate path (Elko Daily, 2012). If cost is a primary constraint, then
wildlife culverts may be considered. For example, a drainage duct typifies a culvert’s
multi-functional potential as it channels water runoff and simultaneously provides a route
for animal travel. The Parks of Canada have begun in recent years to apply wildlife
culverts, among other infrastructures, in hopes of reducing wildlife-to-vehicle collisions
and improving vehicle safety (Parks Canada, 2012).
All of these infrastructures are typically located in remote locations, or along
roadways, that cut through heavy animal migratory paths and/or animal colonies.
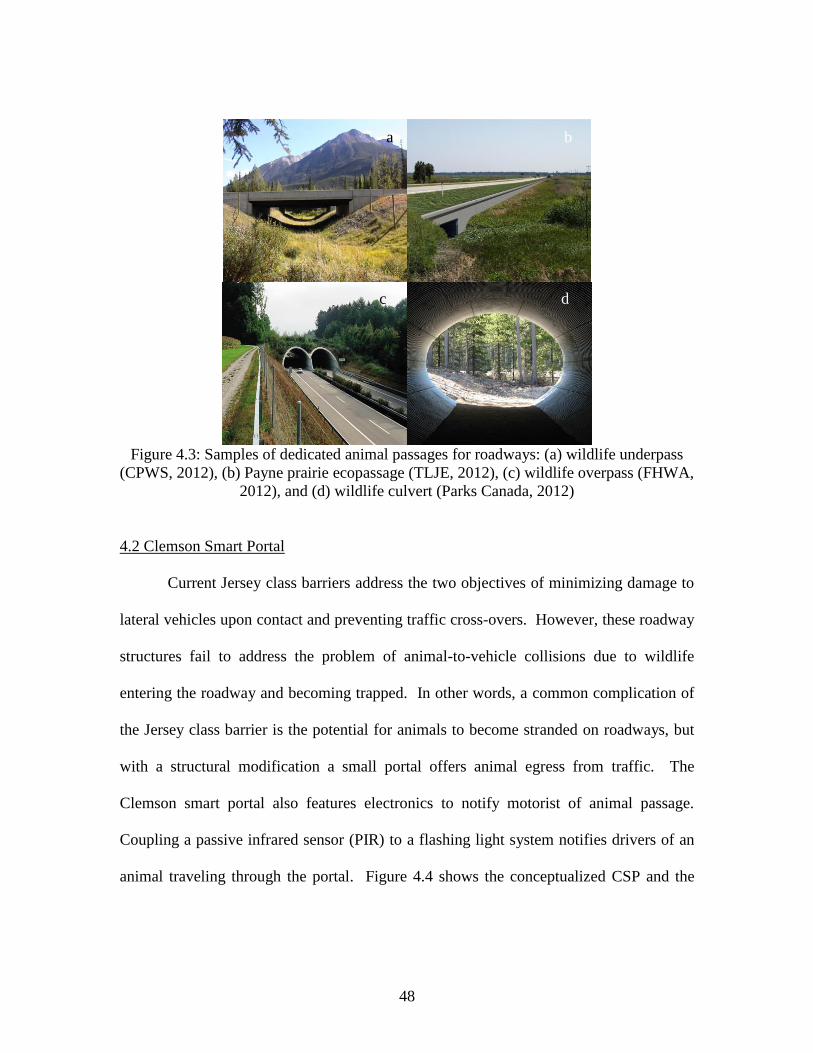
48
Figure 4.3: Samples of dedicated animal passages for roadways: (a) wildlife underpass
(CPWS, 2012), (b) Payne prairie ecopassage (TLJE, 2012), (c) wildlife overpass (FHWA,
2012), and (d) wildlife culvert (Parks Canada, 2012)
4.2 Clemson Smart Portal
Current Jersey class barriers address the two objectives of minimizing damage to
lateral vehicles upon contact and preventing traffic cross-overs. However, these roadway
structures fail to address the problem of animal-to-vehicle collisions due to wildlife
entering the roadway and becoming trapped. In other words, a common complication of
the Jersey class barrier is the potential for animals to become stranded on roadways, but
with a structural modification a small portal offers animal egress from traffic. The
Clemson smart portal also features electronics to notify motorist of animal passage.
Coupling a passive infrared sensor (PIR) to a flashing light system notifies drivers of an
animal traveling through the portal. Figure 4.4 shows the conceptualized CSP and the
c d
a b
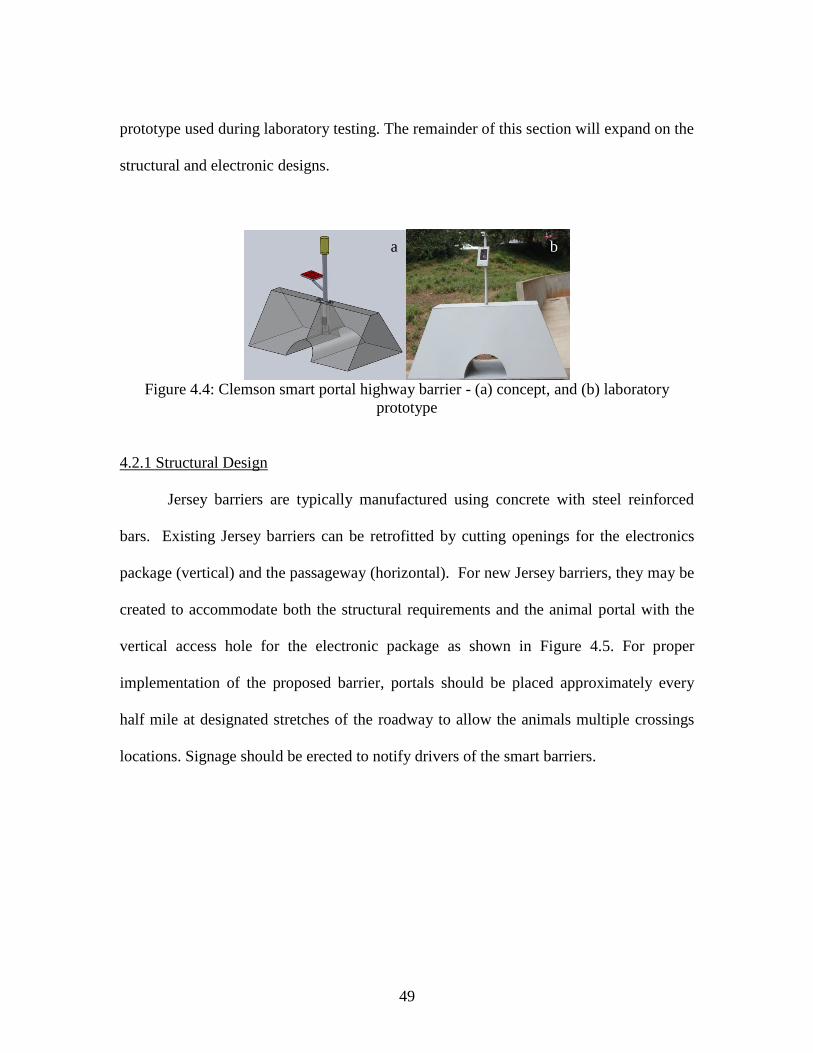
49
prototype used during laboratory testing. The remainder of this section will expand on the
structural and electronic designs.
Figure 4.4: Clemson smart portal highway barrier - (a) concept, and (b) laboratory
prototype
4.2.1 Structural Design
Jersey barriers are typically manufactured using concrete with steel reinforced
bars. Existing Jersey barriers can be retrofitted by cutting openings for the electronics
package (vertical) and the passageway (horizontal). For new Jersey barriers, they may be
created to accommodate both the structural requirements and the animal portal with the
vertical access hole for the electronic package as shown in Figure 4.5. For proper
implementation of the proposed barrier, portals should be placed approximately every
half mile at designated stretches of the roadway to allow the animals multiple crossings
locations. Signage should be erected to notify drivers of the smart barriers.
a b
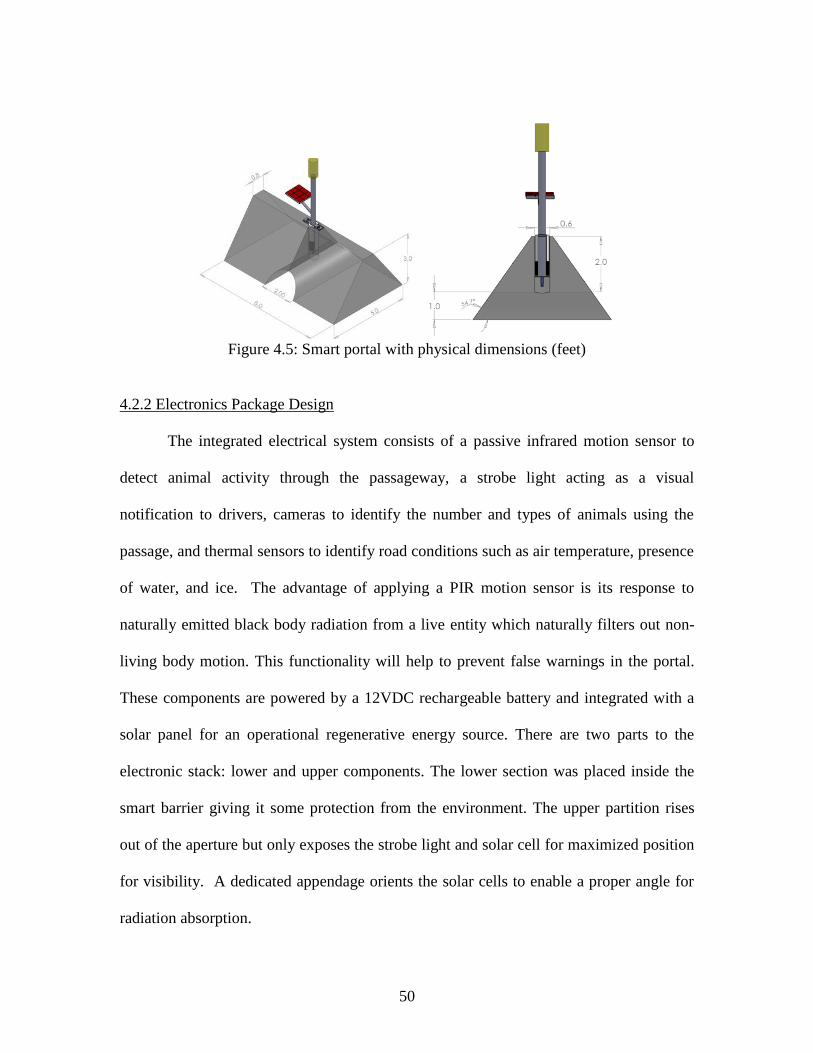
50
Figure 4.5: Smart portal with physical dimensions (feet)
4.2.2 Electronics Package Design
The integrated electrical system consists of a passive infrared motion sensor to
detect animal activity through the passageway, a strobe light acting as a visual
notification to drivers, cameras to identify the number and types of animals using the
passage, and thermal sensors to identify road conditions such as air temperature, presence
of water, and ice. The advantage of applying a PIR motion sensor is its response to
naturally emitted black body radiation from a live entity which naturally filters out non-
living body motion. This functionality will help to prevent false warnings in the portal.
These components are powered by a 12VDC rechargeable battery and integrated with a
solar panel for an operational regenerative energy source. There are two parts to the
electronic stack: lower and upper components. The lower section was placed inside the
smart barrier giving it some protection from the environment. The upper partition rises
out of the aperture but only exposes the strobe light and solar cell for maximized position
for visibility. A dedicated appendage orients the solar cells to enable a proper angle for
radiation absorption.
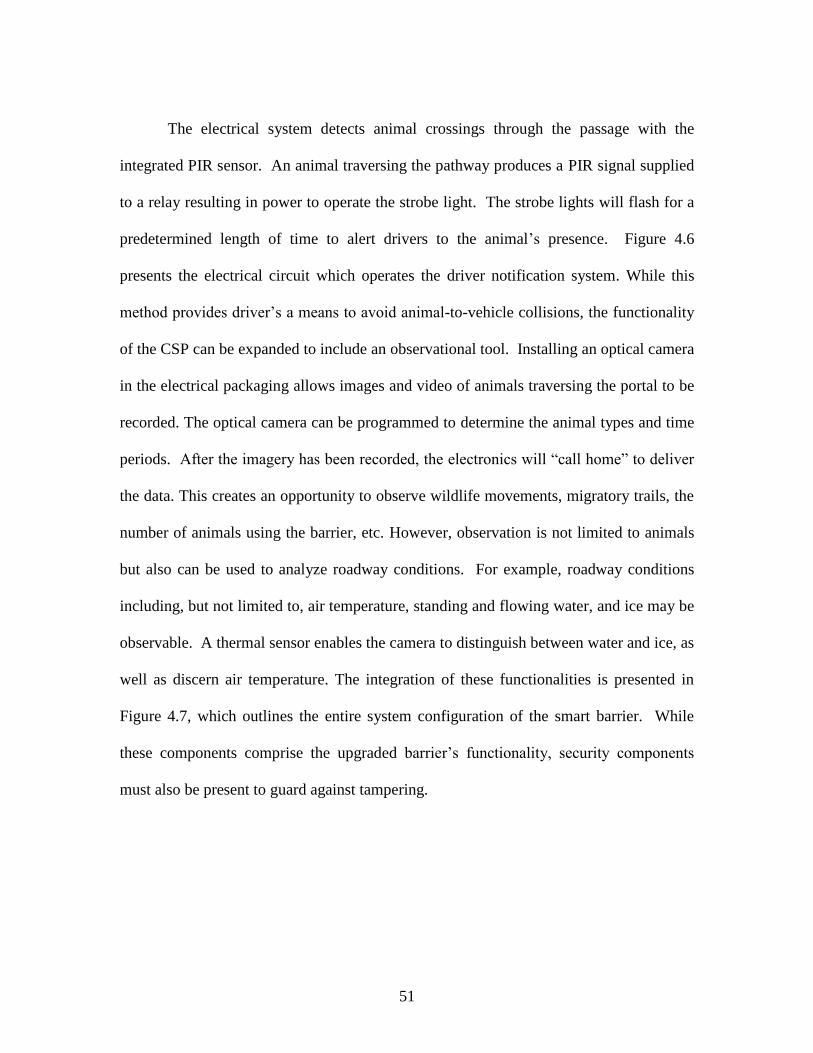
51
The electrical system detects animal crossings through the passage with the
integrated PIR sensor. An animal traversing the pathway produces a PIR signal supplied
to a relay resulting in power to operate the strobe light. The strobe lights will flash for a
predetermined length of time to alert drivers to the animal’s presence. Figure 4.6
presents the electrical circuit which operates the driver notification system. While this
method provides driver’s a means to avoid animal-to-vehicle collisions, the functionality
of the CSP can be expanded to include an observational tool. Installing an optical camera
in the electrical packaging allows images and video of animals traversing the portal to be
recorded. The optical camera can be programmed to determine the animal types and time
periods. After the imagery has been recorded, the electronics will “call home” to deliver
the data. This creates an opportunity to observe wildlife movements, migratory trails, the
number of animals using the barrier, etc. However, observation is not limited to animals
but also can be used to analyze roadway conditions. For example, roadway conditions
including, but not limited to, air temperature, standing and flowing water, and ice may be
observable. A thermal sensor enables the camera to distinguish between water and ice, as
well as discern air temperature. The integration of these functionalities is presented in
Figure 4.7, which outlines the entire system configuration of the smart barrier. While
these components comprise the upgraded barrier’s functionality, security components
must also be present to guard against tampering.
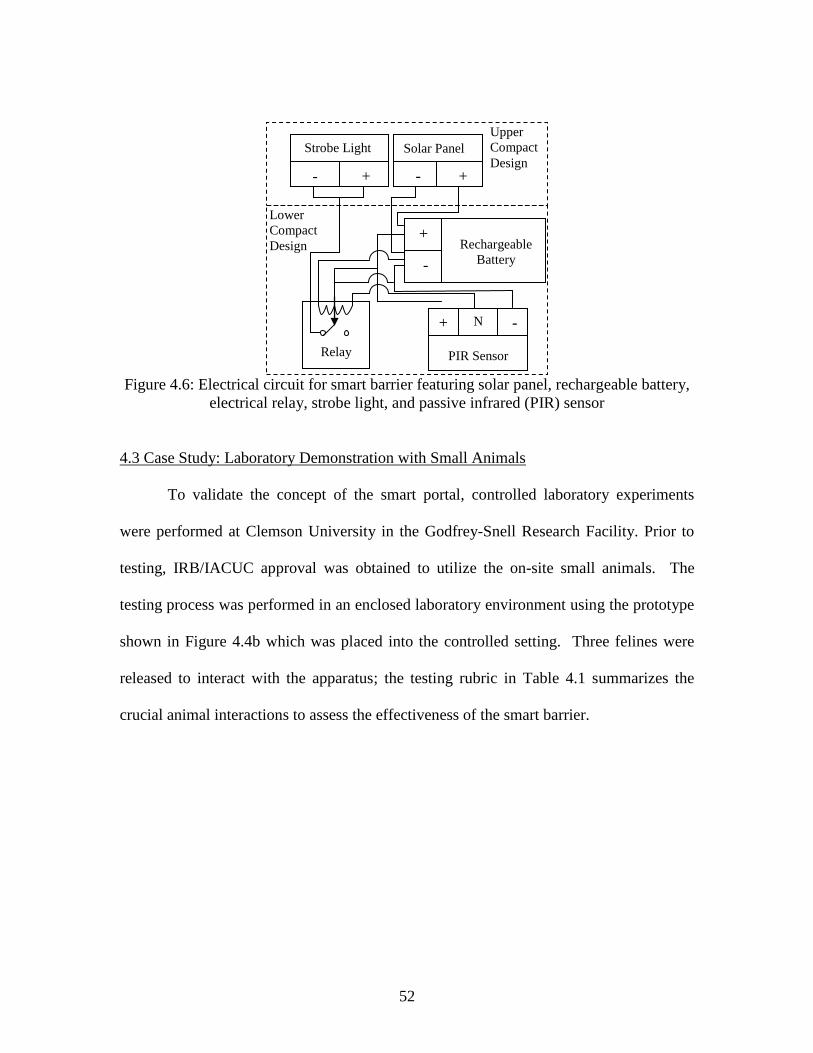
52
Figure 4.6: Electrical circuit for smart barrier featuring solar panel, rechargeable battery,
electrical relay, strobe light, and passive infrared (PIR) sensor
4.3 Case Study: Laboratory Demonstration with Small Animals
To validate the concept of the smart portal, controlled laboratory experiments
were performed at Clemson University in the Godfrey-Snell Research Facility. Prior to
testing, IRB/IACUC approval was obtained to utilize the on-site small animals. The
testing process was performed in an enclosed laboratory environment using the prototype
shown in Figure 4.4b which was placed into the controlled setting. Three felines were
released to interact with the apparatus; the testing rubric in Table 4.1 summarizes the
crucial animal interactions to assess the effectiveness of the smart barrier.
Solar Panel
Rechargeable
Battery
Relay
Strobe Light
PIR Sensor
Upper
Compact
Design
Lower
Compact
Design
+ - N
C
+
-
- + - +
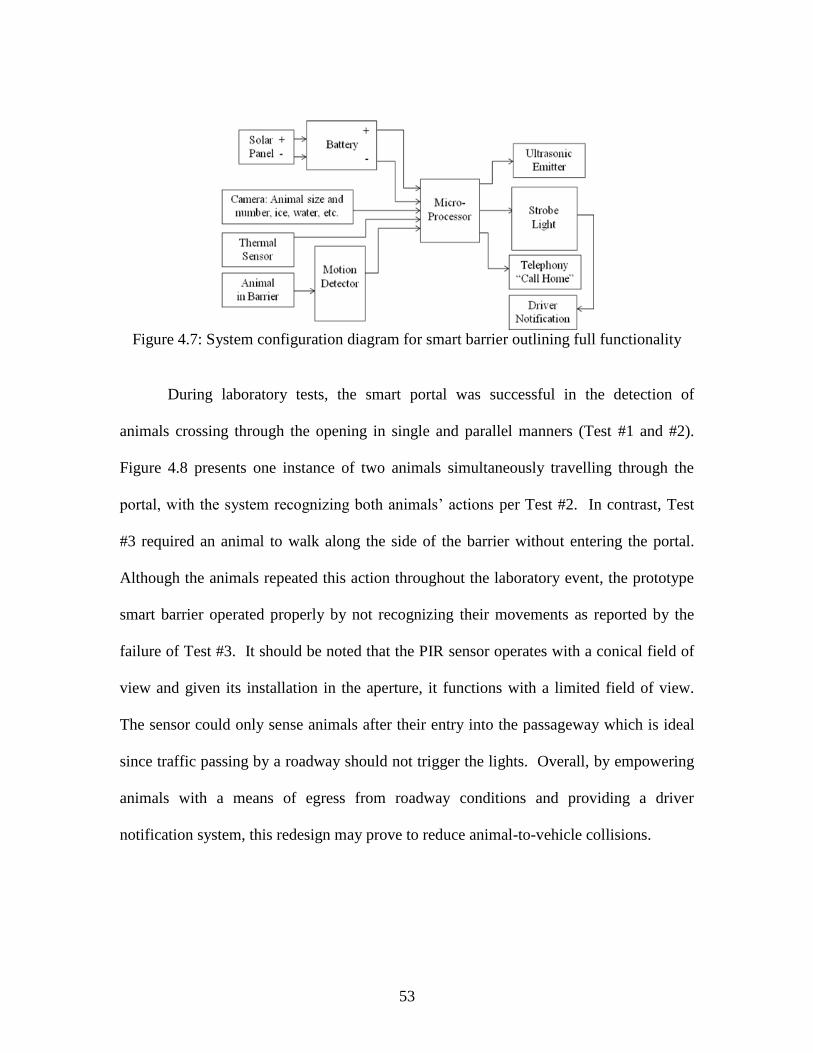
53
Figure 4.7: System configuration diagram for smart barrier outlining full functionality
During laboratory tests, the smart portal was successful in the detection of
animals crossing through the opening in single and parallel manners (Test #1 and #2).
Figure 4.8 presents one instance of two animals simultaneously travelling through the
portal, with the system recognizing both animals’ actions per Test #2. In contrast, Test
#3 required an animal to walk along the side of the barrier without entering the portal.
Although the animals repeated this action throughout the laboratory event, the prototype
smart barrier operated properly by not recognizing their movements as reported by the
failure of Test #3. It should be noted that the PIR sensor operates with a conical field of
view and given its installation in the aperture, it functions with a limited field of view.
The sensor could only sense animals after their entry into the passageway which is ideal
since traffic passing by a roadway should not trigger the lights. Overall, by empowering
animals with a means of egress from roadway conditions and providing a driver
notification system, this redesign may prove to reduce animal-to-vehicle collisions.
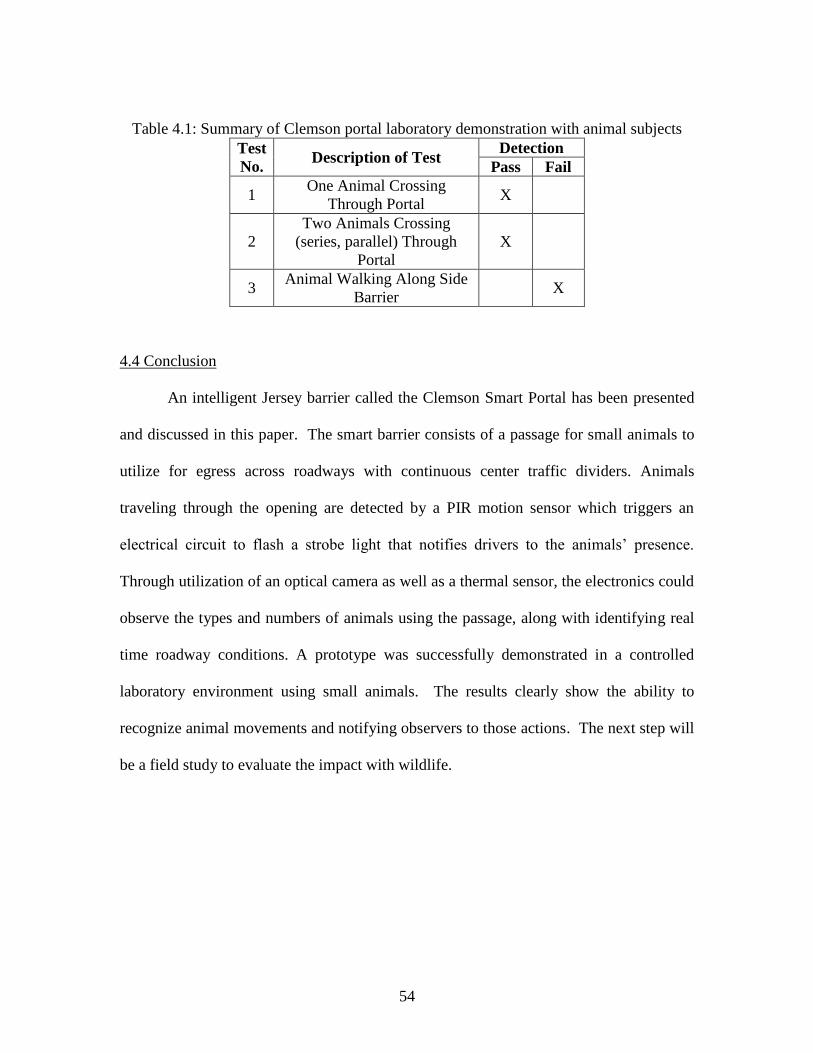
54
Table 4.1: Summary of Clemson portal laboratory demonstration with animal subjects
Test
No. Description of Test
Detection
Pass Fail
1 One Animal Crossing
Through Portal X
2
Two Animals Crossing
(series, parallel) Through
Portal
X
3 Animal Walking Along Side
Barrier X
4.4 Conclusion
An intelligent Jersey barrier called the Clemson Smart Portal has been presented
and discussed in this paper. The smart barrier consists of a passage for small animals to
utilize for egress across roadways with continuous center traffic dividers. Animals
traveling through the opening are detected by a PIR motion sensor which triggers an
electrical circuit to flash a strobe light that notifies drivers to the animals’ presence.
Through utilization of an optical camera as well as a thermal sensor, the electronics could
observe the types and numbers of animals using the passage, along with identifying real
time roadway conditions. A prototype was successfully demonstrated in a controlled
laboratory environment using small animals. The results clearly show the ability to
recognize animal movements and notifying observers to those actions. The next step will
be a field study to evaluate the impact with wildlife.
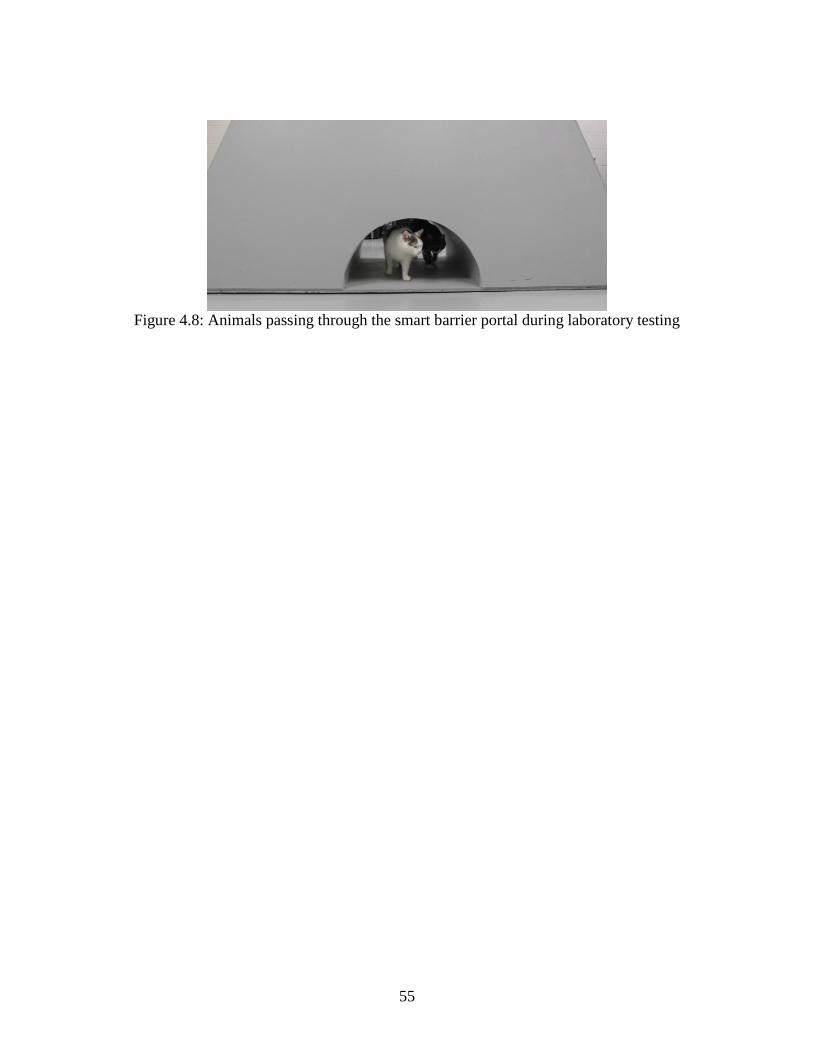
55
Figure 4.8: Animals passing through the smart barrier portal during laboratory testing
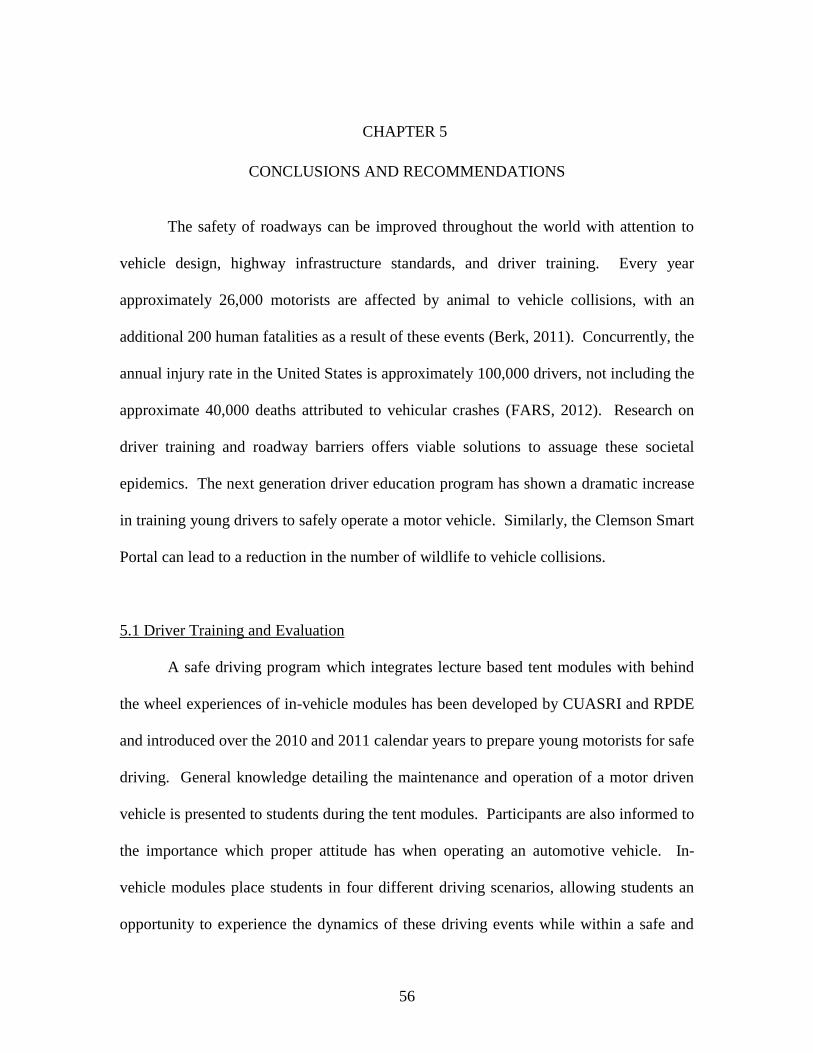
56
CHAPTER 5
CONCLUSIONS AND RECOMMENDATIONS
The safety of roadways can be improved throughout the world with attention to
vehicle design, highway infrastructure standards, and driver training. Every year
approximately 26,000 motorists are affected by animal to vehicle collisions, with an
additional 200 human fatalities as a result of these events (Berk, 2011). Concurrently, the
annual injury rate in the United States is approximately 100,000 drivers, not including the
approximate 40,000 deaths attributed to vehicular crashes (FARS, 2012). Research on
driver training and roadway barriers offers viable solutions to assuage these societal
epidemics. The next generation driver education program has shown a dramatic increase
in training young drivers to safely operate a motor vehicle. Similarly, the Clemson Smart
Portal can lead to a reduction in the number of wildlife to vehicle collisions.
5.1 Driver Training and Evaluation
A safe driving program which integrates lecture based tent modules with behind
the wheel experiences of in-vehicle modules has been developed by CUASRI and RPDE
and introduced over the 2010 and 2011 calendar years to prepare young motorists for safe
driving. General knowledge detailing the maintenance and operation of a motor driven
vehicle is presented to students during the tent modules. Participants are also informed to
the importance which proper attitude has when operating an automotive vehicle. In-
vehicle modules place students in four different driving scenarios, allowing students an
opportunity to experience the dynamics of these driving events while within a safe and
57
controlled environment. In-vehicle instructors accompany the participants for the full
program while simultaneously acting as coaches that provide feedback on performance.
The safe driving capabilities of 661 students from 26 safe driving classes were
considered in a case study focusing on the safe driving program’s effectiveness. These
students were found to have an average overall score of 78.2% through the four driving
modules which correlates to a nearly proficient safe driving level. Students were able to
display a positive trend from instructor evaluations as they progressed to each in-vehicle
module. Also, participants typically saw a noticeable increase between their pre- and
post-test scores, showing a developing comprehension for safe driving knowledge upon
program completion. The safe driving program’s effectiveness is strongly confirmed by
the nearly proficient evaluation of the sampled classes and the substantial increase in
knowledge relative to the beginning and conclusion of the program.
5.2 Smart Jersey Barrier
A new design iteration of Jersey class highway barriers, which consists of an
integrated electronics package and animal pathway for egress, has been proposed. The
design incorporates a protected path through the base of the barrier, intended to empower
animals to escape traffic flow. This protected path would hopeful reduce the likelihood
of a wildlife-to-vehicle collision (WVC). Additionally, an electronics package has been
integrated as a means to alert drivers to animal actions and provide a renewable energy
source. As vertebrates make use of the given pathway, a passive infrared sensor enables
power flow to a strobe light. The strobe light alerts oncoming traffic in both directions to
58
the presence of an animal within the passage. An incorporated solar panel coupled to a
rechargeable battery provides a renewable power system.
Laboratory testing has proven the functionality of the Clemson Smart Portal’s
design. However, testing was limited to a controlled environment where no vehicular
interactions or environmental factors could be integrated. Future work would necessitate
a smart portal prototype applied to a field study. This field test would exemplify the
portal’s capability of recognizing wildlife actions while simultaneously notifying
motorists throughout various real world conditions. Concurrently, animal willingness to
engage with the smart portal passage could be observed during the application. Finally,
the prototype employed during the study would need to be made from concrete with steel
rebar. This material would guarantee structural integrity if hit by a vehicle or other large
object.
5.3 Recommendations for Future Research
Although the effectiveness of the safe driving program and the smart Jersey
barrier has been demonstrated, future endeavors could be undertaken to further this
research. Suggestions for future work regarding these topics are presented below in
tabular form.
In-Vehicle Data Collection: Further driver assessment could be gained by
integrating objective in-vehicle data to the evaluation methodology. Applying
electronically recorded vehicular parameters would enable the evaluation process
to encompass parameters previously unobtainable. Incorporation of these
59
additional factors would require the application of on-board data acquisition
(DAQ) units for each student vehicle.
Unique Instantaneous Feedback and Reports for Students: Instantaneous
feedback should be available to students during their in-vehicle experience of the
program. The availability of this information would allow participants to receive
immediate feedback detailing their driving performance. Also, the information
could be integrated into a template that would allow reports tailored to each
student’s operating capabilities and driving knowledge.
Accreditation of Insurance Providers and Government Agencies: Government
and automotive insurance accreditation should be sought to reinforce the presence
of the safe driving program through professional and peer validation. Automotive
insurer support would help convince parents and young drivers that the safe
driving program is an investment by insurance rate reductions. Government
accreditation would reinforce the authenticity of the safe driving program, and
could be used to supplement current licensing processes.
Expansion of Design Functionality: Supplemental sensors could be applied to
expand the barrier’s functionality to encompass additional operations. This could
include video cameras, thermal sensors, and ultrasonic sensors. Coupling these
sensors with internet functionality would enable each applied barrier to serve as a
60
localized observation station for ambient roadway conditions respective to each
apparatus’s surroundings
Field Study: A Clemson Smart Portal unit should then be implemented for a field
study as a means of validating the design during real world events and settings. A
field study would enable the intelligent Jersey barrier to be tested in environment
consisting of varying vehicular traffic flow, precipitation, and potential collision.
Observing operation in a dynamic ambience would present the smart barrier’s
strengths and where reinforcement in the design could be necessary.
Structural Review for Crash Worthiness: The structural design of the smart portal
should be reiterated according to the structural standardization of Jersey barriers.
This would enable each smart Jersey barrier to protect motorists in the same
manner as current Jersey barriers while simultaneously providing animals egress,
alerting drivers, and serving any extended functionalities.

61
APPENDICES
Appendix A
Pre and Post Test Questions in Safe Driving Program
Question 1: When preparing to stop on dry pavement, I should allow how many seconds
(at least) between my car and an object in front of me (like another car) to permit a safe
stop?
a) 5 seconds
b) 75 seconds
c) 1 second
d) 3 Seconds
Question 2: When driving in the rain, it is best to…
a) Drive safely & maintain posted speed limits
b) Increase following distances by at least a second
c) Increase speed & be prepared for hard braking
d) Slow down & put your hazard lights on
Question 3: Which car will need the greater amount of distance to stop?
a) A lighter car, such as a Toyota Camry
b) A heavier car, such as a Hummer
c) A longer car, such as a Ford Taurus
d) All vehicles will stop in the same distance, regardless of weight or length
62
Question 4: Always inflate the tire to the air pressure specifications listed on the …
a) Door jamb label
b) Spare tire
c) Tire sidewall
d) Tire jack instructions
Question 5: If only 2 tires are replaced on your vehicle at a time, it is best to…
a) Mount them in the front
b) Mount them on the front & rear of either the driver’s or passenger’s side
c) Mount them in the rear
d) Mount them diagonally on the front & rear
Question 6: In what driving condition is my personal reaction time most vital for my
safety?
a) Wet or slick roads
b) Icy or snowy pavement
c) Heavy traffic conditions
d) All of the above
Question 7: What is the single most effective safety system in your vehicle?
a) Anti-Lock Braking System
b) Safety Belt System

63
c) Electronic Control System
d) Traction Control System
Question 8: What is the average time for an alert driver to recognize and react to a
dangerous situation?
a) Less than 1 second
b) 1 to 1.49 seconds
c) 1.5 to 2 seconds
d) 2.5 to 3 seconds
Question 9: To avoid a tailgating situation while driving, a safe headway is defined as …
a) A 1 second gap between the vehicle in front & your front bumper
b) A 2 second gap between the vehicle in front & your front bumper
c) A 3 second gap between the vehicle in front & your front bumper
d) A 4 second gap between the vehicle in front & your front bumper
Question 10: The "pile up" effect is most likely caused by:
a) Driving in wet conditions while using a safe following distance
b) Driving with underinflated tires
c) Driving through a work zone after hours
d) A driver watching only the vehicle directly ahead

64
Question 11: Speed and distance are related to stopping distance in what way?
a) As speed doubles, braking distance does not double (not 1:1 relationship)
b) As speed doubles, braking distance increases in the same proportion (an exact 1:1
relationship )
c) As speed doubles, braking distance more than doubles (not 1:1 relationship)
d) Speed and distance are not directly related
Question 12: One of the most important ways to prevent a loss of control situation is to
a) Steer away from hazards
b) Anticipate hazards before they occur
c) Brake to avoid hazards
d) Maintain posted speed limits
Question 13: To begin correcting a vehicle in a front wheel skid, one thing you should do
is
a) Lightly apply the brakes
b) Lightly apply the gas pedal to increase speed,
c) Turn in the direction you want the vehicle to go
d) Apply hard braking

65
Question 14: To begin correcting a vehicle in a rear wheel skid, one thing you should do
is
a) Apply hard braking
b) Turn into the skid
c) Let off the brake / gas pedals
d) Lightly apply the brakes

66
Appendix B
Objective Evaluation Metrics and Subjective Rubrics
Table B.1: Objective evaluation for the Braking Module; symbol “+” denotes OR
logic operation
No. Criteria
Weight Scores & Attributes Subtotal
Title 5 4 3 2 1 0
1 Reaction
Time (sec) 2 tr<1.5 1.5<tr<2 2<tr<2.5 2.5<tr<3 3<tr<3.5 3.5<tr
2 Stopping
Distance (m) 4 x<.7xstop
.7xstop<x
<.75xstop
.75xstop<x
<.80xstop
.80xstop<x
<.90xstop
.90xstop<x
<xstop
x
>xstop
3
Peak
Deceleration
(g)
8 ap< .70 .70 <ap
< .60
.60 <ap
< .50
.50<ap
< .40
.40<ap
< .30
ap
<.30
4 Yaw Angle
(o)
2 |Ψ|<1 1<|Ψ|<1.5 1.5<|Ψ|<2
2<|Ψ|<2.5 2.5<|Ψ|<3 3<|Ψ|
5 Speed (mph) 4 34<v +
v<37
32<v<34 +
37<v<38
30<v<32 +
38<v<39
28<v<30 +
39<v<40
26<v<28 +
40<v<41
v<26 +
41<v
Score
Table B.2: Objective evaluation for the Obstacle Avoidance Module; symbol “+” denotes
OR logic operation
No. Criteria
Weight Scores & Attributes Subtotal
Title 5 4 3 2 1 0
1 Reaction Time (s) 6 tr<1.5 1.5<tr<2 2<tr<2.5 2.5<tr<3 3<tr<3.5 tr>3.5
2 Speed during
return pass (mph) 3
34<v +
v<37
32<v<34 +
37<v<38
30<v<32 +
38<v<39
28<v<30 +
39<v<40
26<v<28 +
40<v<41
v<26 +
41<v
3 Speed during
through pass (mph) 3
34<v +
v<37
32<v<34 +
37<v<38
30<v<32 +
38<v<39
28<v<30 +
39<v<40
26<v<28 +
40<v<41
v<26 +
41<v
4 Yaw Angle (o) 5 |Ψ|<5 5<|Ψ|<10 10<|Ψ|<15
15<|Ψ|<20
o 20<|Ψ|<25
25<|Ψ|
5 Speed at lane split
(mph) 3
15.5<v+
v<16
15.0<v<15.5
+ 16<v<17
13<v<15 +
17<v<19
11<v<13 +
19<v<21
9<v<11 +
21<v<23
v<9 +
23<v
Score
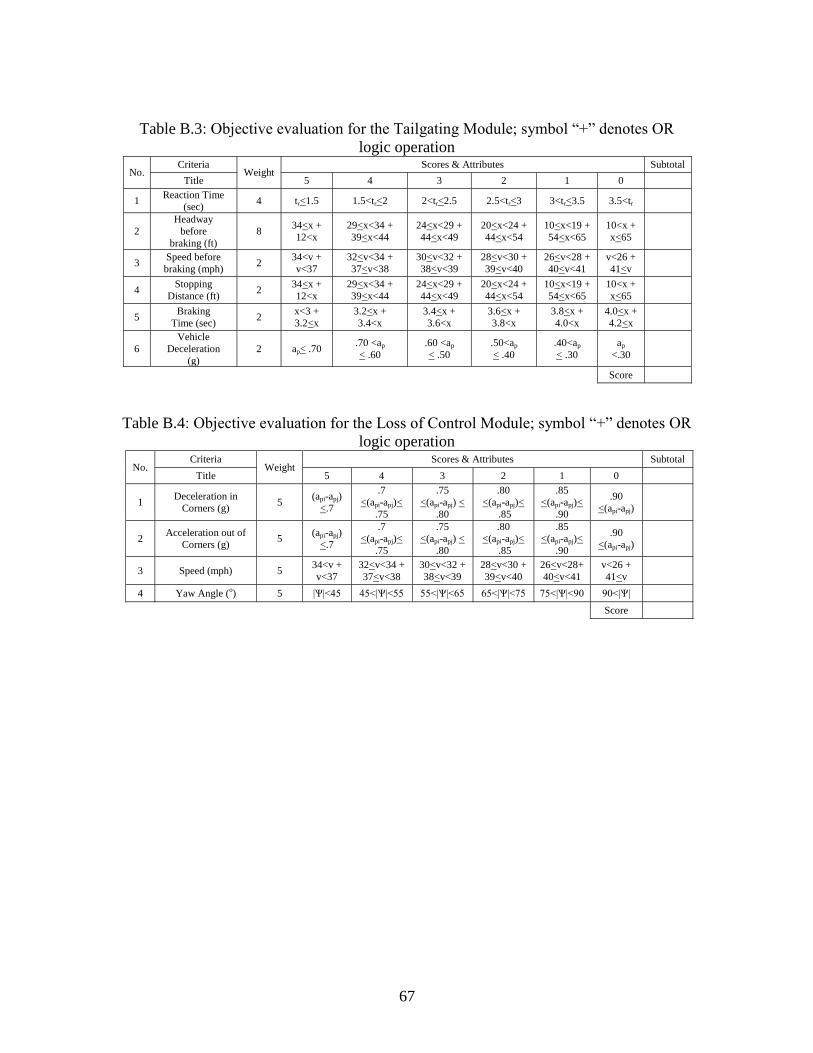
67
Table B.3: Objective evaluation for the Tailgating Module; symbol “+” denotes OR
logic operation
No. Criteria
Weight Scores & Attributes Subtotal
Title 5 4 3 2 1 0
1 Reaction Time
(sec) 4 tr<1.5 1.5<tr<2 2<tr<2.5 2.5<tr<3 3<tr<3.5 3.5<tr
2
Headway
before
braking (ft)
8 34<x +
12<x
29<x<34 +
39<x<44
24<x<29 +
44<x<49
20<x<24 +
44<x<54
10<x<19 +
54<x<65
10<x +
x<65
3 Speed before
braking (mph) 2
34<v +
v<37
32<v<34 +
37<v<38
30<v<32 +
38<v<39
28<v<30 +
39<v<40
26<v<28 +
40<v<41
v<26 +
41<v
4 Stopping
Distance (ft) 2
34<x +
12<x
29<x<34 +
39<x<44
24<x<29 +
44<x<49
20<x<24 +
44<x<54
10<x<19 +
54<x<65
10<x +
x<65
5 Braking
Time (sec) 2
x<3 +
3.2<x
3.2<x +
3.4<x
3.4<x +
3.6<x
3.6<x +
3.8<x
3.8<x +
4.0<x
4.0<x +
4.2<x
6
Vehicle
Deceleration
(g)
2 ap< .70 .70 <ap
< .60
.60 <ap
< .50
.50<ap
< .40
.40<ap
< .30
ap
<.30
Score
Table B.4: Objective evaluation for the Loss of Control Module; symbol “+” denotes OR
logic operation
No. Criteria
Weight Scores & Attributes Subtotal
Title 5 4 3 2 1 0
1 Deceleration in
Corners (g) 5
(api-apj)
<.7
.7
<(api-apj)<
.75
.75
<(api-apj) <
.80
.80
<(api-apj)<
.85
.85
<(api-apj)<
.90
.90
<(api-apj)
2 Acceleration out of
Corners (g) 5
(api-apj)
<.7
.7
<(api-apj)<
.75
.75
<(api-apj) <
.80
.80
<(api-apj)<
.85
.85
<(api-apj)<
.90
.90
<(api-apj)
3 Speed (mph) 5 34<v +
v<37
32<v<34 +
37<v<38
30<v<32 +
38<v<39
28<v<30 +
39<v<40
26<v<28+
40<v<41
v<26 +
41<v
4 Yaw Angle (o) 5 |Ѱ|<45 45<|Ѱ|<55 55<|Ѱ|<65 65<|Ѱ|<75
75<|Ѱ|<90
90<|Ѱ|
Score
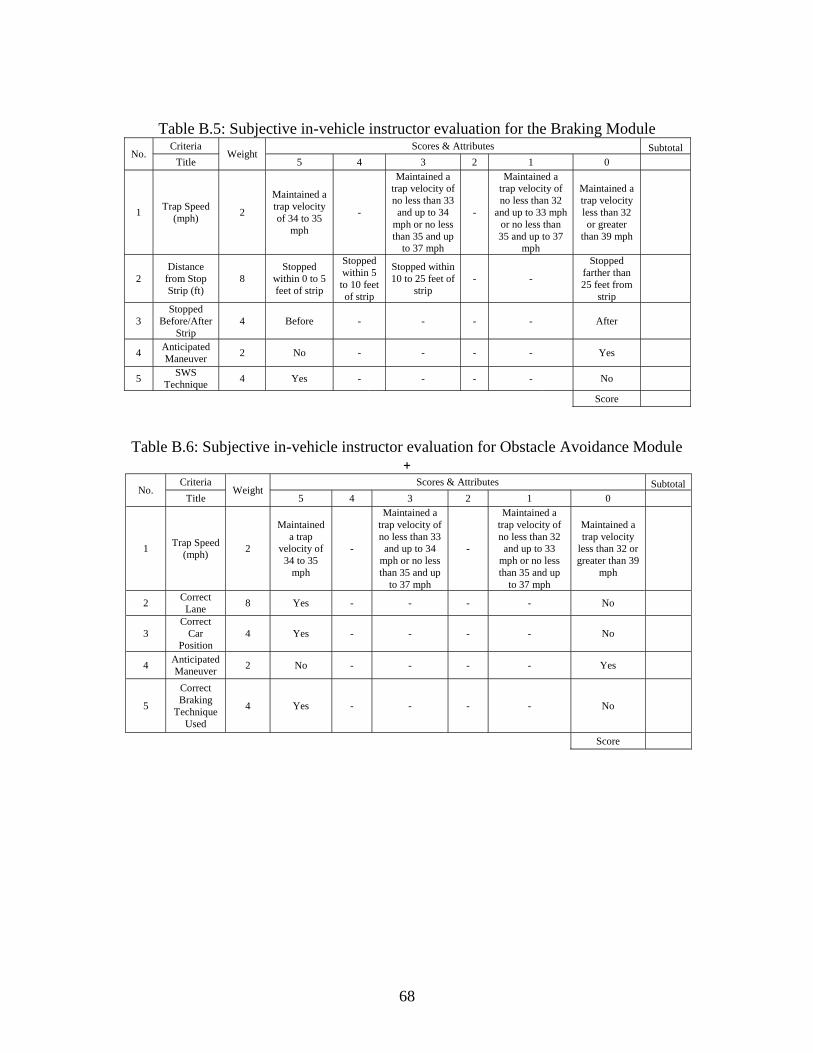
68
Table B.5: Subjective in-vehicle instructor evaluation for the Braking Module
No. Criteria
Weight Scores & Attributes Subtotal
Title 5 4 3 2 1 0
1 Trap Speed
(mph) 2
Maintained a
trap velocity
of 34 to 35
mph
-
Maintained a
trap velocity of
no less than 33
and up to 34
mph or no less
than 35 and up
to 37 mph
-
Maintained a
trap velocity of
no less than 32
and up to 33 mph
or no less than
35 and up to 37
mph
Maintained a
trap velocity
less than 32
or greater
than 39 mph
2
Distance
from Stop
Strip (ft)
8
Stopped
within 0 to 5
feet of strip
Stopped
within 5
to 10 feet
of strip
Stopped within
10 to 25 feet of
strip
- -
Stopped
farther than
25 feet from
strip
3
Stopped
Before/After
Strip
4 Before - - - - After
4 Anticipated
Maneuver 2 No - - - - Yes
5 SWS
Technique 4 Yes - - - - No
Score
Table B.6: Subjective in-vehicle instructor evaluation for Obstacle Avoidance Module +
No. Criteria
Weight Scores & Attributes Subtotal
Title 5 4 3 2 1 0
1 Trap Speed
(mph) 2
Maintained
a trap
velocity of
34 to 35
mph
-
Maintained a
trap velocity of
no less than 33
and up to 34
mph or no less
than 35 and up
to 37 mph
-
Maintained a
trap velocity of
no less than 32
and up to 33
mph or no less
than 35 and up
to 37 mph
Maintained a
trap velocity
less than 32 or
greater than 39
mph
2 Correct
Lane 8 Yes - - - - No
3
Correct
Car
Position
4 Yes - - - - No
4 Anticipated
Maneuver 2 No - - - - Yes
5
Correct
Braking
Technique
Used
4 Yes - - - - No
Score

69
Table B.7: Subjective in-vehicle instructor evaluation for the Tailgating Module
No. Criteria
Weight Scores & Attributes Subtotal
Title 5 4 3 2 1 0
1 Proper
Acceleration 2 Correct - - - -
Too
Slow +
Too Fast
2 Distance
from Rig (ft) 8
Stopped
within 5 to 10
feet of rig
Stopped within 0
to 5 feet or 11 to
25 feet of rig
Stopped farther
than 25 feet
from rig
- - Hit Rig
3 Proper
Headway 2 Yes - - - - No
4 Anticipated
Maneuver 2 No - - - - Yes
5
Constant
Speed
Reached
2 Yes - - - - No
6
Correct
Braking
Technique
Used
4 Yes - - - - No
Score
Table B.8: Subjective in-vehicle instructor evaluation for the Loss of Control Module
No. Criteria
Weight Scores & Attributes Subtotal
Title 5 4 3 2 1 0
1 Trap Speed
(mph) 1
Maintained a
trap velocity
of 34 to 35
mph
-
Maintained a
trap velocity of
no less than 33
and up to 34
mph or no less
than 35 and up
to 37 mph
-
Maintained a trap
velocity of no less
than 32 and up to 33
mph or no less than
35 and up to 37 mph
Maintained a
trap velocity
less than 32
or greater
than 39 mph
2
Proper
Position on
Course
4 Yes - - - - No
3 Adequate
Speed 1 Yes - - - - No
4
Correct
Technique
Used
4 Yes - - - - No
5 Anticipated
Maneuver 2 No - - - - Yes
6 Recognition
of FWS 2 Yes - - - - No
7 Recognition
of RWS 2 Yes - - - - No
8 Correct Line
of Sight 4 Yes - - - - No
Score

70
Table B.9: Final score for safe driving program
Source Objective
Score
Subjective
Score Subtotal
Pre-Test - -
Braking Module
Obstacle Avoidance
Module
Tailgating Module
Loss of Control Module
Post Test - -
Score
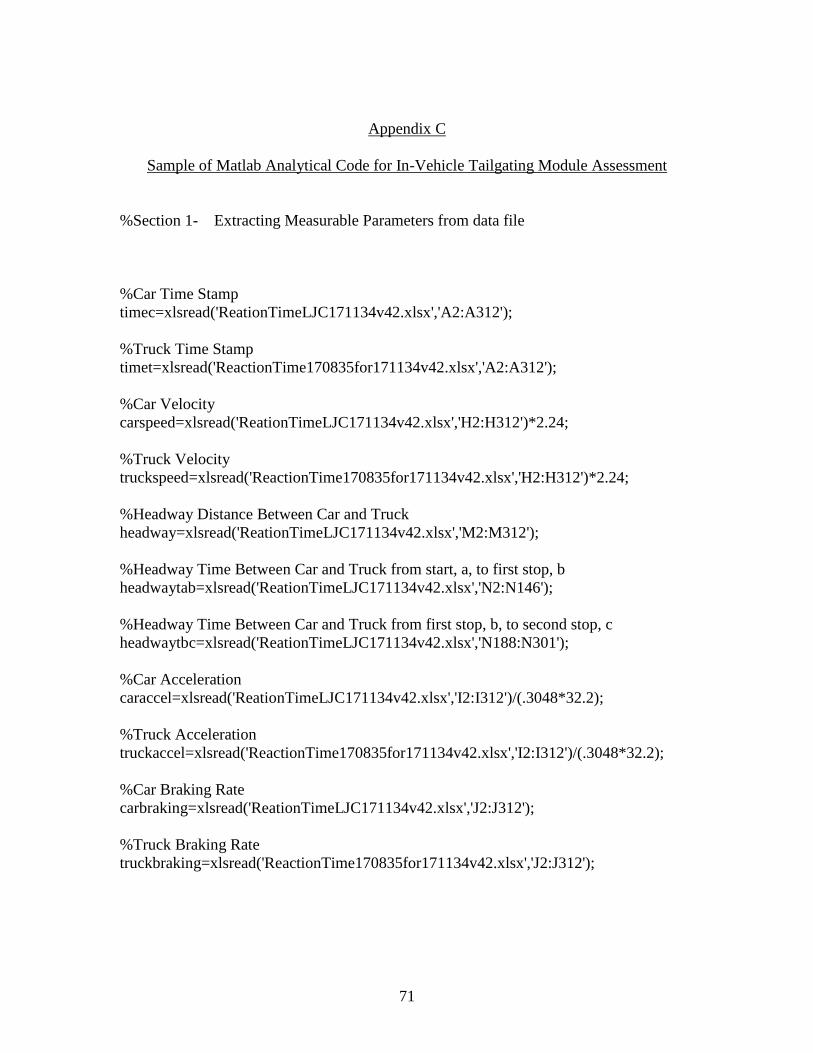
71
Appendix C
Sample of Matlab Analytical Code for In-Vehicle Tailgating Module Assessment
%Section 1- Extracting Measurable Parameters from data file
%Car Time Stamp
timec=xlsread('ReationTimeLJC171134v42.xlsx','A2:A312');
%Truck Time Stamp
timet=xlsread('ReactionTime170835for171134v42.xlsx','A2:A312');
%Car Velocity
carspeed=xlsread('ReationTimeLJC171134v42.xlsx','H2:H312')*2.24;
%Truck Velocity
truckspeed=xlsread('ReactionTime170835for171134v42.xlsx','H2:H312')*2.24;
%Headway Distance Between Car and Truck
headway=xlsread('ReationTimeLJC171134v42.xlsx','M2:M312');
%Headway Time Between Car and Truck from start, a, to first stop, b
headwaytab=xlsread('ReationTimeLJC171134v42.xlsx','N2:N146');
%Headway Time Between Car and Truck from first stop, b, to second stop, c
headwaytbc=xlsread('ReationTimeLJC171134v42.xlsx','N188:N301');
%Car Acceleration
caraccel=xlsread('ReationTimeLJC171134v42.xlsx','I2:I312')/(.3048*32.2);
%Truck Acceleration
truckaccel=xlsread('ReactionTime170835for171134v42.xlsx','I2:I312')/(.3048*32.2);
%Car Braking Rate
carbraking=xlsread('ReationTimeLJC171134v42.xlsx','J2:J312');
%Truck Braking Rate
truckbraking=xlsread('ReactionTime170835for171134v42.xlsx','J2:J312');
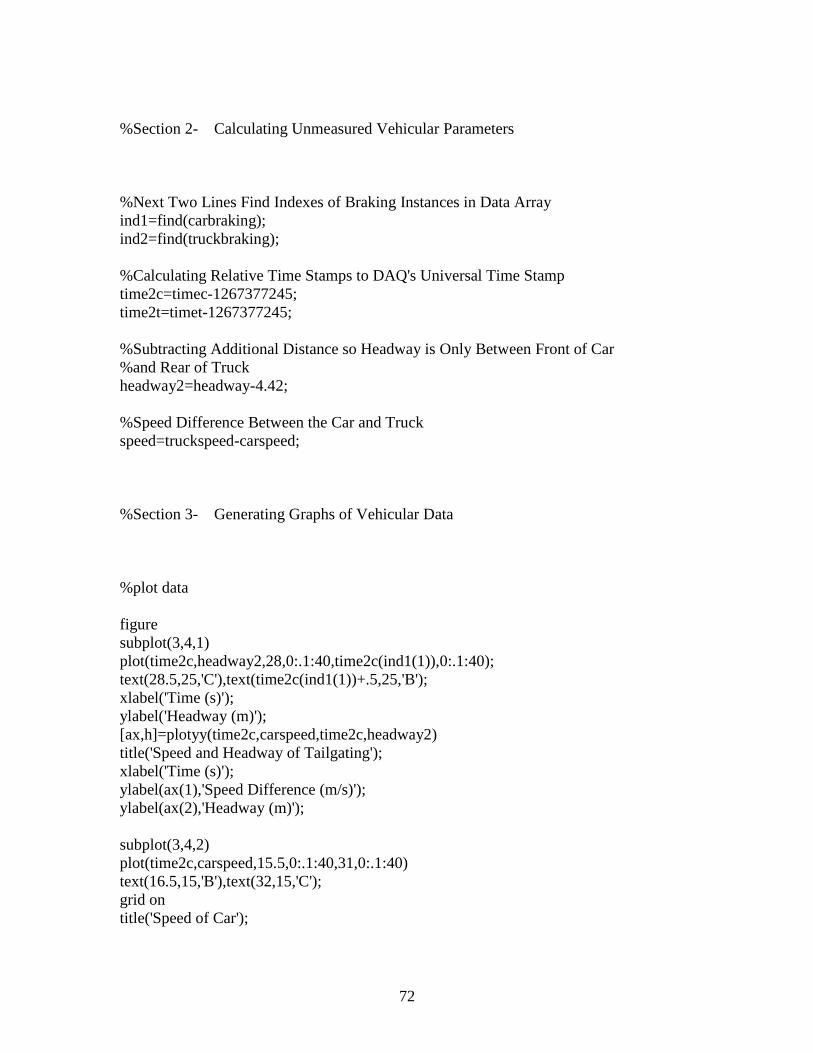
72
%Section 2- Calculating Unmeasured Vehicular Parameters
%Next Two Lines Find Indexes of Braking Instances in Data Array
ind1=find(carbraking);
ind2=find(truckbraking);
%Calculating Relative Time Stamps to DAQ's Universal Time Stamp
time2c=timec-1267377245;
time2t=timet-1267377245;
%Subtracting Additional Distance so Headway is Only Between Front of Car
%and Rear of Truck
headway2=headway-4.42;
%Speed Difference Between the Car and Truck
speed=truckspeed-carspeed;
%Section 3- Generating Graphs of Vehicular Data
%plot data
figure
subplot(3,4,1)
plot(time2c,headway2,28,0:.1:40,time2c(ind1(1)),0:.1:40);
text(28.5,25,'C'),text(time2c(ind1(1))+.5,25,'B');
xlabel('Time (s)');
ylabel('Headway (m)');
[ax,h]=plotyy(time2c,carspeed,time2c,headway2)
title('Speed and Headway of Tailgating');
xlabel('Time (s)');
ylabel(ax(1),'Speed Difference (m/s)');
ylabel(ax(2),'Headway (m)');
subplot(3,4,2)
plot(time2c,carspeed,15.5,0:.1:40,31,0:.1:40)
text(16.5,15,'B'),text(32,15,'C');
grid on
title('Speed of Car');

73
xlabel('Time (s)');
ylabel('Speed (m/s)');
subplot(3,4,3)
plot(time2c,caraccel,15.5,0:.01:1,31,0:.01:1)
text(16.5,.3,'B'),text(32,.3,'C');
grid on
title('Car Acceleration');
xlabel('Time (s)');
ylabel('Acceleration (m/s^2');
subplot(3,4,4)
plot(time2t,truckspeed,15.5,0:.1:40,31,0:.1:40)
text(16.5,15,'B'),text(32,15,'C');
grid on
title('Speed of Truck');
xlabel('Time (s)');
ylabel('Speed (m/s)');
subplot(3,4,5)
plot(time2c(1:1:145),headwaytab,15.5,0:.1:10,31,0:.1:10)
text(16.5,5,'B'),text(32,5,'C');
grid on
title('Headway Time Between A and B');
xlabel('Time (s)');
ylabel('Headway (s)');
subplot(3,4,6)
plot(time2c(188:1:301),headwaytbc,15.5,0:.1:10,31,0:.1:10)
text(16.5,5,'B'),text(32,5,'C');
grid on
title('Headway Time Between B and C');
xlabel('Time (s)');
ylabel('Headway (s)');
subplot(3,4,7)
plot(time2c,speed,15.5,0:.1:20,31,0:.1:20)
text(16.5,7.5,'B'),text(32,7.5,'C');
grid on
title('Speed Difference');
xlabel('Time (s)');
ylabel('Speed (m/s)');
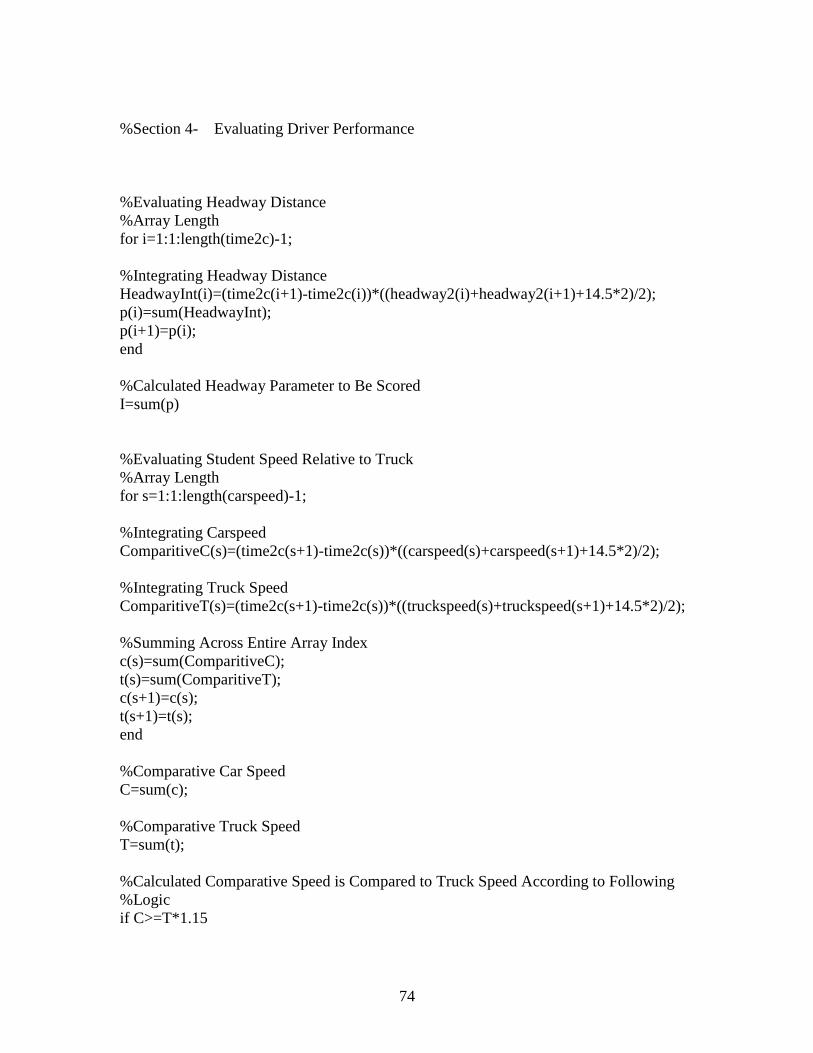
74
%Section 4- Evaluating Driver Performance
%Evaluating Headway Distance
%Array Length
for i=1:1:length(time2c)-1;
%Integrating Headway Distance
HeadwayInt(i)=(time2c(i+1)-time2c(i))*((headway2(i)+headway2(i+1)+14.5*2)/2);
p(i)=sum(HeadwayInt);
p(i+1)=p(i);
end
%Calculated Headway Parameter to Be Scored
I=sum(p)
%Evaluating Student Speed Relative to Truck
%Array Length
for s=1:1:length(carspeed)-1;
%Integrating Carspeed
ComparitiveC(s)=(time2c(s+1)-time2c(s))*((carspeed(s)+carspeed(s+1)+14.5*2)/2);
%Integrating Truck Speed
ComparitiveT(s)=(time2c(s+1)-time2c(s))*((truckspeed(s)+truckspeed(s+1)+14.5*2)/2);
%Summing Across Entire Array Index
c(s)=sum(ComparitiveC);
t(s)=sum(ComparitiveT);
c(s+1)=c(s);
t(s+1)=t(s);
end
%Comparative Car Speed
C=sum(c);
%Comparative Truck Speed
T=sum(t);
%Calculated Comparative Speed is Compared to Truck Speed According to Following
%Logic
if C>=T*1.15
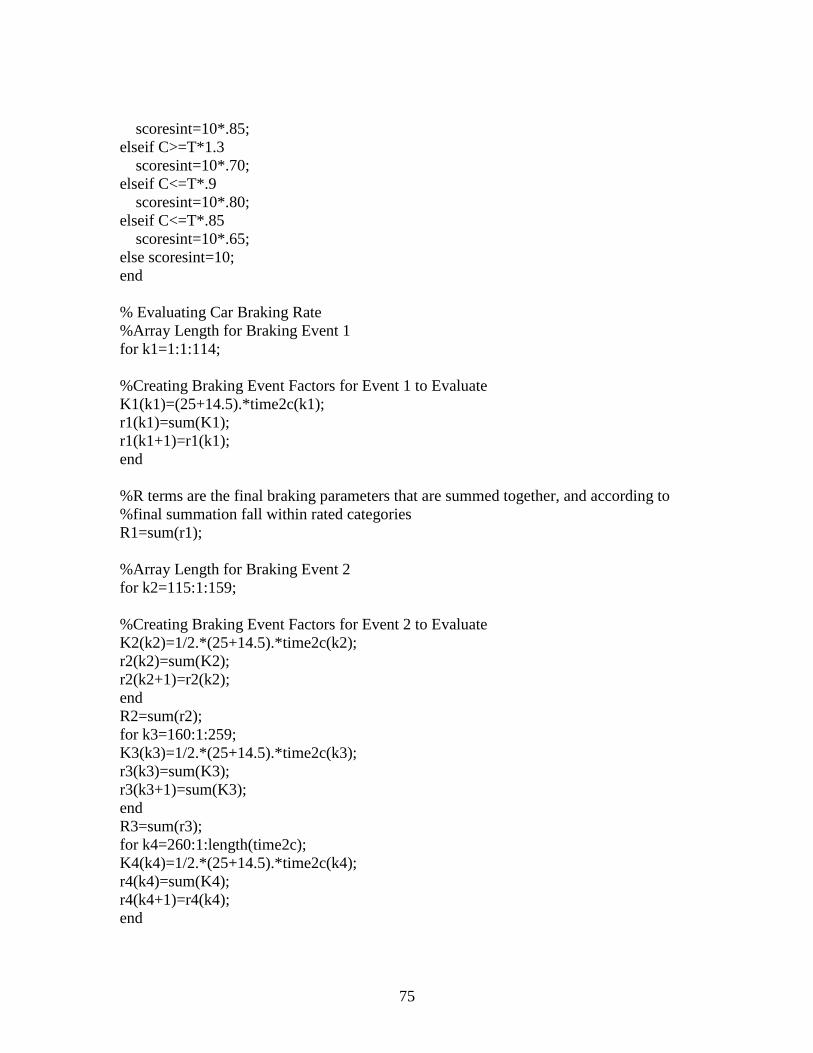
75
scoresint=10*.85;
elseif C>=T*1.3
scoresint=10*.70;
elseif C<=T*.9
scoresint=10*.80;
elseif C<=T*.85
scoresint=10*.65;
else scoresint=10;
end
% Evaluating Car Braking Rate
%Array Length for Braking Event 1
for k1=1:1:114;
%Creating Braking Event Factors for Event 1 to Evaluate
K1(k1)=(25+14.5).*time2c(k1);
r1(k1)=sum(K1);
r1(k1+1)=r1(k1);
end
%R terms are the final braking parameters that are summed together, and according to
%final summation fall within rated categories
R1=sum(r1);
%Array Length for Braking Event 2
for k2=115:1:159;
%Creating Braking Event Factors for Event 2 to Evaluate
K2(k2)=1/2.*(25+14.5).*time2c(k2);
r2(k2)=sum(K2);
r2(k2+1)=r2(k2);
end
R2=sum(r2);
for k3=160:1:259;
K3(k3)=1/2.*(25+14.5).*time2c(k3);
r3(k3)=sum(K3);
r3(k3+1)=sum(K3);
end
R3=sum(r3);
for k4=260:1:length(time2c);
K4(k4)=1/2.*(25+14.5).*time2c(k4);
r4(k4)=sum(K4);
r4(k4+1)=r4(k4);
end

76
R4=sum(r4);
%Scoring Process of Braking Parameters R
R=I/(R1+R2+R3+R4)*10;
if R<=1.10 || R>=.90
scoreh=50*1
end
if R<=1.20 || R>=.80 && R>1.1 && R<.90
scoreh=50*.9
elseif R<=1.30 || R>=.70 && R>1.20 && R<.80
scoreh=50*.70
elseif R<=1.40 || R>=.60 && R>1.30 && R<.70
scoreh=50*.45;
elseif headway2<=0
scoreh=0;
elseif R<.1
disp('broke')
end
scores(1)=0;
for h=66:1:length(carspeed)
if carspeed(h)>=35 && carspeed(h)<=36
scores(h-65)=10*1;
end
if carspeed(h)>36 && carspeed(h)<=37
scores(h-65)=10*.9;
end
if carspeed(h)>37 && carspeed(h)<=38
scores(h-65)=10*.8;
end
if carspeed(h)>38
scores(h-65)=10*.7;
end
scores(h+1-65)=scores(h-65);
end
%Evaluating Headway Time
%Evaluating Headway Time for Each Braking Event According to Following Logic
if mean(headwaytab)>3 || mean(headwaytbc)>=3
scoret=10*.85;
elseif mean(headwaytab)>=4 || mean(headwaytbc)>=4
scoret=10*.70;
elseif mean(headwaytab)>=5 || mean(headwaytbc)>=5

77
scoret=10*.55;
elseif mean(headwaytab)>6 || mean(headwaytbc)>=6
scoret=10*.40;
else scoret=10*1;
end
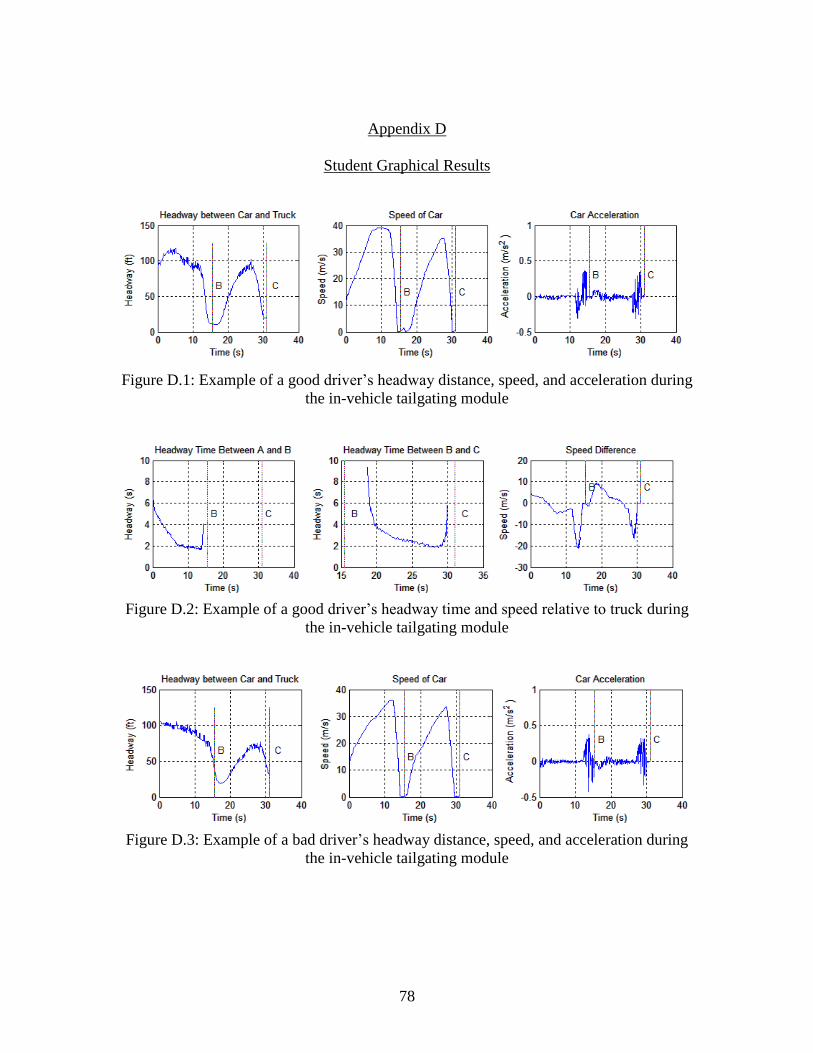
78
Appendix D
Student Graphical Results
Figure D.1: Example of a good driver’s headway distance, speed, and acceleration during
the in-vehicle tailgating module
Figure D.2: Example of a good driver’s headway time and speed relative to truck during
the in-vehicle tailgating module
Figure D.3: Example of a bad driver’s headway distance, speed, and acceleration during
the in-vehicle tailgating module
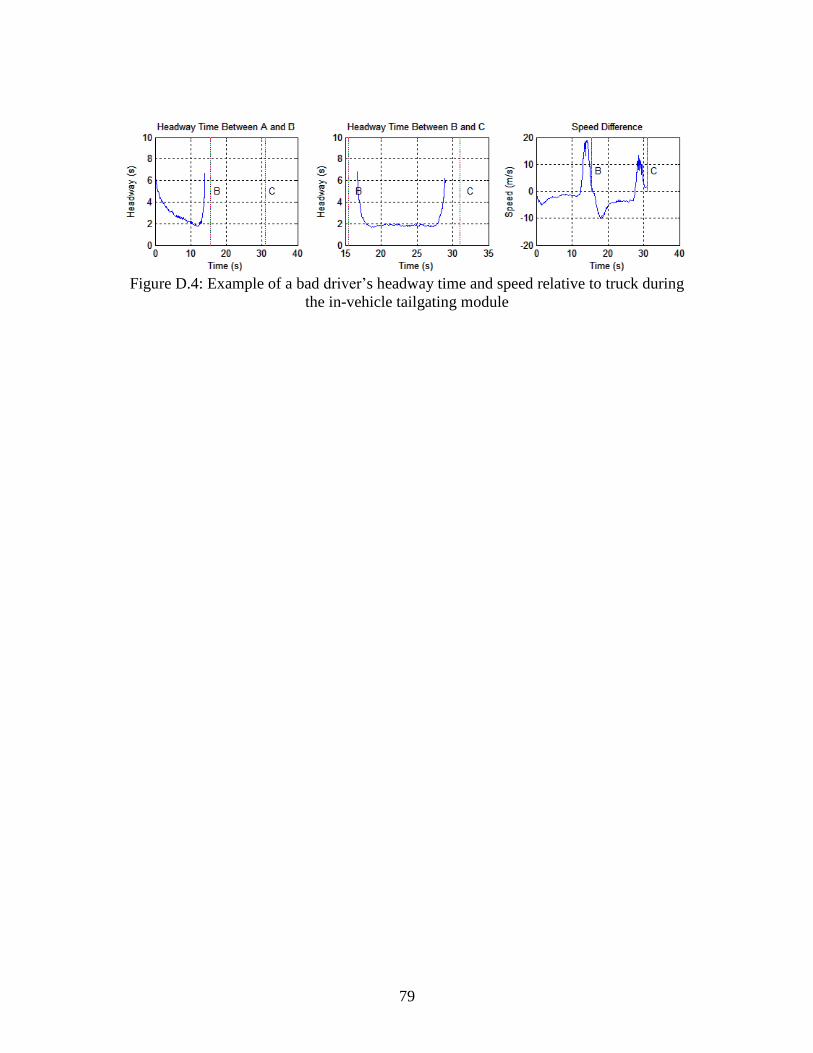
79
Figure D.4: Example of a bad driver’s headway time and speed relative to truck during
the in-vehicle tailgating module
80
REFERENCES
ACI, American Concrete Industry, www.americanconcrete.com/commercial/barriers,
accessed May 2012.
Berg, H., Gregersen, N., and Laflamme, L., “Typical Patterns in Road-Traffic Accidents
During Driver Training: An Explorative Swedish National Study”, Accident Analysis and
Prevention, vol. 36, no. 4, pp. 603-608, July 2004.
Berk, B., “Taking Roadkill Off the Menu”, Car and Driver, December 2011
Bishop, J., Quinlan, K., Roeber, D., and Van Etten, G., ”Driver Education and Training
Forum”, Journal of Accident Investigation, vol. 1, no. 1, pp. 36-43, 2005.
Boyle, J., and Vanderwolf, P., “2003 Motor Vehicle Occupant Safety Survey”, National
Highway Traffic Safety Administration, Safety Belt Report vol. 2, Washington, DC,
2003.
Carstensen, G., “Evaluation of a New Driver Education in Denmark”, proceedings of the
Conference Strategic Highway Research Program (SHRP) and Traffic Safety on Two
Continents, No. 1A, part 2, pp. 287-298, Hauge, Netherlands, September 22-24, 1993.
Cavallaro, L., Sanden, K., Schellhase, J., and Tanaka, M., “Designing Road Crossing for
Safe Wildlife Passage: Venture County Guidelines”, School of Environmental Science
and Management, University of California, Santa Barbara, CA, May 2005.
Clark, L., Wagner, J., Alexander, K., and Pidgeon, P., “Assessment of a Safe Driving
Program for Novice Operators”, to be submitted to the 2013 SAE World Congress,
Detroit, MI, March 2013.
CDC, Centers for Disease Control and Prevention, “Teen Driver Data and Statistics”,
www.cdc.gov/Motorvehiclesafety/Teen_Drivers/data.html#crashes, accessed October
2011.
CPWS, Canadian Parks and Wilderness Society - Southern Alberta, “Shooting the Gap:
Wildlife and the Trans-Canada Highway in Banff Highway Park”, www.cpaws-
southernalberta.org/campaigns_nationalparks/shooting-the-gap.php, accessed May 2012.
Dahlin, T., Jacobs, G., Hopstock, D., Keech, R., Fayling, R., Newell, R., Lacey, C., and
Gonzalez, B., “Conformable Magnetic Articles for Use With Traffic Bearing Surfaces
Methods of Making Same Systems Including Same and Methods of Use”, United States
Patent and Trademark Office, Patent No. 6,468,678 B1, date of patent: October 22, 2002
81
Daniels, D., “Portable or Stationary Animal Alley”, United States Patent and Trademark
Office, Patent No. 7,677,205 B2, date of patent: March 16, 2012.
ECRS, European Commission Road Safety, “Cars Reports and Graphs”,
http://ec.europa.eu/transport/road_safety/specialist/statistics/care_reports_graphics/index
_en.html, accessed September 2012.
Elko Daily Free Press, “Overpass Equals Safety: Wildlife Use U.S. 93 Bridge”,
http://elkodaily.com/news/local/article_14dc6fb2-d86a-11df-be8c-
001cc4c03286.html?mode=story, accessed September 2012.
Enterprise Flasher Company, “Road Safety Products”, http://enterpriseflasher.com/prod-
workzone-crash-systems.php, accessed July 2012.
FARS, Fatality Analysis Reporting System Encyclopedia, “FARS Data Tables”, www-
fars.nhtsa.dot.gov/Main/index.aspx, accessed September 2012.
FHWA, Federal Highway Administration, “Distribution of Licensed Drivers 2000-2009”,
http://www.fhwa.dot.gov/, accessed October 2012.
FHWA, Department of Transportation Federal Highway Administration, “Critter
Crossings”, http://www.fhwa.dot.gov/environment/wildlifecrossings/overview.html,
accessed September 2012.
Gregersen, N., Nyberg, A., and Berg, H., “Accident Involvement Among Learner
Drivers-An Analysis of the Consequences of Supervised Practice”, Accident Analysis and
Prevention, vol. 35, no. 5, pp. 725-730, September 2003.
Gregersen, N., “Young Drivers’ Overestimation of Their Own Skill-An Experiment on
the Relation Between Training Strategy and Skill”, Accident Analysis and Prevention,
vol. 28, no. 2, pp. 243-250, August 1995.
Gzybowski, M., “Safety Barrier With Passageway”, United States Patent and Trademark
Office, Patent No. 5,938,370, date of patent: August 17, 1999.
Hatakka, M., Keskinen, E., Gregersen, N., Glad, A., and Hernetkoski, K., “From Control
of the Vehicle to Personal Self-Control; Broadening the Perspectives to Driver
Education”, Transportation Research Part F: Traffic Psychology and Behavior, vol. 5,
no. 3, pp. 201-215, September 2002.
Jensen, M., Wagner, J., Alexander,K., Pidgeon, P., Rogich, K., and Fedrizzi, R.,
“Automotive Participant Tailgating Safety Training Device-Design and Test”,
International Journal of Vehicle Safety, accepted for publication, December 2011.
82
Jensen, M., Wagner, J., Switzer, F., Alexander, K., Pidgeon, P., and Rogich, K.,
“Development of a Second-stage Novice Driver Training Program”, The Chronicle for
Driver Education Professionals, electronic publication of the American Driver and
Traffic Safety Education Association (ADTSEA), vol. 58, pp. 4-13, Summer 2011.
Lonero, L., and Mayhew, D., “Large-scale Evaluation of Driver Education Review of the
Literature on Driver Education Evaluation 2010 Update”, AAA Foundation for Traffic
Safety, Washington, DC, 2010.
MacNeil, S., “Driver Education, Training, and Licensing”, Human Factors In Traffic
Safety, Dewar and Olsen; Lawyers and Judges Publishing Company, pp. 231-263, 2006.
MAXI-RAIL, “SGGT; Safe German Guard Rail”,
http://www.intertraffic.com/marketplace/mypage/products_detail.asp?mypageid=965&pr
oductid=1436, accessed July 2012.
Mayhew, D., and Simpson, H., “The Safety Value of Driver Education and Training”,
Injury Prevention, 8 Supplement II, pp. ii3-ii8, 2002.
McKnight, A. J., “Content of Driver Education”, Transportation Research Circular, No.
E-C101, pp. 4-6, 2006.
MDOT, Michigan Department of Transportation, “Median Cable Guardrail”,
www.michigan.gov/mdot/0,1607,7-151--222435--,00.html, accessed May 2012.
Miyajima, C., Hiroki, U., Naito, A., Amata, H., Kitaoka, N., and Takeda, K., “Driver
Risk Evaluation Based on Acceleration, Deceleration, and Steering Behavior”,
Proceedings of 2011 IEEE International Conference on Acoustics, Speech, and Signal
Processing, pp. 1829-1832, Prague, Czech Republic, May 2011.
Naito, A., Miyajima, C., Nishino, T., Kitaoka, N., and Takeda, K., “Driver Evaluation
Based on Classification of Rapid Decelerating Patterns”, Proceedings of 2009 IEEE
International Conference on Vehicular Electronics and Safety, pp. 108-112, Pune, India,
November 2009.
NHTSA, National Highway Traffic Safety Administration, “Novice Teen Driver
Education and Training Administrative Standards”, (National Driver Education
Standards Project), http://www.adtsea.org/adtsea, Retrieved December 2011.
NHTSA, National Highway Traffic Safety Administration, “Fatal Crashes Involving
Young Drivers”, (DOT HS 811 218), www-nrd.nhtsa.dot.gov/Pubs/811218.PDF,
accessed October 2011.
83
NHTSA, National Highway Traffic Safety Administration. “How Wearing Seat Belts can
Help Save Money, Time and Your Life”, (DOT HS 809 452),
www.nhtsa.gov/people/injury/airbags/seatbelt%20broch%20web/nonpolice.html,
accessed December 14, 2010.
Noro, M., Hara, F., and Hagiwara, T., “Analysis of Deer Ecology and Landscape
Features as Factors Contributing to Deer-Vehicle Collisions in Hokkaido, Japan”, #10-
3124, 89th Annual Transportation Research Board (TRB) Meeting, Washington, DC,
January 2012.
Parks Canada, “Description of Animal Passages used in Canadian Wildlife Parks”,
http://www.pc.gc.ca/fra/pn-np/ab/banff/docs/routes/phase111b7.aspx, accessed May
2012.
Perlo, P., Grasso, V., and Valerio, F., “System to Avoid the Collision of a Vehicle with
Animals”, United States Patent and Trademark Office, Patent No. 7,098,775, date of
patent: August 29, 2006.
Safe Zone, “Road Safety Products”, www.safezone.in/road_safety_products, accessed
May 2012.
Senserrick, T., “Recent Developments in Young Driver Education, Training and
Licensing In Australia”, Journal of Safety Research, vol. 38, no. 2, pp. 237-244, March
2007.
Simons-Morton, B., and Ouimet, M., “Parent Involvement in Novice Teen Driving: A
Review of the Literature”, Injury Prevention, vol. 12, supplement 1, pp. i30-i37, April
2006.
Stock, J., Weaver, J., Ray, H., Brink, J., and Sadof, M., “Evaluation of Safe Performance
Secondary School Driver Education Curriculum Demonstration Project”, U.S.
Department of Transportation National Highway Traffic Safety Administration, Final
Report: DOT HS 6 01462, June 1983.
TLJE, “The Lake Jackson Ecopassage – Providing a Safe Path for Wildlife”,
www.lakejacksonturtles.org, accessed May 2012.
USGS, “Paynes Prairie Ecopassage Project”,
http://fl.biology.usgs.gov/Amphibians_and_Reptiles/Paynes_Prairie_Project/paynes_prai
rie_project.html, accessed May 2012.
Warner, W., “A Brief History of Driver Education”, Journal of Traffic Safety Education,
vol. 19, no. 2, pp. 13-15, January 1972.

84
Williams, A., Weinberg, K., Fields, M., and Ferguson, S., “Current Requirements for
Getting a Drivers License in the United States”, Journal of Safety Research, vol. 27, no.
2, pp. 93-101, Summer 1996.
Van Liere, M., “Assembly of a Gate for Use in Animal Traffic”, United States Patent and
Trademark Office, Patent No. 7,640,891, date of patent: January 5, 2012.