Embed Size (px)
Citation preview

International Journal of Science, Technology and Society 2015; 3(6): 265-278
Published online October 10, 2015 (http://www.sciencepublishinggroup.com/j/ijsts)
doi: 10.11648/j.ijsts.20150306.11
ISSN: 2330-7412 (Print); ISSN: 2330-7420 (Online)
Assessment of Ambient Day Indoor and Outdoor Noise Levels in University of Science and Technology Port Harcourt
Tubonimi Joseph Kio Ideriah
Institute of Pollution Studies, Rivers State University of Science and Technology Nkpolu Oroworukwo Port Harcourt, Rivers State, Nigeria
Email address: [email protected] (T. J. K. Ideriah)
To cite this article: Tubonimi Joseph Kio Ideriah. Assessment of Ambient Day Indoor and Outdoor Noise Levels in University of Science and Technology Port
Harcourt. International Journal of Science, Technology and Society. Vol. 3, No. 6, 2015, pp. 265-278. doi: 10.11648/j.ijsts.20150306.11
Abstract: Indoors and outdoors ambient noise levels were measured within the RSUST to determine the levels and sources
of noise pollution within the university campus in order to ascertain if the noise level has exceeded acceptable limit to affect
the air quality of the environment and also access the impact of various activities in the university with regard to noise
pollution. Noise levels were measured with a digital sound level meter model 407730 manufactured by EXTECH instruments
with “A” weighting scale. The measured noise levels ranged between 47.8 dB (A) and 103.2 dB (A). The mean noise levels
recorded around the 2000 KVA and 1275 KVA generators exceeded the permissible noise levels guideline of 90dB (A)
recommended by Occupational Safety Health Agency and Federal Ministry of Environment while all the mean noise levels
measured within the university exceeded the guideline values of 35 – 55 dB (A) set by World Health Organization. High
positive correlation coefficients between indoor and outdoor were recorded. Analysis of variance on noise levels between
hostels, road junctions, gates and Departments showed significant difference (P <0.05). Noise levels at outdoors were generally
higher than indoors. t - test on the mean noise levels between indoor and outdoor were not significant (P > 0.05) but t - test
between maximum and minimum noise levels and between the Departments were significant (P < 0.05). The measured noise
levels were typical of urban communities in developing countries. In addition to steady electricity supply from National grid,
solar plant or sound proof generators were recommended.
Keywords: Ambient, Noise, University, Road Junction, Occupational Exposure, Sound Meter, Indoor, Outdoor
1. Introduction
The study area University of Science and Technology is
located within Port Harcourt metropolis in the Niger Delta
sedimentary basin of Nigeria. Port Harcourt lies within
latitudes 4° 43
′ 07
″ and 4
° 54
′ 32
″ N and longitudes 6
° 56
′ 04
″
and 7° 03
′ 20
″ E with a mean annual rainfall of over 2000mm
and mean annual temperature of 29°C (NMS, 1998). The
university has staff strength of 1, 850 and a student
population of 15, 376 (RSUST, 2013).
There is widespread and increasing excessive noise
exposure everywhere especially in developing countries. In
Africa, there are high noise expose levels in the formal
(manufacturing and mining) and informal occupational sector
(small industries such as vehicle repairing, metal - working
and milling) as well as the non - occupational sector (urban
environment and leisure). Awareness of hazard amongst
employers, employees and the public is however very low.
The need for studies regarding urban noise pollution and its
consequences on the environment has motivated various
researchers in several countries (Ugwunyi et al., 2005;
Oyedepo and Saadu, 2009). Many researchers have reported
that road traffic is the predominant noise source in urban areas
(Bisio, 1996; Nelson, 1998). Singh and Jain (1995) reported
that the measurements of noise levels in residential, industrial
and commercial areas in the capital city of India, Delhi
commercial areas have the highest noise levels followed by
industrial and residential areas. This is contrary to the finding
of Oyedepo and Saadu (2009) who carried out measurement of
noise levels in busy road junctions, residential, industrial,
commercial and passenger loading parks areas in Ilorin city,
Nigeria. The result shows that industrial areas have the highest
noise levels followed by busy roads and junctions, passengers
loading parks and commercial areas. It has been generally
accepted that noise pollution, particularly road traffic noise is
rapidly expanding in cities such as those of South - eastern

266 Tubonimi Joseph Kio Ideriah: Assessment of Ambient Day Indoor and Outdoor Noise Levels in University of
Science and Technology Port Harcourt
Nigeria (Onnu, 1992).
Source: Urban & Regional Planning Dept. RSUST, P.H.
Fig. 1. Map of RSUST showing the sampling stations.
Noise does not only disturb sleep, interrupt conversation,
and create stress and annoyance in the general population; it
also reduces the efficiency and output of workers (Sinha and
Sridharan, 1999). Noise is known to cause hearing loss,
which at times may be irreversible. NIOSH (1996) attributed
hearing loss among workers to their exposure in the
industries while Smooreburg et al. (2003) identified
prolonged equivalent daily exposures of at least 85 dB (A) as

International Journal of Science, Technology and Society 2015; 3(6): 265-278 267
a contributing factor to increased blood pressure and
hypertension. Loss of hearing due to exposure to noise can
equally lead to tinnitus that is buzzing in the ear while
insomnia and tiring can also be caused by noise exposure.
Occupational hearing loss is often being overlooked because
it usually occurs insidiously without dramatic consequence
such as bleeding, deformity or death (Berger, 2000).
Environmental noise is a major issue in most countries
especially in heavily populated or industrialized areas. Its
sources and adverse effect on humans are varied and can
range from sleep disturbances to increased stress levels,
potentially leading to more major problem such as heart
disease in the long run.
Noise pollution affects both health and behavior.
Unwanted sound (noise) can damage psychological health.
Noise pollution can cause hypertension, high stress levels,
tinnitus, hearing loss, sleep disturbances and other harmful
effects (Rosen and Olin, 1995).
The most important factors raising noise pollution in
urban areas include interalia appliances, vehicular traffic,
neighbourhood electrical appliances, television and music
systems, public address systems, railway and air traffic and
generating sets. Even researchers fall prey to the noise
generated by household equipments (Singh and Daver,
2004).
Noise in big cities is considered by the World Health
Organization (WHO) to be the third most hazardous type of
pollution, after air and water pollution (WHO, 2005). A study
carried out by Goswami et al., (2011) on traffic noise of two
university campuses in Balasore, India, found noise levels
beyond permissible limit of 70dB (A), during the day time.
With increase in student population, staff and vehicular
activities, the noise levels in RSUST campus is expected to
increase. Thakur, (2006) in the study of noise around an
educational institution reported that, there is need for proper
land - use planning when traffic corridors are built in silence
zone areas.
In most developing countries, occupational noise and
urban, environmental noise (especially traffic noise) are
increasing risk factors for hearing impairment. Many of these
countries often lack both effective legislation against noise
and programme to prevent noise - induced hearing loss
(Demian et al., 2008). Where these exist, they are often
poorly enforced and implemented. Most especially in Nigeria
none is at high level.
Noise pollution can cause hearing impairment, both
temporarily and permanently noise can cause sleepless night
which may lead to students not being able to concentrate
during the day. People generate noise by the use of
generators, cars, machines and students making noise during
and after lectures. Indoor noise can be caused by machines,
building activities and music performances especially in
some workplaces. Noise induced hearing loss can be caused
by outside (e.g. trains) or inside (e.g. music) noise. In
animals, noise can increase the risk of death by altering
predator or prey detecting and avoidance, interfere with
reproduction and navigator and contribute to permanent
hearing loss (Jefferson, 2013).
It is therefore important to determine the level and sources
of pollution within the university campus in order to
ascertain if the noise level has exceeded acceptable limit.
This study therefore aims to measure and obtain data and
determine the major sources of noise within the university
campus.
2. Materials and Method
2.1. Measurement Instrument and Method
A Cole - Parmer Extech Model 407730 sound level meter
was used to measure the noise levels within the campus. The
equipment has a 2dB accuracy with 0.1dB resolution and a
measuring range of 40 – 130 dB.
Table 1. Geographical Location of Measurement Sites.
Location Geographical Locations
Northings (Lat.) Eastings (Long.)
Main Gate 04° 48′ 14.1″ 006° 59′ 07. 2″
Main Gate car park 04° 48′ 12.7″ 006° 59′ 09. 8″
Azikiwe Back Gate 04° 47′ 36.6″ 006° 59′ 03.0″
Chemistry Lab 1 inside 04° 47′ 52.2″ 006° 58′ 44. 9″
Chemistry Lab 1 outside 04° 47′ 52.3″ 006° 58′ 45. 4″
Chemistry Dept upstairs 04° 47′ 53.0″ 006° 58′ 46. 4″
Physics Lab 1 inside 04° 47′ 53.3″ 006° 58′ 44. 7″
Physics Lab 1 outside 04° 47′ 54.3″ 006° 58′ 45. 6″
Physics dept upstairs 04° 47′ 54.3″ 006° 58′ 46. 2″
Medical Lab Dept 04° 47′ 50.5″ 006° 58′ 46. 2″
Biology Lab 1 outside 04° 47′ 49.5″ 006° 58′ 45. 6″
Biology Lab 1 inside 04° 47′ 49.9″ 006° 58′ 45. 5″
Love garden 04° 47′ 34.7″ 006° 58′ 56.1″
UST Farm Site 04° 48′ 09.9″ 006° 58′ 37.8″
Hostel B (Boys) 04° 47′ 34.7″ 006° 58′ 59.1″
Hostel C (Girls) 04° 47′ 29.7″ 006° 58′ 55.8″
Outside F 04° 47′ 41.8″ 006° 58′ 55.6″
Front of law 04° 47′ 57.3″ 006° 58′ 39.2″
Business Education 04° 47′ 17.6″ 006° 58′ 51.8″
Urban & Reg. Plan 04° 47′ 15.1″ 006° 58′ 53.2″
Estate Management 04° 47′ 16.7″ 006° 58′ 55.0″
Chemical/Pet. Chem Eng. 04° 47′ 44.1″ 006° 58′ 46.3″
Civil Engineering 04° 47′ 42.0″ 006° 58′ 45.2″
Electrical Engineering 04° 47′ 40.5″ 006° 58′ 45.6″
Mechanical Engineering 04° 47′ 50.4″ 006° 58′ 50.4″
NEH 04° 47′ 46.2″ 006° 58′ 46.5″
Eco bank Premises 04° 47′ 42.3″ 006° 58′ 42.8″
MDR Outside 04° 47′ 39.7″ 006° 58′ 43.5″
MDR Inside 04° 47′ 38.7″ 006° 58′ 41.3″
EN 10 Outside 04° 47′ 40.7″ 006° 58′ 40.1″
EN 10 Inside 04° 47′ 41.9″ 006° 58′ 40.8″
ISS Gate 04° 48′ 22.4″ 006° 58′ 50.1″
ISS senior block 04° 48′ 21.5″ 006° 58′ 55.4″
ISS field 04° 48′ 23.6″ 006° 58′ 51.2″
Library 04° 48′ 02.6″ 006° 58′ 41.1″
Security village Power Min. 04° 48′ 22.5″ 006° 58′ 51.3″
Security village Deeper life 04° 48′ 20.9″ 006° 59′ 02.1″
Security village by car park 04° 48′ 17.5″ 006° 59′ 07.0″
The equipment measures noise via a microphone probe
that generates signal approximately proportional to the
located sound waves. The meter has a weighting of “A” and
“C” and “slow” and “fast” modes. The measurements were
made using the slow mode and “A” weighting. With “A”
268 Tubonimi Joseph Kio Ideriah: Assessment of Ambient Day Indoor and Outdoor Noise Levels in University of
Science and Technology Port Harcourt
weighting the meter responds as human ear. It is used for
environmental measurements, Occupational Safety Health
Agency (OSHA) regulatory testing, law enforcement and
work place. Measurements were made outdoors. The meter
was hand held at a height of 1.5 meters above ground and 3m
away from buildings or other sound reflecting sources.
Geographical positioning system (GPS) was used to
determine the positions of the selected areas.
2.2. Measurement Locations/Duration/Frequency
This study will cover Hostels B, F & G (boys); Hostel C
(girls), lecture halls of Faculties of Engineering, Science,
Technical and Science, Environmental Management and Law.
Also measurements will be made along major roads junctions
in the campus, Farm Site and Library, International
secondary school (ISS) and Security village. The noise levels
(indoor and outdoor) at the selected areas were monitored
daily within the hours of 8am to 5pm for 2 months.
3. Results and Discussion
3.1. Results
The results of noise levels measured in Rivers State
University of Science and Technology are presented in
Tables 3.1 – 3.7 and Figs 3.1 – 3.8. The ANOVA results and
correlation matrices are shown in Tables 3.8 – 3.10.
Table 3.1 and Fig 3.1 show data obtained around the major
university gates and car park. The results ranged from 73.1 –
85.4 dB (A) with a maximum mean of 80.2 dB (A) at the
main gate, 70 - 83.0 dB (A) with a maximum mean of 77.4
dB (A) at the main car park and 70.8 - 85.0 dB (A) with a
maximum mean of 78.3 dB (A) at Azikiwe back gate.
Table 3.2 and Fig. 3.2 show the results obtained at various
major road junctions. The noise levels ranged from 57.9 -
79.9dB (A) at Chapel of Redemption roundabout, 57.0 -
81.4dB (A) at Love Garden, 78.5 – 79.1dB (A) at Fidelity
Bank, 61.5 - 79.7dB (A) at ITC, 57.5 – 78.4dB (A) at Library
roundabout, 51.9 - 68.3 dB (A) at Vice Chancellor’s Lodge,
62.0 – 73.4dB (A) at PG/Arena, 61.8 – 78.0dB (A) at TFC
Building and 52.2 – 81.1dB (A) at RACAM with a maximum
mean of 78.8dB (A).
Table 3.3 and Fig. 3.3 show the mean indoor and outdoor
noise levels at various Departments in the University. The
indoor noise levels ranged from 50.4 dB (A) (Law) to 83.0
dB (A) (Physics) with a maximum mean of 81.3 dB (A)
(Physics). Outdoor noise levels ranged from 54.4 dB (A)
(Business Education) to 85.8 dB (A) (Hostel F) with a
maximum mean of 81.0 dB (A) (Hostel C).
Table 3.1. Ambient Noise Levels at University Gates.
Location Date Time Noise Levels dB (A)
Maximum Minimum Mean
Main Gate
02/04/15 07: 55am 81.5 74.6 78.1
03/04/15 11: 44am 82.6 75.2 78.9
07/04/15 10: 22am 84.4 73.1 78.8
08/04/15 02: 23pm 85.4 75.0 80.2
10/04/15 02: 03pm 83.3 74.8 79.1
28/04/15 02: 19pm 83.3 74.8 79.1
30/04/15 02: 30pm 81.5 74.5 78.0
01/05/15 03: 38pm 82.8 75.2 79.0
Main Gate Car park
02/04/15 08: 00am 81.7 70.4 76.1
03/04/15 11: 39am 82.9 71.8 77.4
07/04/15 11: 51am 81.6 70.4 76.0
08/04/15 01: 56pm 81.8 70.7 76.3
10/04/15 02: 28pm 83.0 71.2 77.1
28/04/15 02: 29pm 80.8 70.7 75.8
30/04/15 02: 37pm 81.8 71.6 76.7
01/05/15 03: 33pm 82.2 71.2 76.7
Azikiwe Back Gate
08/04/15 08: 35am 84.5 70.9 77.7
09/04/15 10: 52am 84.5 71.0 77.8
10/04/15 01: 11pm 83.8 71.0 77.4
28/04/15 02: 09pm 85.0 71.6 78.3
30/04/15 02: 30pm 84.8 70.8 77.8
05/05/15 02: 44pm 84.7 71.2 78.0
Table 3.2. Ambient Noise Levels at Major Road Junctions in University of Science and Technology.
Location Date Time Noise Levels dB (A)
Maximum Minimum Mean
C/Redemption Roundabout 07/04/15 08: 08am 78.8 57.9 68.4
10/04/15 11: 54am 79.4 58.6 69.0
28/04/15 11: 58am 78.2 58.2 68.2
30/04/15 01: 46pm 79.9 59.6 69.8
01/05/15 03: 48pm 79.6 58.2 68.9
Love Garden 01/04/15 08: 26am 78.5 57.0 67.8
03/04/15 12: 05pm 78.8 57.2 68.0

International Journal of Science, Technology and Society 2015; 3(6): 265-278 269
Location Date Time Noise Levels dB (A)
Maximum Minimum Mean
12: 10pm 78.2 57.6 67.9
07/04/15 12: 21pm 78.0 57.5 67.8
08/04/15 01: 04pm 78.0 57.2 67.6
09/04/15 01: 10pm 78.0 57.2 67.6
28/04/15 01: 20pm 81.4 64.7 73.1
29/04/15 02: 51pm 78.1 57.6 67.9
30/04/15 03: 04pm 77.9 57.1 67.5
05/05/15 03: 33pm 78.4 57.8 68.1
Fidelity Bank 07/04/15 12: 28 79.1 78.5 78.8
Info Tech Centre 28/04/15 07: 46am 79.7 61.5 70.6
01/05/15 08: 34am 76.2 62.0 69.1
04/05/15 11: 49am 76.5 62.2 69.4
Library Roundabout 07/04/15 12: 13pm 78.4 57.8 68.1
10/04/15 01: 22pm 77.9 57.7 67.8
01/05/15 04: 07pm 77.6 57.5 67.6
VC Lodge 02/04/15 03: 00pm 68.3 51.9 60.1
P.G Sch. / Arena 03/04/15 08: 20am 73.0 62.3 67.7
10/04/15 10: 30am 72.3 62.5 67.4
12: 00pm 72.6 62.1 67.4
28/04/15 01: 30pm 73.2 63.0 68.1
30/04/15 02: 50pm 72.2 62.2 67.2
03: 00pm 73.4 62.0 67.7
04: 00pm 72.1 62.1 67.1
TFC Building 01/04/15 09: 18am 77.7 62.1 69.9
07/04/15 11: 04am 77.2 62.5 69.9
10/04/15 10: 20am 77.5 62.7 70.1
10: 25am 77.3 62.3 69.8
28/04/15 10: 49am 77.2 62.5 69.9
29/04/15 01.42pm 77.6 61.8 69.7
02: 20pm 76.9 62.0 69.5
03: 02pm 77.2 62.3 69.8
05/05/15 03: 08pm 78.0 62.9 70.5
RACAM 03/04/15 10: 17am 80.0 52.7 66.4
12: 00am 79.3 52.6 66.0
08/04/15 01: 00pm 79.0 52.2 65.6
09/04/15 01: 30pm 81.1 59.3 70.2
28/04/15 02: 00pm 79.4 52.5 66.0
02: 30pm 79.6 52.6 66.1
03: 30pm 79.8 52.7 66.3
04/05/15 05: 00pm 79.6 52.5 66.1
Table 3.3. Indoor and Outdoor Mean Noise Levels in Various Departments in the University of Science and Technology.
Department/Location Source Noise Levels dB (A)
Mean Maximum Minimum
Chemistry Lab. I Indoor 80.3 69.2 74.8
Outdoor 78.4 75.9 77.2
Physics Lab. I Indoor 83.1 79.4 81.3
Outdoor 78.6 68.4 73.5
Biology Lab. I Indoor 73.2 70.4 71.8
Outdoor 75.9 64.1 70.0
SC 10 Indoor 78.0 63.3 70.7
Outdoor 79.6 71.2 75.4
SC 7 Indoor 79.6 64.8 75.4
Outdoor 77.6 65.5 71.6
Hostels
B (Boys) 79.6 69.8 74.7
C (Girls) 82.8 79.1 81.0
F (Outdoor) 85.8 62.8 74.3
G (Outdoor) 84.4 68.1 76.3
Law Indoor (LC 4, 5, 7) 67.0 50.4 58.7
Outdoor 80.5 62.3 71.4
Library Indoor 78.4 59.8 69.1
Outdoor 79.1 63.8 71.5
Chem./Pet. Chem. Eng. Indoor 80.1 58.2 69.2
Outdoor 61.9 58.1 60.0
Civil Eng Indoor 71.4 53.6 62.5

270 Tubonimi Joseph Kio Ideriah: Assessment of Ambient Day Indoor and Outdoor Noise Levels in University of
Science and Technology Port Harcourt
Department/Location Source Noise Levels dB (A)
Mean Maximum Minimum
Outdoor 78.0 55.3 66.7
Electrical Eng Indoor 71.0 57.3 64.2
Outdoor 79.3 62.9 71.1
Mechanical Eng Indoor 75.0 61.4 68.2
Outdoor 59.9 55.2 57.6
EN 10 Indoor 81.1 72.4 76.8
Outdoor 79.8 71.8 75.8
MDR Indoor 60.6 58.8 59.7
Outdoor 74.8 61.2 68.0
Business Education Indoor 80.4 62.4 71.4
Outdoor 74.2 54.4 64.3
Urban & Reg. Planning Indoor 77.0 53.8 65.4
Outdoor 81.7 58.6 70.2
Estate Management Indoor 76.3 55.2 65.8
Outdoor 80.7 58.3 69.5
Tech. & Science Indoor 71.1 53.8 62.5
Outdoor 75.8 55.2 65.5
Fig. 3.1. Variations of Maximum Noise Levels with Time and Dates Around University Gates.
Fig. 3.2. Variations of Maximum Noise Levels with Time and Date along Major Road Junctions.
787980818283848586
08
:am
11
:44
am
10
:20
am
02
:20
pm
02
:30
pm
02
:45
pm
03
:00
pm
03
:30
pm
2-Apr 3-Apr 7-Apr 8-Apr 10-Apr 28-Apr 30-Apr 1-May
Times/Dates
No
ise
Le
ve
ls d
B(A
)
Main Gate
Main Gate Park
Azik Back Gate
66687072747678808284
08:3
0am
12:0
0pm
12:1
0pm
12:2
0pm
01:0
0pm
01:1
0pm
01:2
0pm
02:5
0pm
03:0
0pm
03:3
0pm
1-Apr 2-Apr 3-Apr 7-Apr 8-Apr 9-Apr 28-
Apr
29-
Apr
30-
Apr
5-May
Times/Dates
No
ise L
evels
dB
(A)
Chapel R/about
Love Garden
Info Tech Centre
Library R/about
P.G/Arena
TFC Building
RACAM

International Journal of Science, Technology and Society 2015; 3(6): 265-278 271
Fig. 3.3. Comparison Between Indoor and Outdoor Noise Levels at Various Departments.
Table 3.4 and Fig. 3.4 show the noise levels ranging from
68.2 – 81.4 dB (A) at hostel B, 64.1 – 82.8 dB (A) at Hostel
C, 63.2 - 86.4 dB (A) at Hostel F and 68.1 - 86.8 dB (A) at
Hostel G. In all, the results ranged from 62.7 dB (A)
(between Hostels F & G) to 86.8 dB (A) (Hostel F) with a
mean maximum of 81.0dB (A) (Hostel C).
Table 3.5 and Fig. 3.5 show the results of measurements at
the electricity generating power plant houses. The ambient
noise levels ranged from 98.2 – 103.2 dB (A) with a
maximum mean of 100.4 dB (A), at 50m away, it ranged
between 70.0 dB (A) and 83.6 dB (A) with a maximum mean
of 76.8 dB (A), at 100m away it ranged from 58.5 –78.4 dB
(A) with a maximum mean of 68.6 dB (A).
The results of noise levels obtained at International
Secondary School varied from 54.5 dB (A) - 72.7 dB (A) at
the gate, 69.0 dB (A) - 80.1 dB (A) at the senior block, 69.0
dB (A) - 82.8 dB (A) at the Junior block and 70.0 dB (A) –
84.6 dB (A) at the field with a maximum mean of 77.4 dB (A)
(Table 3.6 and Fig. 3.6).
The noise levels results measured at the Farm site and
Security village ranged from 54.0 - 67.5 dB (A) at Power
Outreach Ministry, 50.1 - 73.8 dB (A) at Deeper Life Church,
53.0 - 56.8 dB (A) behind main gate car park and 54.2 - 71.2
dB (A) at the Farm site (Table 3.7 and Fig. 3.7).
Table 3.4. Noise Levels Measured at the Hostels.
Location Date Time Noise Levels dB (A)
Mean Maximum Minimum
Hostel B (Boys)
09/04/015 08: 40am 81.4 68.4 74.9
10/04/015 11: 00am 80.2 68.5 74.4
28/04/015 01: 05pm 80.1 68.2 74.2
30/04/015 02: 30pm 80.5 69.7 75.1
05/05/015 02: 45pm 79.6 69.8 74.7
Hotel C (Girls)
03/04/015 08: 45am 81.7 65.6 73.7
07/04/015 11: 15am 82.8 79.1 81.0
08/04/015 01: 30pm 79.9 64.7 72.3
10/04/015 12: 00pm 81.0 64.7 72.9
28/04/015 12: 50pm 81.1 64.1 72.1
30/04/015 02: 00pm 81.0 64.7 72.9
05/05/015 02: 50pm 78.9 65.2 72.1
Outside F
Inside F
Center of F & G
At the Gate of F & G
Center of F & G
At the gate of F and G
Inside F
Inside G
Inside F
Inside G
Center of F & G
The gate of F & G
Middle of F & G
Centre of F & G
01/04/015
1.50pm 86.7 63.5 75.1
1: 55pm 85.8 62.8 74.3
2: 00pm 86.2 63.2 74.7
2: 15pm 85.5 62.7 74.1
02/04/015 01: 30pm 86.4 63.5 75.0
03/04/015 12: 20pm 85.8 63.8 74.8
07/04/015 01: 00pm 86.8 63.6 75.2
01: 15pm 84.4 68.1 76.3
09/04/015 02: 00pm 85.0 68.3 76.7
02: 10pm 85.5 68.5 77.0
28/04/015 02: 50pm 84.7 69.0 76.9
29/04/015 03: 20pm 84.9 68.4 76.7
30/04/015 11: 50am 85.5 68.7 77.1
05/05/015 08: 30am 84.9 68.9 76.9
0
10
20
30
4050
60
70
80
90
Chem
istry
Lab.
I
Phy
sics
Lab
. I
Biology
Lab
. I
SC 1
0
SC 7
Law
Libr
ary
Chem
./Pet
. Che
m.
Civil
Electric
al
Mec
hanica
l
EN 1
0
MDR
Bus
ines
s Edu
.
Urb
an &
Reg
. Plan
Estat
e Mgt.
Tech.
& S
cien
ce
Departments
No
ise L
evels
dB
(A)
Indoor
Outdoor

272 Tubonimi Joseph Kio Ideriah: Assessment of Ambient Day Indoor and Outdoor Noise Levels in University of
Science and Technology Port Harcourt
Fig. 3.4. Variations of Maximum Noise Levels with Time and Dates at Hostels.
Table 3.5. Ambient Noise Levels around University Electricity Generating Plant Houses.
Location Date Time
Noise Levels dB (A)
Mean Maximum Minimum
Old site New site Old site New site
0m
07/04/15 08: 30am 102.8 103.0 98.4 100.0 101.1
08/04/15 09: 00am 103.2 101.3 98.2 100.1 100.7
10/04/15 09: 30am 102.6 101.0 98.5 100.3 100.6
30/04/15 11: 00am 100.0 102.0 99.8 99.7 100.4
05/05/15 11: 15am 101.1 101.2 99.7 99.9 100.5
50m
07/04/15 11: 30am 83.6 80.3 70.1 73.0 76.8
08/04/15 12: 00pm 80.9 80.3 70.0 73.5 76.2
10/04/15 12: 30pm 81.1 80.0 70.5 73 2 76.2
05/05/15 12: 50pm 81.0 80.1 70.3 73.1 76.1
100m
07/04/15 12: 30pm 76.6 78.0 59.5 59.8 68.5
08/04/15 01: 00pm 76.5 78.4 59.7 59.7 68.6
10/04/15 01: 15pm 76.2 78.2 59.2 58.7 68.i
30/04/15 01: 30pm 76.0 78.2 59.5 58.5 68.1
Fig. 3.5. Variations of Maximum Generator Noise Levels with Distance and Time.
74
76
78
80
82
84
86
88
08:4
5am
11:1
5am
01:3
0pm
12:0
0pm
12:5
0pm
02:0
0pm
02:5
0pm
03:2
0pm
3:3
0pm
1-Apr 2-Apr 3-Apr 7-Apr 8-Apr 10-Apr 28-Apr 30-Apr 5-May
Times/Dates
No
ise L
evels
dB
(A)
Hostel B (Boys)
Hostel C (Girls)
Hostel F/G(Boys)
0
20
40
60
80
100
120
08:3
0am
09:0
0am
09:3
0am
11:0
0am
11:1
5am
11:3
0am
12:0
0pm
12:3
0pm
12:5
0pm
12:3
0pm
01:0
0pm
01:1
5pm
01:3
0pm
0m 50m 100m
Distance/ Time
No
ise L
evels
dB
(A)
Generator Old site
Generator New site

International Journal of Science, Technology and Society 2015; 3(6): 265-278 273
Table 3.6. Noise levels at International Secondary School (ISS).
Location Date Time Noise Levels dB (A)
Maximum Minimum Mean
Gate
06/05/015
09: 35am 71.8 54.6 63.2
12: 05pm 72.0 54.5 63.3
02: 41pm 71.9 54.8 63.4
07/05/015
08: 26am 72.7 54.7 63.7
12: 10pm 72.1 54.9 63.5
02: 35pm 72.3 54.8 63.6
Senior block
06/05/015
09: 43am 79.7 68.9 74.3
12: 10pm 80.1 69.0 74.6
02: 47pm 79.4 69.3 74.4
07/05/015
08: 34am 79.6 69.1 74.4
12: 18pm 79.8 69.1 74.5
02: 42pm 79.7 69.0 74.4
Junior block
06/05/015
09: 48am 82.8 69.2 76.0
12: 15pm 82.1 69.8 76.0
02: 52pm 82.4 69.3 75.9
07/05/015
08: 38am 82.7 69.3 76.0
12: 22pm 82.5 69.5 76.0
02: 47pm 82.4 69.0 75.7
Field
06/05/015
09: 54am 84.5 70.0 77.3
12: 22pm 84.1 70.2 77.2
03: 00pm 84.4 70.0 77.2
07/05/015
08: 45am 84.1 70.1 77.1
12: 27pm 84.2 70.1 77.2
02: 54pm 84.6 70.2 77.4
Fig. 3.6. Variations of Maximum Noise Levels with Time and Date at ISS.
Table 3.7. Noise Levels Measured at Farm Site and Security village in RSUST.
Location Date Time Noise Levels dB (A)
Maximum Minimum Mean
Power outreach Ministry
06/05/015 10: 08am 67.3 54.0 60.7
03: 11pm 67.1 54.2 60.8
07/05/015
08: 17am 67.3 54.3 60.8
12: 39pm 67.2 54.1 60.7
03: 10pm 67.5 54.0 60.8
Deeper life Church
06/05/015 10: 29am 73.8 50.2 62.0
03: 16pm 73.5 50.2 61.9
07/05/015
08: 12am 73.6 50.1 61.9
12: 43pm 73.3 50.4 61.9
03: 15pm 73.5 50.5 62.0
Behind Main Gate Park
06/05/015 10: 37am 56.8 53.0 54.9
03: 20pm 56.6 53.5 55.1
07/05/015
08: 06am 56.3 53.2 54.8
01: 01pm 56.2 53.3 54.8
03: 18pm 56.1 53.0 54.6
65
70
75
80
85
90
09:30am 12:00pm 02:40pm 08:30am 12:00pm 02:40pm
6-May 7-May
Times/Dates
No
ise L
evels
dB
(A)
Gate
Snr. Block
Jnr. Block
Field

274 Tubonimi Joseph Kio Ideriah: Assessment of Ambient Day Indoor and Outdoor Noise Levels in University of
Science and Technology Port Harcourt
Location Date Time Noise Levels dB (A)
Maximum Minimum Mean
RSUST Farm Site
02/04/015 08: 30am 69.8 54.2 62.0
07/04/015 12: 30pm 70.4 54.7 62.6
10/04/015 01: 00pm 70.2 55.9 63.1
28/04/015 03: 00pm 71.2 54.6 62.9
01/05/015 03: 50pm 70.1 55.8 63.0
Fig. 3.7. Variations of Maximum Noise Levels with Time and Date at Farm/Security Village.
Fig. 3.8. Comparison of Maximum Noise Levels Between Departments.
3.2. Discussion
The noise levels at the main gate were found to be higher
than that of Azikiwe gate and the main gate car park. This is
due to vehicular activities and generators used by business
centers outside the gate. The ANOVA between the noise levels
at the gates and car park showed significant difference
(P<0.05).
Along the major roads, Love Garden and RACAM were
found to have high noise levels compared to other parts of the
roads. This could be due to the various activities such as
companies publicity and advertisements of products, vehicle
traffic, landing helicopter, etc. along the major roads, the
ANOVA showed significant difference (P<0.05).
At the students’ hostels, the noise levels were found to be
the highest at F & G followed by C while hostel B had the
lowest noise levels. This observation was a result of students
playing football at the field beside F & G and loud
conversation/communications inside F & G. Hostel C has
higher noise level than B because of noise from the business
center. At the hostels, though t - test between boys and girls
hostels showed no significant difference (P<0.05) but ANOVA
between the hostels showed significant difference (P<0.05).
The variations of noise levels at the generator houses
indicate a reducing trend away from the generator. It was
found that the noise levels at the new site were higher at six of
the measurement times while the old site noise levels were
also higher at six of the measurement times. The t - test
between the mean noise levels of the two generator sites
showed no significant difference (P<0.5). There are two
functional 2000KVA and 1275 KVA generators at each site of
the University. The difference in noise levels at the generator
houses could be due to the generator capacity in operation at
the time of measurement. The alternate use of the two
generators could also have influenced the variations in noise
0
10
20
30
40
50
60
70
80
08:30am 12:30pm 01:00pm 03:00pm 03:50pm
6-May 7-May
Times/Dates
No
ise L
evels
dB
(A) UST Farm
Power Ministry
Deeper Life
Back Main Park
0
10
20
30
40
50
60
70
80
90
100
1 2 3 4 5 6 7 8 9
No. of Measurements
No
ise L
evels
dB
(A)
Chemistry Lab I
Physics Lab I
Biology Lab I
Med Lab Sc
Chem/Pet
Civil
Electrical
Mechanical

International Journal of Science, Technology and Society 2015; 3(6): 265-278 275
levels.
At the International Secondary School, the nose level at the
field were found to be highest followed by junior block. The
noise levels at the field were high because in addition to wind
movement, students were playing on the field during some
measurement period. The higher noise levels at junior block
could be as a result of uncontrolled conversations, shouts and
play by the junior students. The ANOVA showed significant
difference (P<0.5). The noise measured at the farm and
security village showed that deeper life church site had high
noise levels. This is due to church service with enhanced
sound instrument. The noise levels at UST farm site were
influenced by vehicles from Agip road and Agip helicopters.
ANOVA showed significant difference between farm and
security village noise levels.
Comparison of noise levels between Departments showed
highest at mechanical workshop. This is due to heavy
machines used in the workshop. ANOVA on inter faculties
noise levels showed significant difference between faculties of
Science and Engineering (P<0.5) while the intra department
noise level in science with date showed significant difference
(P<0.05). The trend of noise levels at the various Departments
followed the order:
Mechanical > Physics > Urban and Regional > Chemistry >
Medical Laboratory > Estate Management > Chemical/
Petrochem Eng. > Electrical Eng. > Civil Eng. > Law >
Biology > Bus Education > Technical and Science and the
trend at lecture rooms followed the order: EN10 > SC10 > SC
7 > NEH > MDR.
The t - test between maximum and minimum noise levels at
various departments showed significant difference (P <0.05)
and positive correlation (r = 0. 5179).
Outdoor noise levels were generally higher than indoor
levels, except at physics Department and SC7 which were
influenced by the activity of gardens using Lawn mowers
behind the physics laboratory during one of the measurement
days. This observation is not in agreement with the report of
Sonibare et. al. (2004). The indoor noise levels were higher at
7 locations while the outdoor noise levels were higher at 10
locations (Table 3.3). Generally, the outdoor levels were higher
than indoor but t - test showed no significant difference (P >
0.5) between them.
The noise levels measured within the university were
compared with national and international guideline values. The
noise levels measured at the university main electricity
generating plants exceeded both national and international
guidelines.
However, the mean noise levels measured in all parts of the
university exceeded the international guideline value
recommended for a school (learning) environment.
WHO (1999) recommended guide line values of 35 dB (A)
for school class rooms (indoors) and 55 dB (A) (school
outdoors) for community noise. London Times (1968) reported
85 dB (A), while Federal Ministry of Environment (FMEnv,
1991) Nigeria recommended 90dB (A) for an 8 hour working
period.
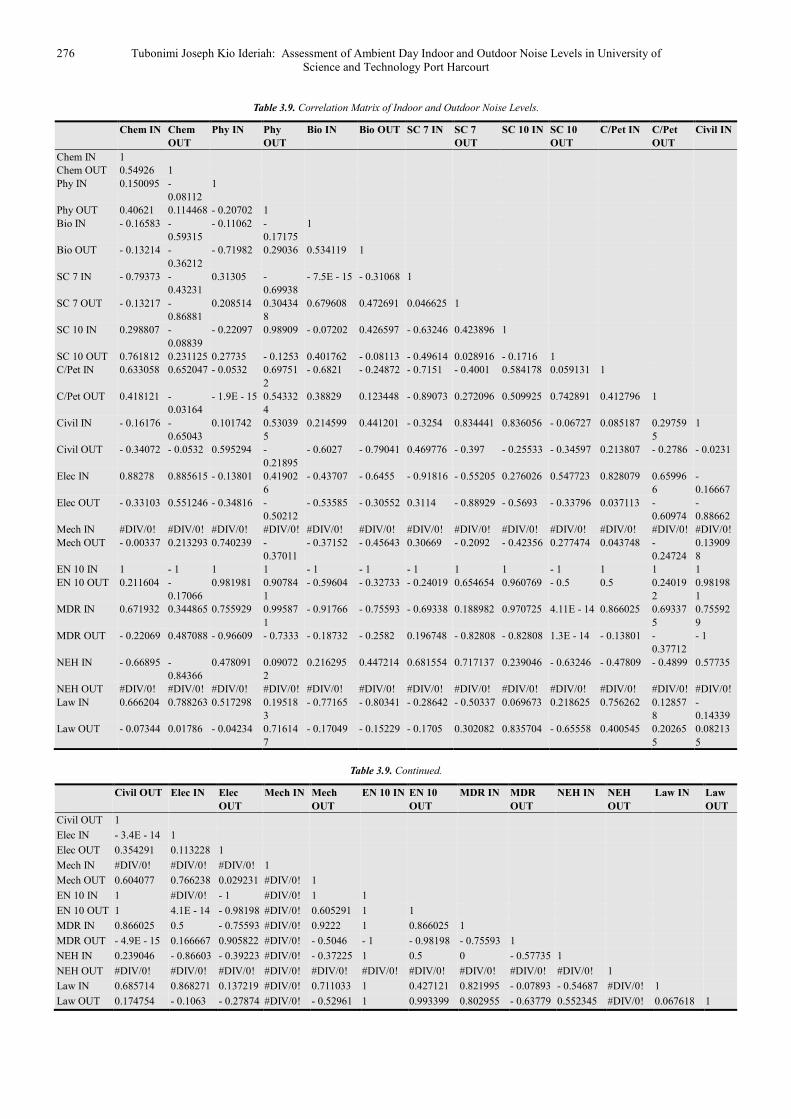
Correlation matrices (Tables 3.9 and 3.10) show positive
and negative correlation coefficients. The negative correlation
coefficient between indoors and outdoors locations suggest
little or no impact of activities outdoors on the indoor
environment’s noise levels in the university while the positive
correlation coefficients indicate serious impact. High positive
correlation coefficients between indoors and outdoors were
recorded between physics indoor and EN10 outdoor (r =
0.9820), physics outdoor and SC10 indoor (r = 0.9891),
physics outdoor and EN10 indoor (r = 0.9078), physics
outdoor and MDR indoor (r = 0.9959), SC10 indoor and EN10
outdoor (r = 0.9608), SC10 indoor and MDR indoor (r =
0.9707), Civil Indoor and EN10 outdoor (r = 0.9820),
Electrical outdoor and MDR outdoor (r = 0.9222), Mechanical
outdoor and MDR indoor (r= 0.9222), EN10 outdoor and Law
outdoor (r = 0.9934). In comparing departments, high positive
correlation coefficients were obtained between Chemistry Lab.
and Urban & Regional planning (r = 0.9522), Civil and
Electrical (r=0.9987).
Analysis of variance on noise levels between hostels, road
junctions, gates and departments showed significant difference
(P <0.05).
Noise levels outdoors were generally higher than indoors. t -
tests on the mean noise levels between indoors and outdoors
were not significant (P > 0.05) but t - tests between maximum
and minimum noise levels at the departments were significant
(P < 0.05).
Table 3.8. Analysis of Variance between sections of the University.
ANOVA
Source of Variation SS df MS F P - value F crit
Between Gates 18.64095 2 9.320476 10.92853 0.000781 3.554557
Within Gates 15.35143 18 0.852857
Total 33.99238 20
Between B, C, F/G 65.14667 2 32.57333 36.82915 4.64E - 05 4.256495
Within B, C, F/G 7.96 9 0.884444
Total 73.10667 11
Between Road Junctions 128.425 4 32.10625 36.61614 1.42E - 07 3.055568
Within Road Juncs 13.1525 15 0.876833
Total 141.5775 19
Between ISS Sections 423.0855 3 141.0285 2161.356 4.49E - 21 3.238872
Within Sections 1.044 16 0.06525
Total 424.1295 19
Between Farm/Security Village 674.0419 3 224.6806 2636.839 3.54E - 17 3.490295
Within Groups 1.0225 12 0.085208
276 Tubonimi Joseph Kio Ideriah: Assessment of Ambient Day Indoor and Outdoor Noise Levels in University of
Science and Technology Port Harcourt
Table 3.9. Correlation Matrix of Indoor and Outdoor Noise Levels.
Chem IN Chem
OUT
Phy IN Phy
OUT
Bio IN Bio OUT SC 7 IN SC 7
OUT
SC 10 IN SC 10
OUT
C/Pet IN C/Pet
OUT
Civil IN
Chem IN 1
Chem OUT 0.54926 1
Phy IN 0.150095 -
0.08112
1
Phy OUT 0.40621 0.114468 - 0.20702 1
Bio IN - 0.16583 -
0.59315
- 0.11062 -
0.17175
1
Bio OUT - 0.13214 -
0.36212
- 0.71982 0.29036 0.534119 1
SC 7 IN - 0.79373 -
0.43231
0.31305 -
0.69938
- 7.5E - 15 - 0.31068 1
SC 7 OUT - 0.13217 -
0.86881
0.208514 0.30434
8
0.679608 0.472691 0.046625 1
SC 10 IN 0.298807 -
0.08839
- 0.22097 0.98909 - 0.07202 0.426597 - 0.63246 0.423896 1
SC 10 OUT 0.761812 0.231125 0.27735 - 0.1253 0.401762 - 0.08113 - 0.49614 0.028916 - 0.1716 1
C/Pet IN 0.633058 0.652047 - 0.0532 0.69751
2
- 0.6821 - 0.24872 - 0.7151 - 0.4001 0.584178 0.059131 1
C/Pet OUT 0.418121 -
0.03164
- 1.9E - 15 0.54332
4
0.38829 0.123448 - 0.89073 0.272096 0.509925 0.742891 0.412796 1
Civil IN - 0.16176 -
0.65043
0.101742 0.53039
5
0.214599 0.441201 - 0.3254 0.834441 0.836056 - 0.06727 0.085187 0.29759
5
1
Civil OUT - 0.34072 - 0.0532 0.595294 -
0.21895
- 0.6027 - 0.79041 0.469776 - 0.397 - 0.25533 - 0.34597 0.213807 - 0.2786 - 0.0231
Elec IN 0.88278 0.885615 - 0.13801 0.41902
6
- 0.43707 - 0.6455 - 0.91816 - 0.55205 0.276026 0.547723 0.828079 0.65996
6
-
0.16667
Elec OUT - 0.33103 0.551246 - 0.34816 -
0.50212
- 0.53585 - 0.30552 0.3114 - 0.88929 - 0.5693 - 0.33796 0.037113 -
0.60974
-
0.88662
Mech IN #DIV/0! #DIV/0! #DIV/0! #DIV/0! #DIV/0! #DIV/0! #DIV/0! #DIV/0! #DIV/0! #DIV/0! #DIV/0! #DIV/0! #DIV/0!
Mech OUT - 0.00337 0.213293 0.740239 -
0.37011
- 0.37152 - 0.45643 0.30669 - 0.2092 - 0.42356 0.277474 0.043748 -
0.24724
0.13909
8
EN 10 IN 1 - 1 1 1 - 1 - 1 - 1 1 1 - 1 1 1 1
EN 10 OUT 0.211604 -
0.17066
0.981981 0.90784
1
- 0.59604 - 0.32733 - 0.24019 0.654654 0.960769 - 0.5 0.5 0.24019
2
0.98198
1
MDR IN 0.671932 0.344865 0.755929 0.99587
1
- 0.91766 - 0.75593 - 0.69338 0.188982 0.970725 4.11E - 14 0.866025 0.69337
5
0.75592
9
MDR OUT - 0.22069 0.487088 - 0.96609 - 0.7333 - 0.18732 - 0.2582 0.196748 - 0.82808 - 0.82808 1.3E - 14 - 0.13801 -
0.37712
- 1
NEH IN - 0.66895 -
0.84366
0.478091 0.09072
2
0.216295 0.447214 0.681554 0.717137 0.239046 - 0.63246 - 0.47809 - 0.4899 0.57735
NEH OUT #DIV/0! #DIV/0! #DIV/0! #DIV/0! #DIV/0! #DIV/0! #DIV/0! #DIV/0! #DIV/0! #DIV/0! #DIV/0! #DIV/0! #DIV/0!
Law IN 0.666204 0.788263 0.517298 0.19518
3
- 0.77165 - 0.80341 - 0.28642 - 0.50337 0.069673 0.218625 0.756262 0.12857
8
-
0.14339
Law OUT - 0.07344 0.01786 - 0.04234 0.71614
7
- 0.17049 - 0.15229 - 0.1705 0.302082 0.835704 - 0.65558 0.400545 0.20265
5
0.08213
5
Table 3.9. Continued.
Civil OUT Elec IN Elec
OUT
Mech IN Mech
OUT
EN 10 IN EN 10
OUT
MDR IN MDR
OUT
NEH IN NEH
OUT
Law IN Law
OUT
Civil OUT 1
Elec IN - 3.4E - 14 1
Elec OUT 0.354291 0.113228 1
Mech IN #DIV/0! #DIV/0! #DIV/0! 1
Mech OUT 0.604077 0.766238 0.029231 #DIV/0! 1
EN 10 IN 1 #DIV/0! - 1 #DIV/0! 1 1
EN 10 OUT 1 4.1E - 14 - 0.98198 #DIV/0! 0.605291 1 1
MDR IN 0.866025 0.5 - 0.75593 #DIV/0! 0.9222 1 0.866025 1
MDR OUT - 4.9E - 15 0.166667 0.905822 #DIV/0! - 0.5046 - 1 - 0.98198 - 0.75593 1
NEH IN 0.239046 - 0.86603 - 0.39223 #DIV/0! - 0.37225 1 0.5 0 - 0.57735 1
NEH OUT #DIV/0! #DIV/0! #DIV/0! #DIV/0! #DIV/0! #DIV/0! #DIV/0! #DIV/0! #DIV/0! #DIV/0! 1
Law IN 0.685714 0.868271 0.137219 #DIV/0! 0.711033 1 0.427121 0.821995 - 0.07893 - 0.54687 #DIV/0! 1
Law OUT 0.174754 - 0.1063 - 0.27874 #DIV/0! - 0.52961 1 0.993399 0.802955 - 0.63779 0.552345 #DIV/0! 0.067618 1

International Journal of Science, Technology and Society 2015; 3(6): 265-278 277
Table 3.10. Correlation Matrix of Noise Levels in the Departments.
Chemistry Lab I Physics Lab I Biology Lab I Med Lab Sc SC 7 SC 10 Chem/Pet Civil Electrical
Chemistry Lab I 1
Physics Lab I - 0.24412 1
Biology Lab I - 0.04531 - 0.95164 1
Med Lab Sc - 0.44233 - 0.67073 0.616331 1
SC 7 - 0.30312 0.699682 - 0.66999 - 0.8089 1
SC 10 0.269084 - 0.66031 0.619372 0.849948 - 0.97261 1
Chem/Pet - 0.21765 - 0.04888 0.178047 0.150473 - 0.10788 - 0.05625 1
Civil - 0.17423 0.113244 - 0.16207 - 0.33654 0.271906 - 0.22723 - 0.05307 1
Electrical 0.050535 0.144948 - 0.16371 - 0.33229 0.178855 - 0.11648 - 0.54217 0.998677 1
Mechanical - 0.00337 - 0.45406 0.427439 0.306647 - 0.56357 0.592454 - 0.16926 - 0.05921 - 0.04584
EN 10 0.817737 0.670694 - 0.36035 - 0.92672 - 0.31469 - 0.13217 0.053484 - 0.02292 - 0.03341
MDR - 0.90111 - 0.40962 0.323222 0.526033 0.152631 - 0.03446 0.16784 - 0.19283 - 0.1763
NEH - 0.66895 0.478091 0.216295 0.426401 0.681554 0.239046 - 0.71289 0.683927 0.719877
Law - 0.37465 0.085264 0.042563 0.006734 0.296408 - 0.19821 0.264153 0.014506 - 0.38179
Estate Mgt. - 0.82163 0.271448 0.192982 0.622543 0.82922 0.038778 - 0.69451 0.664206 0.696456
Bus. Edu. 0.860073 0.239046 - 0.54074 - 0.8528 - 0.90874 0.717137 0.007749 0.027357 0
Urban & Reg Plan 0.952217 0.327327 - 0.9934 - 1 - 0.96077 0.720577 0.009464 0.033942 0
Tech. & Sci 1 1 - 1 - 1 - 1 1 - 1 1 1
Table 3.10. Continued.
Mechanical EN 10 MDR NEH Law Estate Mgt. Bus. Edu. Urban & Reg Plan Tech. & Sci
Mechanical 1
EN 10 0.796709 1
MDR - 0.44026 - 0.9906 1
NEH - 0.37225 - 0.74162 0.806696 1
Law 0.296043 - 0.04017 0.385353 0.658974 1
Estate Mgt. - 0.56449 - 0.87496 0.92075 0.973329 0.619024 1
Bus. Edu. 0.95491 0.87646 - 0.82411 - 0.5 - 0.63343 - 0.64889 1
Urban & Reg Plan 0.992005 0.928571 - 0.87512 - 0.5 - 0.84841 - 0.65465 1 1
Tech. & Sci 1 1 - 1 1 1 1 1 1 1
4. Conclusion and Recommendations
4.1. Conclusion
Based on the findings of the study, the noise levels
measured in RSUST are said to be typical of urban
communities. The status of noise in RSUST does not portend
significant negative occupational noise impact, since the
measured noise levels were generally below Occupational
Safety Health Agency and Federal Ministry of Environment
guidelines for 8 hours working day and exceeded WHO
guidelines for school environment. Major sources of noise
within RSUST were generators, automobiles, human
conversations, machineries, helicopter and wind movement.
4.2. Recommendation
University Authority should provide steady power supply
by Power Holding Company of Nigeria. Alternatively, solar
plant or sound proof generators should be provided. Practical
actions to limit and control the exposure to environmental
noise are essential.
Acknowledgement
The author hereby sincerely acknowledges Confidence N.
Oguamalam for the financial contribution and field
measurements.
References
[1] Berger, E. H. (2000) “Noise Control and Hearing Conservation” why do it. In Berger, E. H. Royster, L. H., Royster, J. D., Driscoll, D. P., Layne, M (eds). 2000. The Noise Manual American Industrial Hygiene Association. 1 – 17.
[2] Bisio. G. (1996). Case history: noise level survey in middle size town and remarks on restrictions. Noise Control English Journal, 41, 201 – 206.
[3] Demian, G., Demian, M., Grecu L. and Grelu, V. (2008). Studies about noise pollution in urban areas. Proceedings of the 10th WSEAS International Conference on Acoustics, Music Theory and Applications of Bulglalria, 87 – 91.
[4] Goswami, S., Nayak, S. K., Pradham, A. C. and Dey, S. K. (2011). A study on traffic noise of two campuses of university, Balasore, India. Journal of Environ Biology, 32 (1), 105 – 109.
[5] Jefferson, C. (2013). Noise Pollution. U. S. Environmental Protection Agency. Retrieved 2013 - 09 - 24.
[6] Nelson, P. M. (1998). Transportation. Noise control English Journal, 46, 159 – 166.
[7] Niosh (1996) National Occupational Research Agenda. National Institute of Occupational Safety and Health, DHHS (NIOSH) Pub. No. 96 – 115. Cincinnati, OH.
[8] N. M. S. (1998). Nigerian Meteorological Services, pp. 1 - 10.

278 Tubonimi Joseph Kio Ideriah: Assessment of Ambient Day Indoor and Outdoor Noise Levels in University of
Science and Technology Port Harcourt
[9] Onuu, M. U. (1992). Measurement and analysis of road traffic noise and its impact in part of South Eastern Nigeria. Ph. D thesis, University of Calabar, Calabar, Cross River State, Nigeria.
[10] Oyedepo, O. S. and Saadu, A. A. (2009). A comparative study of noise pollution levels in some selected areas in Ilorin metropolis, Nigeria. Environmental Monit Assessment, 158, 155 – 167.
[11] Rosen, S. and Olin (1995). Hearing loss and coronary heart disease. Archives of Otolaryngology, 82, 236.
[12] RSUST, (2013). Rivers State University of Science and Technology, Port Harcourt, News Bulletin Vol. V. No, III & IV December (2013). A quarterly publication of the information, Publication & Protocol Unit, Office of the Vice Chancellor, Back Cover.
[13] Singh, N. and Daver, S. C. (2004). Noise pollution: Sources, effects and control. Journal of Human and Ecology, 16, 181 – 187.
[14] Sinha, S., and Sridharan, P. V. (1999); Present and Future Assessment of Noise Level in the Neyveli Region. Journal of Environmental Studies and Policy 2 (1), 1 - 13.
[15] Smoorenburg, G. F., Axelson, A., Babisch, W., Diamond, I. G., Isling, H., Marth, E., Miedeman, H. M. E, Ohistronm, E., Rice, C. G., Abbing, E. W. R., Van de Wiel, J. A. G., Passchier - Vermeer, W. (2003). Effects of noise on Health. Noise News Int, 4 (4), 137 – 150.
[16] Thakur, G. S. (2006). A study of noise around an educational institutional area. Journal of Environmental Science Engineering, 48 (1), 35 – 38.
[17] Ugwuanyi, J., Ahemen, U. I. and Agbendeh, A. A. (2005). Assessment of environmental noise pollution in Markurdi metropolis, Nigeria zuma. Journal of Pure Applied Science, 6, 134 – 138.
[18] WHO, (2005). United Nations Road Safety Collaboration: A handbook of partner profiles. World Health Organization Geneva, Switzerland.