Embed Size (px)
Citation preview

Assessment of Bird Damage Assessment of Bird Damage to Sunflower and Corn to Sunflower and Corn
in North Dakotain North Dakota
Megan Klosterman1 , George Linz2 , Tony Slowik3, and William Bleier1
1 Department of Biological Sciences, NDSU 2 USDA, Wildlife Services, National Wildlife Research Center, Bismarck
3 USDA, PPQ, Bismarck
Production
• North Dakota: Top Sunflower Producer– Supports a $906 million economy.
• Corn acreage has increased.• Damage contributed to a reduction in
sunflower crop.

Blackbirds• Population
– Red-winged Blackbird– Yellow-headed Blackbird– Common Grackle– Surpasses many other states
• Prime habitat• Migration flyway• Food distribution
+ +
Increase Increase Constant
=
Increase in Blackbird PopulationIn North Dakota
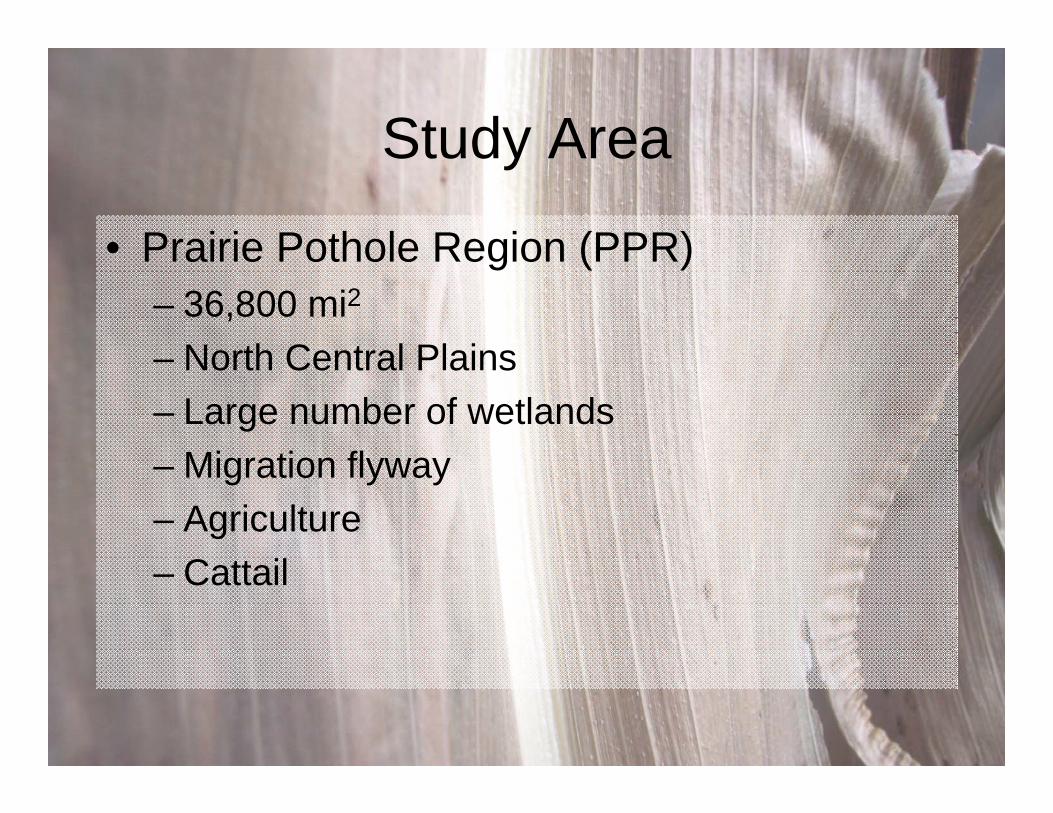
Study Area
• Prairie Pothole Region (PPR)– 36,800 mi2
– North Central Plains– Large number of wetlands– Migration flyway– Agriculture– Cattail

n
Ralston et al. 2004

Methods
• 120 Sites– 4 mi2 each
• 3 years– 2008, 2009, 2010
• Sites surveyed in August for presence of fields
• Fields surveyed for damage in September
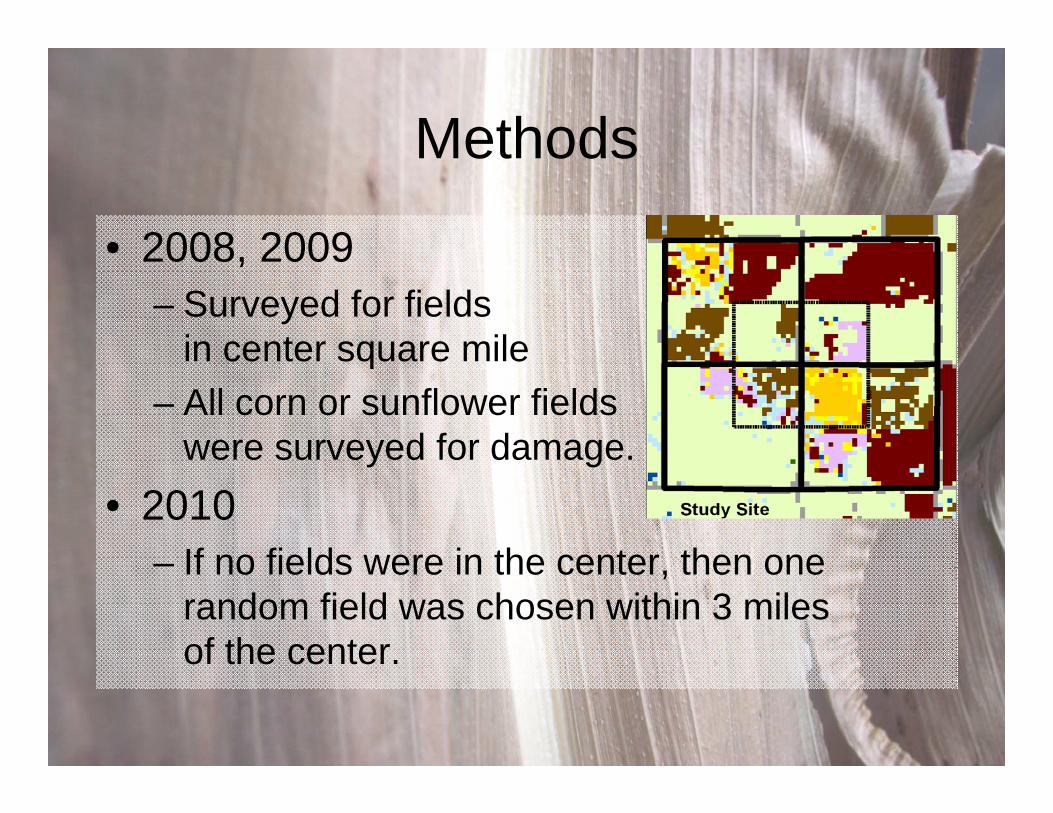
Methods
• 2008, 2009– Surveyed for fields
in center square mile – All corn or sunflower fields
were surveyed for damage.• 2010
– If no fields were in the center, then one random field was chosen within 3 miles of the center.

Methods1st 2nd
1st
2nd

Damage Measurements

Corn 2008 N= 38 Sunflower 2008 N= 14

Corn 2009 N= 30 Sunflower 2009 N= 15

Corn 2010 N = 65 Sunflower 2010 N = 23

2008, 2009, and 2010 Crop Damage
0
0.5
1
1.5
2
2.5
3
2008 2009 2010
Ave
rage
Per
cent
Dam
age
Corn
Sunflower
N= 38
N= 30 N= 65
N= 14
N= 15N= 23

Cost of Damage Statewide
0
2
4
6
8
10
12
2008 2009
Mill
ion
Dol
lars
Corn
Sunflower
N= 38
N= 30N= 14
N= 15

2008, 2009, and 2010 Corn Damage by Strata
0
0.2
0.4
0.6
0.8
1
1.2
SDP NEDP NWDP MCStrata
Ave
rage
Per
cent
Dam
age
2008
2009
2010
N= 30
N= 2
N= 4 N= 2
N= 26N=2
N= 0
N= 2
N= 42
N= 11
N= 6
N= 6

2008, 2009, and 2010 Sunflower Damage by Strata
0
5
10
15
20
25
SDP NEDP NWDP MC
Strata
Ave
rage
Per
cent
Dam
age
2008
2009
2010
N= 1
N= 1
N= 6
N= 3
N= 5N= 11 N= 2 N= 0
N= 2
N= 4
N=13 N= 4

Other
Open Water
Small Grains
Wooded
Sunflower
Beans
Corn
Pasture
Developed
Wetland
Independent Variables
Future Plans: Landcover Analysis

Acknowledgements
• Mario Biondini• Peter Oduor• Jessie Monson• Dereck Stonefish• Jeff Homan• Matthew Strassburg• James Schanandore

Thank You