Embed Size (px)
Citation preview

ASSESSMENT OF CONCENTRATIONS OF TRACE ELEMENTS IN GROUND WATER AND SOIL AT THE SMALL-ARMS FIRING RANGE, SHAW AIR FORCE BASE, SOUTH CAROLINA
By James E. Landmeyer
U.S. GEOLOGICAL SURVEYWater-Resources Investigations Report 94-4209
Prepared in cooperation with the
U.S. DEPARTMENT OF DEFENSE
U.S. AIR FORCE, AIR COMBAT COMMAND
Columbia, South Carolina 1994
U.S. DEPARTMENT OF THE INTERIOR
BRUCE BABBITT, Secretary
U.S. GEOLOGICAL SURVEY
Gordon P. Eaton/ Director
For additional information write to: Copies of this report can be purchased from:
U.S. Geological SurveyDistrict Chief Earth Science Information CenterU.S. Geological Survey Open-File Reports SectionStephenson Center- Suite 129 Box 25286, Mail Stop 517720 Gracern Road Denver Federal CenterColumbia, SC 29210-7651 Denver, CO 80225

CONTENTS
Page
Abstract ........................................................................... 1
Introduction........................................................................ 1Background.................................................................. 3Purpose and scope............................................................ 3Description of study area ...................................................... 5Previous investigations........................................................ 5
Hydrologic framework .............................................................. 6Hydrogeology ............................................................... 7Observation-well network..................................................... 7Lithology of observation-well borings........................................... 9Ground-water hydrology and use.............................................. 11Surface-water hydrology ..................................................... 12
Data collection and analysis ......................................................... 12Sampling and analytical methods.............................................. 12Quality-control and quality-assurance program.................................. 14
Assessment of concentrations of trace elements in ground water and soil.................. 15Trace elements in ground water ............................................... 15Trace elements in soil ........................................................ 15
Summary and conclusions .......................................................... 35
Selected references ................................................................. 36
Appendixes ....................................................................... 37
I. Location of sampling sites, detection limits, and results of trace-element analyses from soil samples collected November 2, 1990, by Shaw Air Force Base personnel...................... 38
n. Location of sampling sites, detection limit, and lead ToxicityCharacteristics Leaching Procedure results, from soil samplescollected November 2,1990, by Shaw Air Force Base Personnel.............. 40
in. Location of sampling sites, detection limits, and results of trace-element analyses from soil samples collected on April 22,1991, by Shaw Air Force Base personnel.......................... 41
CONTENTS-Continued
Page
IV. Location of sampling sites, detection limit, and results of traceelement Toxicity Characteristics Leaching Procedure analysesfrom soil samples collected on April 22,1991, by Shaw Air ForceBase personnel........................................................ 48
V. Hammer blows required to collect split-spoon samples atobservation well 1 ..................................................... 55
VI. Grain-size analyses for borehole and observation well soilsamples .............................................................. 56
VII. Borehole soil samples used for trace-element and ToxicityCharacteristics Leaching Procedure analyses .............................. 59
VIII. Ordnance used at the Small-Arms Firing Range study sitebetween 1967 and 1992 ................................................. 60
FIGURES
Figure 1. Map showing location of study area at Shaw Air Force Base,Sumter County, South Carolina .......................................... 2
2. Map showing location of observation wells, soil-sampling boreholes, and site-construction history at the Small-Arms Firing Range study area...................................... 4
3. Diagram showing generalized hydrogeologic section beneathShaw Air Force Base in Sumter County ................................... 6
4. Hydrogeologic descriptions of aquifer systems beneath theSmall-Arms Firing Range study area, Shaw Air Force Base .................. 8
5. Diagram showing generalized ground-water observation-wellconstruction.......................................................... 10
6. Map showing generalized direction of shallow ground-watermovement in study area ............................................... 13
IV

TABLES
Page
Table 1. Water levels in shallow ground-water observation wells at theSmall-Arms Firing Range study area, Shaw Ak Force Base .................. 12
2. Physical characteristics of water in observation wells at theSmall-Arms Firing Range, Shaw Ak Force Base, South Carolina,May 19,1992.......................................................... 14
3. Location of ground-water sampling sites, analytical method detection limit, U.S. Envkonmental Protection Agency maximum contaminant level, and summary of total trace-element concentrations in water from observation wells at the Small-Arms Firing Range, Shaw Ak Force Base, South Carolina, May - July 1992 ......................................... 16
4. Summary of trace-element concentrations in soil samples from selected observation wells and boreholes at the Small-Arms Fking Range, Shaw Ak Force Base, South Carolina, May - July 1992 ...................... 18
5. Location of soil sampling sites, analytical method detection limit,Toxicity Characteristics Leaching Procedure maximum contaminant level, and Toxicity Characteristics Leaching Procedure results for soil samples collected from the Small-Arms Firing Range, Shaw Air Force Base, South Carolina, May - July 1992 ......................................... 25
CONVERSION FACTORS, ABBREVIATIONS, VERTICAL DATUM, AND ABBREVIATED
WATER-QUALITY UNITS
Multiply By To obtain
inch (in.)foot (ft)foot per day (ft/d)foot per foot (ft/ft)mile (mi)square foot (ft2)square mile (mi2)gallon (gal)cubic foot (ft3)cubic foot per second (ft3 /s)gallons per minute (gal/min)ounce (oz)pound (Ib)pounds per square inch (lb/in2)
25.40.30480.30480.30481.6090.092942.5903.7850.028320.028320.06308
28.354.5366.895
millimetermetermeter per daymeter per meterkilometersquare metersquare kilometerlitercubic metercubic meter per secondliters per secondgramskilogramkilopascal
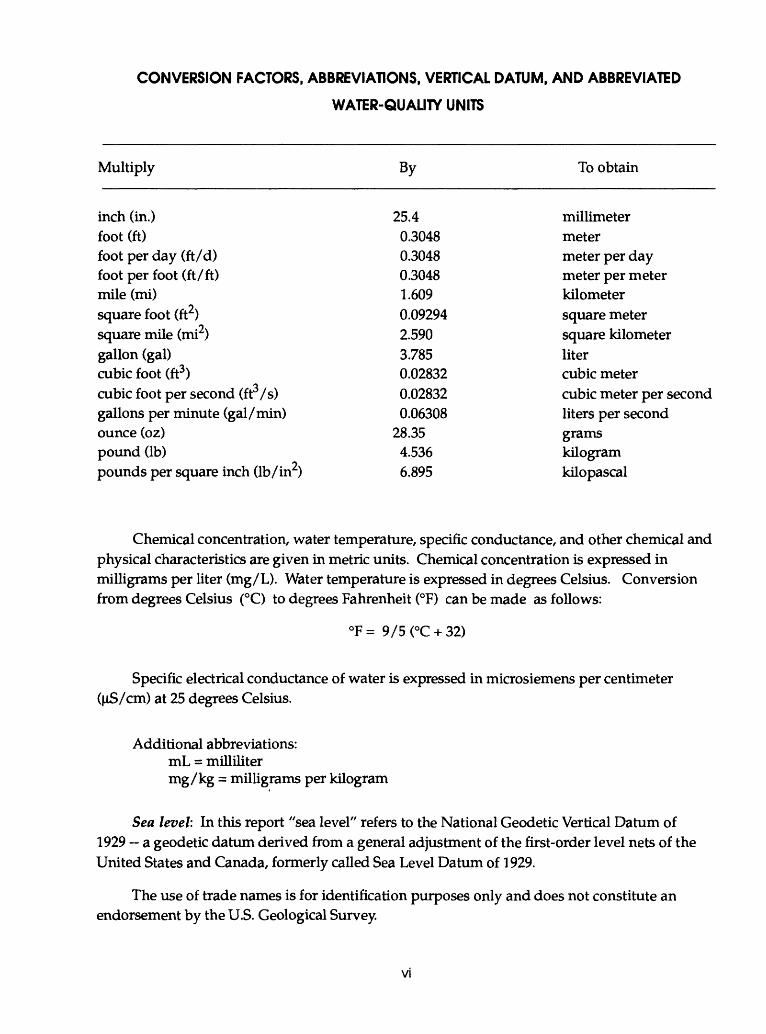
Chemical concentration, water temperature, specific conductance, and other chemical and physical characteristics are given in metric units. Chemical concentration is expressed in milligrams per liter (mg/L). Water temperature is expressed in degrees Celsius. Conversion from degrees Celsius (°C) to degrees Fahrenheit (°F) can be made as follows:
°F = 9/5 (°C + 32)
Specific electrical conductance of water is expressed in microsiemens per centimeter (US/cm) at 25 degrees Celsius.
Additional abbreviations: mL = milliliter mg/kg = milligrams per kilogram
Sea level: In this report "sea level" refers to the National Geodetic Vertical Datum of 1929 a geodetic datum derived from a general adjustment of the first-order level nets of the United States and Canada, formerly called Sea Level Datum of 1929.
The use of trade names is for identification purposes only and does not constitute an endorsement by the U.S. Geological Survey
VI
ASSESSMENT OF CONCENTRATIONS OF TRACE ELEMENTS INGROUND WATER AND SOIL AT THE SMALL-ARMS FIRING
RANGE, SHAW AIR FORCE BASE, SOUTH CAROLINA
By James E. Landmeyer
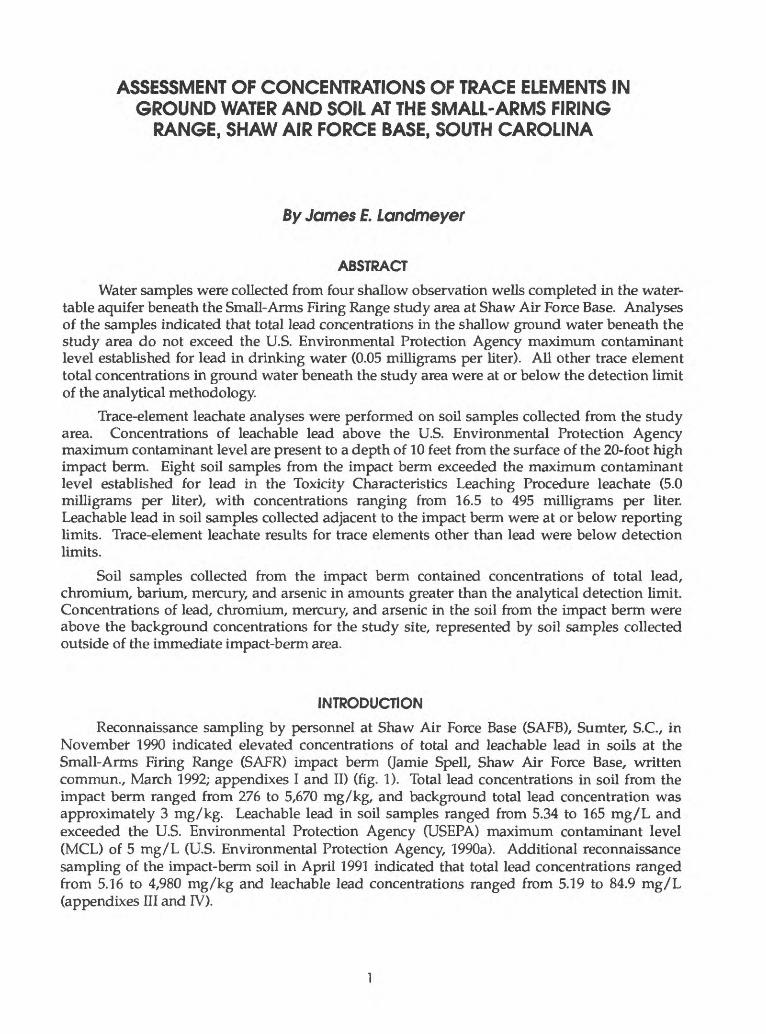
ABSTRACT
Water samples were collected from four shallow observation wells completed in the water- table aquifer beneath the Small-Arms Firing Range study area at Shaw Air Force Base. Analyses of the samples indicated that total lead concentrations in the shallow ground water beneath the study area do not exceed the U.S. Environmental Protection Agency maximum contaminant level established for lead in drinking water (0.05 milligrams per liter). All other trace element total concentrations in ground water beneath the study area were at or below the detection limit of the analytical methodology.
Trace-element leachate analyses were performed on soil samples collected from the study area. Concentrations of leachable lead above the U.S. Environmental Protection Agency maximum contaminant level are present to a depth of 10 feet from the surface of the 20-foot high impact berm. Eight soil samples from the impact berm exceeded the maximum contaminant level established for lead in the Toxicity Characteristics Leaching Procedure leachate (5.0 milligrams per liter), with concentrations ranging from 16.5 to 495 milligrams per liter. Leachable lead in soil samples collected adjacent to the impact berm were at or below reporting limits. Trace-element leachate results for trace elements other than lead were below detection limits.
Soil samples collected from the impact berm contained concentrations of total lead, chromium, barium, mercury, and arsenic in amounts greater than the analytical detection limit. Concentrations of lead, chromium, mercury, and arsenic in the soil from the impact berm were above the background concentrations for the study site, represented by soil samples collected outside of the immediate impact-berm area.
INTRODUCTION
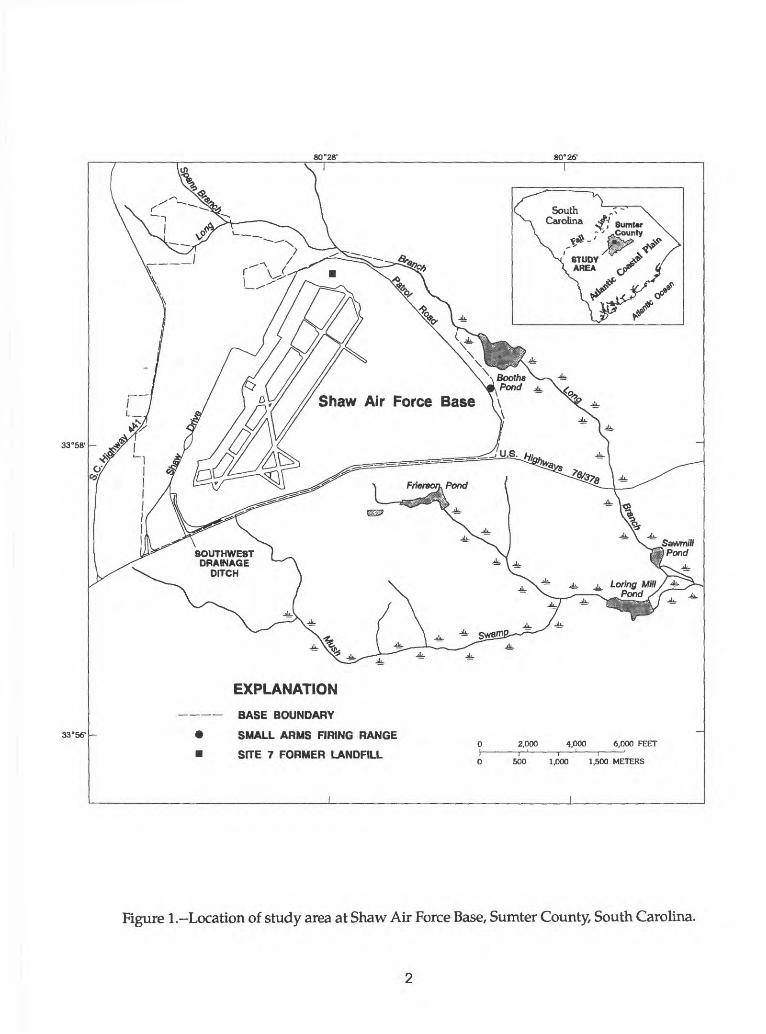
Reconnaissance sampling by personnel at Shaw Air Force Base (SAFB), Sumter, S.C, in November 1990 indicated elevated concentrations of total and leachable lead in soils at the Small-Arms Firing Range (SAFR) impact berm (Jamie Spell, Shaw Air Force Base, written commun., March 1992; appendixes I and II) (fig. 1). Total lead concentrations in soil from the impact berm ranged from 276 to 5,670 mg/kg, and background total lead concentration was approximately 3 mg/kg. Leachable lead in soil samples ranged from 5.34 to 165 mg/L and exceeded the U.S. Environmental Protection Agency (USEPA) maximum contaminant level (MCL) of 5 mg/L (U.S. Environmental Protection Agency, 1990a). Additional reconnaissance sampling of the impact-berm soil in April 1991 indicated that total lead concentrations ranged from 5.16 to 4,980 mg/kg and leachable lead concentrations ranged from 5.19 to 84.9 mg/L (appendixes III and IV).
80°28' 80*26'
I
33°58'
SOUTHWESTDRAINAGE
DITCH
33°56'
EXPLANATION
BASE BOUNDARY
SMALL ARMS FIRING RANGE
SITE 7 FORMER LANDFILL0 2.000 4,000 6,000 FEETI H i ' i '0 500 1,000 1,500 METERS
Figure 1.-Location of study area at Shaw Air Force Base, Sumter County, South Carolina.

The presence of leachable lead in concentrations exceeding the MCL indicates that soil- bound lead in the impact-berm soil could be leached and transported to the shallow ground- water system. Because the extent of the ground-water concentrations of lead and other trace elements at the study area were unknown in October 1991, the U.S. Geological Survey (USGS) in cooperation with the U.S. Air Force (USAF), Air Combat Command (ACC), initiated an investigation under the USAF Environmental Compliance Program to assess the concentrations of trace elements in ground water and soil at the site.
Background
The position of the impact berm at the SAFR has changed since initial construction in 1967. From 1967 until 1986, the original impact berm (to be referred to as the old berm) was located 150 ft to the north of its present-day (1994) location. In 1986, after a storm damaged the range baffles beyond repair, the impact berm of the range was moved by bulldozing the old berm 150 ft to the south to its present (1994) location (fig. 2). Knowledge of this site history was essential in designing an assessment program, and particularly in selecting background soil and ground- water quality sample collection sites. For example, lead fragments contained in the old berm might still exist 150 ft to the north of the current impact berm. Additionally, the stratification of lead fragments that developed in the old berm (restricting contamination to the uppermost soil layers) has been upset by a vertical mixing within the soil during the movement of the berm soil that forms the present (1994) impact berm. These factors influenced placement of all observation wells and soil boreholes.
The impact berm is not used in a uniform manner for small-arms training at the SAFR. The heaviest target-practice activity, and therefore the highest potential for the concentration of lead or other trace elements, occurs on the western half of the impact berm in target lanes 1, 2, and 3 (fig. 2). Soil-sampling efforts were focused in these areas in an attempt to study the worst-case situation for trace-element concentration.
Purpose and Scope
The purpose of this report is to present the results of a study of the trace-elements concentrations in ground water and soil collected from the SAFR study area during 1992 at SAFE in Sumter County, South Carolina. The study area included the impact berm and adjacent areas. Trace-element concentration delineation involved installing four permanent, shallow ground- water observation wells, collecting and analyzing ground-water quality samples, and hand- augering six boreholes to obtain soil samples for grain-size and total and leachable trace-element analyses. Geologic and lithologic descriptions of drill cuttings, split-spoon samples, and hand- augered borehole samples were used to determine the generalized geology beneath the SAFR. The hydraulic conductivity of the unconfined water-table sands beneath the study area was determined by performing slug tests in completed observation wells. Water-table altitudes were determined to infer the direction of ground-water movement. Published hydrologic data, previous SAFE documents, and data collected in the area as part of this study were used in the assessment of concentrations of trace elements in the shallow ground water and soils at the study area.

OW2
EXPLANATIONTOPOGRAPHIC CONTOUR-lnterval 5 feet. Datum is sea level.
OBSERVATION WELL AND WELL NUMBER
BOREHOLE AND BOREHOLE NUMBER
SOIL-SAMPLE LOCATION, PREVIOUS INVESTIGATION
\___\
Figure 2.~Location of observation wells, soil-sampling boreholes, and site-construction history atthe Small-Arms Firing Range study area.

Description of Study Area
The study area (SAFR) is presently (1994) located on the eastern boundary of SAFE (fig. 1). The 22,500-ft2 range consists of a concrete firing bay about 150 ft in length that is housed in Building 1833, and a 20-ft high impact berm composed of native soil (fig. 2). A series of metal baffles placed 10 ft above the range floor, over the firing range area, provides ricochet protection. The SAFR is bounded on the east by cultivated farm land. To the north and west are 20- to 40- year old pine trees, and a model-airplane field. Garden plots for SAFB personnel lie to the south of the study area.
SAFB, completed in 1941, encompasses 3,326 acres. It is in a predominantly rural community, and is located 7 mi west of Sumter and 35 mi east of Columbia, S.C. The general topography ranges from rolling hills (about 330 ft above sea level) in the western part of the base to a flatter, more swampy terrain (about 200 ft above sea level) in the eastern part. The SAFR is approximately 209 ft above sea level. The swampy area is characterized by numerous elliptical- shaped hardwood swamps called Carolina bays that are present in greater number to the east and south of the base boundary. The base is in an area underlain by a generally southwestward- thickening wedge of unconsolidated sediment of the Atlantic Coastal Plain coastward of the Fall Line (fig. 1). Sediments of Cretaceous to Holocene age of the Atlantic Coastal Plain beneath SAFR study area extend to a depth of about 600 ft below land surface to pre-Cretaceous (Paleozoic) crystalline rock.
Previous Investigations
Two reconnaissance sampling studies to delineate trace-element concentrations in soils at the SAFR were made by SAFB personnel in 1990 and 1991 (Jamie Spell, Shaw Air Force Base, written commun., March 1992). Trace-element concentrations in the impact-berm soil were assessed and leaching potential indicated by the presence of leachable lead in concentrations exceeding the USEPA MCL (appendixes I, II, ffl, and IV). These soil-sampling surveys did not, however, assess the extent of trace-element concentrations in ground water at the SAFR study site. A ground-water-quality study made on the SAFB but not at the SAFR was a study of the potential for contaminant release into the shallow subsurface at the former landfill (site-7) about 2 mi to the northwest of the SAFR. This study was conducted in 1988 and is described in a pre- remedial assessment report by Law Environmental Inc. (1988). The results of that study indicated that none of the inorganic constituents detected in the sampled ground water were in concentrations that exceeded USEPA Primary Drinking Water Standards. The potential risks to the environment and public health posed by activities at the former landfill were, therefore, deemed minimal (Law Environmental Inc., 1988, p. 6-2). These conclusions are of primary interest to the SAFR study, as the former landfill is located topographically upgradient from the SAFR. Additionally, the shallow water-table aquifer beneath the former landfill and the SAFR is composed of sediments of a similar age and depositional history, and could be hydrologically connected. To define the extent of this hydrologic connection, however was beyond the scope of this present (1994) study.
HYDROLOGIC FRAMEWORK
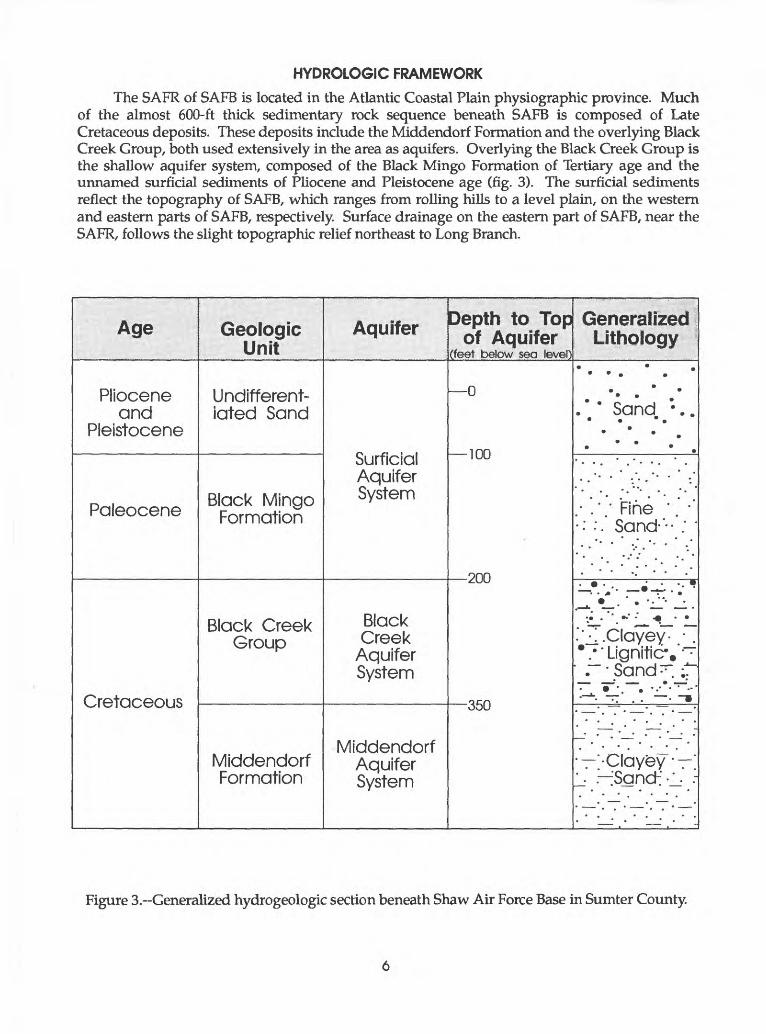
The SAFR of SAFB is located in the Atlantic Coastal Plain physiographic province. Much of the almost 600-ft thick sedimentary rock sequence beneath SAFB is composed of Late Cretaceous deposits. These deposits include the Middendorf Formation and the overlying Black Creek Group, both used extensively in the area as aquifers. Overlying the Black Creek Group is the shallow aquifer system, composed of the Black Mingo Formation of Tertiary age and the unnamed surficial sediments of Pliocene and Pleistocene age (fig. 3). The surficial sediments reflect the topography of SAFB, which ranges from rolling hills to a level plain, on the western and eastern parts of SAFB, respectively. Surface drainage on the eastern part of SAFB, near the SAFR, follows the slight topographic relief northeast to Long Branch.
Age
Pliocene and
Pleistocene
Paleocene
Geologic Unit
Undifferent- iated Sand
Black Mingo Formation
Black Creek Group
Middendorf Formation
Aquifer
Surficial Aquifer System
Black Creek
Aquifer System
Middendorf Aquifer System
Depth to Top of Aquifer
(feet below sea level)
0
100
200
.... orrnooU
Generalized Lithology
. 9 . ' * Sand . . *
.- . ' Fine ' . ' ' : Sand-'-- :
. . 0'_^ -.
''T.CIayey^ -"7 . Lignitkr.'"""7
' .~~'Sand :r". -^
'-Claye^' 1- 'Sand:'-!-
Figure 3.~Generalized hydrogeologic section beneath Shaw Air Force Base in Sumter County.

Hydrogeology
The hydrogeologic framework beneath SAFE consists of sedimentary sequences of Late Cretaceous age and overlying sediments of Tertiary to Pliocene and Pleistocene age. The Late Cretaceous deposits are divided into the confined Middendorf and Black Creek aquifer systems (fig. 3). The Black Mingo Formation of Tertiary age and unnamed Pliocene and Pleistocene deposits compose the semi-confined to unconfined shallow aquifer system. These aquifer systems overlie rocks of Paleozoic age with unknown (but presumably little) water-yielding potential.
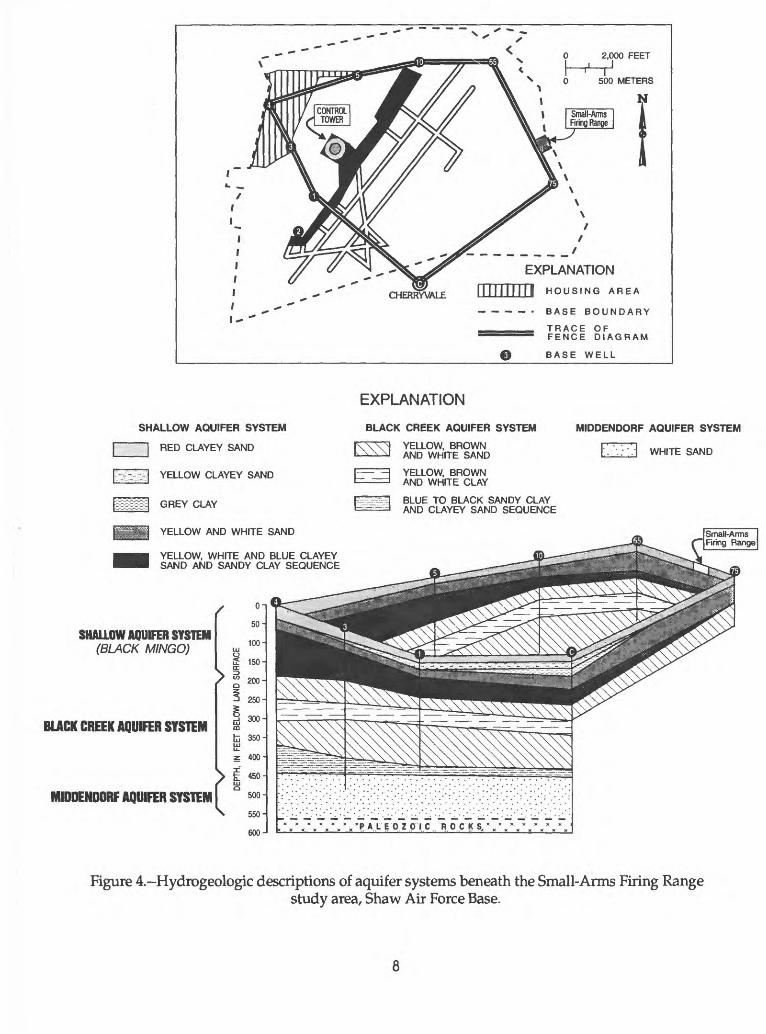
The shallow aquifer system in the study area is composed of unnamed marine-terrace sediments of Pliocene and Pleistocene age deposited on a peneplain that developed after partial erosion of the underlying Black Mingo Formation, and the Black Mingo aquifer. The marine- terrace sediments consist of red clayey sand and yellow silty sand with some lignitic material, average about 100 ft in thickness, and constitute the unconfined water-table aquifer (fig. 4). The water-table in this aquifer is about 10 ft below land surface at the SAFR. This water-table aquifer provides recharge to the underlying Black Mingo aquifer, where it subcrops beneath the water- table aquifer. The top of the semi-confined to unconfined Black Mingo aquifer is about 100 ft below land surface at the SAFR. The Black Mingo aquifer is about 100-ft thick at the SAFR but exceeds 200 ft in thickness in some places on the base.
The Late Cretaceous Black Creek and Middendorf aquifer systems lie approximately 200 ft and 350 ft below land surface, respectively, beneath SAFE (figs. 3 and 4). Production wells screened in these aquifers provide most of the potable water to SAFB and the surrounding residential communities in Sumter County. These aquifer systems overlie unnamed crystalline rock of schists, granites, and gneisses of Paleozoic age. No production wells are completed in the Paleozoic rocks, and little is known about the water-bearing potential of these rocks.
Observation-Well Network
Four 20-ft, permanent, ground-water observation wells were installed during April 1992 to determine if potentially leachable trace elements in the soil have migrated to the shallow ground-water-flow system. These wells were screened from 10 to 20 ft below the water table in the surficial aquifer system beneath the study area. Three wells (OW1, OW3, and OW4) were located adjacent to the SAFR perimeter to establish the general direction of ground-water movement beneath the study area. One observation well (OW2) was installed in an area beyond the boundaries of the SAFR (fig. 2). Observation well OW1 was installed adjacent to the impact berm in an attempt to document ground-water concentrations of trace elements resulting from ordnance activities.
All ground-water observation wells were installed using the air rotary method of drilling and their installation and construction were in compliance with regulations established by the S.C. Department of Health and Environmental Control (SCDHEC). This method of drilling was used to minimize the possibility of drilling activities contaminating the ambient ground-water quality. The drilling rig, drill stem, and drill cables were steam cleaned with high-pressure hot water prior to the installation of each observation well to reduce the chance of cross contamination during well construction.
2,000 FEET J
500 METERS
EXPLANATION
HOUSING AREA
_ _ _ _ . BASE BOUNDARY
TRACE OF FENCE DIAGRAM
BASE WELL
SHALLOW AQUIFER SYSTEM
| | RED CLAYEY SAND
P^-^q YELLOW CLAYEY SAND
GREY CLAY
YELLOW AND WHITE SAND
YELLOW, WHITE AND BLUE CLAYEY SAND AND SANDY CLAY SEQUENCE
EXPLANATION
BLACK CREEK AQUIFER SYSTEM
TsXI YELLOW, BROWNNNM AND WHITE SAND
:=~=| YELLOW, BROWN~-=* AND WHITE CLAY
r^^q BLUE TO BLACK SANDY CLAY -H AND CLAYEY SAND SEQUENCE
MIDDENDORF AQUIFER SYSTEM
I . '-.; '.'I WHITE SAND
SHALLOW AQUIFER SYSTEM(BLACK MINGO)
BLACK CREEK AQUIFER SYSTEM
MIDDENDORF AQUIFER SYSTEM I
o-50-
100'LU
2 150 cr
| 200
J 250
§ 300mfc 350Vz 400
t 450Q
500
550
600
Figure 4 Hydrogeologic descriptions of aquifer systems beneath the Small-Arms Firing Rangestudy area, Shaw Air Force Base.

A generalized construction schematic of the observation wells is shown in figure 5. The four observation wells were constructed of 10-ft sections of 2-in. diameter schedule 40 flush- threaded polyvinylchloride (PVC) casing and a 2-ft section of PVC riser pipe that extended above land surface. Well screens were constructed of 10-ft sections of 2-in. diameter schedule 40 flush-threaded PVC, with 0.010 in. slots. Filter sand (0.034 in. effective size and a uniformity coefficient of 1.2) was placed in the borehole around the well screen. Sand was placed to a level 2 ft above the top of the screen. A 2-ft-thick bentonite seal was placed above the sand pack by pouring semi-saturated bentonite pellets down the borehole. Grout was added to the borehole to fill the annular space from the bentonite seal to land surface. A 5-ft by 4-in. by 4-in. square metal protective casing was placed around the riser pipe that protruded above land surface. Additionally, a 4-ft by 4-ft by 6-in. concrete pad was constructed around the protective casing to prevent surface contaminants from entering the observation wellhead.
The observation wells were developed at 10 gal/min for 30 minutes with a 2 in. diameter submersible pump. This was effective in removing about 190 well volumes of water, which is significantly greater in volume than the 3 to 6 well volumes required by convention (Neilsen, 1991, p. 465). The ground water pumped during well development also decreased in turbidity throughout the duration of well development.
Litholoqv of Observation-Well Borings
During borehole drilling, soil samples were collected at 2-ft intervals for grain-size analysis, geologic classification, and leachable-lead analyses. All soil samples collected were identified and stored in labelled, sealed glass jars.
Continuous split-spoon samples were collected during drilling of the borehole for observation well 1 (OW1), near the impact berm (fig. 3), to obtain undisturbed formation material. The soils encountered during drilling operations consisted of a red to yellow sand to clayey sand. Relatively little organic matter was observed in these samples. A pulley-operated hammer on the cable-tool drilling rig was used to drive the split-spoon sampling device 2 ft ahead of the advancing drill stem. The number of blows required for the hammer to drive the split-spoon sampler into the formation material every 2-ft interval was recorded in the field. This information was recorded to provide a relative indication of changes in drilling conditions encountered, such as the approximate interface between unsaturated and saturated sediments at depths of 8 to 10 ft (appendix V). After field inspection, each split-spoon sample was placed in a core box for transport, identification, and storage accompanied by an appropriate chain of custody form.
Three samples of soil recovered during drilling were sieved to determine grain-size distributions. The samples sieved were obtained from one (OW3) of the four observation-well boreholes and one (Borehole 2) of six impact-berm boreholes drilled for this study. The grain- size analyses were made in a soil laboratory by personnel of the USGS. The results of these analyses are given in appendix VI.
Solid- and leachable-metals analyses were performed on soil subsamples collected during observation-well installation (appendix VII). These soil samples were delivered to the analytical laboratory within 2 hours after collection.

Lock
Security Cover
Bentonite Seal
Filter Sand
NOT TO SCALE
Grout
2-inch diameter, 2-foot PVC casing
^ Concrete Pad
Land Surface
2-inch diameter, 10-foot PVC casing
W a te rLevel
2-inch diameter, 10-foot PVC screen, (0.010-inch Slot size)
SHALLOW AQUIFER SYSTEM
Figure 5.~Generalized ground-water observation-well construction.
10
Ground-Water Hydrology and Use
Altitudes of the observation wells were determined on April 29,1992, by USGS personnel using standard surveying techniques. Measured water-level altitudes were used to determine the direction of ground-water movement beneath the study area. Water-level data were collected on May 19, June 27, July 7, and July 28,1992, from the four shallow ground-water observation wells completed in the surficial aquifer system. The water-level data for each observation well were averaged to provide a mean water level for interpretation of the direction of ground-water movement in the shallow aquifer system (table 1). These water-level data were used to define the direction of potential trace-element migration and to estimate the velocity of ground-water flow.
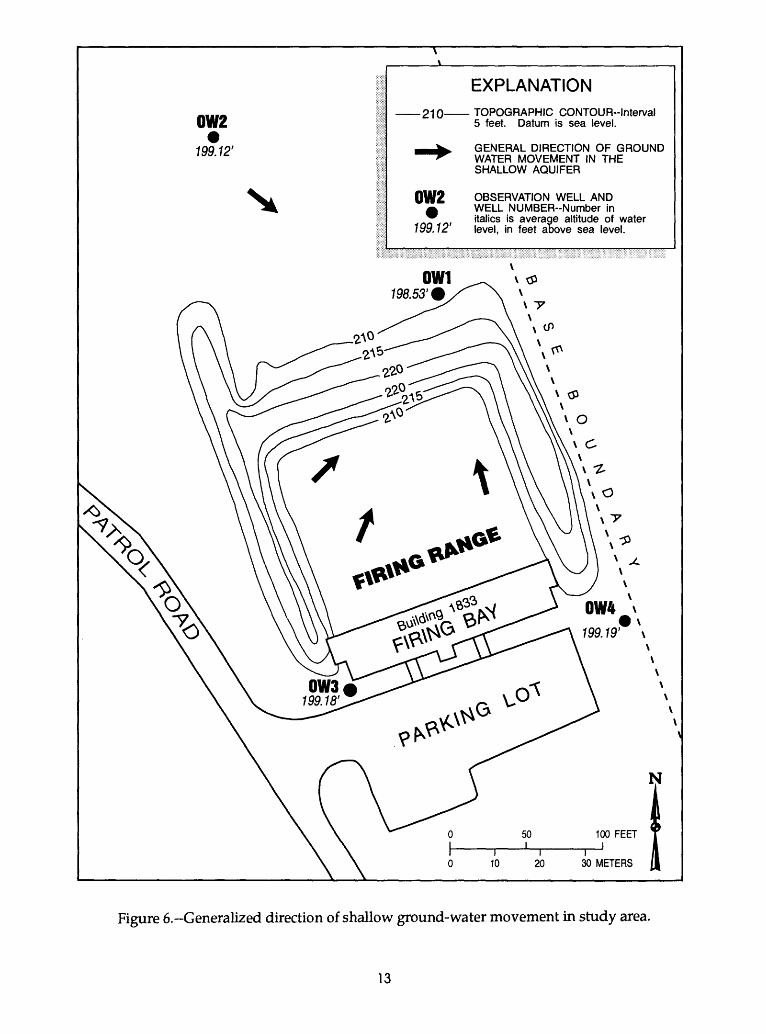
The inferred direction of ground-water movement is generally to the northeast across the SAFR, under a hydraulic gradient of about 0.003 ft/ft between OW 4 and OW 1 (fig. 6). This slight gradient does not follow the topographic relief; the direction of ground-water movement is not in the direction of low relief across the SAFR. However, about 500 ft to the northeast of the SAFR lies Booths Pond and Long Branch (about 195 ft above sea level). Booths Pond, an impoundment of Long Branch, is 194 ft above sea level (fig. 1). These surface-water bodies have stages 4 to 5 ft lower than ground-water levels in the observation wells and are potential ground- water discharge sites.
The hydraulic conductivity of the saturated surficial sediments at the SAFR was measured by performing volume-displacement slug tests in the shallow ground-water observation wells. Head changes were detected by a 0 to 2.5 lb/in2 pressure transducer and recorded on a data logger in the field. The hydraulic conductivity was calculated by using the Hvorslev method as described by Wylie and Wood (1990). Hydraulic conductivities ranged from 1.36 x 10" 2 to 2.86 x 10" 2 ft/d. These results are consistent with values of 2.83 x 10" 2 to 2.83 x 10" l ft/d reported for the surficial aquifer system by Law Environmental Inc. (1988, p. 2-18, table 2).
The average linear velocity of ground-water flow in the shallow aquifer was determined using Darcy's Law, as follows:
v = iK/n, (1)
where v is the average linear velocity of ground water, in feet per day;i is the hydraulic gradient, in feet per foot;K is the hydraulic conductivity, in feet per day; andn is the aquifer porosity, in percent.
Based on the average hydraulic conductivity of 2.11 x 10~2 ft/d, a hydraulic gradient of 0.0032 ft/ft, and an estimated porosity of 30 percent from grain-size analysis on the observation- well and borehole samples (appendix VI), the average lateral ground-water-flow velocity was computed to be 2.25 x 10"4 ft/d (0.0821 ft/yr).
Most public supply wells used in Sumter County, including those located within SAFB, are screened in the permeable sands of the Black Creek and Middendorf aquifer systems. These wells supply approximately 90 percent of the drinking-water demand of Sumter County (Stringfield and others, 1988). The shallow water-table aquifer system is not used as a source of potable water at SAFB, although some shallow wells (40 - 85 gal/min) are used for domestic purposes (Law Environmental, Inc., 1988; table B-2 in appendix I). There are no potable wells in the shallow aquifer system between the SAFR and Long Branch or Booths Pond to the northeast.
n
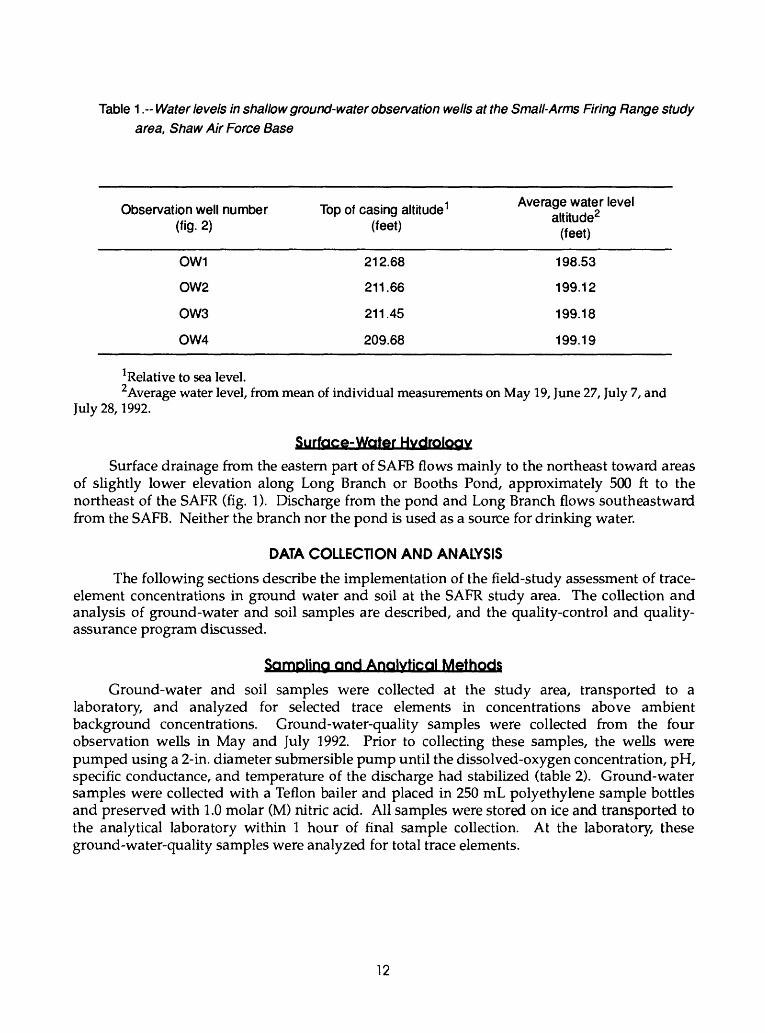
Table 1.-- Water levels in shallow ground-water observation wells at the Small-Arms Firing Range study area, Shaw Air Force Base
Observation well number Top of casing altitude 1 Average water level
OW1 212.68 198.53
OW2 211.66 199.12
OW3 211.45 199.18
OW4 209.68 199.19
Relative to sea level.2 Average water level, from mean of individual measurements on May 19, June 27, July 7, and
July 28, 1992.
Surface- Water Hydrology
Surface drainage from the eastern part of SAFB flows mainly to the northeast toward areas of slightly lower elevation along Long Branch or Booths Pond, approximately 500 ft to the northeast of the SAFR (fig. 1). Discharge from the pond and Long Branch flows southeastward from the SAFB. Neither the branch nor the pond is used as a source for drinking water.
DATA COLLECTION AND ANALYSIS
The following sections describe the implementation of the field-study assessment of trace- element concentrations in ground water and soil at the SAFR study area. The collection and analysis of ground-water and soil samples are described, and the quality-control and quality- assurance program discussed.
Sampling and Analytical Methods
Ground-water and soil samples were collected at the study area, transported to a laboratory, and analyzed for selected trace elements in concentrations above ambient background concentrations. Ground-water-quality samples were collected from the four observation wells in May and July 1992. Prior to collecting these samples, the wells were pumped using a 2- in. diameter submersible pump until the dissolved-oxygen concentration, pH, specific conductance, and temperature of the discharge had stabilized (table 2). Ground-water samples were collected with a Teflon bailer and placed in 250 mL polyethylene sample bottles and preserved with 1.0 molar (M) nitric acid. All samples were stored on ice and transported to the analytical laboratory within 1 hour of final sample collection. At the laboratory, these ground-water-quality samples were analyzed for total trace elements.
12
OW2
199.12'
EXPLANATION 210 TOPOGRAPHIC CONTOUR-lnterval
5 feet. Datum is sea level.
^^^ GENERAL DIRECTION OF GROUND ^ WATER MOVEMENT IN THE
SHALLOW AQUIFER
OW2 OBSERVATION WELL ANDA WELL NUMBER-Number in;r. italics is average altitude of water
199.12 level, in feet above sea level.
OW1198.53'*
Figure 6.~Generalized direction of shallow ground-water movement in study area.
13
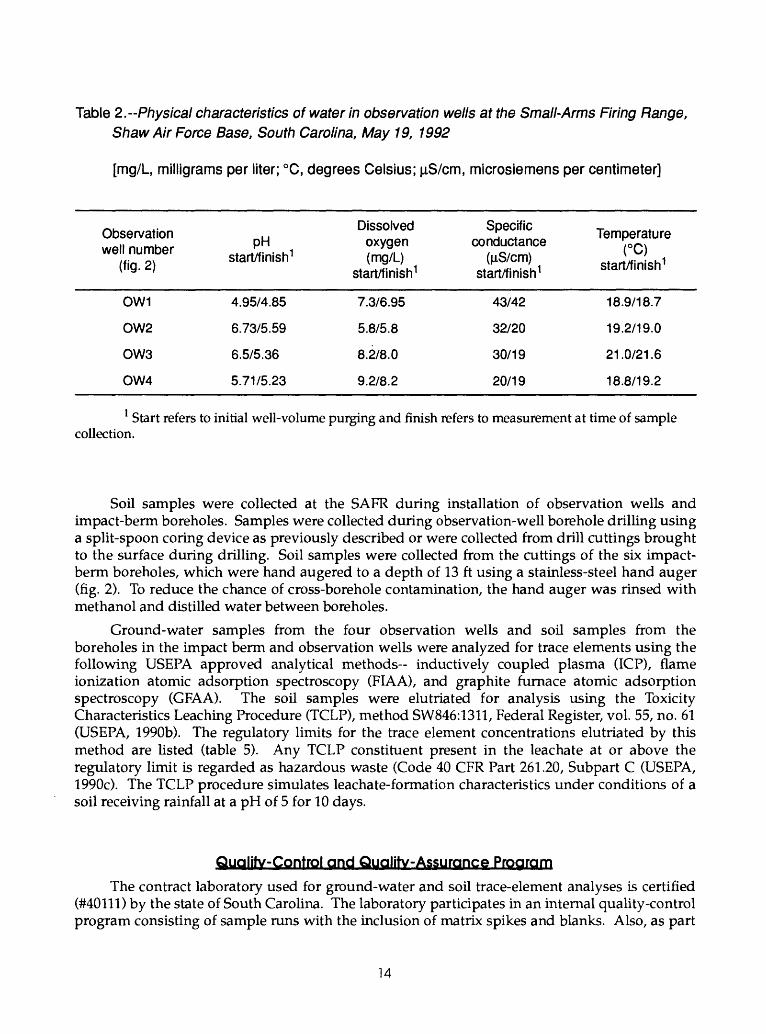
Table 2.--Physical characteristics of water in observation wells at the Small-Arms Firing Range, Shaw Air Force Base, South Carolina, May 19, 1992
[mg/L, milligrams per liter; °C, degrees Celsius; M-S/cm, microsiemens per centimeter]
Observation well number
(fig. 2)
OW1
OW2
OW3
OW4
pH start/finish 1
4.95/4.85
6.73/5.59
6.5/5.36
5.71/5.23
Dissolved oxygen (mg/L)
start/finish 1
7.3/6.95
5.8/5.8
8.2/8.0
9.2/8.2
Specific conductance
(u.S/cm) start/finish 1
43/42
32/20
30/19
20/19
Temperature (°C)
start/finish 1
18.9/18.7
19.2/19.0
21.0/21.6
18.8/19.2
1 Start refers to initial well-volume purging and finish refers to measurement at time of sample collection.
Soil samples were collected at the SAFR during installation of observation wells and impact-berm boreholes. Samples were collected during observation-well borehole drilling using a split-spoon coring device as previously described or were collected from drill cuttings brought to the surface during drilling. Soil samples were collected from the cuttings of the six impact- berm boreholes, which were hand augered to a depth of 13 ft using a stainless-steel hand auger (fig. 2). To reduce the chance of cross-borehole contamination, the hand auger was rinsed with methanol and distilled water between boreholes.
Ground-water samples from the four observation wells and soil samples from the boreholes in the impact berm and observation wells were analyzed for trace elements using the following USEPA approved analytical methods inductively coupled plasma (ICP), flame ionization atomic adsorption spectroscopy (FIAA), and graphite furnace atomic adsorption spectroscopy (GFAA). The soil samples were elutriated for analysis using the Toxicity Characteristics Leaching Procedure (TCLP), method SW846:1311, Federal Register, vol. 55, no. 61 (USEPA, 1990b). The regulatory limits for the trace element concentrations elutriated by this method are listed (table 5). Any TCLP constituent present in the leachate at or above the regulatory limit is regarded as hazardous waste (Code 40 CFR Part 261.20, Subpart C (USEPA, 1990c). The TCLP procedure simulates leachate-formation characteristics under conditions of a soil receiving rainfall at a pH of 5 for 10 days.
Quality-Control and Quality-Assurance Program
The contract laboratory used for ground-water and soil trace-element analyses is certified (#40111) by the state of South Carolina. The laboratory participates in an internal quality-control program consisting of sample runs with the inclusion of matrix spikes and blanks. Also, as part
of a field-quality assurance program, a duplicate ground-water sample was collected and submitted for analysis to verify the analytical reproducibility of the contract laboratory. There was no difference in the analytical results of the two duplicate samples.
Field-quality assurance and quality-control measures included steam cleaning all drilling equipment before the installation of each observation well, and the decontamination of all ground-water and soil sampling equipment with multiple rinsings by methanol and distilled water. Dedicated disposable latex gloves were used during the handling of all ground-water and soil samples.
ASSESSMENT OF CONCENTRATIONS OF TRACE ELEMENTS IN GROUND WATER AND SOIL
The results of trace-element analyses of ground-water and soil samples collected during the field-sampling program at the SAFR are summarized in the following sections. Concentrations of total trace elements in ground-water samples and concentrations of total and leachable trace elements for soil samples are presented.
Trace Elements in Ground Water
Ground-water samples were collected from the four observation wells on May 19,1992 and July 28, 1992, and analyzed for total trace elements. The analytical results from May 19, 1992, indicate that concentrations of most trace elements in these samples were below the analytical method detection limit, including lead (table 3). Of the eight trace elements analyzed for, only mercury was detected in two observation wells (OW1 and OW3) in concentrations that equaled the detection limit. Cadmium concentrations in all four observation wells were below the detection limit of the analytical method; however, the detection limit (0.010 mg/L) is twice the maximum contaminant level (0.005 mg/L), therefore, the possibility exists that cadmium concentrations could exceed the MCL. However, cadmium concentrations in the soil from the impact berm were less than the detection limit, and concentrations of leachable cadmium were also below the detection limit (see next section).
Trace Elements in SoilLaboratory analyses of total trace-element concentration in soil samples collected at the
study area indicate that high trace-element concentrations were detected only in soil samples from the impact berm (table 4). Total arsenic concentrations in soil from the impact berm ranged from below the detection limit to 7.14 mg/kg. Total barium concentrations in soil from the impact berm ranged from 8.60 to 15.00 mg/kg. Total cadmium in the impact berm was at concentrations less than the detection limit. Chromium concentrations ranged from 6.28 to 15.10 mg/kg in soil from the impact berm. Total lead concentration in the impact berm ranged from 93.60 to 12,500 mg/kg. Mercury concentrations in the impact-berm soil ranged from below the detection limit to 0.06 mg/kg. Both selenium and silver concentrations in the impact-berm soils were below the detection limit. Background trace-element concentrations in soils collected at observation well 2 (OW2) were below the detection limit for arsenic, cadmium, selenium, and silver. Barium concentrations in soil samples from this site ranged from 10.4 to 53.0 mg/kg and chromium concentrations ranged from 2.60 to 3.20 mg/kg. Total lead concentrations in soil samples at this site ranged from below the detection limit to 3.89 mg/kg and total mercury concentrations ranged from less than the detection limit to 0.03 mg/kg.
15

Table 3.-Location of ground-water sampling sites, analytical method detection limit, U.S. Environmental Protection Agency maximum contaminant level, and summary of total trace-element concentrations in water from observation wells at the Small-Arms Firing Range, Shaw Air Force Base, South Carolina, May - July 1992
[mg/L, milligrams per liter; <, less than; -, indicates no data collected]
Observation well number
(fig- 2)
OW1
OW2
Trace element
Arsenic
Barium
Cadmium
Chromium
Lead
Mercury
Selenium
Silver
Arsenic
Barium
Cadmium
Chromium
Lead
Mercury
Selenium
Silver
Analytical method
detection limit
(mg/L)
0.005
.050
.010
.050
.005
.0002
.005
.050
.005
.050
.010
.050
.005
.0002
.005
.050
Maximum contaminant
level 1
(mg/LJ
0.05
2
.005
.1
.05
.002
.05
.05
.05
2
.005
.1
.05
.002
.05
.05
Result, May 19, 1992
(mg/L)
<0.005
<.050
<.010
<.050
<.005
.0002
<.005
<.050
<.005
<.050
<.010
<.050
<.005
<.0002
<.005
<.050
Result, July 28, 1992
(mg/L)
._.._
-----
<0.005
-----
.....
.....
-----
-----
-----
<.005
-----
16
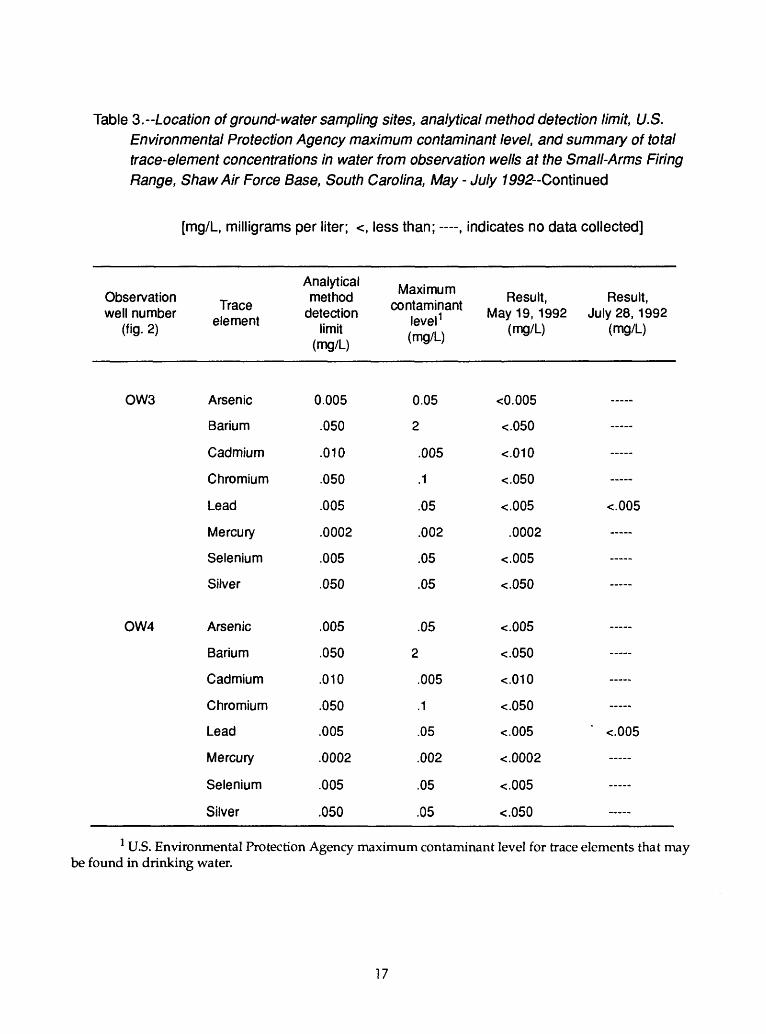
Table 3.-Location of ground-water sampling sites, analytical method detection limit, U.S. Environmental Protection Agency maximum contaminant level, and summary of total trace-element concentrations in water from observation wells at the Small-Arms Firing Range, Shaw Air Force Base, South Carolina, May - July 1992--Cor\\mued
[mg/L, milligrams per liter; <, less than; -, indicates no data collected]
Observation well number
(fig. 2)
OW3
OW4
Trace element
Arsenic
Barium
Cadmium
Chromium
Lead
Mercury
Selenium
Silver
Arsenic
Barium
Cadmium
Chromium
Lead
Mercury
Selenium
Silver
Analytical method
detection limit
(mg/L)
0.005
.050
.010
.050
.005
.0002
.005
.050
.005
.050
.010
.050
.005
.0002
.005
.050
Maximum contaminant
level 1
(mg/L)
0.05
2
.005
.1
.05
.002
05. V/vJ
.05
.05
2
.005
.1
.05
.002
.05
.05
Result, May 19, 1992
(mg/L)
<0.005
<.050
<.010
<.050
<.005
.0002
<.005
<.050
<.005
<.050
<.010
<.050
<.005
<.0002
<.005
<.050
Result, July 28, 1992
(mg/L)
.....-----
-----
.....
<.005
.....
-----
.....
.....
-----
' <.005
.....
.....
.....
1 U.S. Environmental Protection Agency maximum contaminant level for trace elements that may be found in drinking water.
17
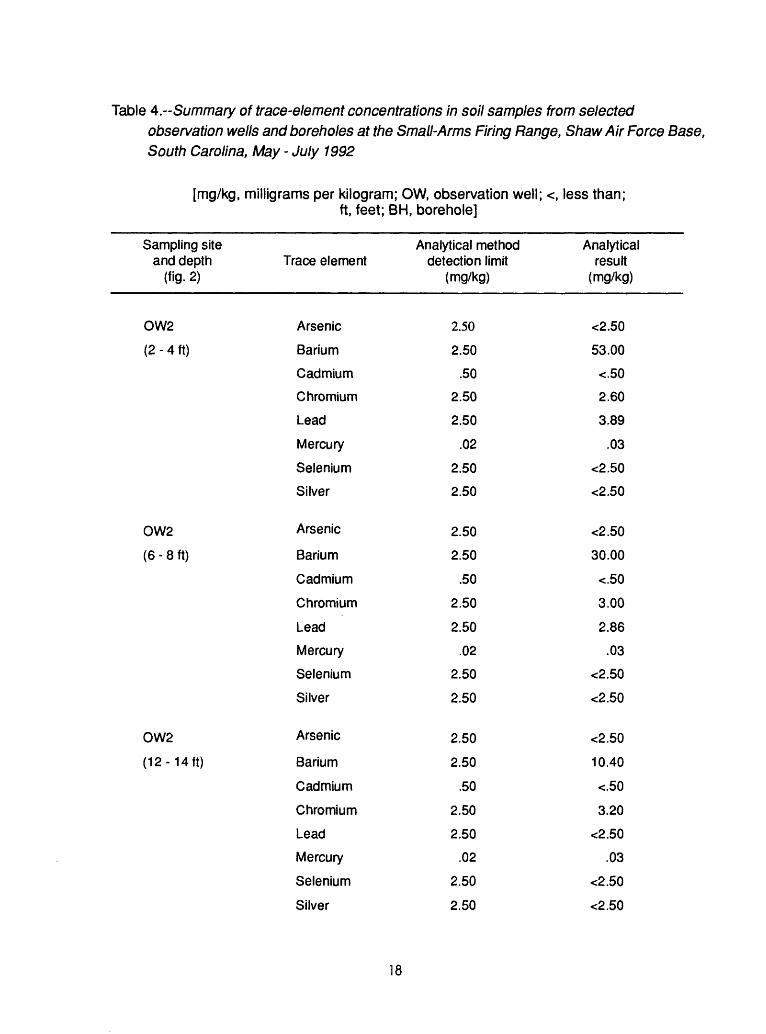
Table 4.-Summary of trace-element concentrations in soil samples from selectedobservation wells and boreholes at the Small-Arms Firing Range, Shaw Air Force Base, South Carolina, May - July 1992
[mg/kg, milligrams per kilogram; OW, observation well; <, less than;ft, feet; BH, borehole]
Sampling site and depth Trace element
(fig- 2)
OW2 Arsenic
(2 - 4 ft) Barium
Cadmium
Chromium
Lead
Mercury
Selenium
Silver
OW2 Arsenic
(6 - 8 ft) Barium
Cadmium
Chromium
Lead
Mercury
Selenium
Silver
OW2 Arsenic
(12 -14 ft) Barium
Cadmium
Chromium
Lead
Mercury
Selenium
Silver
Analytical method detection limit
(mg/kg)
2.50
2.50
.50
2.50
2.50
.02
2.50
2.50
2.50
2.50
.50
2.50
2.50
.02
2.50
2.50
2.50
2.50
.50
2.50
2.50
.02
2.50
2.50
Analytical result
(mg/kg)
<2.50
53.00
<.50
2.60
3.89
.03
<2.50
<2.50
<2.50
30.00
<.50
3.00
2.86
.03
<2.50
<2.50
<2.50
10.40
<.50
3.20
<2.50
.03
<2.50
<2.50
18
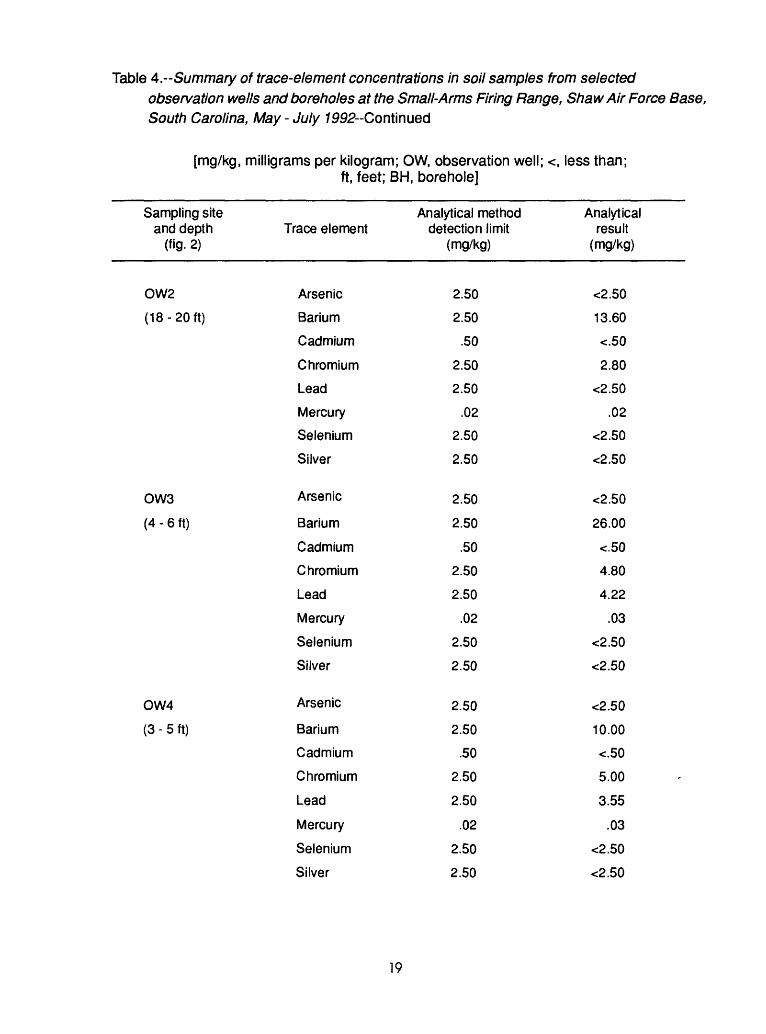
Table 4.~Summary of trace-element concentrations in soil samples from selectedobservation wells and boreholes at the Small-Arms Firing Range, Shaw Air Force Base, South Carolina, May - July 7992-Continued
[mg/kg, milligrams per kilogram; OW, observation well; <, less than;ft, feet; BH, borehole]
Sampling site and depth
(fig- 2)
OW2
(18 -20 ft)
OW3
(4 - 6 ft)
OW4
(3 - 5 ft)
Trace element
Arsenic
Barium
Cadmium
Chromium
Lead
Mercury
Selenium
Silver
Arsenic
Barium
Cadmium
Chromium
Lead
Mercury
Selenium
Silver
Arsenic
Barium
Cadmium
Chromium
Lead
Mercury
Selenium
Silver
Analytical method detection limit
(mg/kg)
2.50
2.50
.50
2.50
2.50
.02
2.50
2.50
2.50
2.50
.50
2.50
2.50
.02
2.50
2.50
2.50
2.50
.50
2.50
2.50
.02
2.50
2.50
Analytical result
(mg/kg)
<2.50
13.60
<.50
2.80
<2.50
.02
<2.50
<2.50
<2.50
26.00
<.50
4.80
4.22
.03
<2.50
<2.50
<2.50
10.00
<.50
5.00
3.55
.03
<2.50
<2.50
19

Table ^.-Summary of trace-element concentrations in soil samples from selectedobservation wells and boreholes at the Small-Arms Firing Range, Shaw Air Force Base, South Carolina, May - July 7SS2~Continued
[mg/kg, milligrams per kilogram; OW, observation well; <, less than;ft, feet; BH, borehole]
Sampling site and depth
(fig. 2)
OW4
(10 -13 ft)
OW4
(18 -20 ft)
BH1
(0 - 0.5 ft)
Trace element
Arsenic
Barium
Cadmium
Chromium
Lead
Mercury
Selenium
Silver
Arsenic
Barium
Cadmium
Chromium
Lead
Mercury
Selenium
Silver
Arsenic
Barium
Cadmium
Chromium
Lead
Mercury
Selenium
Silver
Analytical method detection limit
(mg/kg)
2.50
2.50
.50
2.50
2.50
.02
2.50
2.50
2.50
2.50
.50
2.50
2.50
.02
2.50
2.50
2.50
2.50
.50
2.50
2.50
.02
2.50
2.50
Analytical result
(mg/kg)
<2.50
5.80
<.50
3.20
3.52
.02
<2.50
<2.50
<2.50
5.60
<.50
3.00
2.50
<.02
<2.50
<2.50
7.14
8.60
<.50
6.80
12,500.00
<.02
<2.50
<2.50
20
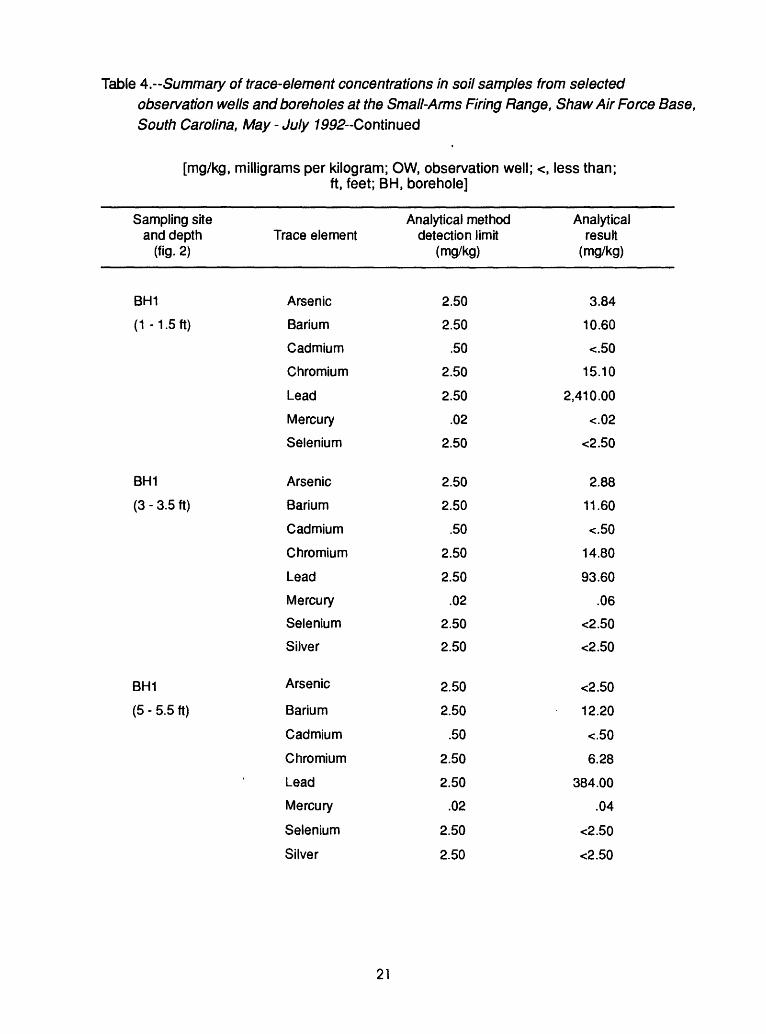
Table ^.--Summary of trace-element concentrations in soil samples from selectedobservation wells and boreholes at the Small-Arms Firing Range, Shaw Air Force Base, South Carolina, May - July 1992-Continued
[mg/kg, milligrams per kilogram; OW, observation well; <, less than;ft, feet; BH, borehole]
Sampling site and depth Trace element
(fig- 2)
BH1 Arsenic
(1-1. 5 ft) Barium
Cadmium
Chromium
Lead
Mercury
Selenium
BH1 Arsenic
(3 - 3.5 ft) Barium
Cadmium
Chromium
Lead
Mercury
Selenium
Silver
BH1 Arsenic
(5 - 5.5 ft) Barium
Cadmium
Chromium
Lead
Mercury
Selenium
Silver
Analytical method detection limit
(mg/kg)
2.50
2.50
.50
2.50
2.50
.02
2.50
2.50
2.50
.50
2.50
2.50
.02
2.50
2.50
2.50
2.50
.50
2.50
2.50
.02
2.50
2.50
Analytical result
(mg/kg)
3.84
10.60
<.50
15.10
2,410.00
<.02
<2.50
2.88
11.60
<.50
14.80
93.60
.06
<2.50
<2.50
<2.50
12.20
<.50
6.28
384.00
.04
<2.50
<2.50
21

Table 4.--Summary of trace-element concentrations in soil samples from selectedobservation wells and boreholes at the Small-Arms Firing Range, Shaw Air Force Base, South Carolina, May - July 1992--Cont\nued
[mg/kg, milligrams per kilogram; OW, observation well; <, less than;ft, feet; BH, borehole]
Sampling site and depth
(fig. 2)
BH1
(9.5 -10 ft)
BH3
(0.0 - 0.5 ft)
BH3
(3 - 3.5 ft)
Trace element
Arsenic
Barium
Cadmium
Chromium
Lead
Mercury
Selenium
Silver
Arsenic
Barium
Cadmium
Chromium
Lead
Mercury
Selenium
Silver
Arsenic
Barium
Cadmium
Chromium
Lead
Mercury
Selenium
Silver
Analytical method detection limit
(mg/kg)
2.50
2.50
.50
2.50
2.50
.02
2.50
2.50
2.50
2.50
.50
2.50
2.50
.02
2.50
2.50
2.50
2.50
.50
2.50
2.50
.02
2.50
2.50
Analytical result
(mg/kg)
<2.50
8.88
<.50
7.62
3,630.00
.03
<2.50
<2.50
<2.50
15.00
<.50
11.00
2,790.00
.03
<2.50
<2.50
5.22
10.00
<.50
11.00
6,040.00
.03
<2.50
<2.50
22

Table ^.--Summary of trace-element concentrations in soil samples from selectedobservation wells and boreholes at the Small-Arms Firing Range, Shaw Air Force Base, South Carolina, May - July 1 992--Continued
[mg/kg, milligrams per kilogram; OW, observation well; <, less than;ft, feet; BH, borehole]
Sampling site and depth Trace element
(fig- 2)
BH3 Arsenic
(5 - 5.5 ft) Barium
Cadmium
Chromium
Lead
Mercury
Selenium
Silver
BH6 Arsenic
(0 - 0.5 ft) Barium
(range floor) Cadmium
Chromium
Lead
Mercury
Selenium
Silver
BH6 Arsenic
(3 - 3.5 ft) Barium
(range floor) Cadmium
Chromium
Lead
Mercury
Selenium
Silver
Analytical method detection limit
(mg/kg)
2.50
2.50
.50
2.50
2.50
.02
2.50
2.50
2.50
2.50
.50
2.50
2.50
.02
2.50
2.50
2.50
2.50
.50
2.50
2.50
.02
2.50
2.50
Analytical result
(mg/kg)
2.95
9.60
<.50
8.40
5,380.00
.03
<2.50
<2.50
<2.50
8.80
<.50
6.20
4,920.00
<.02
<2.50
<2.50
2.50
5.60
<.50
11.00
16.20
<.02
<2.50
<2.50
23

Table 4.--Summary of trace-element concentrations in soil samples from selectedobservation wells and boreholes at the Small-Arms Firing Range, Shaw Air Force Base, South Carolina, May - July 7992--Continued
[mg/kg, milligrams per kilogram; OW, observation well; <, less than;ft, feet; BH, borehole]
Sampling site and depth
(fig. 2)
BH6
(9 - 9.5 ft)
(range floor)
BH6
(13 -13.5 ft)
(range floor)
Trace element
Arsenic
Barium
Cadmium
Chromium
Lead
Mercury
Selenium
Silver
Arsenic
Barium
Cadmium
Chromium
Lead
Mercury
Selenium
Silver
Analytical method detection limit
(mg/kg)
2.50
2.50
.50
2.50
2.50
.02
2.50
2.50
2.50
2.50
.50
2.50
2.50
.02
2.50
2.50
Analytical result
(mg/kg)
<2.50
13.00
<.50
7.40
15.20
<.02
<2.50
<2.50
<2.50
7.30
<.50
4.20
3.02
<.02
<2.50
<2.50
The TCLP was used to identify trace elements present in the soil at the study area that exceed USEPA MCL's for leachable trace elements. Leachate trace-element concentrations indicated that eight soil samples collected from the impact berm exceeded the EPA MCL for leachable lead of 5 mg/L (table 5). Leachable lead concentrations ranged from 2.00 to 495.00 mg/L in soils collected from the impact berm at depths ranging from 0 to 10 ft. Concentrations of leachable arsenic, barium, cadmium, chromium, mercury, selenium, and silver were below the detection limit. Concentrations of lead and other trace elements in background soil samples collected during the installation of observation wells 2, 3, and 4 (OW2, OW3, and OW4) were below the detection limit.
24
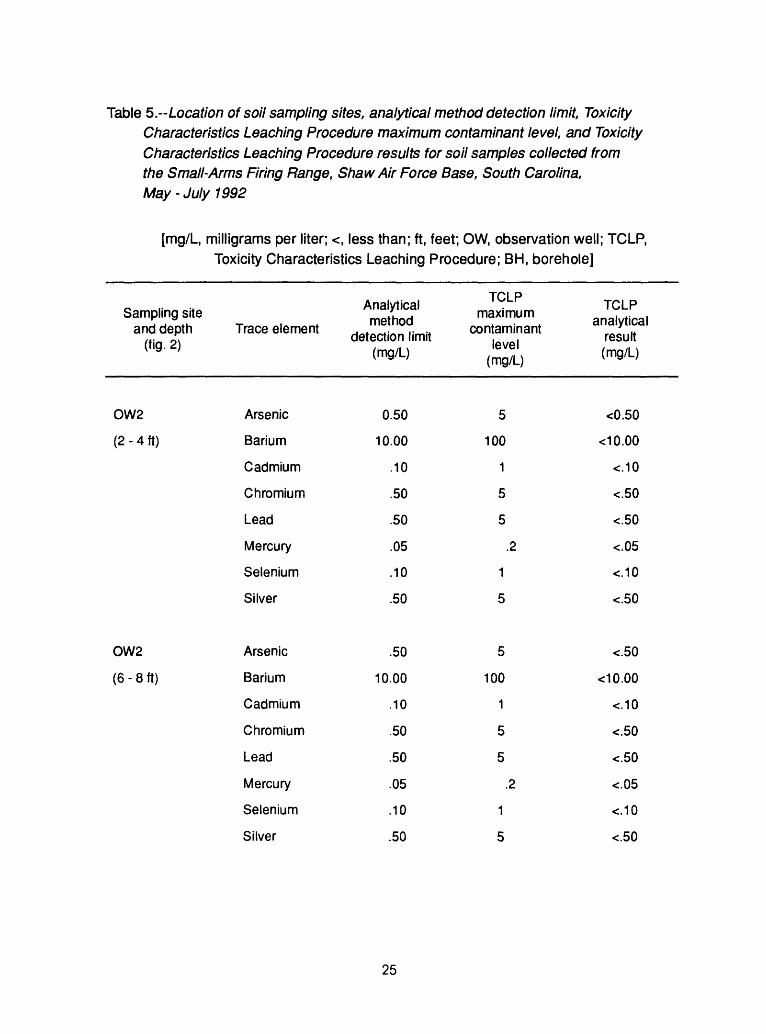
Table 5 .--Location of soil sampling sites, analytical method detection limit, Toxicity Characteristics Leaching Procedure maximum contaminant level, and Toxicity Characteristics Leaching Procedure results for soil samples collected from the Small-Arms Firing Range, Shaw Air Force Base, South Carolina, May-July 1992
[mg/L, milligrams per liter; <, less than; ft, feet; OW, observation well; TCLP, Toxicity Characteristics Leaching Procedure; BH, borehole]
Sampling site and depth Trace element
(fig- 2)
OW2 Arsenic
(2 - 4 ft) Barium
Cadmium
Chromium
Lead
Mercury
Selenium
Silver
OW2 Arsenic
(6 - 8 ft) Barium
Cadmium
Chromium
Lead
Mercury
Selenium
Silver
Analytical method
detection limit (mg/L)
0.50
10.00
.10
.50
.50
.05
.10
.50
.50
10.00
.10
.50
.50
.05
.10
.50
TCLP maximum
contaminant level
(mg/L)
5
100
1
5
5
.2
1
5
5
100
1
5
5
.2
1
5
TCLP analytical
result (mg/L)
<0.50
<10.00
<.10
<.50
<.50
<.05
<.10
<.50
<.50
<10.00
<.10
<.50
<.50
<.05
<.10
<.50
25
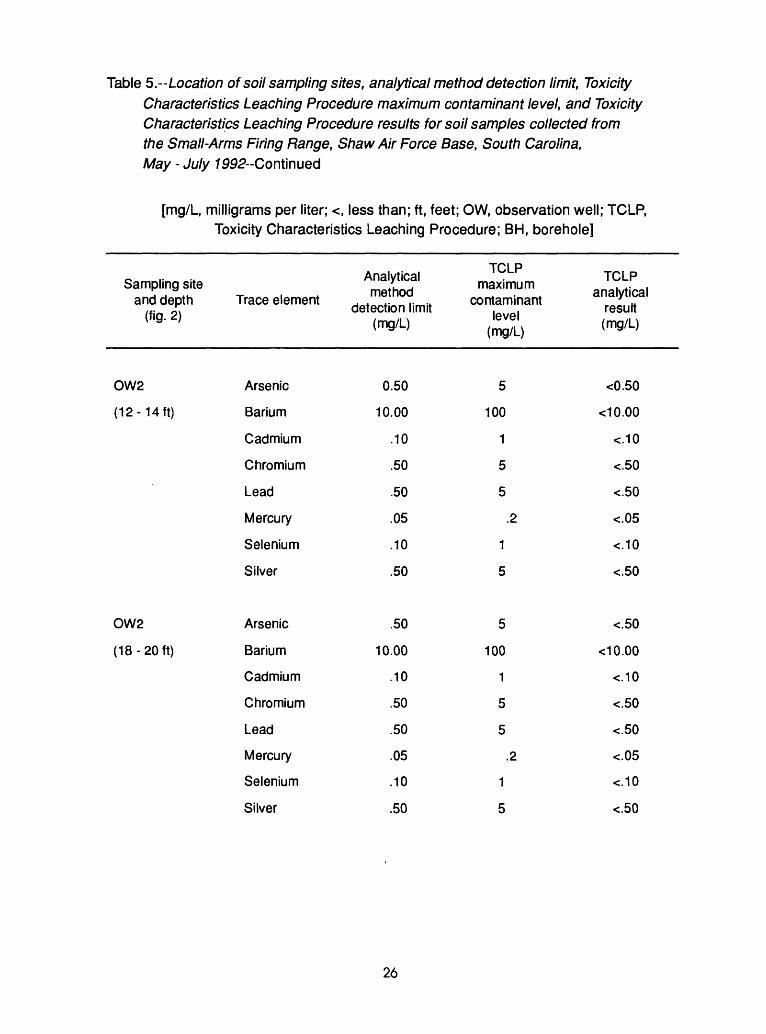
Table 5.--Location of soil sampling sites, analytical method detection limit, Toxicity Characteristics Leaching Procedure maximum contaminant level, and Toxicity Characteristics Leaching Procedure results for soil samples collected from the Small-Arms Firing Range, Shaw Air Force Base, South Carolina, May - July 7992--Continued
[mg/L, milligrams per liter; <, less than; ft, feet; OW, observation well; TCLP, Toxicity Characteristics Leaching Procedure; BH, borehole]
Sampling site and depth
(fig- 2)
OW2
(12 -14 ft)
OW2
(18 -20 ft)
Trace element
Arsenic
Barium
Cadmium
Chromium
Lead
Mercury
Selenium
Silver
Arsenic
Barium
Cadmium
Chromium
Lead
Mercury
Selenium
Silver
Analytical method
detection limit (mg/L)
0.50
10.00
.10
.50
.50
.05
.10
.50
.50
10.00
.10
.50
.50
.05
.10
.50
TCLP maximum
contaminant level
(mg/L)
5
100
1
5
5
.2
1
5
5
100
1
5
5
.2
1
5
TCLP analytical
result (mg/L)
<0.50
<10.00
<.10
<.50
<.50
<.05
<.10
<.50
<.50
<10.00
<.10
<.50
<.50
<.05
<.10
<.50
26

Table 5.--Location of soil sampling sites, analytical method detection limit, Toxicity Characteristics Leaching Procedure maximum contaminant level, and Toxicity Characteristics Leaching Procedure results for soil samples collected from the Small-Arms Firing Range, Shaw Air Force Base, South Carolina, May - July 7992--Continued
[mg/L, milligrams per liter; <, less than; ft, feet; OW, observation well; TCLP, Toxicity Characteristics Leaching Procedure; BH, borehole]
Sampling site and depth Trace element
(fig. 2)
OW3 Arsenic
(4 - 6 ft) Barium
Cadmium
Chromium
Lead
Mercury
Selenium
Silver
OW4 Arsenic
(3 - 5 ft) Barium
Cadmium
Chromium
Lead
Mercury
Selenium
Silver
Analytical method
detection limit (mg/L)
0.50
10.00
.10
.50
.50
.05
.10
.50
.50
10.00
.10
.50
.50
.05
.10
.50
TCLP maximum
contaminant level
(mg/L)
5
100
1
5
5
.2
1
5
5
100
1
5
5
.2
1
5
TCLP analytical
result (mg/L)
<0.50
<10.00
<.10
<.50
<.50
<.05
<.10
<.50
<.50
<10.00
<.10
<.50
<.50
<.05
<.10
<,50
27
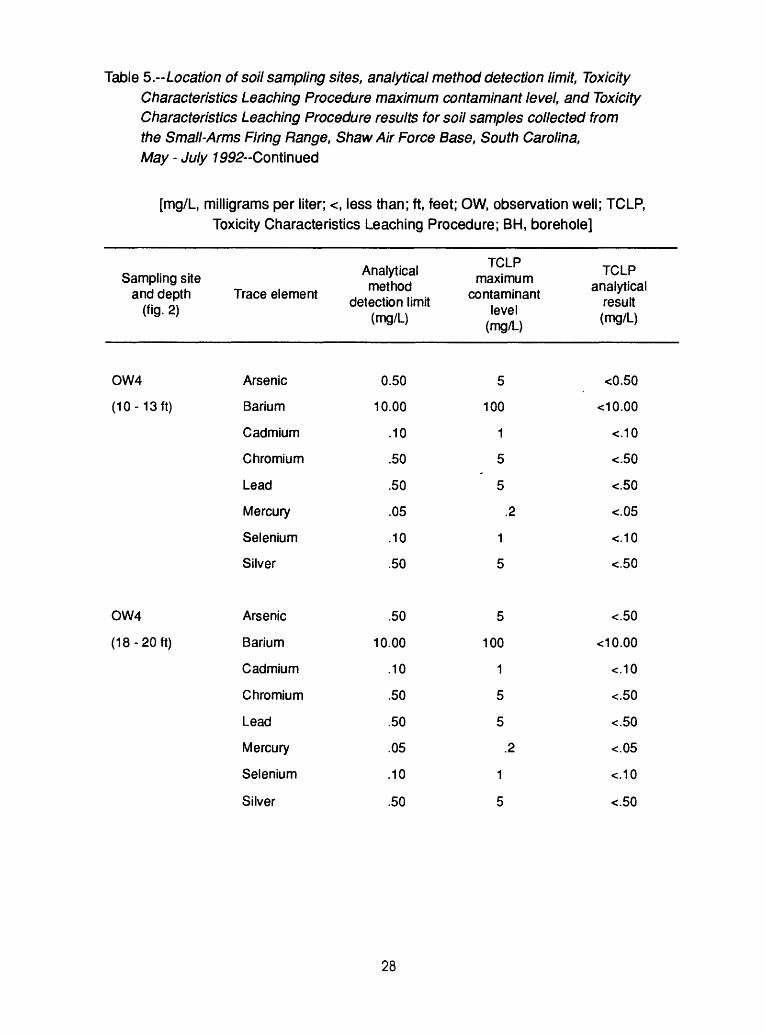
Table 5.--Location of soil sampling sites, analytical method detection limit, Toxicity Characteristics Leaching Procedure maximum contaminant level, and Toxicity Characteristics Leaching Procedure results for soil samples collected from the Small-Arms Firing Range, Shaw Air Force Base, South Carolina, May - July 7992--Continued
[mg/L, milligrams per liter; <, less than; ft, feet; OW, observation well; TCLP, Toxicity Characteristics Leaching Procedure; BH, borehole]
Sampling site and depth
(fig- 2)
OW4
(10 -13 ft)
OW4
(18 -20 ft)
Trace element
Arsenic
Barium
Cadmium
Chromium
Lead
Mercury
Selenium
Silver
Arsenic
Barium
Cadmium
Chromium
Lead
Mercury
Selenium
Silver
Analytical method
detection limit (mg/L)
0.50
10.00
.10
.50
.50
.05
.10
.50
.50
10.00
.10
.50
.50
.05
.10
.50
TCLP maximum
contaminant level
(mg/L)
5
100
1
5
5
.2
1
5
5
100
1
5
5
.2
1
5
TCLP analytical
result (mg/L)
<0.50
<10.00
<.10
<.50
<.50
<.05
<.10
<.50
<.50
<10.00
<.10
<.50
<.50
<.05
<.10
<.50
28

Table 5.-Location of soil sampling sites, analytical method detection limit, Toxicity Characteristics Leaching Procedure maximum contaminant level, and Toxicity Characteristics Leaching Procedure results for soil samples collected from the Small-Arms Firing Range, Shaw Air Force Base, South Carolina, May - July 1992~Cont\nued
[mg/L, milligrams per liter; <, less than; ft, feet; OW, observation well; TCLP, Toxicity Characteristics Leaching Procedure; BH, borehole]
Sampling site and depth Trace element
(fig. 2)
BH1 Arsenic
(0.0 - 0.5 ft) Barium
Cadmium
Chromium
Lead
Mercury
Selenium
Silver
BH1 Arsenic
(1-1. 5 ft) Barium
Cadmium
Chromium
Lead
Mercury
Selenium
Silver
Analytical method
detection limit (mg/L)
0.50
10.00
.10
.50
.50
.05
.10
.50
.50
10.00
.10
.50
.50
.05
.10
.50
TCLP maximum
contaminant level
(mg/L)
5
100
1
5
5
.2
1
5
5
100
1
5
5
.2
1
5
TCLP analytical
result (mg/L)
<0.50
<10.00
<.10
<.50
495.00
<.05
<.10
<.50
<.50
<10.00
<.10
<.50
46.00
<.05
<.10
<.50
29

Table 5.-Location of soil sampling sites, analytical method detection limit, Toxicity Characteristics Leaching Procedure maximum contaminant level, and Toxicity Characteristics Leaching Procedure results for soil samples collected from the Small-Arms Firing Range, Shaw Air Force Base, South Carolina, May - July 1 992--Continued
[mg/L, milligrams per liter; <, less than; ft, feet; OW, observation well; TCLP, Toxicity Characteristics Leaching Procedure; BH, borehole]
Sampling site and depth Trace element
(fig- 2)
BH1 Arsenic
(3 - 3.5 ft) Barium
Cadmium
Chromium
Lead
Mercury
Selenium
Silver
BH1 Arsenic
(5 - 5.5 ft) Barium
Cadmium
Chromium
Lead
Mercury
Selenium
Silver
Analytical method
detection limit (mg/L)
0.50
10.00
.10
.50
.50
.05
.10
.50
.50
10.00
.10
.50
.50
.05
.10
.50
TCLP maximum
contaminant level
(mg/L)
5
100
1
5
5
.2
1
5
5
100
1
5
5
.2
1
5
TCLP analytical
result (mg/L)
<0.50
<10.00
<.10
<.50
2.00
<.05
<.10
<.50
<.50
<10.00
<.10
<.50
16.50
<.05
<.10
<.50
30

Table ^.--Location of soil sampling sites, analytical method detection limit, Toxicity Characteristics Leaching Procedure maximum contaminant level, and Toxicity Characteristics Leaching Procedure results for soil samples collected from the Small-Arms Firing Range, Shaw Air Force Base, South Carolina, May - July 7992--Continued
[mg/L, milligrams per liter; <, less than; ft, feet; OW, observation well; TCLP, Toxicity Characteristics Leaching Procedure; BH, borehole]
Sampling site and depth Trace element
(fig- 2)
BH1 Arsenic
(9.5 -10 ft) Barium
Cadmium
Chromium
Lead
Mercury
Selenium
Silver
BH3 Arsenic
(0.0 - 0.5 ft) Barium
Cadmium
Chromium
Lead
Mercury
Selenium
Silver
Analytical method
detection limit (mg/L)
0.50
10.00
.10
.50
.50
.05
.10
.50
.50
10.00
.10
.50
.50
.05
.10
.50
TCLP maximum
contaminant level
(mg/L)
5
100
1
5
5
.2
1
5
5
100
1
5
5
.2
1
5
TCLP analytical
result (mg/L)
<0.50
<10.00
<.10
<.50
156.00
<.05
<.10
<.50
<.50
<10.00
<.10
<.50
402.00
<.05
<.10
<.50
31
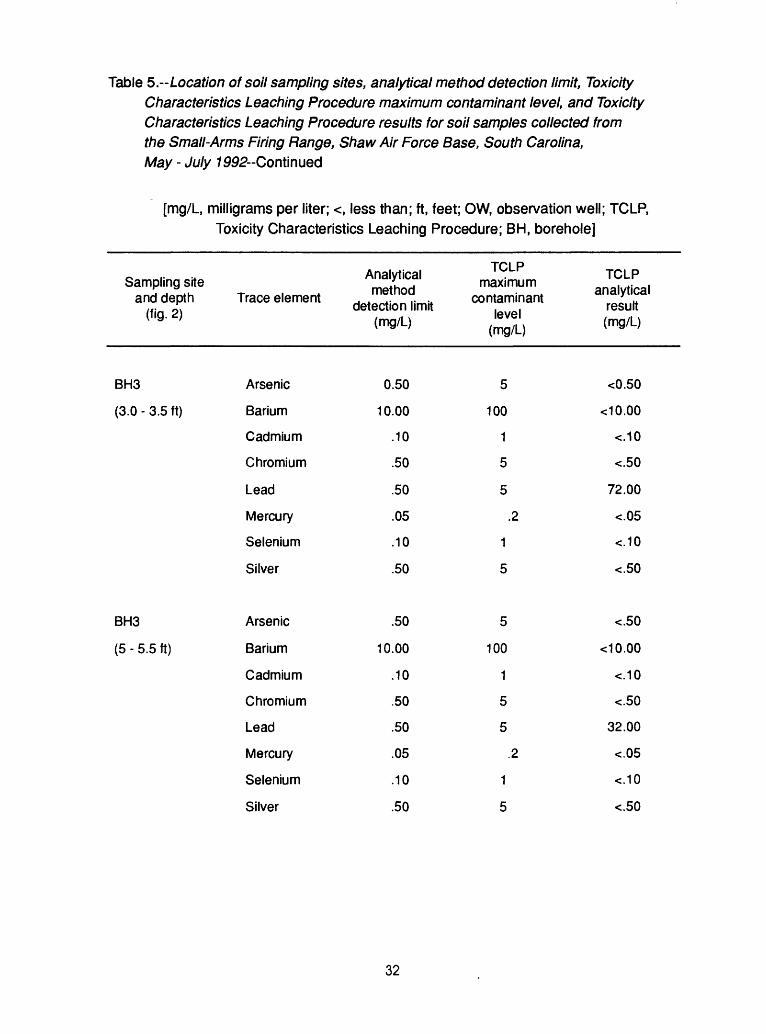
Table 5.-Location of soil sampling sites, analytical method detection limit, Toxicity Characteristics Leaching Procedure maximum contaminant level, and Toxicity Characteristics Leaching Procedure results for soil samples collected from the Small-Arms Firing Range, Shaw Air Force Base, South Carolina, May - July 7992-Continued
[mg/L, milligrams per liter; <, less than; ft, feet; OW, observation well; TCLP, Toxicity Characteristics Leaching Procedure; BH, borehole]
Sampling site and depth Trace element
(fig- 2)
BH3 Arsenic
(3.0 - 3.5 ft) Barium
Cadmium
Chromium
Lead
Mercury
Selenium
Silver
BH3 Arsenic
(5 - 5.5 ft) Barium
Cadmium
Chromium
Lead
Mercury
Selenium
Silver
Analytical method
detection limit (mg/L)
0.50
10.00
.10
.50
.50
.05
.10
.50
.50
10.00
.10
.50
.50
.05
.10
.50
TCLP maximum
contaminant level
(mg/L)
5
100
1
5
5
.2
1
5
5
100
1
5
5
.2
1
5
TCLP analytical
result (mg/L)
<0.50
<10.00
<.10
<.50
72.00
<.05
<.10
<.50
<.50
<10.00
<.10
<.50
32.00
<.05
<.10
<.50
32

Table 5.--Location of soil sampling sites, analytical method detection limit, Toxicity Characteristics Leaching Procedure maximum contaminant level, and Toxicity Characteristics Leaching Procedure results for soil samples collected from the Small-Arms Firing Range, Shaw Air Force Base, South Carolina, May - July 1992-Conimue6
[mg/L, milligrams per liter; <, less than; ft, feet; OW, observation well; TCLP, Toxicity Characteristics Leaching Procedure; BH, borehole]
Sampling site and depth
(fig- 2)
BH6
(0.0 -0.5 ft)
(range floor)
BH6
(3 -3.5 ft)
(range floor)
Trace element
Arsenic
Barium
Cadmium
Chromium
Lead
Mercury
Selenium
Silver
Arsenic
Barium
Cadmium
Chromium
Lead
Mercury
Selenium
Silver
Analytical method
detection limit (mg/L)
0.50
10.00
.10
.50
.50
.05
.10
.50
.50
10.00
.10
.50
.50
.05
.10
.50
TCLP maximum
contaminant level
(mg/L)
5
100
1
5
5
.2
1
5
5
100
1
5
5
.2
1
5
TCLP analytical
result (mg/L)
<0.50
<10.00
<.10
<.50
56.00
<.05
<.10
<.50
<.50
<10.00
<.10
<.50
<.50
<.05
<.10
<.50
33
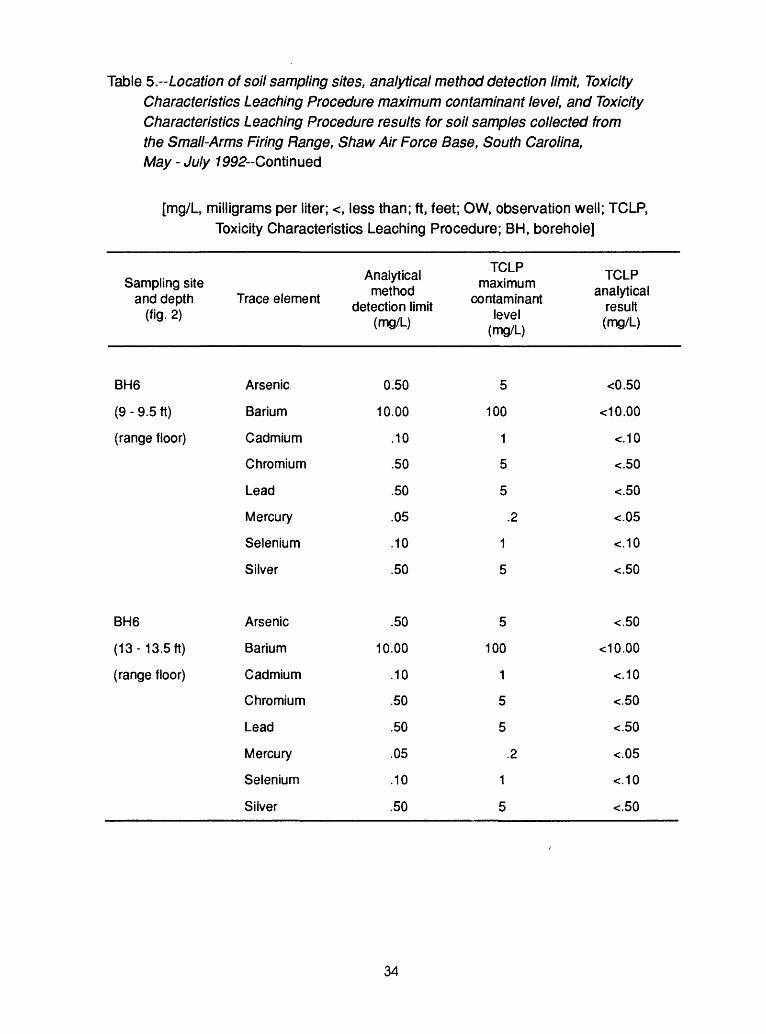
Table 5 .-Location of soil sampling sites, analytical method detection limit, Toxicity Characteristics Leaching Procedure maximum contaminant level, and Toxicity Characteristics Leaching Procedure results for soil samples collected from the Small-Arms Firing Range, Shaw Air Force Base, South Carolina, May - July 7992--Continued
[mg/L, milligrams per liter; <, less than; ft, feet; OW, observation well; TCLP, Toxicity Characteristics Leaching Procedure; BH, borehole]
Sampling site and depth
(fig- 2)
BH6
(9 - 9.5 ft)
(range floor)
BH6
(13 -13.5 ft)
(range floor)
Trace element
Arsenic
Barium
Cadmium
Chromium
Lead
Mercury
Selenium
Silver
Arsenic
Barium
Cadmium
Chromium
Lead
Mercury
Selenium
Silver
Analytical method
detection limit (mg/L)
0.50
10.00
.10
.50
.50
.05
.10
.50
.50
10.00
.10
.50
.50
.05
.10
.50
TCLP maximum
contaminant level
(mg/L)
5
100
1
5
5
.2
1
5
5
100
1
5
5
.2
1
5
TCLP analytical
result (mg/L)
<0.50
<10.00
<.10
<.50
<.50
<.05
<.10
<.50
<.50
<10.00
<.10
<.50
<.50
<.05
<.10
<.50
34
The presence of potentially leachable lead exceeding the MCL in eight soil samples and the absence of lead in all ground-water samples analyzed is probably a function of the concentration of dissolved oxygen in ground water. Dissolved oxygen ranged from 5.8 to 8.2 mg/L in the observation wells sampled. At these levels of dissolved oxygen, lead forms insoluble compounds with common anions present in ground water (Krauskopf, 1979).
SUMMARY AND CONCLUSIONS
The U.S. Geological Survey investigated soil-bound trace-element concentrations and the potential for leachate formation and migration to the shallow ground-water-flow system at the Small-Arms Firing Range at Shaw Air Force Base, Sumter County, South Carolina. In April 1992, four shallow ground-water observation wells were installed at the Small-Arms Firing Range study area, and six hand-augered boreholes were completed in the impact-berm soil. Ground- water and soil samples were collected and analyzed to determine the distributions and migration potential of trace-elements at the study area.
Analyses of water samples collected from the shallow water-table aquifer indicated that total trace-element concentrations in water beneath the study site were at or below analytical detection limits, and did not exceed U.S Environmental Protection Agency maximum contaminant levels. No lead was detected above detection limits in any ground-water sample including the sample from the observation well (OW1) closest to and hydraulically downgradient from the lead-contaminated soil of the impact berm.
Soil samples from the heavily used impact berm contained concentrations of lead, chromium, barium, mercury, and arsenic in amounts greater than the analytical detection limits. Concentrations of lead, chromium, mercury, and arsenic above background levels were detected only in soils from the impact berm; no soil samples with elevated trace-element concentrations were collected from areas outside the area of the impact berm.
The leachate-forming potential of the soil-bound trace elements was quantified using the U.S. Environmental Protection Agency-approved Toxicity Characteristics Leaching Procedure. Concentrations of leachable lead above the Environmental Protection Agency maximum contaminant level for this procedure were in samples from the impact-berm soil from depths ranging from 0 to 10 ft. Lead Toxicity Characteristics Leaching Procedure results for soil samples collected in other areas indicated that trace-element concentrations were at or below the detection limit of the method. Toxicity Characteristics Leaching Procedure results were below detection limits for trace elements other than lead.
35

SELECTED REFERENCES
Aucott, W.R., and Speiran, G.K., 1985, Ground-water flow in the coastal plain aquifers of South Carolina: Ground Water, v. 23, no. 6, p. 736-745.
Krauskopf, K.B., 1979, Introduction to geochemistry: McGraw-Hill Book Company, 617 p.
Law Environmental Inc., 1988, Pre-remedial Investigation Report, Site 7-Former Landfill, Shaw Air Force Base, South Carolina.
Neilsen, D.M., 1991, Practical handbook of ground-water monitoring: Lewis Publishers, Inc., Chelsea, Michigan, 717 p.
Page, A.L., and Chang, A.C., 1993, Lead contaminated soils: Priorities for remediation?: Hazardous Waste & Hazardous Materials, v. 10, no. 1, p. 1-2.
Stringfield, W.J., Steirer, W.F., and Nolte, Ann, 1988, South Carolina water supply and use, in National Water Summary 1987 Water supply and use: U.S. Geological Survey Water- Supply Paper 2350, p. 453-458.
Swartzbaugh, Joseph, Sturgill, Jeffrey, Williams, H.D., and Cormier, Barbara, 1993, Remediating sites contaminated with heavy metals, Part n of IE: Hazardous Material Control, March/April, p. 51-59.
U.S. Environmental Protection Agency, 1990a, Environmental fact sheet: Toxicity characteristics rule finalized, Office of Solid Waste and Emergency Response, Washington, D.C.
U.S. Environmental Protection Agency, 1990b, TCLP Method, U.S. Code of Federal Regulations, SW 846:1311, v. 55, no. 61.
U.S. Environmental Protection Agency, 1990c, U.S. Code of Federal Regulations, Code 40, Part 261.20,SubpartC.
Wylie, Allan, and Wood, T.R., 1990, Computer Notes-A program to calculate hydraulic conductivity using slug test data: Ground Water, v. 28, no. 5, p. 783-787.
36
APPENDIXES
I. Location of sampling sites, detection limits, and results of trace-element analyses from soil samples collected November 2,1990, by Shaw Air Force Base personnel.
n. Location of sampling sites, detection limit, and lead Toxicity Characteristics Leaching Procedure results, from soil samples collected November 2,1990, by Shaw Air Force Base personnel.
in. Location of sampling sites, detection limits, and results of trace-elementanalyses from soil samples collected on April 22,1991, by Shaw Air Force Base personnel.
IV. Location of sampling sites, detection limit, and results of trace elementToxicity Characteristics Leaching Procedure analyses from soil samples collected on April 22,1991, by Shaw Air Force Base personnel.
V. Hammer blows required to collect split-spoon samples at OW1 (observation well 1).
VI. Grain-size analyses for borehole and observation well soil samples.
Vn. Borehole soil samples used for trace-element and Toxicity Characteristics Leaching Procedure analyses.
Vin. Ordnance used at the Small-Arms Firing Range study site between 1967 and 1992.
37
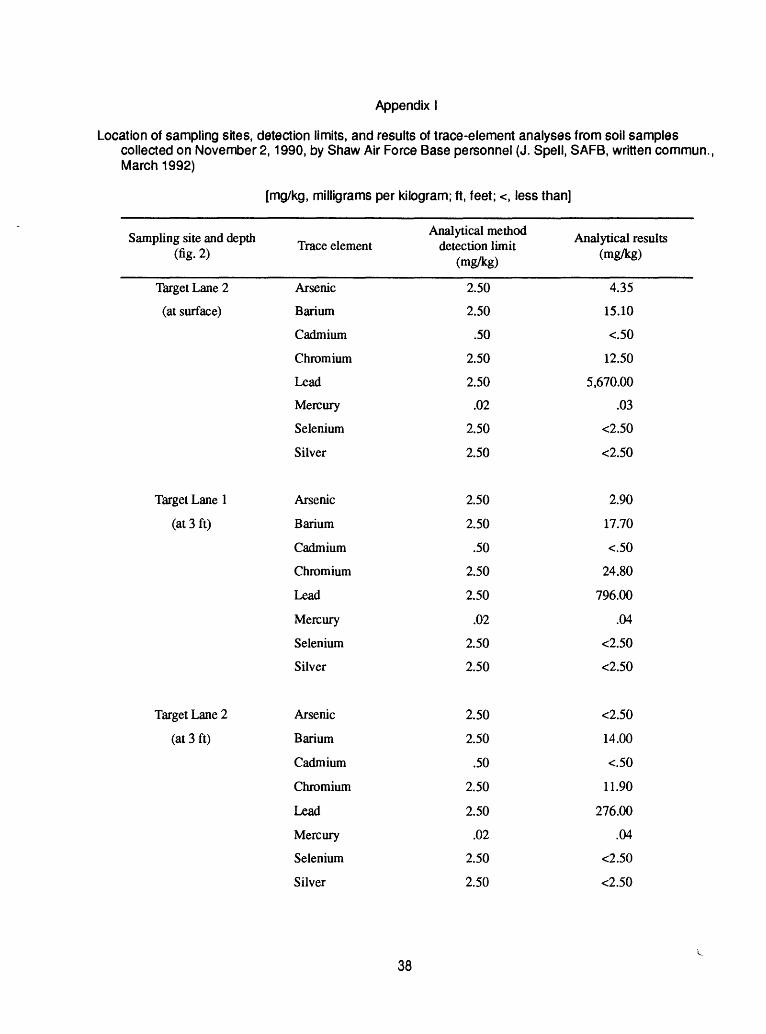
Appendix I
Location of sampling sites, detection limits, and results of trace-element analyses from soil samples collected on November 2,1990, by Shaw Air Force Base personnel (J. Spell, SAFB, written commun. March 1992)
[mg/kg, milligrams per kilogram; ft, feet; <, less than]
Sampling site and depth (fig. 2)
Target Lane 2
(at surface)
Target Lane 1
(at 3 ft)
Target Lane 2
(at 3 ft)
Trace element
Arsenic
Barium
Cadmium
Chromium
Lead
Mercury
Selenium
Silver
Arsenic
Barium
Cadmium
Chromium
Lead
Mercury
Selenium
Silver
Arsenic
Barium
Cadmium
Chromium
Lead
Mercury
Selenium
Silver
Analytical method detection limit
(mg/kg)
2.50
2.50
.50
2.50
2.50
.02
2.50
2.50
2.50
2.50
.50
2.50
2.50
.02
2.50
2.50
2.50
2.50
.50
2.50
2.50
.02
2.50
2.50
Analytical results (mg/kg)
4.35
15.10
<.50
12.50
5,670.00
.03
<2.50
<2.50
2.90
17.70
<.50
24.80
796.00
.04
<2.50
<2.50
<2.50
14.00
<50
11.90
276.00
.04
<2.50
<2.50
38

Appendix I
Location of sampling sites, detection limits, and results of trace-element analyses from soil samples collected on November 2,1990, by Shaw Air Force Base personnel (J. Spell, SAFB, written commun., March 1992)--Continued
[mg/kg, milligrams per kilogram; ft, feet; <, less than]
Sampling site and depth (fig. 2)
Target Lane 1
(at 5 ft)
Target Lane 2
(at 5 ft)
Target Lane 1
(at surface)
Trace element
Arsenic
Barium
Cadmium
Chromium
Lead
Mercury
Selenium
Silver
Arsenic
Barium
Cadmium
Chromium
Lead
Mercury
Selenium
Silver
Arsenic
Barium
Cadmium
Chromium
Lead
Mercury
Selenium
Silver
Analytical method detection limit
(mg/kg)
2.50
2.50
.50
2.50
2.50
.02
2.50
2.50
2.50
2.50
.50
2.50
2.50
.02
2.50
2.50
2.50
2.50
.50
2.50
2.50
.02
2.50
2.50
Analytical results (mg/kg)
3.05
11.20
<.50
25.50
1,080.00
.04
<2.50
<2.50
2.90
10.20
<.50
23.90
461.00
.04
<2.50
<2.50
3.35
19.80
<.50
10.50
4,290.00
.04
<2.50
<2.50
39

Appendix II
Location of sampling sites, detection limit, and lead Toxicity Characteristics Leaching Procedure results, from soil samples collected on November 2,1990, by Shaw Air Force Base personnel (J. Spell, SAFE, written commun., March 1992)
[mg/L, milligrams per liter; ft, feet]
Sampling site and depth (fig. 2)
Target Lane 2 (at surface)
Target Lane 1 (at 3 ft)
Target Lane 2 (at 3 ft)
Target Lane 1 (at 5 ft)
Target Lane 2 (at 5 ft)
Target Lane 1 (at surface)
Analytical method detection limit
(mg/L)
0.50
.50
.50
.50
.50
.50
Analytical results (mg/L)
165.00
23.80
5.34
14.40
20.80
144.00
40

Appendix III
Location of sampling sites, detection limits, and results of trace-element analyses from soil samples collected on April 22,1991, by Shaw Air Force Base personnel (J. Spell, SAFB, written commun., March 1992)
[mg/kg, milligrams per kilogram; ft, feet; <,less than]
Sampling site and depth mTriiPf* AiAinAnt'
X/» <Mk\ ildL/t/ WlVlliWlIl(fig. 2)
H (at 8 ft) Arsenic
Barium
Cadmium
Chromium
Lead
Mercury
Selenium
Silver
H (at 6 ft) Arsenic
Barium
Cadmium
Chromium
Lead
Mercury
Selenium
Silver
G (at 7 ft) Arsenic
Barium
Cadmium
Chromium
Lead
Mercury
Selenium
Silver
Analytical method detection limit
(mg/kg)
2.50
2.50
.50
2.50
2.50
.02
2.50
2.50
2.50
2.50
.50
2.50
2.50
.02
2.50
2.50
2.50
2.50
.50
2.50
2.50
.02
2.50
2.50
Analytical results (mg/kg)
<2.50
<2.50
<.50
2.62
<2.50
<.02
<2.50
<2.50
<2.50
5.09
<.50
5.95
<2.50
<.02
<2.50
<2.50
<2.50
17.20
<.50
14.00
<2.50
.03
<2.50
<2.50
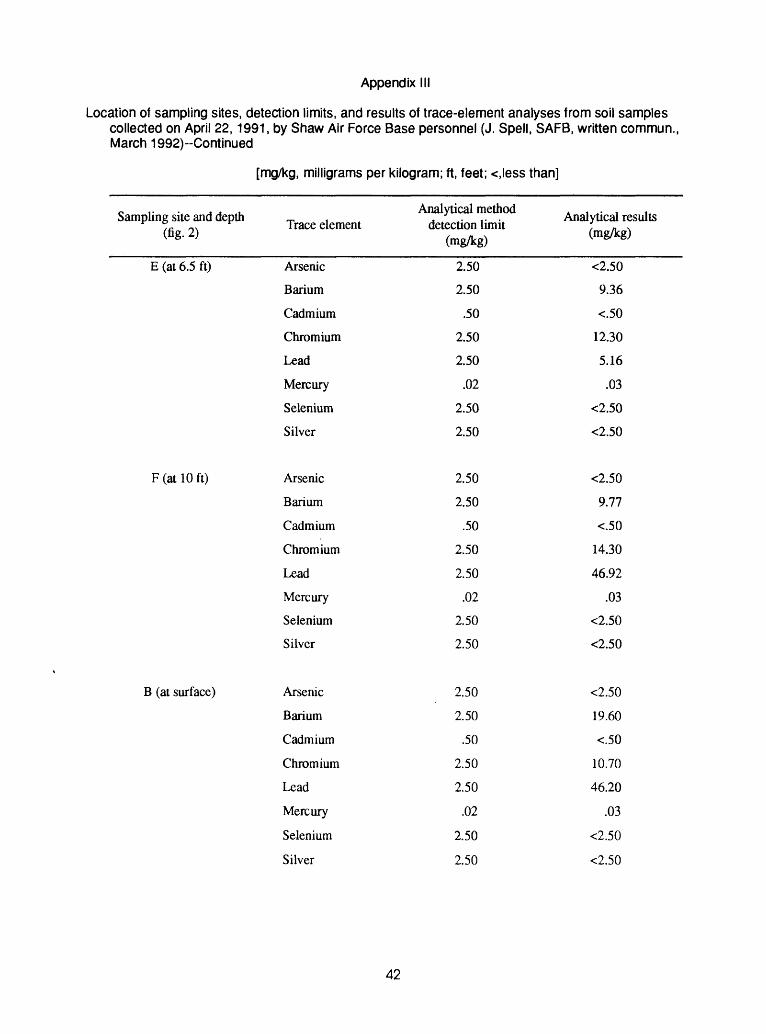
Appendix III
Location of sampling sites, detection limits, and results of trace-element analyses from soil samples collected on April 22,1991, by Shaw Air Force Base personnel (J. Spell, SAFE, written commun. March 1992)--Continued
[mg/kg, milligrams per kilogram; ft, feet; <,less than]
Sampling^and depth Traceelement
E (at 6.5 ft) Arsenic
Barium
Cadmium
Chromium
Lead
Mercury
Selenium
Silver
F (at 10 ft) Arsenic
Barium
Cadmium
Chromium
Lead
Mercury
Selenium
Silver
B (at surface) Arsenic
Barium
Cadmium
Chromium
Lead
Mercury
Selenium
Silver
Analytical method detection limit
(mg/kg)
2.50
2.50
.50
2.50
2.50
.02
2.50
2.50
2.50
2.50
.50
2.50
2.50
.02
2.50
2.50
2.50
2.50
.50
2.50
2.50
.02
2.50
2.50
Analytical results (mg/kg)
<2.50
9.36
<.50
12.30
5.16
.03
<2.50
<2.50
<2.50
9.77
<.50
14.30
46.92
.03
<2.50
<2.50
<2.50
19.60
<.50
10.70
46.20
.03
<2.50
<2.50
42
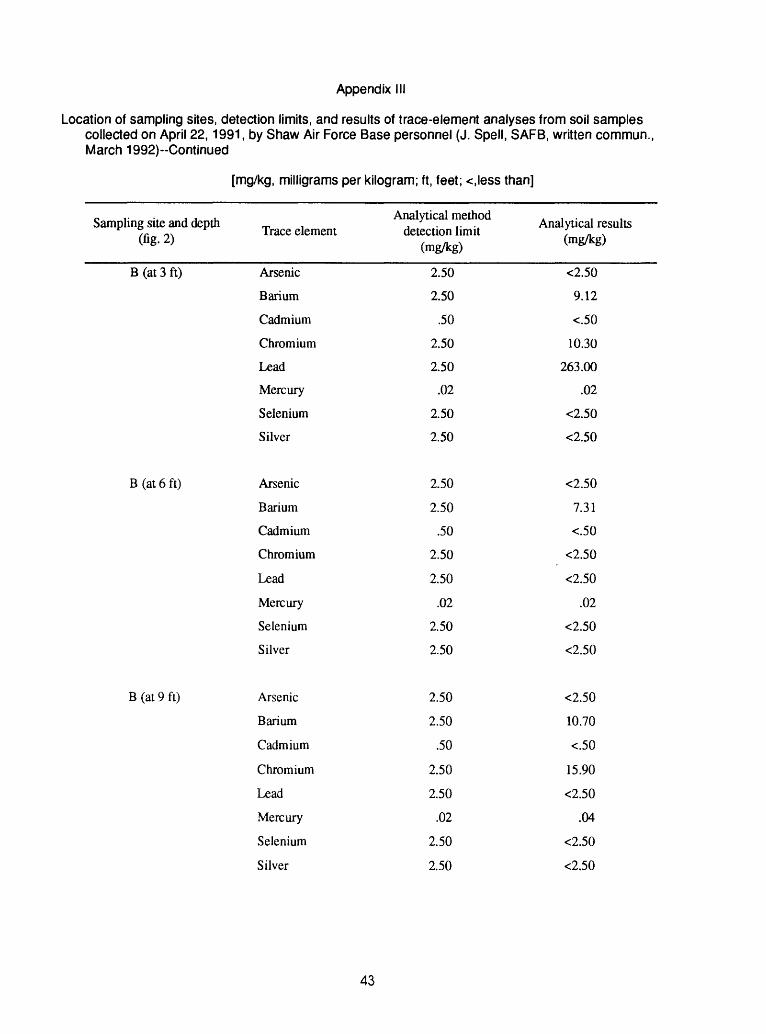
Appendix III
Location of sampling sites, detection limits, and results of trace-element analyses from soil samples collected on April 22,1991, by Shaw Air Force Base personnel (J. Spell, SAFE, written commun., March 1992)-Continued
[mg/kg, milligrams per kilogram; ft, feet; <,less than]
Sampling^and depth Traceelement
B (at 3 ft) Arsenic
Barium
Cadmium
Chromium
Lead
Mercury
Selenium
Silver
B (at 6 ft) Arsenic
Barium
Cadmium
Chromium
Lead
Mercury
Selenium
Silver
B (at 9 ft) Arsenic
Barium
Cadmium
Chromium
Lead
Mercury
Selenium
Silver
Analytical method detection limit
(mg/kg)
2.50
2.50
.50
2.50
2.50
.02
2.50
2.50
2.50
2.50
.50
2.50
2.50
.02
2.50
2.50
2.50
2.50
.50
2.50
2.50
.02
2.50
2.50
Analytical results (mg/kg)
<2.50
9.12
<.50
10.30
263.00
.02
<2.50
<2.50
<2.50
7.31
<.50
<2.50
<2.50
.02
<2.50
<2.50
<2.50
10.70
<.50
15.90
<2.50
.04
<2.50
<2.50
43

Appendix III
Location of sampling sites, detection limits, and results of trace-element analyses from soil samples collected on April 22,1991, by Shaw Air Force Base personnel (J. Spell, SAFB, written commun., March 1992)~Continued
[mg/kg, milligrams per kilogram; ft, feet; <,less than]
Sampling site and depth (fig. 2)
A (at surface)
A (at 3 ft)
A (at 6 ft)
Trace element
Arsenic
Barium
Cadmium
Chromium
Lead
Mercury
Selenium
Silver
Arsenic
Barium
Cadmium
Chromium
Lead
Mercury
Selenium
Silver
Arsenic
Barium
Cadmium
Chromium
Lead
Mercury
Selenium
Silver
Analytical method detection limit
(mg/kg)
2.50
2.50
.50
2.50
2.50
.02
2.50
2.50
2.50
2.50
.50
2.50
2.50
.02
2.50
2.50
2.50
2.50
.50
2.50
2.50
.02
2.50
2.50
Analytical results (mg/kg)
<2.50
8.82
.57
11.10
4,550.00
.02
<2.50
<2.50
<2.50
8.56
<.50
19.80
4,980.00
.02
<2.50
<2.50
<2.50
33.50
<.50
4.05
<2.50
.05
<2.50
<2.50
44
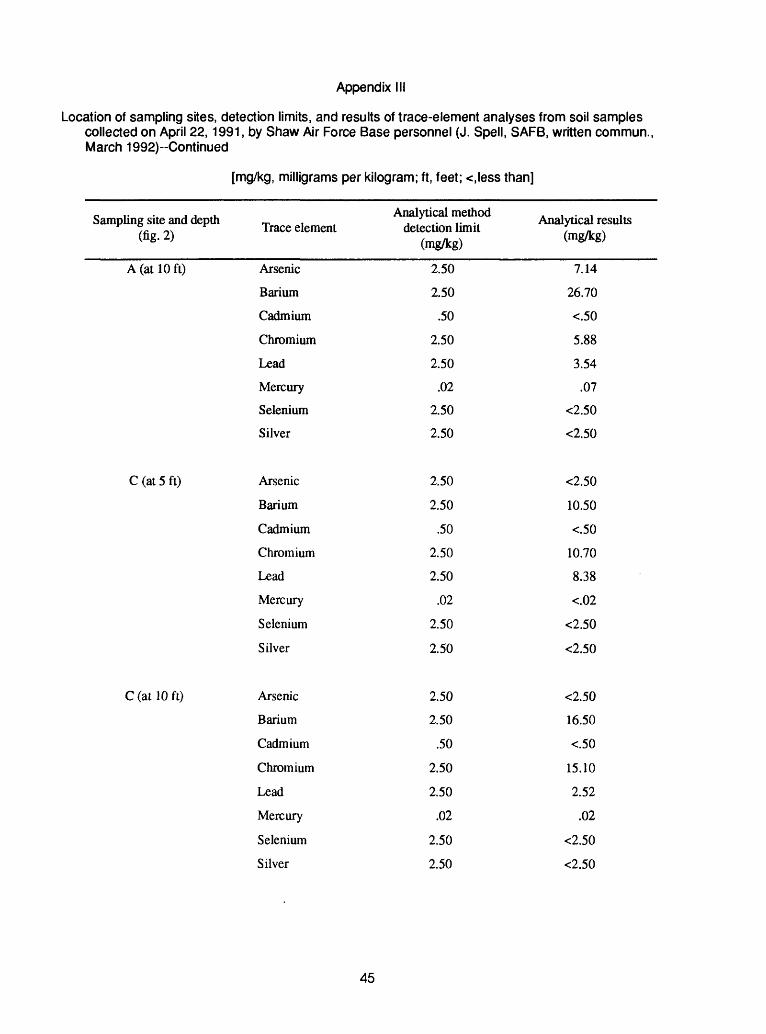
Appendix III
Location of sampling sites, detection limits, and results of trace-element analyses from soil samples collected on April 22,1991, by Shaw Air Force Base personnel (J. Spell, SAFB, written commun. March 1992)~Continued
[mg/kg, milligrams per kilogram; ft, feet; <,less than]
Sampling site and depth _, , * * ON Trace element (fig- 2)
A (at 10 ft) Arsenic
Barium
Cadmium
Chromium
Lead
Mercury
Selenium
Silver
C (at 5 ft) Arsenic
Barium
Cadmium
Chromium
Lead
Mercury
Selenium
Silver
C (at 10 ft) Arsenic
Barium
Cadmium
Chromium
Lead
Mercury
Selenium
Silver
Analytical method detection limit
(mg/kg)
2.50
2.50
.50
2.50
2.50
.02
2.50
2.50
2.50
2.50
.50
2.50
2.50
.02
2.50
2.50
2.50
2.50
.50
2.50
2.50
.02
2.50
2.50
Analytical results (mg/kg)
7.14
26.70
<.50
5.88
3.54
.07
<2.50
<2.50
<2.50
10.50
<50
10.70
8.38
<.02
<2.50
<2.50
<2.50
16.50
<.50
15.10
2.52
.02
<2.50
<2.50
45
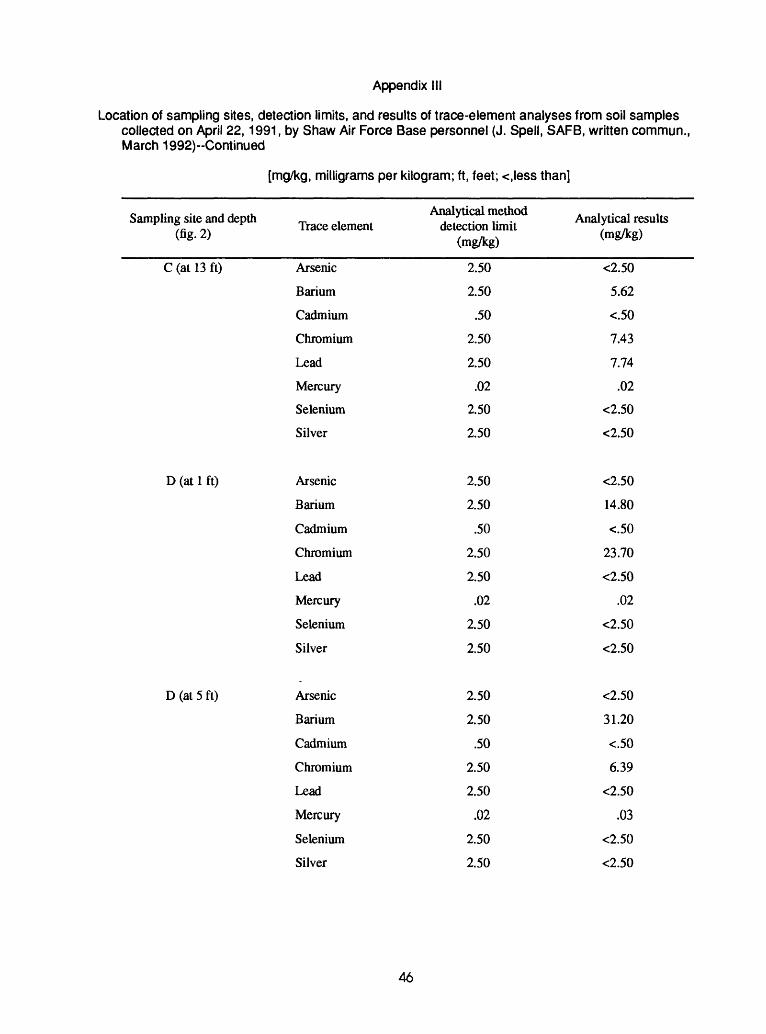
Appendix III
Location of sampling sites, detection limits, and results of trace-element analyses from soil samples collected on April 22,1991, by Shaw Air Force Base personnel (J. Spell, SAFB, written commun., March 1992)«Continued
[mg/kg, milligrams per kilogram; ft, feet; <,less than]
Sampling site and depth (% 2)
C (at 13 ft)
D (at 1 ft)
D (at 5 ft)
Trace element
Arsenic
Barium
Cadmium
Chromium
Lead
Mercury
Selenium
Silver
Arsenic
Barium
Cadmium
Chromium
Lead
Mercury
Selenium
Silver
Arsenic
Barium
Cadmium
Chromium
Lead
Mercury
Selenium
Silver
Analytical method detection limit
(mg/kg)
2.50
2.50
.50
2.50
2.50
.02
2.50
2.50
2.50
2.50
.50
2.50
2.50
.02
2.50
2.50
2.50
2.50
.50
2.50
2.50
.02
2.50
2.50
Analytical results (mg/kg)
<2.50
5.62
<.50
7.43
7.74
.02
<2.50
<2.50
<2.50
14.80
<.50
23.70
<2.50
.02
<2.50
<2.50
<2.50
31.20
<.50
6.39
<2.50
.03
<2.50
<2.50
46
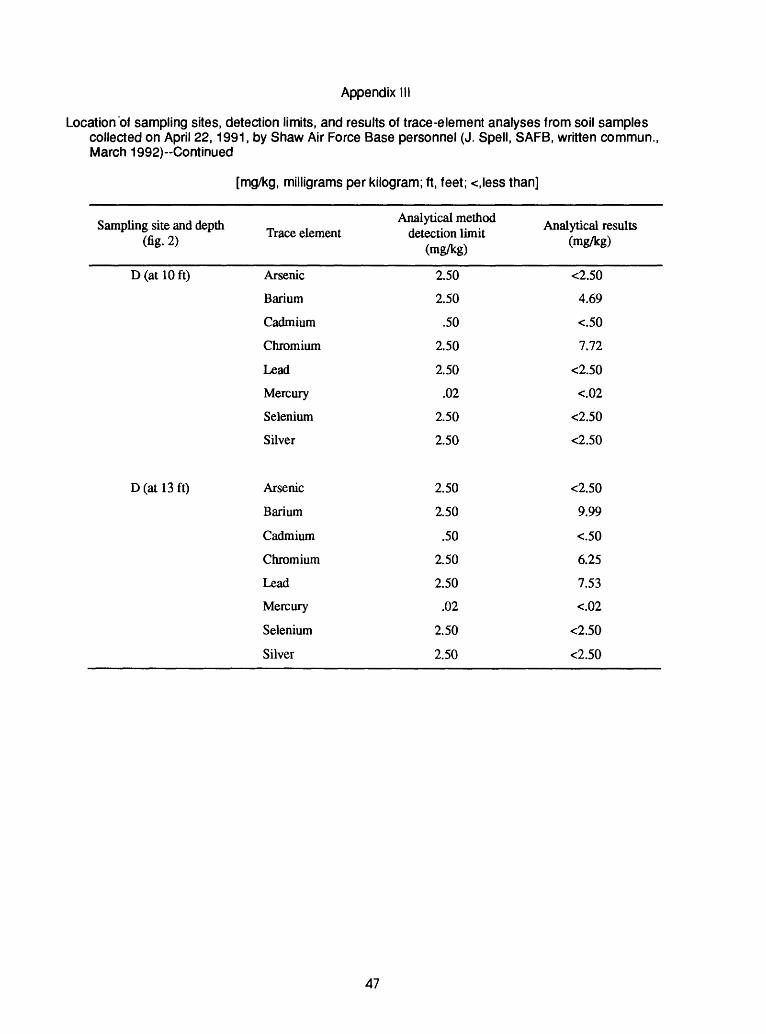
Appendix III
Location of sampling sites, detection limits, and results of trace-element analyses from soil samples collected on April 22,1991, by Shaw Air Force Base personnel (J. Spell, SAFB, written commun. March 1992)--Continued
[mg/kg, milligrams per kilogram; ft, feet; <,less than]
Sampling site and depth ^ ,TrilPA AlPfTIAnt(fig. 2) Trace element
D (at 10 ft) Arsenic
Barium
Cadmium
Chromium
Lead
Mercury
Selenium
Silver
D (at 13 ft) Arsenic
Barium
Cadmium
Chromium
Lead
Mercury
Selenium
Silver
Analytical method detection limit
(mg/kg)
2.50
2.50
.50
2.50
2.50
.02
2.50
2.50
2.50
2.50
.50
2.50
2.50
.02
2.50
2.50
Analytical results (mg/kg)
<2.50
4.69
<.50
7.72
<2.50
<.02
<2.50
<2.50
<2.50
9.99
<.50
6.25
7.53
<.02
<2.50
<2.50
47

Appendix IV
Location of sampling sites, detection limit, and results of trace element Toxicity Charactehstics Leaching Procedure analyses from soil samples collected on April 22,1991, by Shaw Air Force Base personnel (J. Spell, SAFB, written commun., March 1992)
[mg/L, milligrams per liter; ft, feet; <, less than]
Sampling site and depth (fig. 2)
H (at 8 ft)
H (at 6 ft)
G (at 7 ft)
Trace element
Arsenic
Barium
Cadmium
Chromium
Lead
Mercury
Selenium
Silver
Arsenic
Barium
Cadmium
Chromium
Lead
Mercury
Selenium
Silver
Arsenic
Barium
Cadmium
Chromium
Lead
Mercury
Selenium
Silver
Analytical method detection limit
(mg/L)
5.00
100.00
1.00
5.00
5.00
.20
1.00
5.00
5.00
100.00
1.00
5.00
5.00
.20
1.00
5.00
5.00
100.00
1.00
5.00
5.00
.20
1.00
5.00
Analytical results (mg/L)
<5.00
<100.00
<1.00
<5.00
<5.00
<.20
<1.00
<5.00
<5.00
<100.00
<1.00
<5.00
<5.00
<.20
<1.00
<5.00
<5.00
- <100.00
<1.00
<5.00
<5.00
<.20
<1.00
<5.00
48
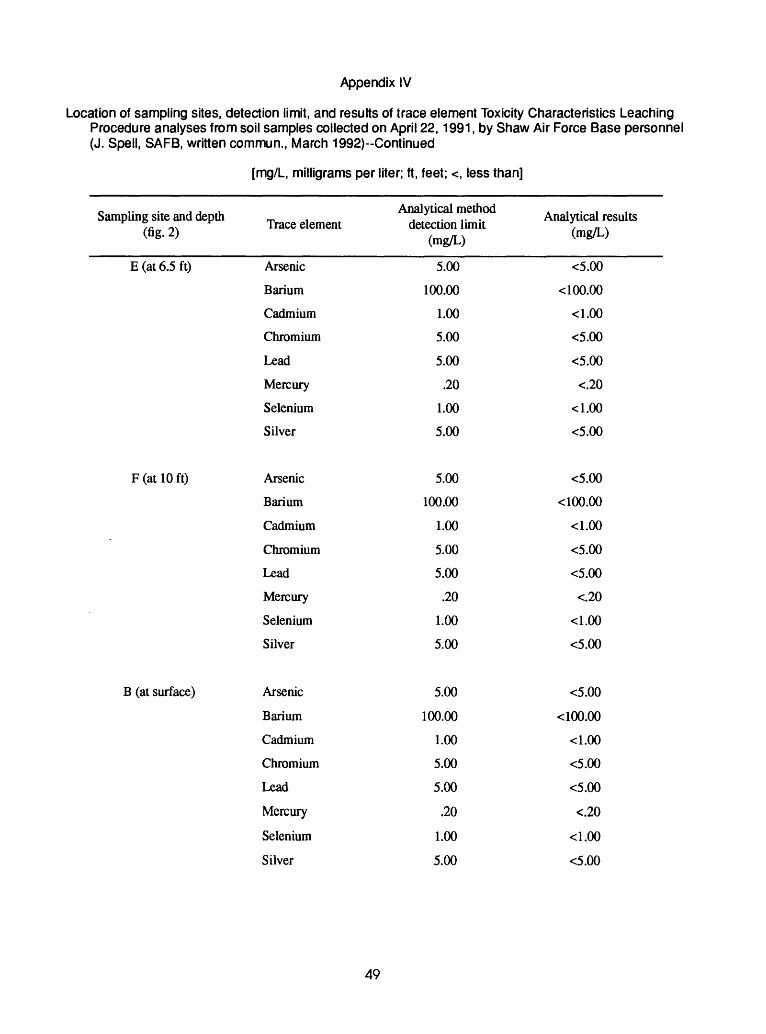
Appendix IV
Location of sampling sites, detection limit, and results of trace element Toxicity Characteristics Leaching Procedure analyses from soil samples collected on April 22,1991, by Shaw Air Force Base personnel (J. Spell, SAFB, written commun., March 1992)-Continued
[mg/L, milligrams per liter; ft, feet; <, less than]
Sampling site and depth _ , /« 2\ Trace element
E (at 6.5 ft) Arsenic
Barium
Cadmium
Chromium
Lead
Mercury
Selenium
Silver
F (at 10 ft) Arsenic
Barium
Cadmium
Chromium
Lead
Mercury
Selenium
Silver
B (at surface) Arsenic
Barium
Cadmium
Chromium
Lead
Mercury
Selenium
Silver
Analytical method detection limit
(mg/L)
5.00
100.00
1.00
5.00
5.00
.20
1.00
5.00
5.00
100.00
1.00
5.00
5.00
.20
1.00
5.00
5.00
100.00
1.00
5.00
5.00
.20
1.00
5.00
Analytical results (mg/L)
<5.00
<100.00
<1.00
<5.00
<5.00
<.20
<1.00
<5.00
<5.00
<100.00
<1.00
<5.00
<5.00
<.20
<1.00
<5.00
<5.00
<100.00
<1.00
<5.00
<5.00
<.20
<1.00
<5.00
49
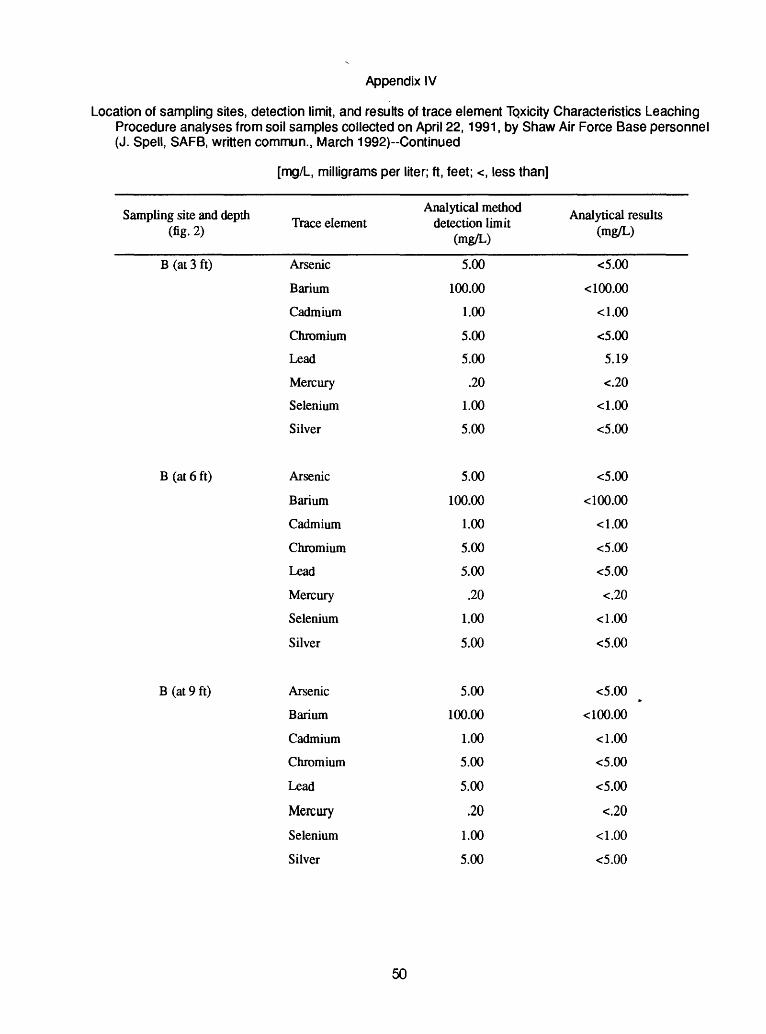
Appendix IV
Location of sampling sites, detection limit, and results of trace element Tqxicity Characteristics Leaching Procedure analyses from soil samples collected on April 22,1991, by Shaw Air Force Base personnel (J. Spell, SAFE, written commun., March 1992)--Continued
[mg/L, milligrams per liter; ft, feet; <, less than]
Sampling site and depth (fig. 2)
B (at 3 ft)
B (at 6 ft)
B (at 9 ft)
Trace element
Arsenic
Barium
Cadmium
Chromium
Lead
Mercury
Selenium
Silver
Arsenic
Barium
Cadmium
Chromium
Lead
Mercury
Selenium
Silver
Arsenic
Barium
Cadmium
Chromium
Lead
Mercury
Selenium
Silver
Analytical method detection limit
(mg/L)
5.00
100.00
1.00
5.00
5.00
.20
1.00
5.00
5.00
100.00
1.00
5.00
5.00
.20
1.00
5.00
5.00
100.00
1.00
5.00
5.00
.20
1.00
5.00
Analytical results (mg/L)
<5.00
<100.00
<1.00
<5.00
5.19
<.20
<1.00
<5.00
<5.00
<100.00
<1.00
<5.00
<5.00
<.20
<1.00
<5.00
<5.00»
<100.00
<1.00
<5.00
<5.00
<.20
<1.00
<5.00
50
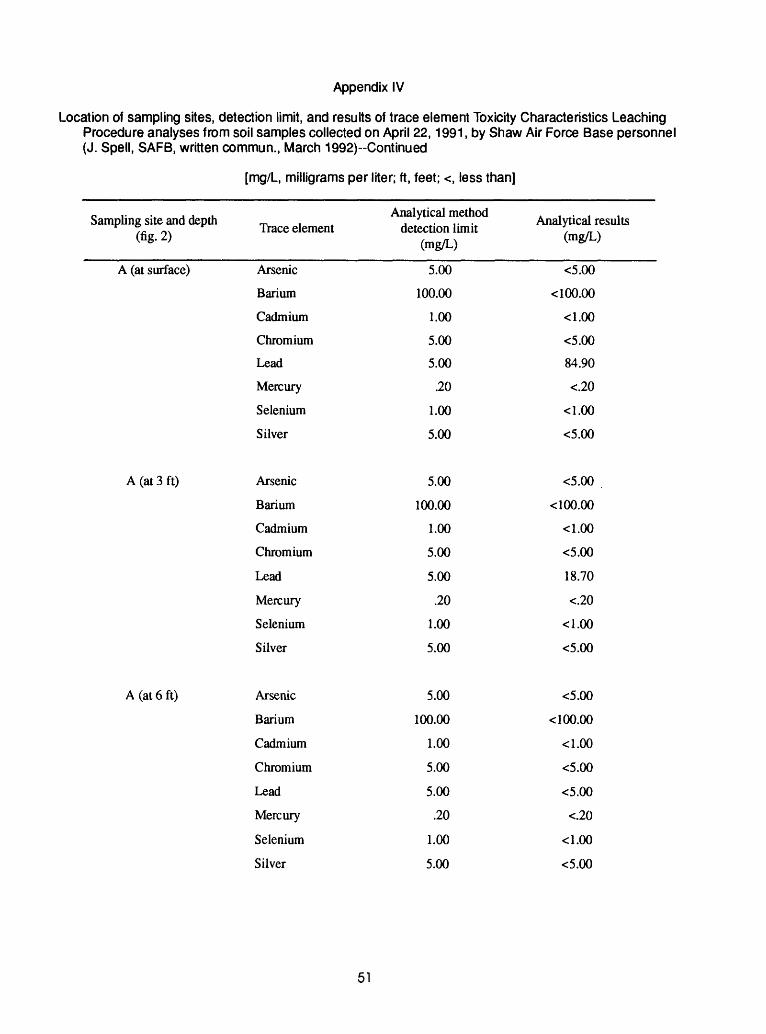
Appendix IV
Location of sampling sites, detection limit, and results of trace element Toxicity Characteristics Leaching Procedure analyses from soil samples collected on April 22,1991, by Shaw Air Force Base personnel (J. Spell, SAFB, written commun., March 1992)--Continued
[mg/L, milligrams per liter; ft, feet; <, less than]
Sampling^and depth Traceelement
A (at surface) Arsenic
Barium
Cadmium
Chromium
Lead
Mercury
Selenium
Silver
A (at 3 ft) Arsenic
Barium
Cadmium
Chromium
Lead
Mercury
Selenium
Silver
A (at 6 ft) Arsenic
Barium
Cadmium
Chromium
Lead
Mercury
Selenium
Silver
Analytical method detection limit
(mg/L)
5.00
100.00
1.00
5.00
5.00
.20
1.00
5.00
5.00
100.00
1.00
5.00
5.00
.20
1.00
5.00
5.00
100.00
1.00
5.00
5.00
.20
1.00
5.00
Analytical results (mg/L)
<5.00
<100.00
<1.00
<5.00
84.90
<.20
<1.00
<5.00
<5.00
<100.00
<1.00
<5.00
18.70
<.20
<1.00
<5.00
<5.00
< 100.00
<1.00
<5.00
<5.00
<.20
<1.00
<5.00
51

Appendix IV
Location of sampling sites, detection limit, and results of trace element Toxicity Characteristics Leaching Procedure analyses from soil samples collected on April 22,1991, by Shaw Air Force Base personnel (J. Spell, SAFB, written commun., March 1992)--Continued
[mg/L, milligrams per liter; ft, feet; <, less than]
Sampling site and depth (fig. 2)
A (at 10 ft)
C (at 5 ft)
'
C (at 10 ft)
Trace element
Arsenic
Barium
Cadmium
Chromium
Lead
Mercury
Selenium
Silver
Arsenic
Barium
Cadmium
Chromium
Lead
Mercury
Selenium
Silver
Arsenic
Barium
Cadmium
Chromium
Lead
Mercury
Selenium
Silver
Analytical method detection limit
(mg/L)
5.00
100.00
1.00
5.00
5.00
.20
1.00
5.00
5.00
100.00
1.00
5.00
5.00
.20
1.00
5.00
5.00
100.00
1.00
5.00
5.00
.20
1.00
5.00
Analytical results (mg/L)
<5.00
<100.00
<1.00
<5.00
<5.00
<.20
<1.00
<5.00
<5.00
<100.00
<1.00
<5.00
<5.00
<.20
<1.00
<5.00
<5.00
<100.00
<1.00
<5.00
5.19
<.20
<1.00
<5.00
52

Appendix IV
Location of sampling sites, detection limit, and results of trace element Toxicity Characteristics Leaching Procedure analyses from soil samples collected on April 22,1991, by Shaw Air Force Base personnel (J. Spell, SAFE, written commun., March 1992)-Continued
[mg/L, milligrams per liter; ft, feet; <, less than]
Sampling site and depth , (fig. 2)
C (at 13 ft) Arsenic
Barium
Cadmium
Chromium
Lead
Mercury
Selenium
Silver
D (at 1 ft) Arsenic
Barium
Cadmium
Chromium
Lead
Mercury
Selenium
Silver
D (at 5 ft) Arsenic
Barium
Cadmium
Chromium
Lead
Mercury
Selenium
Silver
Analytical method detection limit
(mg/L)
5.00
100.00
1.00
5.00
5.00
.20
1.00
5.00
5.00
100.00
1.00
5.00
5.00
.20
1.00
5.00
5.00
100.00
1.00
5.00
5.00
.20
1.00
5.00
Analytical results (mg/L)
<5.00
< 100.00
<1.00
<5.00
<5.00
<.20
<1.00
<5.00
<5,00
< 100.00
<1.00
<5.00
<5.00
<.20
<1.00
<5.00
<5.00
<100.00
<1.00
<5.00
5.19
<.20
<1.00
<5.00
53
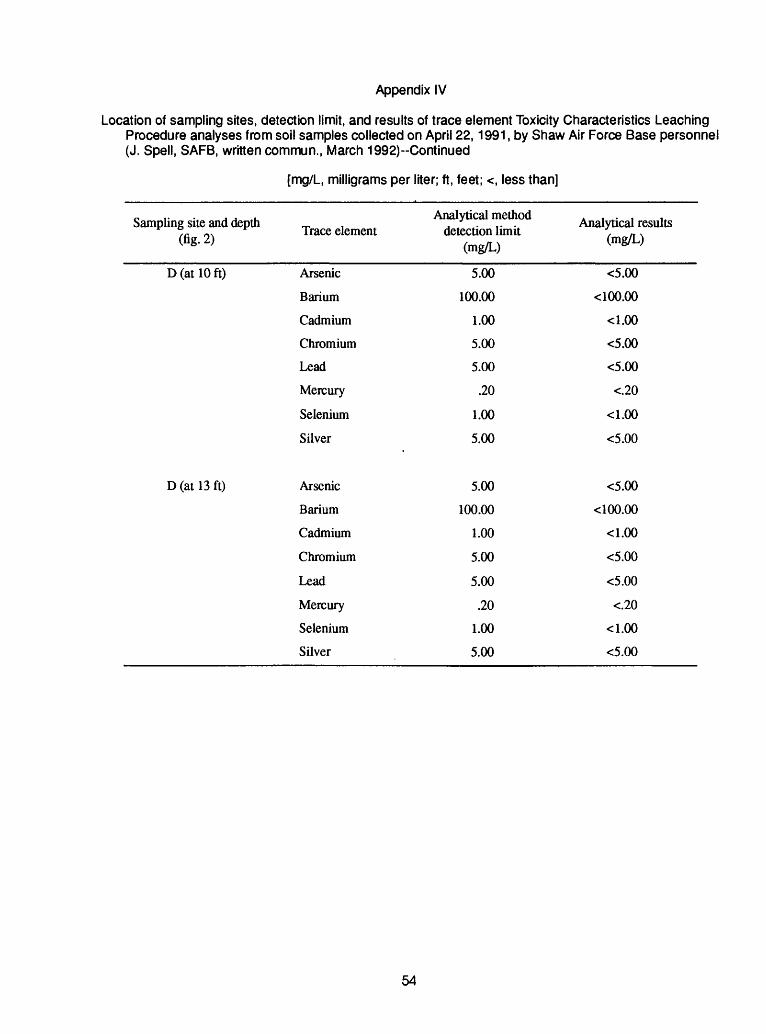
Appendix IV
Location of sampling sites, detection limit, and results of trace element Toxicity Characteristics Leaching Procedure analyses from soil samples collected on April 22,1991, by Shaw Air Force Base personnel (J. Spell, SAFB, written commun., March 1992)--Continued
[mg/L, milligrams per liter; ft, feet; <, less than]
Sampling site and depth (fig. 2)
D (at 10 ft)
D (at 13 ft)
Trace element
Arsenic
Barium
Cadmium
Chromium
Lead
Mercury
Selenium
Silver
Arsenic
Barium
Cadmium
Chromium
Lead
Mercury
Selenium
Silver
Analytical method detection limit
(mg/L)
5.00
100.00
1.00
5.00
5.00
.20
1.00
5.00
5.00
100.00
1.00
5.00
5.00
.20
1.00
5.00
Analytical results (mg/L)
<5.00
<100.00
<1.00
<5.00
<5.00
<.20
<1.00
<5.00
<5.00
<100.00
<1.00
<5.00
<5.00
<.20
<1.00
<5.00
54

Appendix V
Hammer blows required to collect split-spoon samples at OW1
Depth interval (feet) Number of blows required
Oto2
2to4
4to6
6to8
8 to 10
10 to 12
12 to 14
14 to 16
16 to 18
18 to 20
2-12-11-11
19-22-21-20
8-9-8-7
3-4-5-4
3-4-5-6
6-12-15-14
14-16-17-22
26-32-27-41
16-18-19-17
12-14-14-22
55

100
COBB
LES
GRAV
ELSA
NDFI
NES
COUR
SEFI
NECO
URSE
MED
IUM
FINE
SILT
SBES
U.S
. S
tand
ard
Sie
ve
Ope
ning
s,
in
Inch
es3
2
1 \
\LJ1
U.S
. S
tand
ard
Sie
ve
Num
bers
4 10
20
40
60
10
0 20
0I
I
CLAY
SIZ
ES
90h-
o [D
80
>-70 60
DC
LU
50
^
40h-
g
30
O DC
20
LU °-
10
SAM
PLE
INTE
RVAL
0 to
0.5
FEE
TBE
LOW
LAN
D SU
RFAC
Efo
rOW
3(Fi
g.2)
100
10
1.0
0.1
GR
AIN
S
IZE
, IN
M
ILLI
ME
TE
RS
Appe
ndix
VI
Gra
in-s
ize
anal
yses
for b
oreh
ole
and
obse
rvat
ion
wel
l soi
l sam
ples
0.01
0.00
1
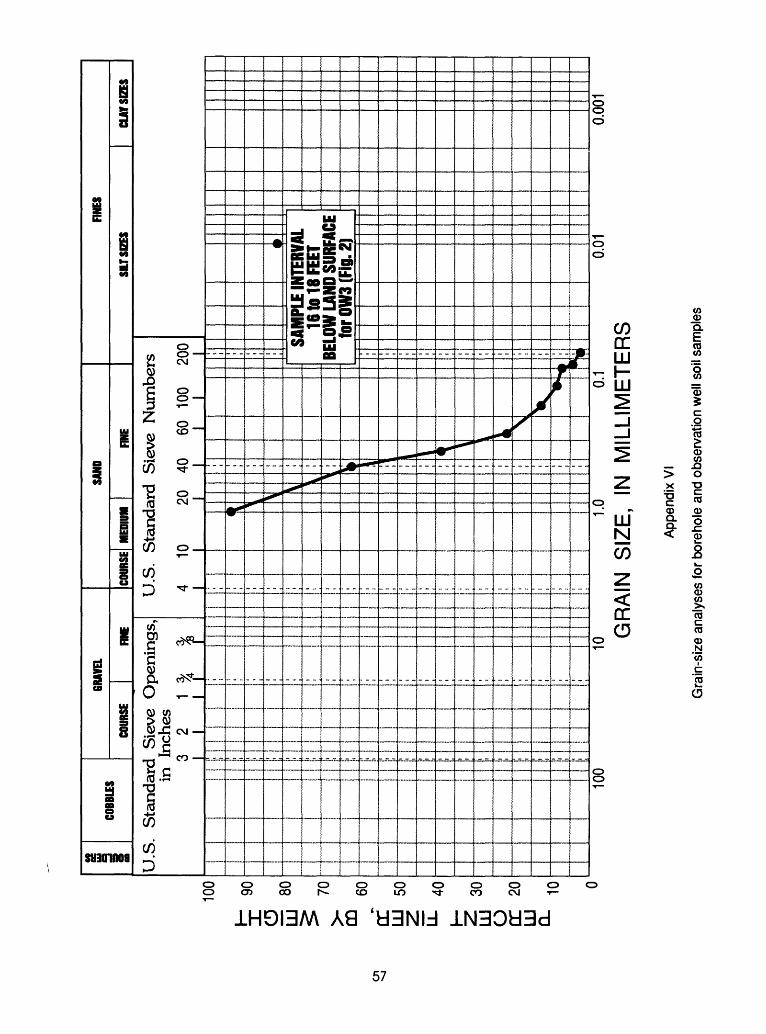
en
100
J
90
O
LU
80 70 60DC
LU
50
LL40
LU
ou
O DC
20
LU ^
10 0
COBB
LES
GRAV
EL
COUR
SEFI
NE
U.S
.S
tand
ard
Sie
ve O
peni
ngs,
in
In
ches
32
SAND
COUR
SE
MED
IUM
FINE
FINE
S
SILT
SIZ
ESGU
T SI
ZES
U.S
. S
tand
ard
Sie
ve
Num
bers
4 10
20
40
60
10
0 20
0II
I I
I I
I SAM
PLE
INTE
RVAL
16 to
18
FEET
BELO
W L
AND
SURF
ACE
forO
W3(
Fig.
2)
100
10
1.0
0.1
GR
AIN
S
IZE
, IN
M
ILLI
ME
TE
RS
0.01
0.001
Appe
ndix
VI
Gra
in-s
ize
anal
yses
for b
oreh
ole
and
obse
rvat
ion
wel
l soi
l sam
ples
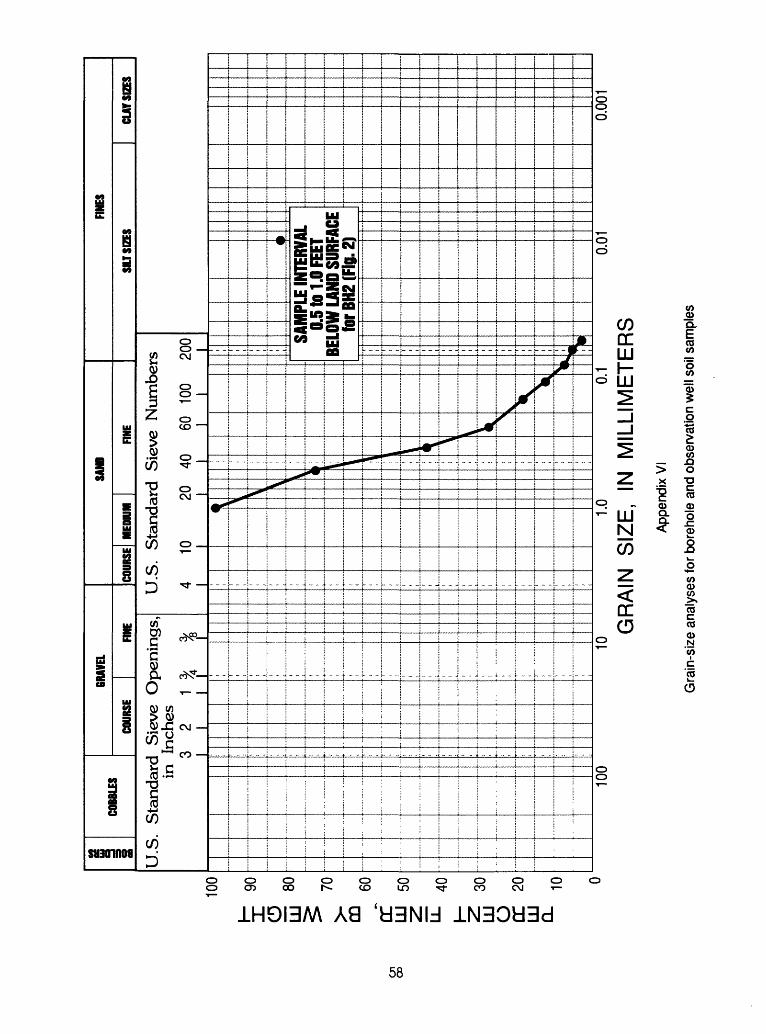
en
CD
100
^
90
CD
[U
80
60a: LU
50 40
h- LU
O a:
20LU °-
10
COBB
LES
GRAV
ELSA
NDFI
NES
COUR
SEFI
NECO
URSE
MED
IUM
FINE
SILT
SIZ
ESCL
AY S
IZES
U.S
. S
tand
ard
Sie
ve
Ope
ning
s,
in
Inch
es3
2
1 \
LJ_
U.S
. S
tand
ard
Sie
ve
Num
bers
4 10
20
40
60
10
0 20
020
40
I
I60
10
0 J__|_
SAM
PLE
INTE
RVAL
0.5
to 1
.0 F
EET
BELO
W L
AND
SURF
ACE
forB
H2(
Fig.
2)
100
10
1.0
0.1
GR
AIN
S
IZE
, IN
M
ILLI
ME
TE
RS
App
endi
x VI
Gra
in-s
ize
anal
yses
for
bore
hole
and
obs
erva
tion
wel
l soi
l sam
ples
0.01
0.00
1

Appendix VII
Borehole soil samples used for trace-element and Toxicity Characteristics Leaching Procedure analyses
~, . it u Depth interval Observation well number ^ ,f .(feet)
OW2 2 to 4; 6 to 8; 12 to 14; 18 to 20
OW3 4 to 6
OW4 3 to 5; 10 to 13; 18 to 20
59
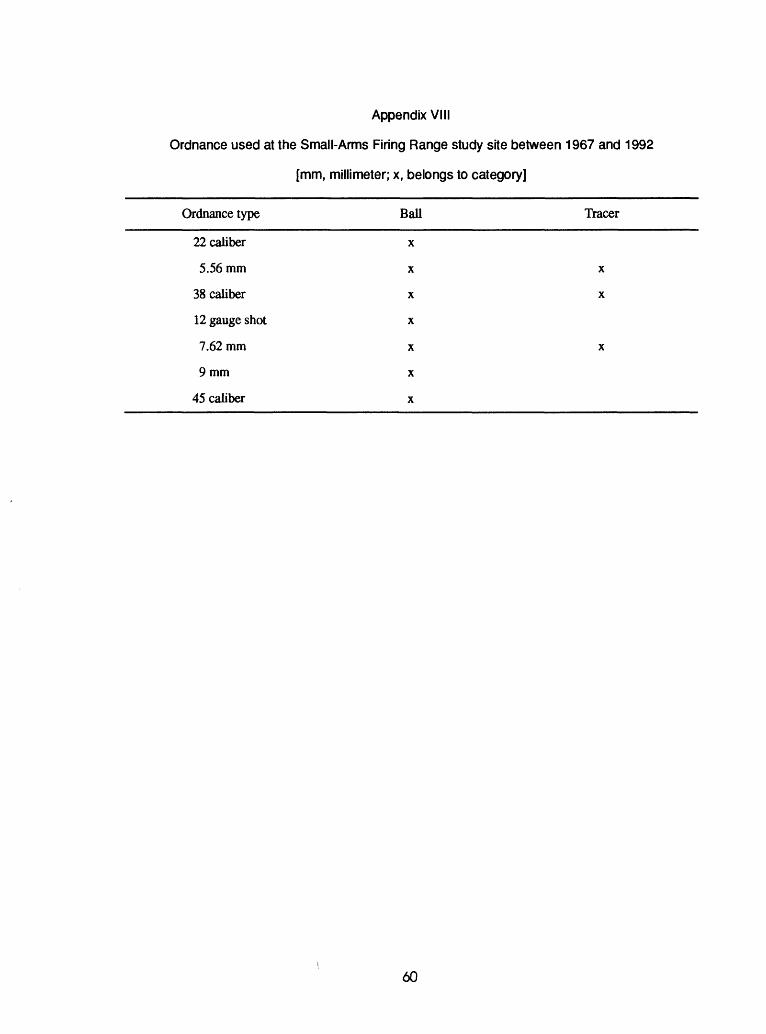
Appendix VIII
Ordnance used at the Small-Arms Firing Range study site between 1967 and 1992
[mm, millimeter; x, belongs to category]
Ordnance type Ball Tracer
22 caliber x
5.56 mm x x
38 caliber x x
12 gauge shot x
7.62 mm x x
9 mm x
45 caliber x
60