Embed Size (px)
Citation preview
ASSESSMENT OF COPPER AND ZINC ADSORPTION TO LIGNOCELLULOSIC FILTRATION MEDIA
USING LABORATORY AND FIELD SCALE COLUMN TESTS FOR THE PURPOSE
OF URBAN STORMWATER REMEDIATION
By
VINCENT PAUL McINTYRE
A thesis submitted in partial fulfillment of the requirements for the degree of
MASTER OF SCIENCE IN ENVIRONMENTAL ENGINEERING
WASHINGTON STATE UNIVERSITY Department of Civil and Environmental Engineering
DECEMBER 2015
© Copyright by VINCENT PAUL McINTYRE, 2015
All Rights Reserved

© Copyright by VINCENT PAUL McINTYRE, 2015 All Rights Reserved
ii
To the Faculty of Washington State University: The members of the Committee appointed to examine the thesis of VINCENT PAUL McINTYRE find it satisfactory and recommend that it be accepted.
David Yonge, Ph.D., Chair
Richard J. Watts, Ph.D.
Michael P. Wolcott, Ph.D.

iii
ACKNOWLEDGMENTS
For efforts related specifically to this project, I would like to thank my advisor, David Yonge, for
his tireless guidance and direction which should be recognized as a pillar on which this project
stands. Equally as vital to the project was the input and efforts made by my committee
members, Richard Watts and Michael Wolcott, to whom I am very grateful. Additionally, I
would like to recognize the following individuals for their meaningful contribution: Joseph
Smith, Natalia Kaiser, Wanda Terry, Karl Englund, Anna Vandermeer, Mike Zarcor, Scott
Boroughs, Charles Knaack, Robert Duncan, Suzanne Hamada, Scott Lewis, Kelly Walsch, and Jon
Heywood. No man stands alone and I am humbly grateful to each and every one of you.
On a more personal note, I’d also like to thank those individuals that were influential,
supportive, and important to me and my family during this time period. Special thanks to Dave
and Debbie Baker, the Bad News Browns, the Olsen Family, Ed Crawford and Rayce Barnes, the
Stricklers, Brandon Beaudette, Martin Trail, Larry Kirkland, Weitang and Manee Hu, and our
family at Bridge Bible Fellowship. Thank you all for sharing in this adventure with us. Your
friendship will never be forgotten.
iv
ASSESSMENT OF COPPER AND ZINC ADSORPTION TO LIGNOCELLULOSIC FILTRATION MEDIA
USING LABORATORY AND FIELD SCALE COLUMN TESTS FOR THE PURPOSE
OF URBAN STORMWATER REMEDIATION
Abstract
by Vincent Paul McIntyre, M.S. Washington State University
December 2015
Chair: David Yonge
Practical engineering solutions to address growing municipal stormwater issues are
needed to maintain a healthy relationship between humans and the environment. In the Pacific
Northwest, elevated soluble zinc and copper concentrations originating from urban stormwater
runoff provide a significant threat to native salmon and steelhead populations. In response to
urbanization, existing stormwater infrastructure needs to be upgraded to treat non‐point
source pollution, including soluble metals, prior to entering the receiving water. Media filtration
BMPs provide the flexibility and small footprint needed for retrofit applications that are space
limited, such as ferry terminal staging areas. An effective yet low‐cost filtration media needs to
be identified to remove soluble metals of concern from urban runoff. Laboratory and field scale
continuous flow column studies were performed on torrefied and non‐torrefied Douglas‐fir
wood crumbles, charcoal, and pea gravel to evaluate their effectiveness at sorbing soluble
copper and zinc. The Bainbridge Island ferry terminal staging area was selected as the field test
site. Laboratory column tests indicated that the most efficient adsorption media in relation to
v
both metals was non‐torrefied wood, followed in order by pea gravel, torrefied wood, and
charcoal. High stormwater flow tests performed in the laboratory on charcoal and torrefied
wood columns resulted in no statistically significant difference in effluent metal concentrations.
A deicer flush performed on torrefied wood and charcoal columns following adsorption tests
resulted in a significant increase in effluent metal concentration. The field test column
containing charcoal averaged respective percent soluble zinc, soluble copper and total
suspended solids removal of 41%, ‐17%, and 54%.
vi
TABLE OF CONTENTS
ACKNOWLEDGEMENTS ................................................................................................................................ iii
ABSTRACT ........................................................................................................................................ iv
LIST OF TABLES ............................................................................................................................... vii
LIST OF FIGURES ............................................................................................................................ viii
1. BACKGROUND AND INTRODUCTION .......................................................................................... 1
2. EXPERIMENTAL METHODS .......................................................................................................... 7
2.1 Media Tested ......................................................................................................................... 7
2.2 Bench Scale Column Tests ................................................................................................... 10
2.3 Field Scale Column Tests ..................................................................................................... 17
3. RESULTS AND DISCUSSION ....................................................................................................... 24
3.1 Phase I & II Bench Scale Testing .......................................................................................... 24
3.1.1 General Long‐Term Trends ........................................................................................................ 24
3.1.2 Short‐Term Trends ..................................................................................................................... 29
3.1.3 Supplementary Tests ................................................................................................................. 31
3.1.4 Raw wood and Pea Gravel ......................................................................................................... 39
3.1.5 Solid Phase Acid Extraction ........................................................................................................ 42
3.2 Field Tests ............................................................................................................................ 44
3.2.1 Field Column Results .................................................................................................................. 44
3.2.2 Sludge Characterization ............................................................................................................. 50
4. CONCLUSIONS ........................................................................................................................... 51
5. WORKS CITED ............................................................................................................................ 54
6. APPENDIX .................................................................................................................................. 58
vii
LIST OF TABLES
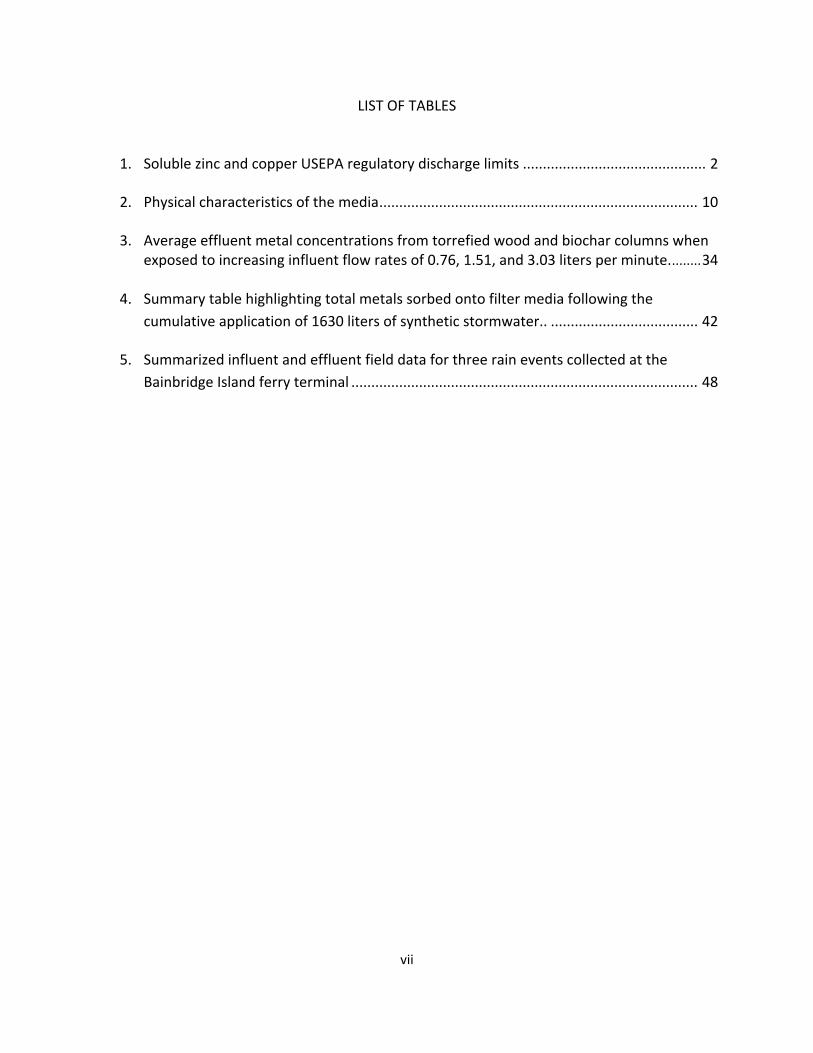
1. Soluble zinc and copper USEPA regulatory discharge limits .............................................. 2
2. Physical characteristics of the media ................................................................................ 10
3. Average effluent metal concentrations from torrefied wood and biochar columns when exposed to increasing influent flow rates of 0.76, 1.51, and 3.03 liters per minute. ........ 34
4. Summary table highlighting total metals sorbed onto filter media following the
cumulative application of 1630 liters of synthetic stormwater.. ..................................... 42
5. Summarized influent and effluent field data for three rain events collected at the
Bainbridge Island ferry terminal ....................................................................................... 48
viii
LIST OF FIGURES
1. Media evaluated in this project (not to scale) .................................................................... 8
2. Laboratory scale continuous flow column system ........................................................... 12
3. Bainbridge Island, WA ferry terminal with field study catchment area encircled. .......... 18
4. Field study stormwater catchment ................................................................................... 19
5. Schematic of the submersible weir box with a sharp‐crested, 20° v‐notch weir plate
inserted and lid removed. ................................................................................................. 20
6. Laboratory and empirical flow calibration data for a 20° partially contracted v‐notch
weir. .................................................................................................................................. 21
7. Schematic of the field column with basic dimensions shown .......................................... 22
8. Schematic of the stormwater sampling configuration during a rain event (pump not
shown) ............................................................................................................................... 23
9. Zinc concentrations for the influent and effluent during Phase I & II column loading
experiments. Error bars represent the 95% confidence interval. .................................... 25
10. Copper concentrations for the influent and effluent during Phase I & II column loading
experiments. Error bars represent the 95% confidence interval. .................................... 25
11. Influent and effluent pH values shown during Phase I & II column loading. Error bars
represent the 95% confidence interval. ........................................................................... 29
12. Zinc influent and effluent concentrations during high flow tests. ................................... 32
13. Copper influent and effluent concentrations during high flow tests. .............................. 33
14. Influent and effluent pH values during high flow tests. ................................................... 33
15. Influent and effluent zinc concentrations (log scale) during and following a deicer flush.
Calcium Chloride with Boost™ was used as the anti‐icing agent. .................................... 35
ix
16. Influent and effluent copper concentrations (log scale) during and following a deicer
flush. Calcium Chloride with Boost™ was used as the anti‐icing agent. .......................... 36
17. Influent and effluent pH values during and following a deicer flush. Calcium Chloride
with Boost™ was used as the anti‐icing agent. ................................................................. 36
18. Influent and effluent zinc concentrations for raw wood and pea gravel columns. Phase I
& II biochar and torrefied wood moving average trend lines are displayed for graphical
comparison. ...................................................................................................................... 39
19. Influent and effluent copper concentrations for raw wood and pea gravel columns.
Phase I & II biochar and torrefied wood moving average trend lines are displayed for
graphical comparison. ....................................................................................................... 40
20. Influent and effluent pH values for raw wood and pea gravel columns. ......................... 40
21. Column graph displaying stratified metal concentrations determined using the acid
extraction method. ........................................................................................................... 43
22. Storm events captured at the Bainbridge Island, WA field site. ...................................... 45
23. Normalized column flow for the August 14th, 2015 rain event. ....................................... 46
24. Normalized column flow for the August 29th, 2015 rain event ........................................ 46
25. Normalized column flow for the October 10th, 2015 rain event. ..................................... 47
26. Stormwater vault sludge particle size distribution ........................................................... 50

x
Dedication
The feasibility of this project is entirely attributed to my wonderful bride, Randi Dawn McIntyre,
who has been and forever will be my strength and purpose – and to whom I can never repay.
This thesis is dedicated to her and to my beautiful daughters, Madelynn Lahree and Sydnee
Keredah. The joy that daughters bring to a father is unparalleled.
1
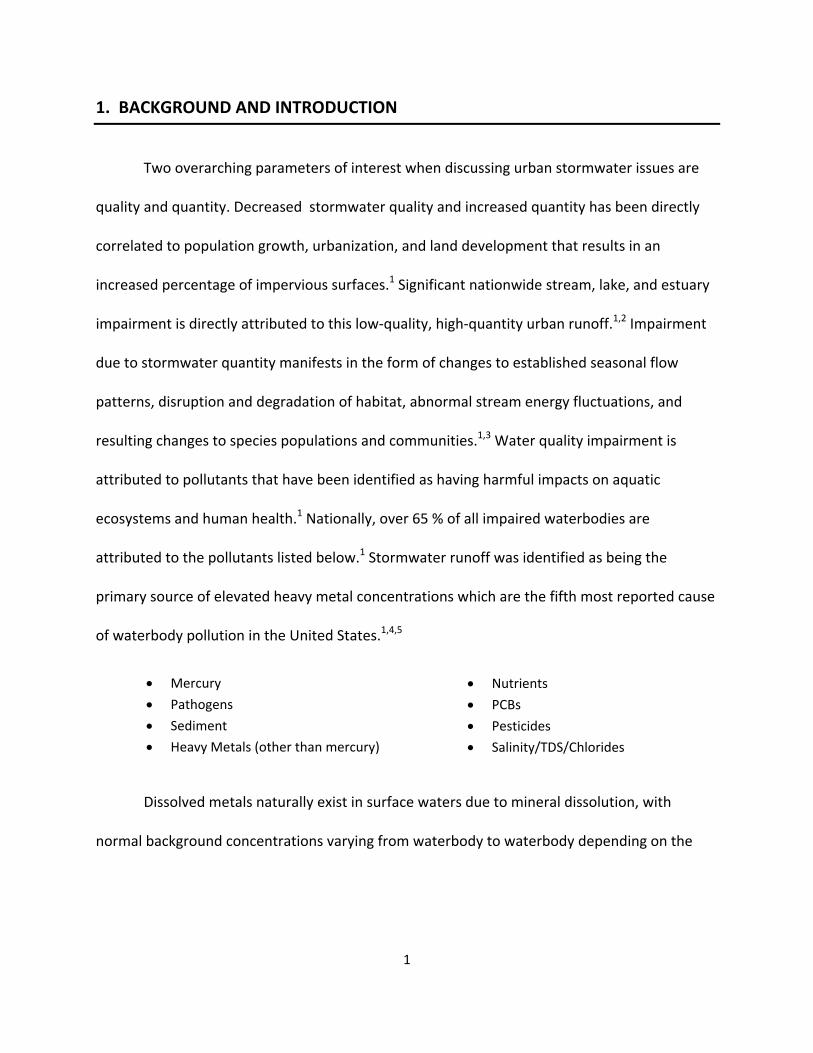
1. BACKGROUND AND INTRODUCTION
Two overarching parameters of interest when discussing urban stormwater issues are
quality and quantity. Decreased stormwater quality and increased quantity has been directly
correlated to population growth, urbanization, and land development that results in an
increased percentage of impervious surfaces.1 Significant nationwide stream, lake, and estuary
impairment is directly attributed to this low‐quality, high‐quantity urban runoff.1,2 Impairment
due to stormwater quantity manifests in the form of changes to established seasonal flow
patterns, disruption and degradation of habitat, abnormal stream energy fluctuations, and
resulting changes to species populations and communities.1,3 Water quality impairment is
attributed to pollutants that have been identified as having harmful impacts on aquatic
ecosystems and human health.1 Nationally, over 65 % of all impaired waterbodies are
attributed to the pollutants listed below.1 Stormwater runoff was identified as being the
primary source of elevated heavy metal concentrations which are the fifth most reported cause
of waterbody pollution in the United States.1,4,5
Dissolved metals naturally exist in surface waters due to mineral dissolution, with
normal background concentrations varying from waterbody to waterbody depending on the
Mercury
Pathogens
Sediment
Heavy Metals (other than mercury)
Nutrients
PCBs
Pesticides
Salinity/TDS/Chlorides
2
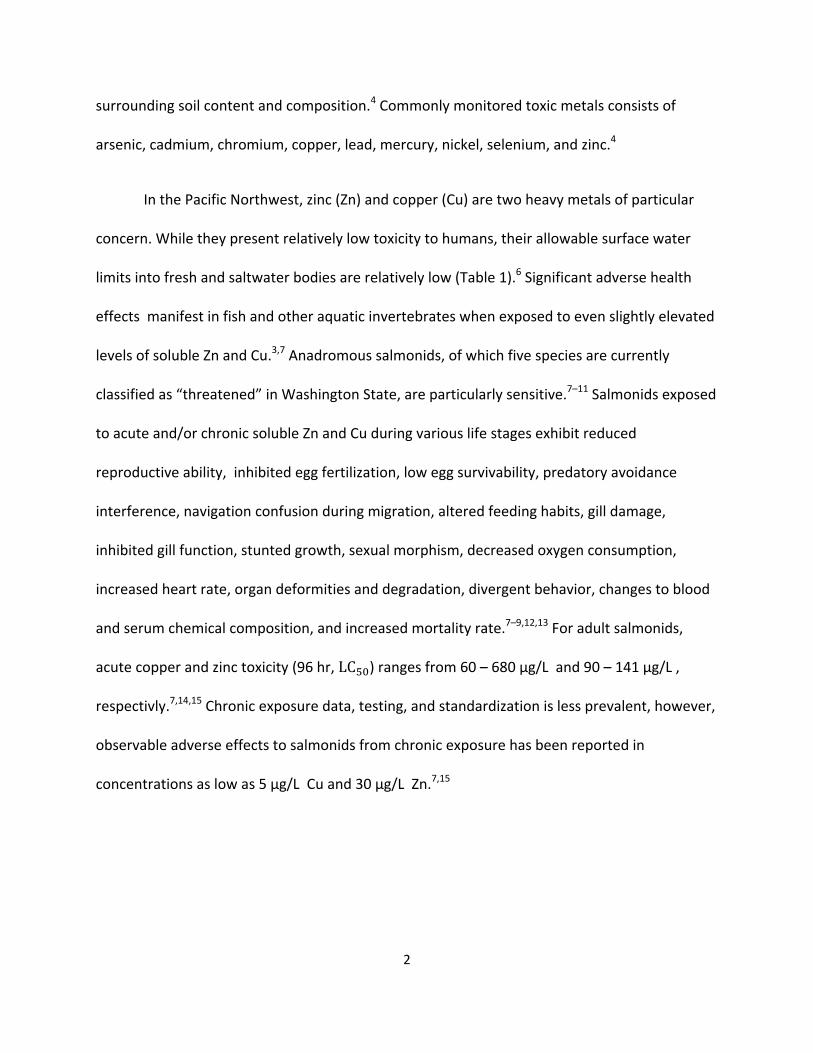
surrounding soil content and composition.4 Commonly monitored toxic metals consists of
arsenic, cadmium, chromium, copper, lead, mercury, nickel, selenium, and zinc.4
In the Pacific Northwest, zinc (Zn) and copper (Cu) are two heavy metals of particular
concern. While they present relatively low toxicity to humans, their allowable surface water
limits into fresh and saltwater bodies are relatively low (Table 1).6 Significant adverse health
effects manifest in fish and other aquatic invertebrates when exposed to even slightly elevated
levels of soluble Zn and Cu.3,7 Anadromous salmonids, of which five species are currently
classified as “threatened” in Washington State, are particularly sensitive.7–11 Salmonids exposed
to acute and/or chronic soluble Zn and Cu during various life stages exhibit reduced
reproductive ability, inhibited egg fertilization, low egg survivability, predatory avoidance
interference, navigation confusion during migration, altered feeding habits, gill damage,
inhibited gill function, stunted growth, sexual morphism, decreased oxygen consumption,
increased heart rate, organ deformities and degradation, divergent behavior, changes to blood
and serum chemical composition, and increased mortality rate.7–9,12,13 For adult salmonids,
acute copper and zinc toxicity (96 hr, LC ) ranges from 60 – 680 μg/L and 90 – 141 μg/L ,
respectivly.7,14,15 Chronic exposure data, testing, and standardization is less prevalent, however,
observable adverse effects to salmonids from chronic exposure has been reported in
concentrations as low as 5 μg/L Cu and 30 μg/L Zn.7,15
3
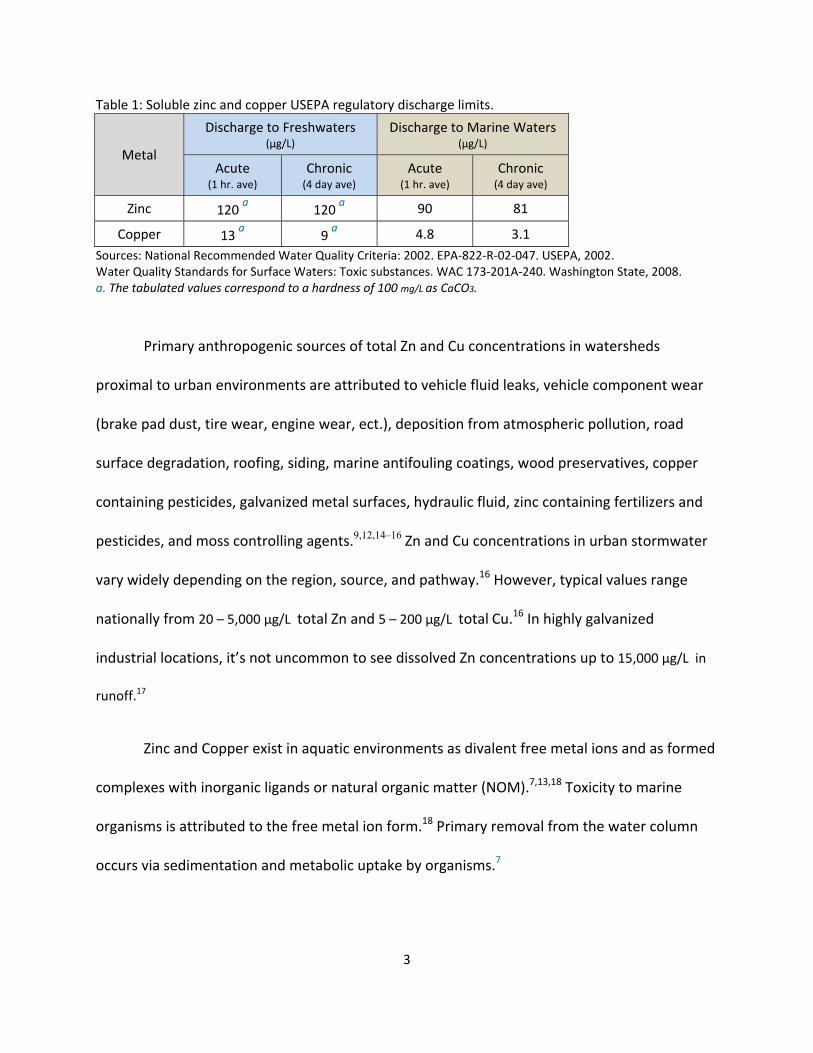
Table 1: Soluble zinc and copper USEPA regulatory discharge limits.
Metal
Discharge to Freshwaters (µg/L)
Discharge to Marine Waters (µg/L)
Acute (1 hr. ave)
Chronic (4 day ave)
Acute (1 hr. ave)
Chronic (4 day ave)
Zinc 120 a 120
a 90 81
Copper 13 a 9
a 4.8 3.1
Sources: National Recommended Water Quality Criteria: 2002. EPA‐822‐R‐02‐047. USEPA, 2002. Water Quality Standards for Surface Waters: Toxic substances. WAC 173‐201A‐240. Washington State, 2008. a. The tabulated values correspond to a hardness of 100 mg/L as CaCO3.
Primary anthropogenic sources of total Zn and Cu concentrations in watersheds
proximal to urban environments are attributed to vehicle fluid leaks, vehicle component wear
(brake pad dust, tire wear, engine wear, ect.), deposition from atmospheric pollution, road
surface degradation, roofing, siding, marine antifouling coatings, wood preservatives, copper
containing pesticides, galvanized metal surfaces, hydraulic fluid, zinc containing fertilizers and
pesticides, and moss controlling agents.9,12,14–16 Zn and Cu concentrations in urban stormwater
vary widely depending on the region, source, and pathway.16 However, typical values range
nationally from 20 – 5,000 μg/L total Zn and 5 – 200 μg/L total Cu.16 In highly galvanized
industrial locations, it’s not uncommon to see dissolved Zn concentrations up to 15,000 μg/L in
runoff.17
Zinc and Copper exist in aquatic environments as divalent free metal ions and as formed
complexes with inorganic ligands or natural organic matter (NOM).7,13,18 Toxicity to marine
organisms is attributed to the free metal ion form.18 Primary removal from the water column
occurs via sedimentation and metabolic uptake by organisms.7

4
The 2012 Stormwater Management Manual for Western Washington (SMMWW) details
best management practices (BMPs) that are established in the State of Washington for treating
stormwater quality and quantity.19 Sedimentation ponds or “wetpools” can be highly effective
at removing metals sorbed onto particulates and grass‐lined swales provide filtration and
biological uptake of soluble metals through vegetation, however, these BMPs require a
significant footprint that many urban retrofit sites cannot accomodate.19 One option that
addresses limited space requirements is filtration.19
Filtration BMPs used to treat contaminated runoff are attractive due to their versatility,
ease of operation, and controllability.19 The media can be engineered to treat unique
stormwater compositions and space requirements are generally less than for other BMPs.19 The
mechanisms for metal contaminant removal from stormwater using a filtration BMP is through
the removal of metal bound particulates and adsorption of soluble metal species.20
Adsorption is the process by which dissolved constituents are physically, chemically, or
electrostatically bonded to a media surface and removed from the bulk phase solution.20–22
Physical adsorption is a process achieved by weak molecular bonding such as Van der Waals
forces and hydrogen bonding.21,22 IN addition, physical adsorption is a reversible process that
can allow for media regeneration and is the most common adsorption mechanism utilized in
water treatment applications.21 Chemisorption is essentially an irreversible bond facilitated by
electron transfer between the sorbate and sorbent.21,22 Electrostatic attraction and bonding is
attributed to differences in charge between the sorbent surface and the sorbate.22 A greater
5
charge gradient between the two results in a stronger bond.22 Cation exchange occurs when an
electrostatically bound lower‐valence cation is replaced by a higher‐valence cation.22 For
example, two electrostatically bound sodium (Na ) ions would be replaced by a single zinc
(Zn2 ) ion because the affinity is stronger due to the larger charge difference.22 Electrostatic
attraction is the most significant mechanism for ionic solute removal – such as free metal
ions.21
Adsorption capacity of a sorbent relies heavily on available surface area for bonding
sites which is why adsorption media is often made out of porous materials.21 Granular activated
carbon (GAC), for example, has a surface area range of 950 ‐ 1250 m /g, despite only having a
mean particle size of 0.5 ‐ 3 mm.21 Additionally, the surface must contain adsorption sites that
attract the contaminant of interest.23 Electrostatic adsorption of heavy metals is primarily
attributed to the presence of carboxyl (R‐COOH) and hydroxyl (R‐OH) functional groups.23
Common stormwater treatment filtration medias include sand, crushed rock, dolomite,
gypsum, and perlite.19 GAC, a staple for drinking water and wastewater treatment, has also
been investigated alongside novel medias such as agricultural wastes, compost, recycled
natural fibers, and various biomass derived chars.24–27 Research has shown GAC to effectively
adsorb heavy metals, however, production costs and issues with regeneration have kept it from
being widely accepted as a feasible option to treat municipal stormwater.28 This research
project primarily investigated two, low‐cost, novel, aqueous filter media for soluble zinc and
copper adsorption – fast pyrolyzed charcoal and torrefied wood crumbles.
6
Charcoal derived from fast pyrolysis is largely a byproduct of the global biofuels
initiative.29 Since the mid‐1970’s oil shortage in the United States, researchers have been
investigating pathways to convert lignocellulosic biomass into liquid fuels.29 One such pathway
is pyrolysis.29 During pyrolysis, biomass is heated in an anoxic environment allowing volatile
gases to escape without combustion.25 The collected volatilized gasses and excreted tars are
then purified and treated to form biofuels, bio‐oils, and biochemicals.28 Charcoal is the
carbonized spent biomass residual.25 Charcoal has been monikered “biochar” when produced
for and used in soil amendment applications or other environmental management processes
and will be referred to as such continuing forward in this report.30
Biochar’s parent feedstock (i.e. softwood, hardwood, bark, corn stover, animal manure,
rice husks, straw, ect.) can determine its eventual adsorption application and removal
efficacy.25 Additionally, adsorption effectiveness is dependent on pyrolysis temperature,
atmosphere, and residence time25,28,31. Researchers have been attempting to optimize
adsorption performance by adjusting these governing parameters, increasing surface area
through activation, and chemically modifying the surface functional groups.28 Research has
shown that standard, modified, and activated biochars are effective to varying degrees at
removing soluble metals, dyes, phenols, pesticides, polycyclic aromatic hydrocarbons, solvents,
anions, E. coli, endocrine‐disrupting compounds, and pharmaceutically active compounds from
aqueous solutions.28,32,33
7
Torrefied wood was also investigated in this report as a novel adsorption media.
Torrefaction is a mild pyrolysis process intended to preserve the biomass lower heating value
while volatilizing off low caloric value gases like CO , water, and some organic acids.34,35 The
resulting wood exhibits darkened color, weakened structural integrity, enhanced
hydrophobicity, increased energy density, heightened resistance to biodegradation, and
significantly reduced weight.28 Torrefaction is currently used to decrease transportation costs,
increase fuel quality, improve storability, and as a preprocessing treatment.34
Torrefaction largely maintains the biomass pore structure integrity and therefore lacks
the easily accessible surface area needed for adsorption sites.28 Because of this, torrefied wood
is not typically considered for adsorption applications.28 However, in a recent review of
cellulosic biosorption, Hubbe, 2013, indicated that torrefied wood should not be immediately
discounted as a sorbent based solely on limited surface area.36 He highlighted the diverse
surface chemistry developed by torrefaction and theorized that torrefied wood’s retained
structural integrity may be advantageous and worthy of investigation.36
The research reported herein was designed to evaluate the effectiveness of torrefied
wood crumbles and biochar to sorb soluble metals, specifically Zn and Cu, from stormwater.
Non‐torrefied Doug‐fir crumbles and pea gravel were also investigated to a lesser degree. The
focus was directed towards the treatment of stormwater generated on ferry terminal parking
lots.
8
2. EXPERIMENTAL METHODS
Bench scale and field scale tests were performed to determine if biochar and torrefied
wood could be used to remove soluble zinc and copper from stormwater. Laboratory column
tests were employed to test performance under controlled conditions. A field scale filter
column was designed and installed at the Bainbridge Island, WA ferry terminal and data was
collected over a seven month period (April‐Oct.).
2.1 Media Tested
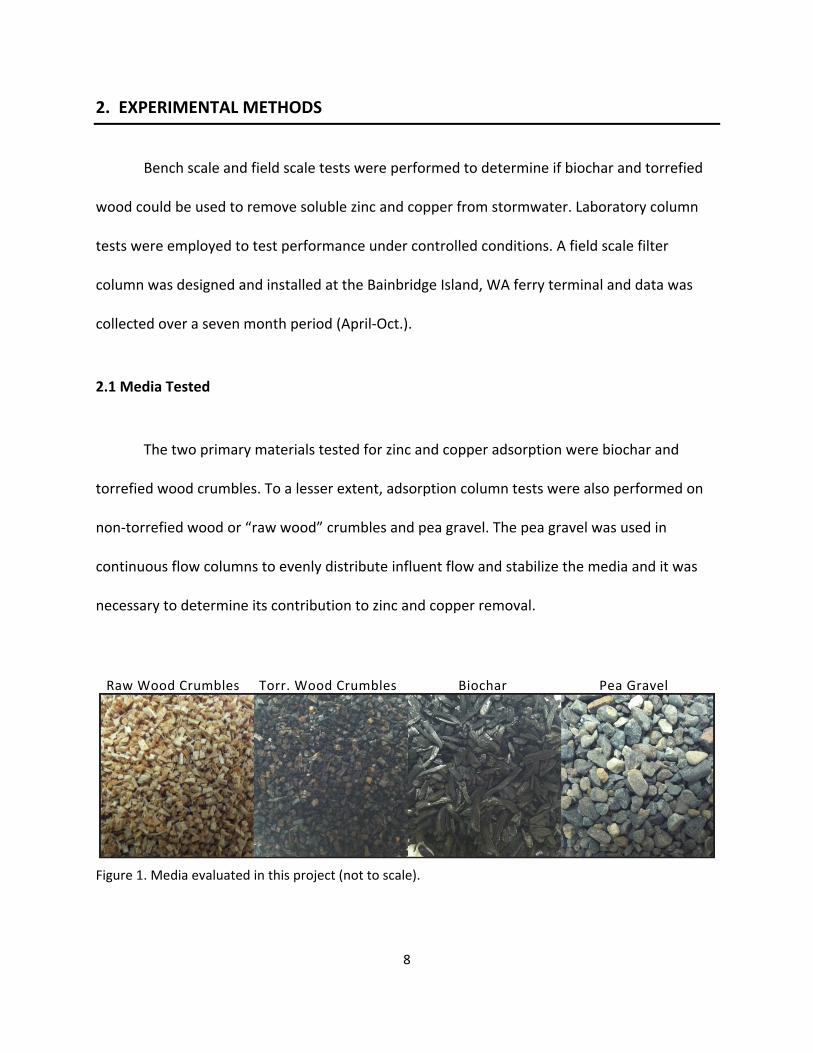
The two primary materials tested for zinc and copper adsorption were biochar and
torrefied wood crumbles. To a lesser extent, adsorption column tests were also performed on
non‐torrefied wood or “raw wood” crumbles and pea gravel. The pea gravel was used in
continuous flow columns to evenly distribute influent flow and stabilize the media and it was
necessary to determine its contribution to zinc and copper removal.
Figure 1. Media evaluated in this project (not to scale).
Raw Wood Crumbles Torr. Wood Crumbles Biochar Pea Gravel
9
The biochar used in this project was sourced from Biochar Products, a startup company located
in Halfway, Oregon that produces biochar and bio‐oil via fast pyrolysis.37 The char was
produced using beetle‐killed, lodge pole pine that was fast pyrolyzed using a mobile, pilot scale
Abri Tech reactor.38 Prior to entering into the reactor, the feedstock was dried and pulverized
using a gas‐fired chain flail dryer.38 The reactor itself used an externally heated hot shell auger
with an inert high density 2 mm steel heat carrier.38 The mean operating temperature for the
main auger and the carrier reservoir was 400 °C and the average total residence time in the
system was six minutes.38 Carbonization and evacuation of gas phase volatiles occurred within
2‐4 seconds.38 No carrier gas was used.38 The production yields were 15% process gas, 60% bio‐
oil, and 25% biochar by weight.38 The observed average biochar production rate was 7.5
kg/hr.38 Once received, the biochar was roughly sieved (US series, number 6 and 8 mesh)
through a large capacity, dual screen shaker table to remove bulk fines. It was then dried at 103
°C for 24 hours and sieved again using a RAINHART Co. 637 Mary Ann® laboratory sifter to
further remove fines and achieve a more uniform media. The size fraction passing through the
6 mesh sieve (3.35 mm) and retained on the 8 mesh sieve (2.36 mm) was utilized in the
laboratory and field column experiments. In previous work, the media was measured to have a
specific surface area of 395 m /g.31
Two millimeter, Doulas‐fir Crumbles™ were sourced from Forest Concepts, LLC, located
in Auburn, Washington. The media was produced from an industrial grade, Doug‐fir veneer that
was passed through a paper‐shredder‐like rotary shearing machine (cutters set at 1.6 mm)
resulting in uniform wood cube particles.39 It was then screened to a nominal 2mm size and
10
dried to approximately 8% moisture content prior to shipping. When received, the majority of
the crumbles were apportioned for torrefaction while a smaller fraction was set aside to be
used as a control.
The Doug‐fir crumbles were torrefied at Washington State University (WSU) using a
bench scale continuous auger pyrolysis reactor. The feed auger passed through a Lindberg/Blue
M Tube Furnace set at 270 °C with an approximate residence time of 30 minutes. Torrefaction
occurred in the presence of air which was supplied from a compressed air tank at a flow of 4.5
liters per minute. The torrefied wood was then sieved to remove fines using a RAINHART Co.
637 Mary Ann® laboratory sifter. The fraction used in testing was retained on a US Series 10
mesh (2.00 mm) sieve. Raw wood crumbles were also sieved in the same manner prior to
utilization.
Pea gravel was used as a top layer in the continuous flow columns to help disperse the
influent flow, prevent accelerated media degradation by absorbing flow energy, and stabilize
the media by opposing buoyant forces under saturated conditions. It was sourced from Atlas
Sand & Rock in Pullman, Washington. Prior to use, the pea gravel was washed in tap water to
remove dust, dirt and sand and then allowed to dry overnight at room temperature. Select
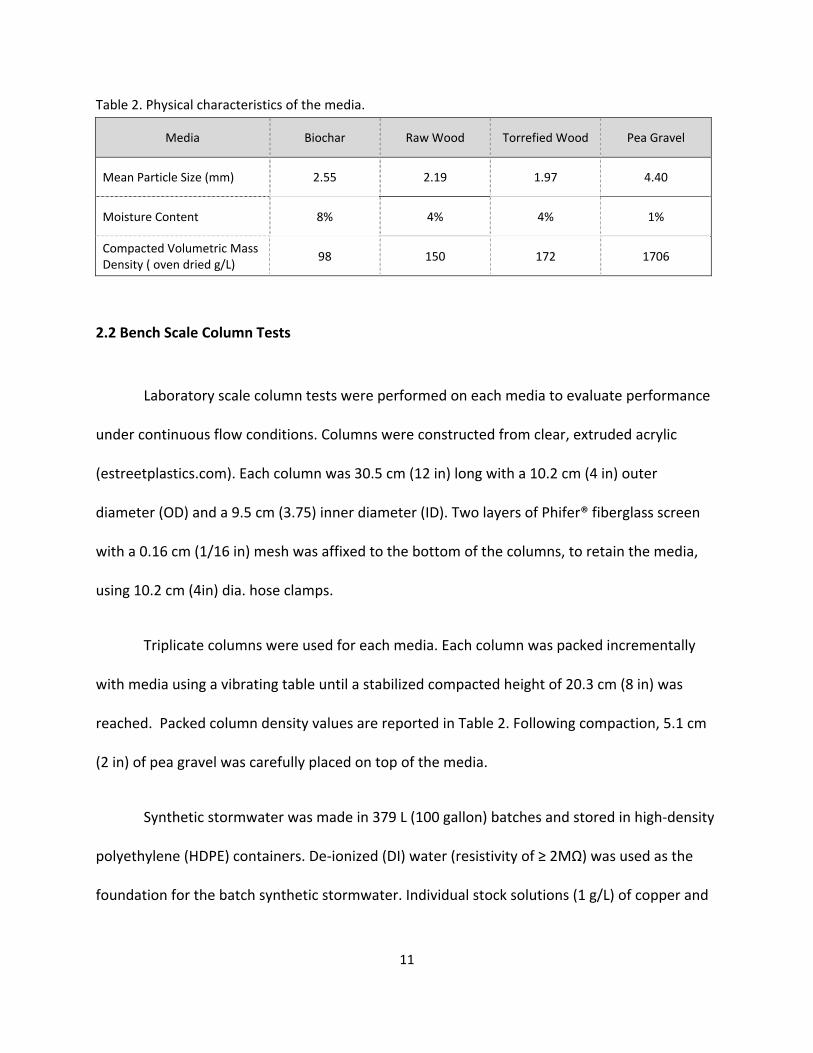
physical characteristics of all four media investigated are listed in Table 2. The values reported
in Table 2 were determined specifically for this project and are applicable to the media used in
the laboratory and field column tests. The measurements taken and calculations used to
develop Table 2 are included in the Appendix.
11
Table 2. Physical characteristics of the media.
Media Biochar Raw Wood Torrefied Wood Pea Gravel
Mean Particle Size (mm) 2.55 2.19 1.97 4.40
Moisture Content 8% 4% 4% 1%
Compacted Volumetric Mass Density ( oven dried g/L)
98 150 172 1706
2.2 Bench Scale Column Tests
Laboratory scale column tests were performed on each media to evaluate performance
under continuous flow conditions. Columns were constructed from clear, extruded acrylic
(estreetplastics.com). Each column was 30.5 cm (12 in) long with a 10.2 cm (4 in) outer
diameter (OD) and a 9.5 cm (3.75) inner diameter (ID). Two layers of Phifer® fiberglass screen
with a 0.16 cm (1/16 in) mesh was affixed to the bottom of the columns, to retain the media,
using 10.2 cm (4in) dia. hose clamps.
Triplicate columns were used for each media. Each column was packed incrementally
with media using a vibrating table until a stabilized compacted height of 20.3 cm (8 in) was
reached. Packed column density values are reported in Table 2. Following compaction, 5.1 cm
(2 in) of pea gravel was carefully placed on top of the media.
Synthetic stormwater was made in 379 L (100 gallon) batches and stored in high‐density
polyethylene (HDPE) containers. De‐ionized (DI) water (resistivity of ≥ 2MΩ) was used as the
foundation for the batch synthetic stormwater. Individual stock solutions (1 g/L) of copper and
12
zinc were made using reagent grade, granular cupric chloride dihydrate and zinc chloride
(Fisher Scientific). DI water was spiked with a known volume of stock solution to achieve target
influent concentrations of 300 μg/L Zn and 100 μg/L Cu. The pH of the synthetic stormwater
was adjusted to 6.1 ± 0.2 using a 1 M NaOH stock solution made from reagent grade sodium
hydroxide pellets (J.T. Baker). A HACH® Benchtop pH meter combined with an IntelliCAL™ Ultra
Refillable pH probe, designed for low ionic strength samples, was used to measure pH. The
synthetic stormwater solution was mixed for 1 minute with a PVC rod and allowed to
equilibration for a minimum of 12 hours prior to use. Following the equilibrium period, pH was
checked to assure that it was within the desired range.
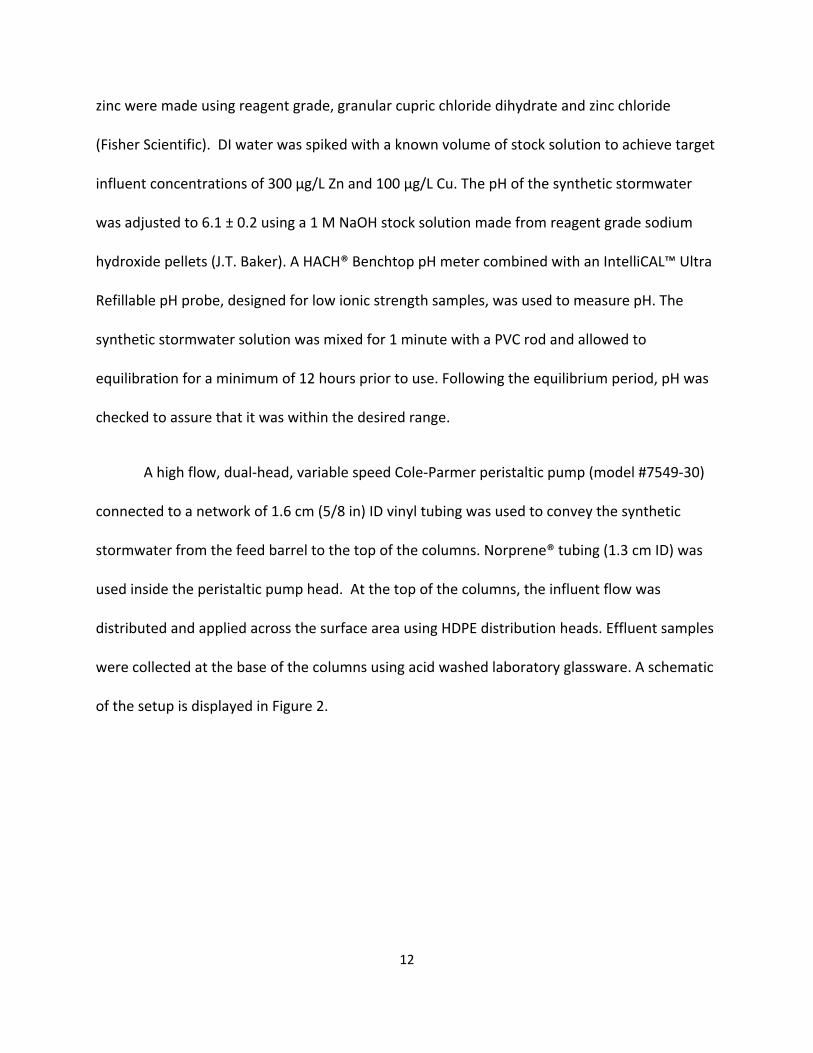
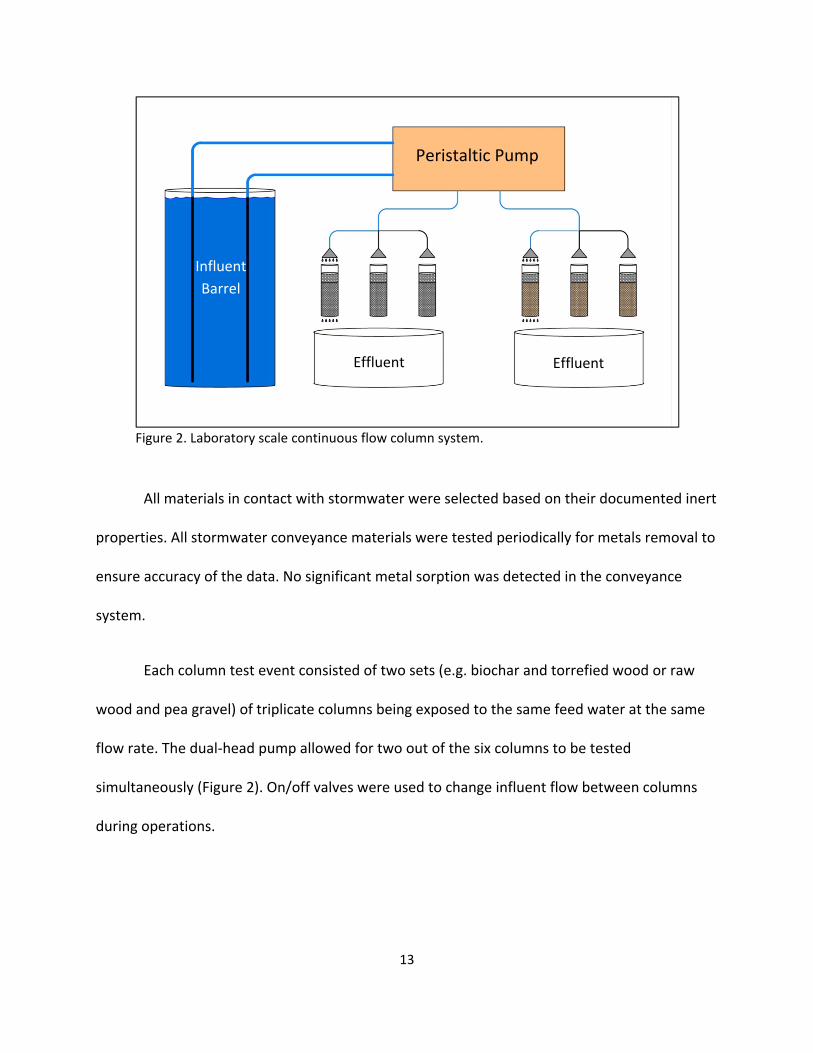
A high flow, dual‐head, variable speed Cole‐Parmer peristaltic pump (model #7549‐30)
connected to a network of 1.6 cm (5/8 in) ID vinyl tubing was used to convey the synthetic
stormwater from the feed barrel to the top of the columns. Norprene® tubing (1.3 cm ID) was
used inside the peristaltic pump head. At the top of the columns, the influent flow was
distributed and applied across the surface area using HDPE distribution heads. Effluent samples
were collected at the base of the columns using acid washed laboratory glassware. A schematic
of the setup is displayed in Figure 2.
13
Figure 2. Laboratory scale continuous flow column system.
All materials in contact with stormwater were selected based on their documented inert
properties. All stormwater conveyance materials were tested periodically for metals removal to
ensure accuracy of the data. No significant metal sorption was detected in the conveyance
system.
Each column test event consisted of two sets (e.g. biochar and torrefied wood or raw
wood and pea gravel) of triplicate columns being exposed to the same feed water at the same
flow rate. The dual‐head pump allowed for two out of the six columns to be tested
simultaneously (Figure 2). On/off valves were used to change influent flow between columns
during operations.
Peristaltic Pump
Effluent Effluent
Influent
Barrel
14
Metals removal testing was divided into two, 40 event phases differentiated by event
duration. During Phase I, each event lasted 20 minutes per column. Phase II events that lasted
80 minutes per column. Both phases were conducted at an influent flow rate of 0.76 lpm (0.2
gpm).
During Phase I testing, both discrete and composite effluent samples were collected.
Composite samples were developed for each event by collecting 20 mL samples in laboratory
glassware at t =1, 5, 10, 15, and 20 minutes. These samples were then combined to produce a
composite. In addition, 80 mL discrete samples were collected and tested every 5th event at t =
1, 10, and 20 minutes. A portion of all samples were filtered using Whatman™ 0.45 μm mixed
cellulose ester membrane filters and placed in SARSTEDT 15mL sterile screw‐cap vials and
preserved by adding nitric acid to pH < 2.40 Another aliquot was similarly preserved without
filtration for later comparison against filtered values to check for metal retention by the filters.
The remaining sample in the glassware was used to measure pH. An influent sample was
extracted from the feed water barrel during each event and prepared for analysis in the same
manner. All samples were delivered and tested for zinc and copper concentrations by ICPMS
(WSU Peter Hooper GeoAnalytical Lab) within two weeks of sampling.
The same columns used in Phase I were subjected to Phase II testing where event
duration was extended from 20 to 80 minutes while flow was maintained at 0.76 lpm (0.2 gpm).
Effluent samples were collected for analysis at t = 1, 20, 40, 60, and 80 minutes. Additionally, six
influent samples were taken from the feed water barrel at equally distributed intervals
15
throughout each series of events. After 10 events, effluent sample collection intervals were
reduced to t = 1, 40, and 80 minutes and influent samples reduced to 3 per event series feed
water batch. Processing, preservation, and analysis of the samples followed the methods
described previously.
Filtration interference was evaluated by testing filtered and non‐filtered samples. The
USEPA recommends using mixed cellulose esters (MCE) filter membranes for evaluation of
dissolved metals based on their relatively inert performance.41 However, MCE filters are not
completely inert and even a slight metal removal interference can have a significant impact
when measuring low concentrations. The 30 influent samples tested showed an average loss
through filtration of 18 ± 4 μg/L Zn and 29 ± 4 μg/L Cu. This equates to approximately 6% Zn
removal and 30% Cu removal from the filtered influent samples. Ninety effluent samples were
tested and showed an average loss through filtration of 5 ± 2 μg/L Zn and 12 ± 3 μg/L Cu.
Effluent concentrations are continuously changing, however, initial copper effluent values were
less than 5 μg/L which makes a 12.3 μg/L interference unacceptable. This is why the Phase I &
II data reported in the results and discussion section are of unfiltered samples. Filtered values
are included in the appendix.
Additional tests performed during Phase I & II consisted of measuring effluent total
suspended solids and comparing interval sample concentrations to composites. Total
suspended solids in the effluent was measured per USEPA method 1684, section 11.42
16
After Phase II was complete, high flow tests and a salt flush were performed on the
same torrefied and biochar columns. During the short‐term increased flow test events, the
Phase I & II flow rate (0.76 lpm, 0.2 gpm) was doubled (1.5 lpm, 0.4 gpm) and quadrupled (3.0
lpm, 0.8 gpm). During these higher flow events, flow duration was maintained at 80 minutes.
Influent and effluent sample collection, preparation, and quantification was performed as
previously discussed. Next, the columns were subjected to a salt flush test that could occur in
the field following an anti‐icing agent application to an upstream road surface. For these tests,
America West Environmental donated some of their product, Calcium Chloride with BOOST™
(CCB), for evaluation. CCB is listed by WSDOT as a commonly utilized liquid anti‐icing agent that
is applied during light to moderate snow events.43 CCB is a low‐toxicity salt solution combined
with proprietary additives that enhance performance and inhibit corrosion.44 WSDOT
recommends an application rate of approximately 30 gallons CCB per lane mile.43 The
concentration of calcium chloride in CCB is 32 percent and it has a density of 1.345 g/mL.43
While fully miscible in water, CCB’s enhanced viscosity binds the product to the target surface
allowing for slower dilution and longer periods between application.45,46 Design storm (6 mo.,
24 hr.) tabulated values for Bainbridge Island were taken from the Stormwater Management
Manual for Western Washington (SWMMWW) and parking lot stormwater volume was
calculated using the SCS runoff method, (equations 1 – 3).47
10 (1)
Where: S = weighted curve number (in.)
CN = curve number (98.00 for asphalt)
17
.
. (2)
∗ (3)
The simulated influent salt flush concentration was calculated assuming the applied
CCB, from one application, was contained in one‐half of a design storm runoff volume –
calculated to be 126,861 Liters (33,513 gal.). The estimated applied volume of CCB to the
Bainbridge Island catchment (detailed information in section 2.3) was 117 Liters (31 gal.) This
resulted in an influent CCB concentration of 1.24 g CCB/L correlating to an influent calcium
concentration of 144 mg Ca /L. In the laboratory, the salt flush event duration was 80 minutes
at a flow rate of 0.76 lpm (0.2 gpm). No metals were added to the influent during this event.
The pH did not require adjustment as it was within the desired target influent range. Discrete
effluent samples were taken at t = 1, 20, 40, 60, and 80 minutes. Two influent samples were
taken per column set at equally distributed intervals. After the salt flush, a standard stormwater
test event was performed on the columns to evaluate the media response after being exposed
to the anti‐icing agent.
Where: = runoff (in.)
P = rainfall (1.87 in. for Bremerton, WA. SWMMWW)
Where: V = runoff volume ( )
A = catchment area ( )
18
Following completion of all column tests performed on biochar and torrefied wood,
metals that were sorbed onto the media during column tests were desorbed and quantified.40 A
representative sample from each column (six columns total) was taken from the top, middle,
and bottom of the media along with a portion of the pea gravel. The samples were oven dried
at 60 °C and then ground into a powder using a mortar and pestle – pea gravel samples were
excluded from the grinding procedure.40 One gram of each sample was mixed with diluted (1+1)
hydrochloric (10 mL) and nitric acids (4 mL) and refluxed at 95 °C for 30 minutes.40 The samples
were cooled, diluted to 100 mL using 18 MΩ water, and allowed to rest for 24 hours.40 The
supernatant was drawn off the top and analyzed for zinc and copper concentrations using
ICPMS. Total metals desorbed from the media was then determined from the ICPMS results,
using equation 4,40 and compared to the values calculated using the difference between
influent and effluent concentrations, the associated volume of stormwater treated, and the
mass of media in the column.
∗ ∗
(4)
Where: C = metal concentration in the extract (mg/L)
V = Volume of the extract (0.1 L)
D = Dilution Factor (undiluted =1)
W = Weight of the sample (1.0 g)
19
2.3 Field Scale Column Test
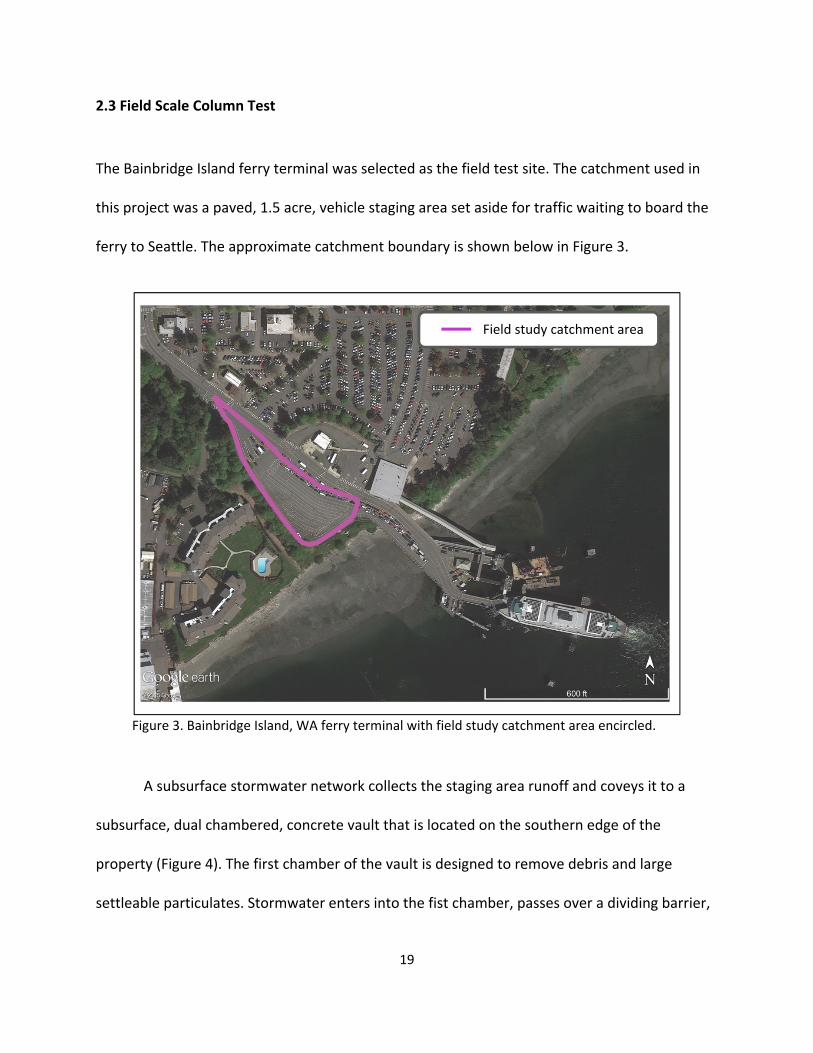
The Bainbridge Island ferry terminal was selected as the field test site. The catchment used in
this project was a paved, 1.5 acre, vehicle staging area set aside for traffic waiting to board the
ferry to Seattle. The approximate catchment boundary is shown below in Figure 3.
Figure 3. Bainbridge Island, WA ferry terminal with field study catchment area encircled.
A subsurface stormwater network collects the staging area runoff and coveys it to a
subsurface, dual chambered, concrete vault that is located on the southern edge of the
property (Figure 4). The first chamber of the vault is designed to remove debris and large
settleable particulates. Stormwater enters into the fist chamber, passes over a dividing barrier,
Field study catchment area
20
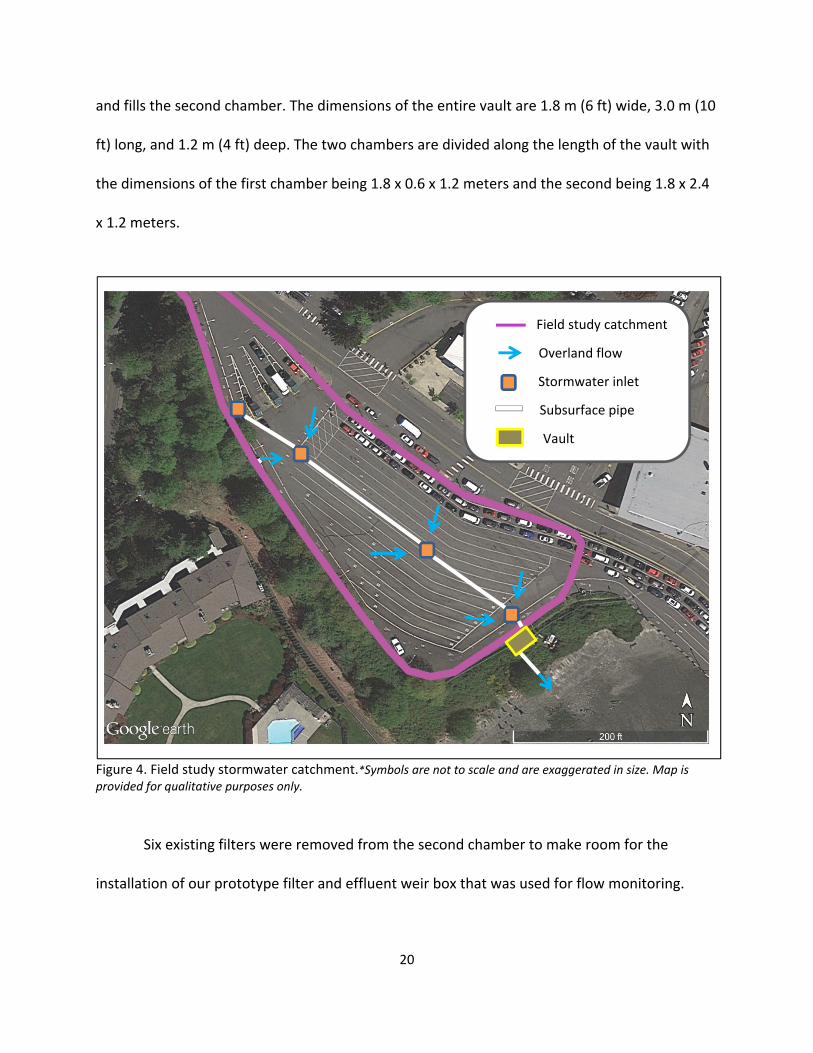
and fills the second chamber. The dimensions of the entire vault are 1.8 m (6 ft) wide, 3.0 m (10
ft) long, and 1.2 m (4 ft) deep. The two chambers are divided along the length of the vault with
the dimensions of the first chamber being 1.8 x 0.6 x 1.2 meters and the second being 1.8 x 2.4
x 1.2 meters.
Figure 4. Field study stormwater catchment.*Symbols are not to scale and are exaggerated in size. Map is provided for qualitative purposes only.
Six existing filters were removed from the second chamber to make room for the
installation of our prototype filter and effluent weir box that was used for flow monitoring.
Field study catchment
Overland flow
Stormwater inlet
Subsurface pipe
Vault
21
Column influent and effluent samples were collected using two Teledyne ISCO® 6712 full‐size
portable samplers. Rainfall data was collected using a Sigma® tip bucket rain gauge and logged
on one of the samplers. Both samplers were programmed to collect up to 24 discrete samples
during a storm event on a preselected time interval of 2 minutes. Sample collection was
initiated based on water height inside the column effluent weir box.
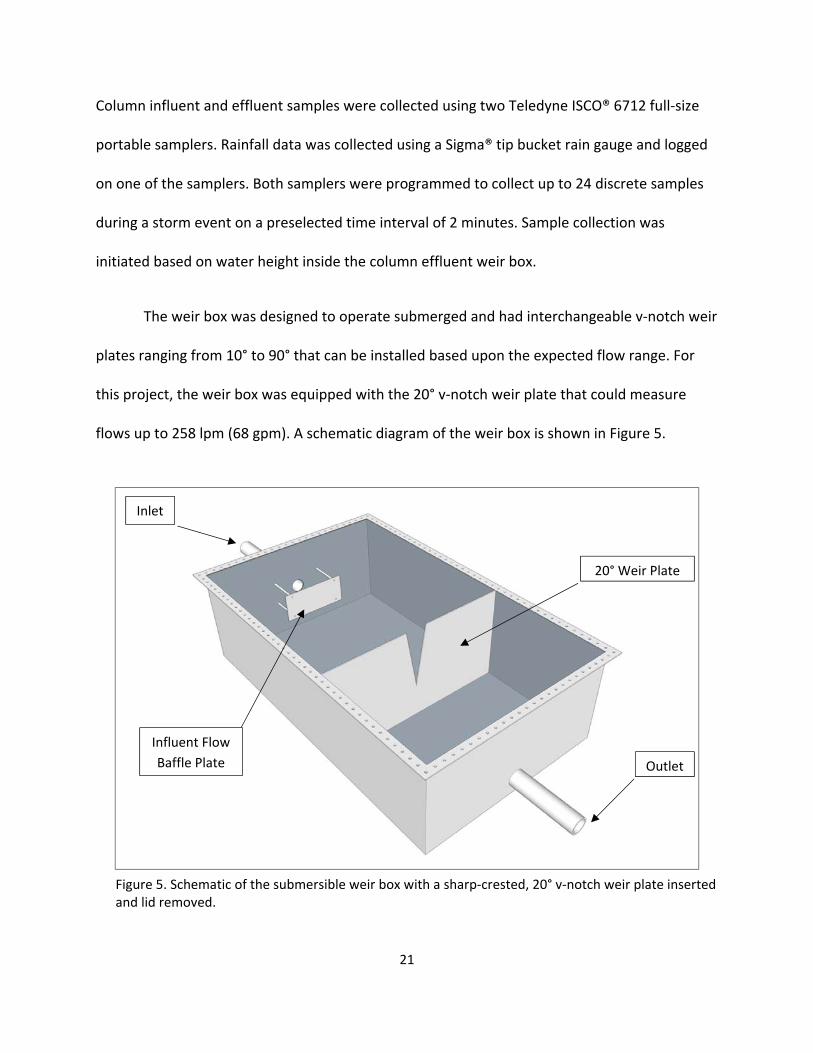
The weir box was designed to operate submerged and had interchangeable v‐notch weir
plates ranging from 10° to 90° that can be installed based upon the expected flow range. For
this project, the weir box was equipped with the 20° v‐notch weir plate that could measure
flows up to 258 lpm (68 gpm). A schematic diagram of the weir box is shown in Figure 5.
Figure 5. Schematic of the submersible weir box with a sharp‐crested, 20° v‐notch weir plate inserted and lid removed.
20° Weir Plate
Outlet
Influent Flow
Baffle Plate
Inlet
22
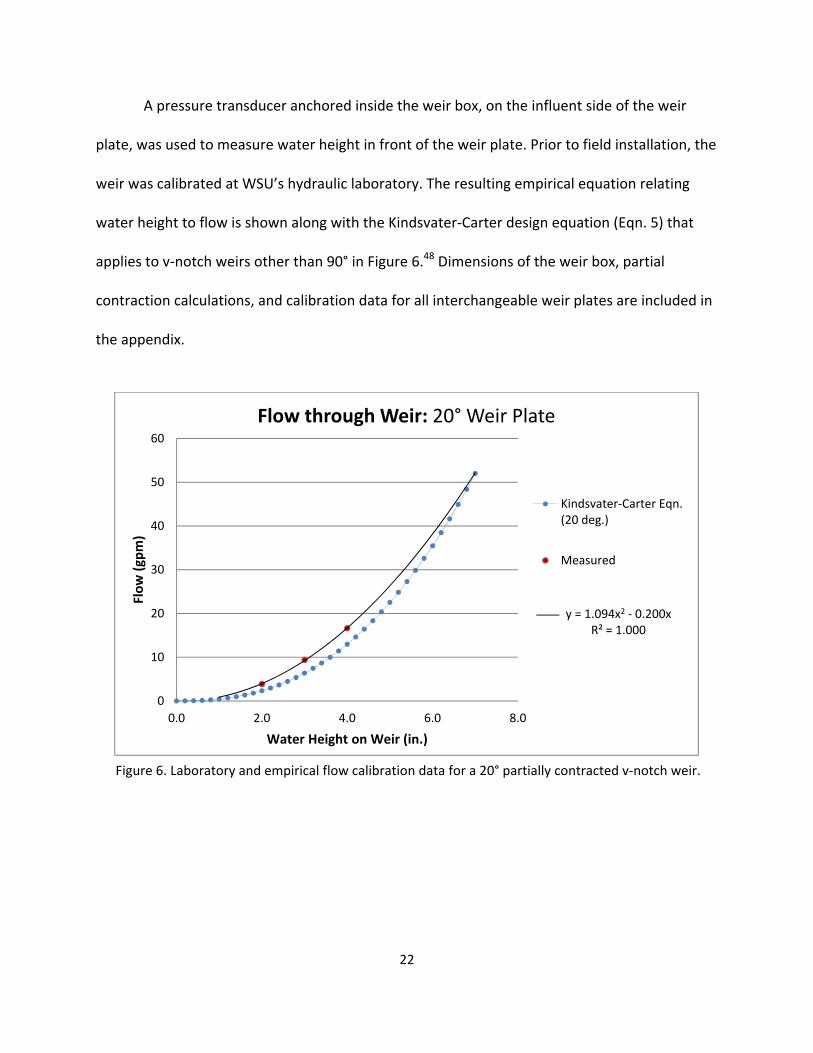
A pressure transducer anchored inside the weir box, on the influent side of the weir
plate, was used to measure water height in front of the weir plate. Prior to field installation, the
weir was calibrated at WSU’s hydraulic laboratory. The resulting empirical equation relating
water height to flow is shown along with the Kindsvater‐Carter design equation (Eqn. 5) that
applies to v‐notch weirs other than 90° in Figure 6.48 Dimensions of the weir box, partial
contraction calculations, and calibration data for all interchangeable weir plates are included in
the appendix.
Figure 6. Laboratory and empirical flow calibration data for a 20° partially contracted v‐notch weir.
y = 1.094x2 ‐ 0.200xR² = 1.000
0
10
20
30
40
50
60
0.0 2.0 4.0 6.0 8.0
Flow (gpm)
Water Height on Weir (in.)
Flow through Weir: 20° Weir Plate
Kindsvater‐Carter Eqn.(20 deg.)
Measured
23
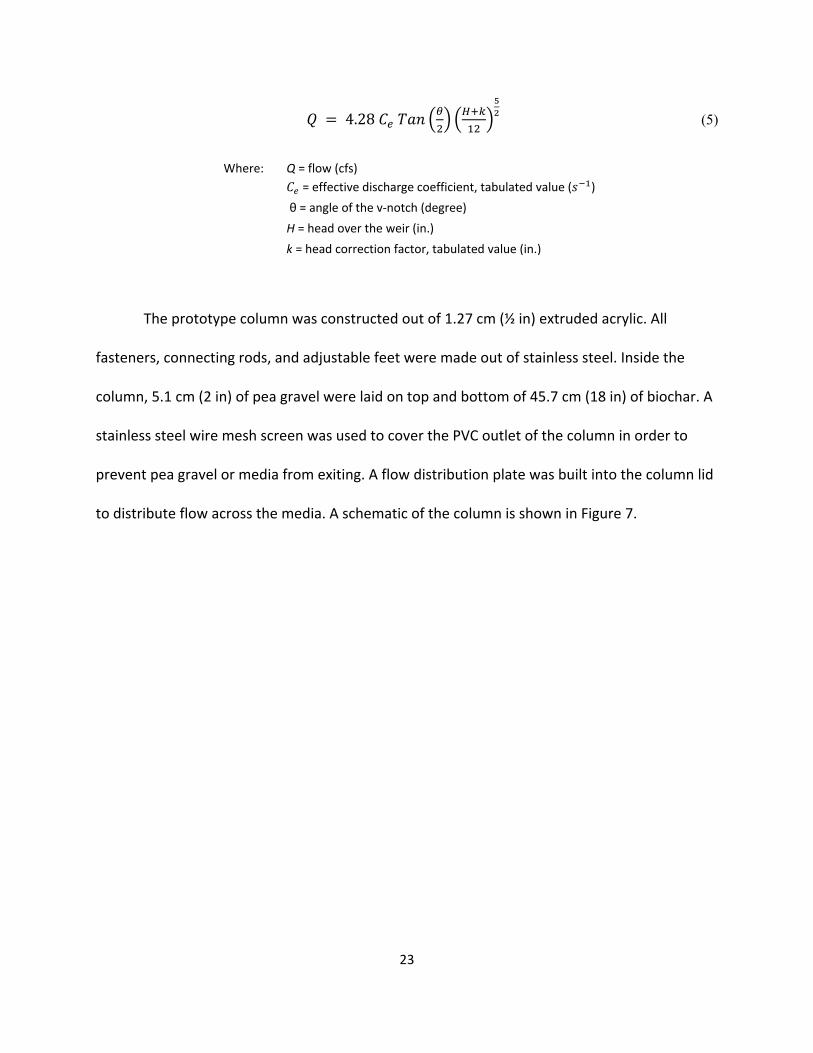
4.28 (5)
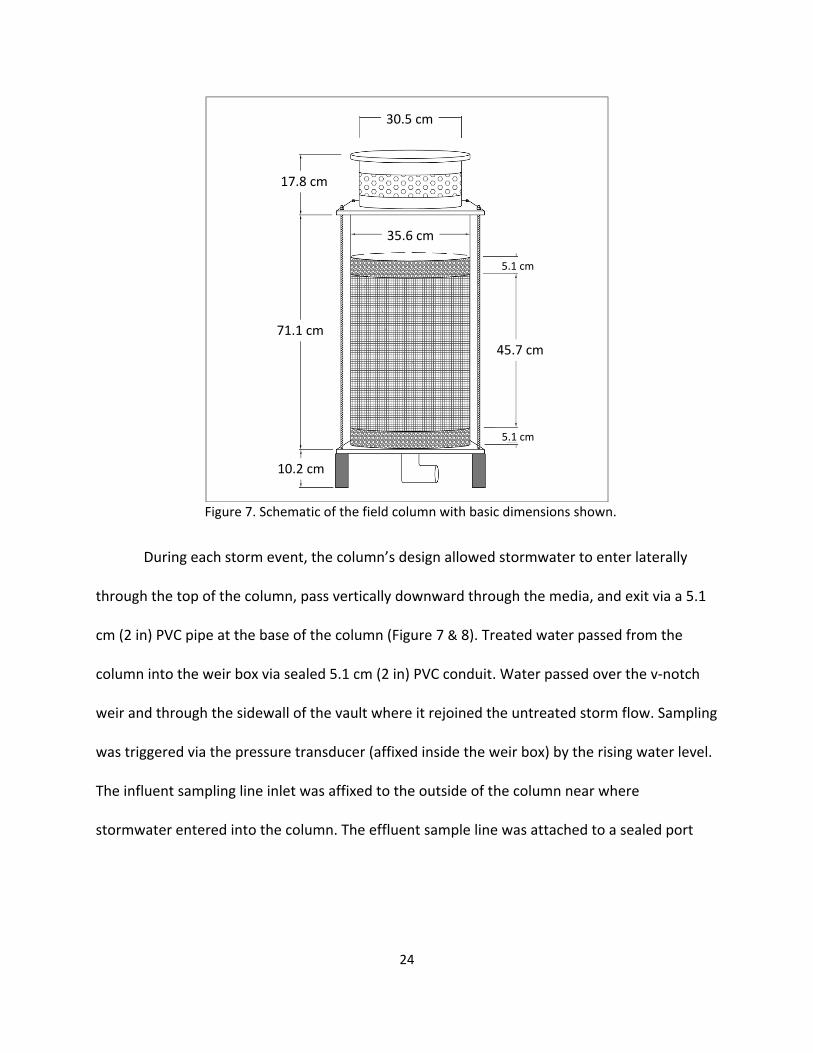
The prototype column was constructed out of 1.27 cm (½ in) extruded acrylic. All
fasteners, connecting rods, and adjustable feet were made out of stainless steel. Inside the
column, 5.1 cm (2 in) of pea gravel were laid on top and bottom of 45.7 cm (18 in) of biochar. A
stainless steel wire mesh screen was used to cover the PVC outlet of the column in order to
prevent pea gravel or media from exiting. A flow distribution plate was built into the column lid
to distribute flow across the media. A schematic of the column is shown in Figure 7.
Where: Q = flow (cfs)
= effective discharge coefficient, tabulated value ( )
θ = angle of the v‐notch (degree)
H = head over the weir (in.)
k = head correction factor, tabulated value (in.)
24
Figure 7. Schematic of the field column with basic dimensions shown.
During each storm event, the column’s design allowed stormwater to enter laterally
through the top of the column, pass vertically downward through the media, and exit via a 5.1
cm (2 in) PVC pipe at the base of the column (Figure 7 & 8). Treated water passed from the
column into the weir box via sealed 5.1 cm (2 in) PVC conduit. Water passed over the v‐notch
weir and through the sidewall of the vault where it rejoined the untreated storm flow. Sampling
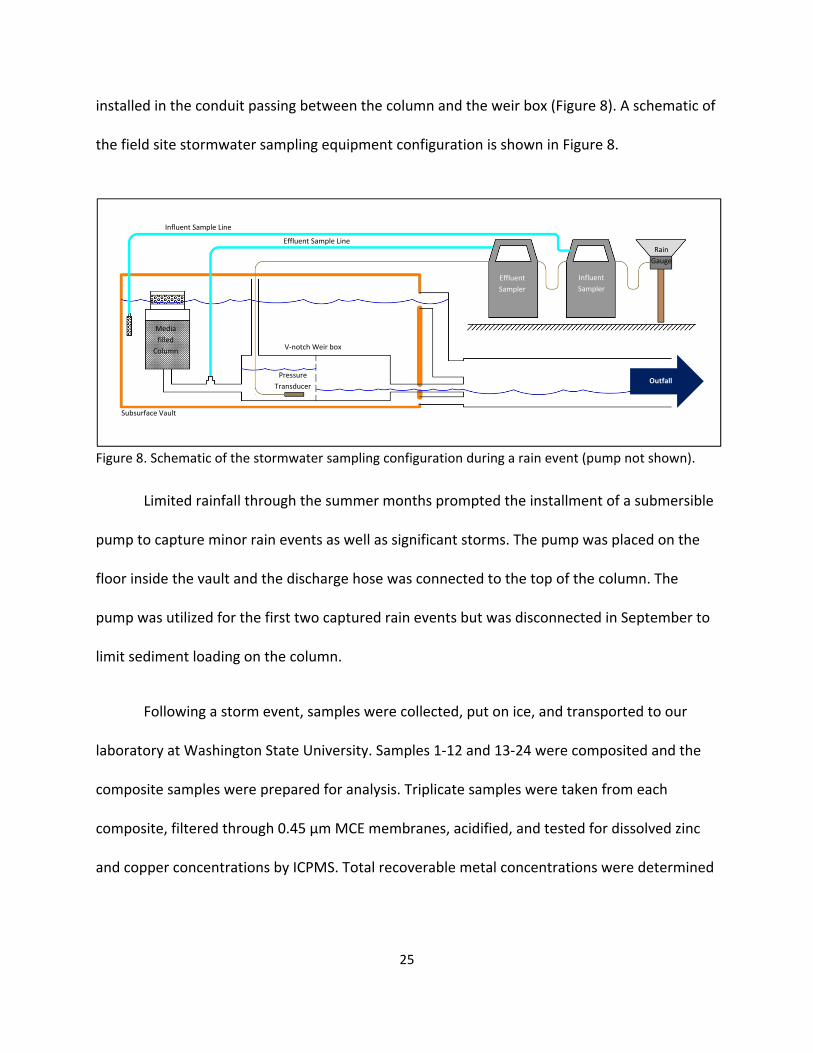
was triggered via the pressure transducer (affixed inside the weir box) by the rising water level.
The influent sampling line inlet was affixed to the outside of the column near where
stormwater entered into the column. The effluent sample line was attached to a sealed port
45.7 cm
5.1 cm
71.1 cm
10.2 cm
17.8 cm
35.6 cm
30.5 cm
5.1 cm
25
installed in the conduit passing between the column and the weir box (Figure 8). A schematic of
the field site stormwater sampling equipment configuration is shown in Figure 8.
Figure 8. Schematic of the stormwater sampling configuration during a rain event (pump not shown).
Limited rainfall through the summer months prompted the installment of a submersible
pump to capture minor rain events as well as significant storms. The pump was placed on the
floor inside the vault and the discharge hose was connected to the top of the column. The
pump was utilized for the first two captured rain events but was disconnected in September to
limit sediment loading on the column.
Following a storm event, samples were collected, put on ice, and transported to our
laboratory at Washington State University. Samples 1‐12 and 13‐24 were composited and the
composite samples were prepared for analysis. Triplicate samples were taken from each
composite, filtered through 0.45 μm MCE membranes, acidified, and tested for dissolved zinc
and copper concentrations by ICPMS. Total recoverable metal concentrations were determined
Outfall
Effluent
Sampler
Influent
Sampler
Media
filled
Column
Rain
Gauge
Subsurface Vault
V‐notch Weir box
Pressure
Transducer
Influent Sample Line
Effluent Sample Line
26
per EPA method 200.7, section 11.2.40 Total suspended solids (TSS) and volatile suspended
solids (VSS) were determined per EPA method 1684, section 11.42
A representative sludge sample was taken from inside the vault after the August 29th
storm event and tested for Zn and Cu concentrations. Procedural steps for sludge sample
preparation and analysis were determined from EPA 200.7 and EPA 1684 respectively.40,42 A
particle size analysis was conducted on the sludge sample using a Malvern Mastersizer 3000.
3. RESULTS AND DISCUSSION
3.1 Phase I & II Bench Scale Testing
3.1.1 General Long‐Term Trends
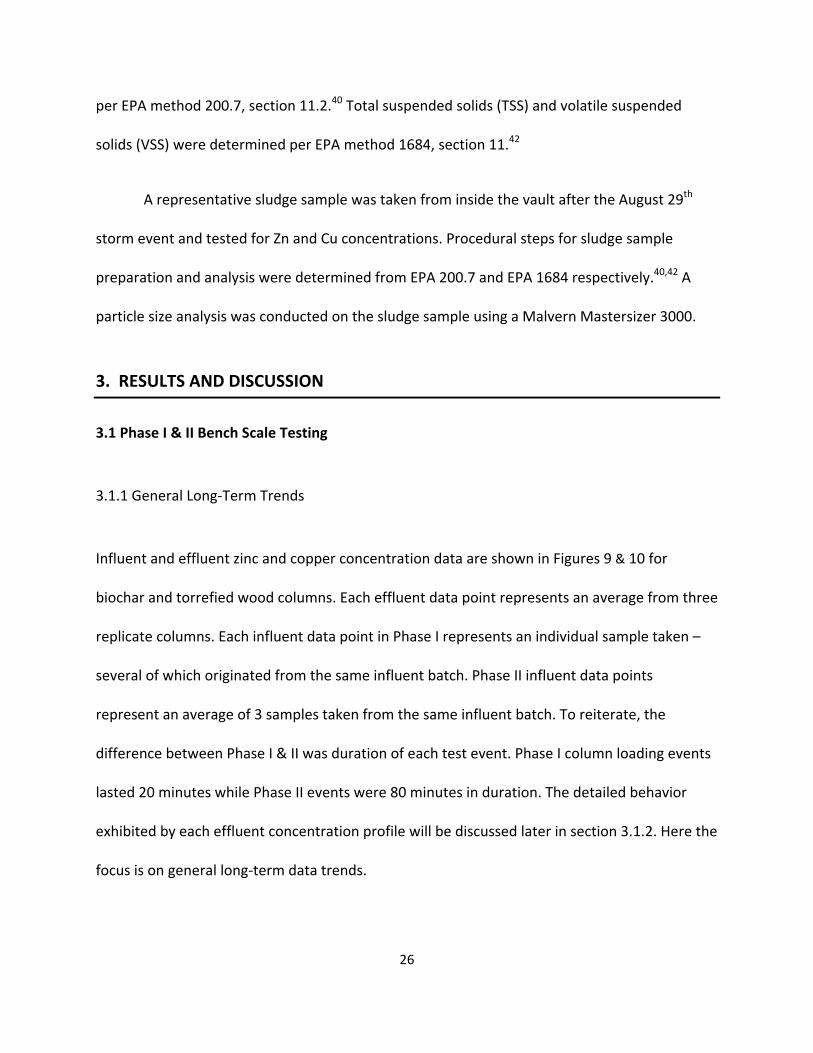
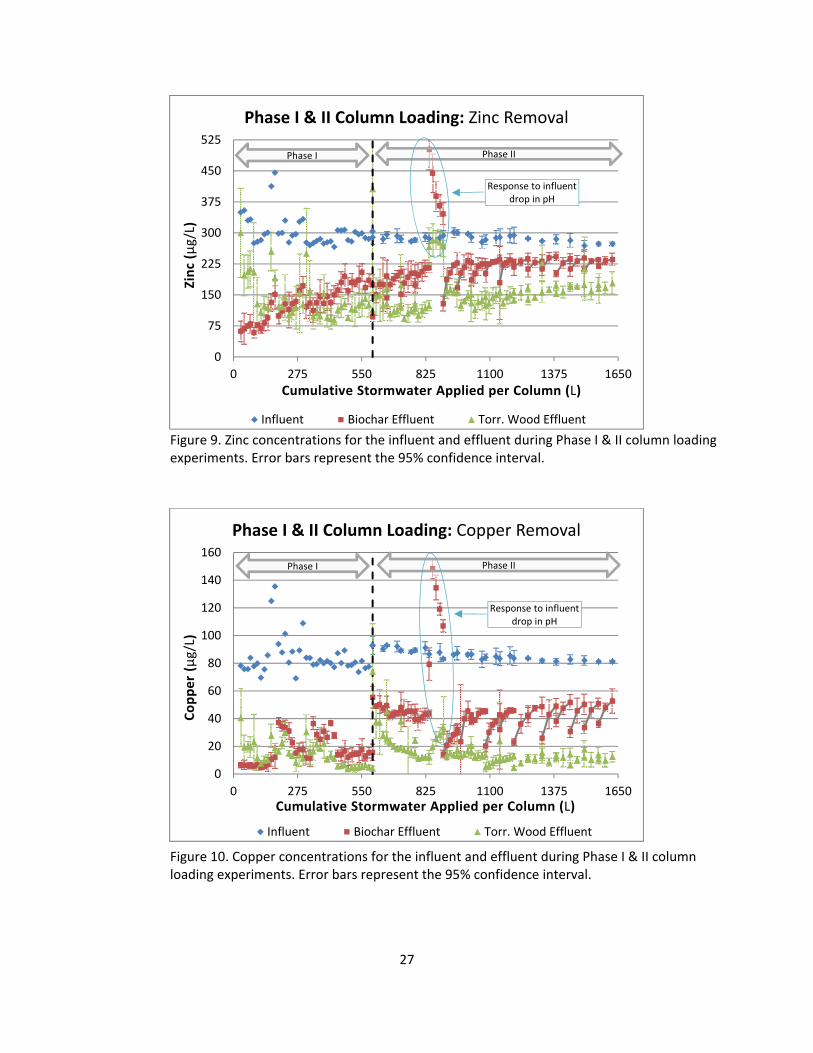
Influent and effluent zinc and copper concentration data are shown in Figures 9 & 10 for
biochar and torrefied wood columns. Each effluent data point represents an average from three
replicate columns. Each influent data point in Phase I represents an individual sample taken –
several of which originated from the same influent batch. Phase II influent data points
represent an average of 3 samples taken from the same influent batch. To reiterate, the
difference between Phase I & II was duration of each test event. Phase I column loading events
lasted 20 minutes while Phase II events were 80 minutes in duration. The detailed behavior
exhibited by each effluent concentration profile will be discussed later in section 3.1.2. Here the
focus is on general long‐term data trends.
27
Figure 9. Zinc concentrations for the influent and effluent during Phase I & II column loading experiments. Error bars represent the 95% confidence interval.
Figure 10. Copper concentrations for the influent and effluent during Phase I & II column loading experiments. Error bars represent the 95% confidence interval.
0
75
150
225
300
375
450
525
0 275 550 825 1100 1375 1650
Zinc (μg/L)
Cumulative Stormwater Applied per Column (L)
Phase I & II Column Loading: Zinc Removal
Influent Biochar Effluent Torr. Wood Effluent
Phase IIPhase I
Response to influent drop in pH
0
20
40
60
80
100
120
140
160
0 275 550 825 1100 1375 1650
Copper (μg/L)
Cumulative Stormwater Applied per Column (L)
Phase I & II Column Loading: Copper Removal
Influent Biochar Effluent Torr. Wood Effluent
Phase IIPhase I
Response to influentdrop in pH
28
The influent and effluent data for Phase I testing exhibits more scatter than the Phase II
data (Figure 9 and 10). This is due to greater experimental error experienced during start‐up of
the column tests. The only effluent concentration profile that shows a discernable long term
trend is that for zinc on biochar columns (Figure 9). The concentration continually increases
from about 75 μg/L to 175 μg/L at the end of Phase I. This is typical behavior for most sorbents
in adsorption systems; as available sorption sites become occupied, the contaminant removal
efficiency decreases and effluent concentration increases. This reflects the lower equilibrium
zinc sorption capacity for biochar compared to copper that was defined in previous work.31
An interesting trend can be observed in the torrefied wood column effluent data, at the
early stage of operation (up to about 100 L). The effluent zinc data in Figure 9 clearly shows a
decreasing concentration during this period of operation. This behavior is related to the
changing moisture content of the media as testing progresses. At Phase I testing initiation, the
moisture content of torrefied wood (4%) was well below the fiber saturation point (fsp) which is
25 – 30% for most wood species.49 As column testing progressed the torrefied wood crumbles
swelled with hydration, opening capillary structure and allowing metals to access additional
sites of adsorption through molecular diffusion.21 Once inside the cell structure, the metals are
removed from solution by electrostatic bonding with hydroxyl groups associated with wood
polymers.50
In Phase II the overall effluent zinc concentration continues to increase for both media
as cumulative stormwater throughput increases (Figure 9). For biochar, zinc concentration
29
appears to stabilize at an average value of approximately 230 µg/L at stormwater throughput
greater than 1325 L (350 gal.). However, the stabilization is offset by a decreasing influent zinc
concentration that results in an actual 7% decrease in percent zinc removal between 1211‐1628
Liters (320‐430 gal.) Torrefied wood columns showed a continued gradual increase in zinc
concentration. At the end of phase II testing (1628 L total stormwater throughput), effluent zinc
concentration for torrefied wood was approximately 160 µg/L. Overall, both media decreased
in percent zinc removal with increased cumulative stormwater throughput across Phase II,
which is attributed to the decreasing number of available sorption sites.
The data shown in Figure 10 indicates that the long‐term Phase II effluent copper
concentration for biochar is stable at approximately 45 µg/L. Again, this biochar effluent
stabilization is actually a continued period of decreasing percent metal removal when the
influent concentration is also taken into consideration. Across Phase II, the influent copper
concentration steadily decreases 11 μg/L from start to finish resulting in an overall 7% decrease
in biochar copper removal. The torrefied wood effluent data shows an initial decrease in copper
concentration from the initiation of Phase II to a throughput of approximately 870 Liters (230
gal.). This is likely attributed to a significant column rest period that occurred between phases,
resulting in decreased moisture content of the media. At the initiation of Phase II, rehydration
was required to restore full sorption capacity, as previously discussed. As throughput volume
increased across Phase II, torrefied wood effluent copper concentration leveled out and
remained stable at an average concentration of 12 µg/L, for the remainder of the period.
30
At the completion of phase II, the biochar columns were yielding respective zinc and
copper removals of about 14 and 35 % while the torrefied wood columns were operating at zinc
and copper removals of 35 and 84%. The overall removal for both Phase I and II was
determined by calculating total mass of zinc and copper adsorbed using influent and effluent
concentration and flow data. After 1628 Liters (430 gal.) of synthetic stormwater passed
through the columns, the respective total mass of zinc and copper removed from solution by
biochar was 163 and 78 mg and by torrefied wood was 231 and 114 mg. This equates to an
overall percent removal of 34% Zn, 57% Cu for biochar and 48% Zn, 83% Cu for torrefied wood.
It is clear that, for the conditions studied, torrefied wood outperforms biochar with regard to
lower effluent metal concentration and higher percent removals.
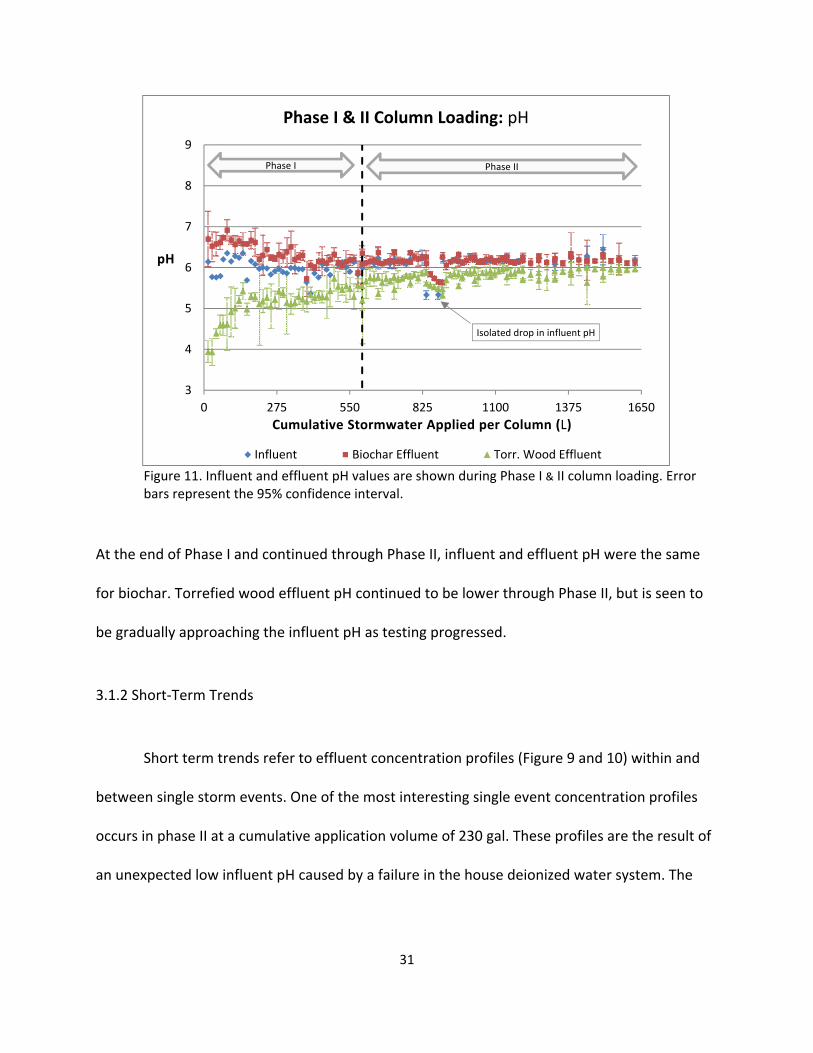
The pH data shown in Figure 11 indicates that the biochar column increased the
simulated stormwater pH during Phase I while torrefied wood lowered the pH, which – is
expected behavior relative to each media. Most woods originating from temperate zones are
inherently acidic, including Douglas‐fir and members of the Pinus genus51 When wood,
including torrefied wood, is in contact with water, free acids and acidic groups (primarily acetic
acid, formic acid, and acetyl groups) are released into solution lowering the pH.29,51 During
complete pyrolysis, acidic chemical compounds are released from the wood along with the
desired sugar polymers, leaving behind a char that is typically alkaline.29 Additionally, the ash
content of the biochar, which is known to be basic, could be contributing to the effluent pH
increase.52
31
Figure 11. Influent and effluent pH values are shown during Phase I & II column loading. Error bars represent the 95% confidence interval.
At the end of Phase I and continued through Phase II, influent and effluent pH were the same
for biochar. Torrefied wood effluent pH continued to be lower through Phase II, but is seen to
be gradually approaching the influent pH as testing progressed.
3.1.2 Short‐Term Trends
Short term trends refer to effluent concentration profiles (Figure 9 and 10) within and
between single storm events. One of the most interesting single event concentration profiles
occurs in phase II at a cumulative application volume of 230 gal. These profiles are the result of
an unexpected low influent pH caused by a failure in the house deionized water system. The
3
4
5
6
7
8
9
0 275 550 825 1100 1375 1650
pH
Cumulative Stormwater Applied per Column (L)
Phase I & II Column Loading: pH
Influent Biochar Effluent Torr. Wood Effluent
Phase IIPhase I
Isolated drop in influent pH
32
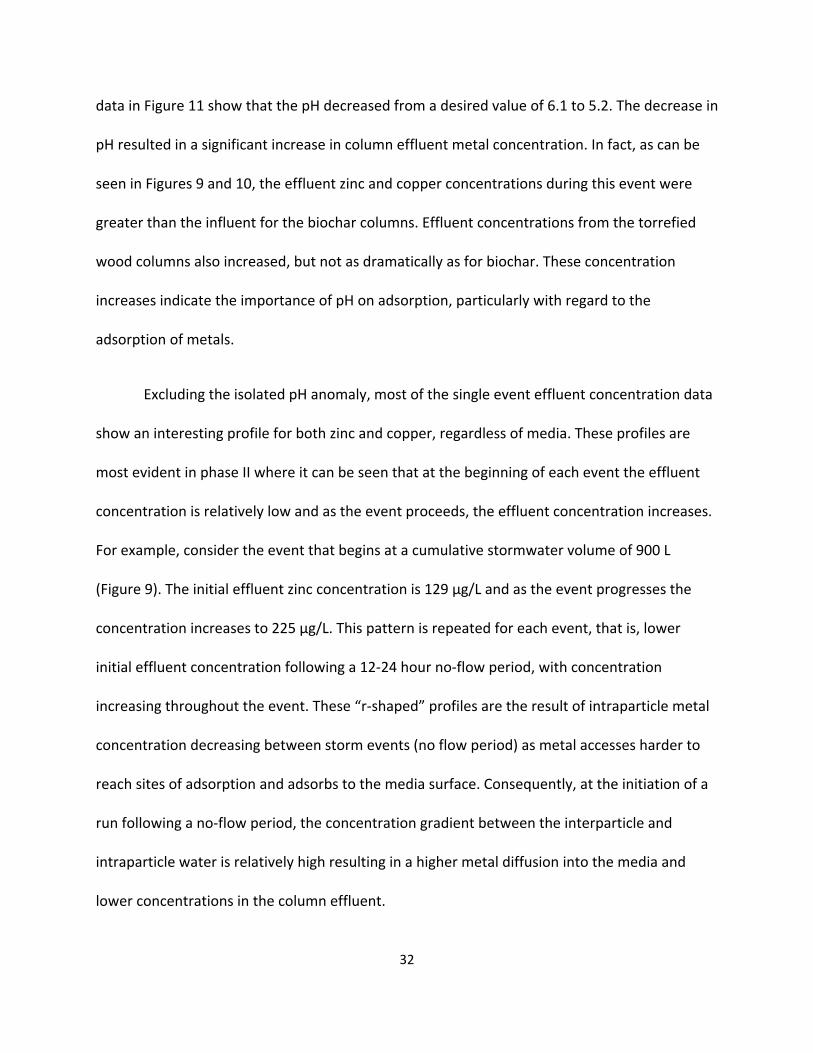
data in Figure 11 show that the pH decreased from a desired value of 6.1 to 5.2. The decrease in
pH resulted in a significant increase in column effluent metal concentration. In fact, as can be
seen in Figures 9 and 10, the effluent zinc and copper concentrations during this event were
greater than the influent for the biochar columns. Effluent concentrations from the torrefied
wood columns also increased, but not as dramatically as for biochar. These concentration
increases indicate the importance of pH on adsorption, particularly with regard to the
adsorption of metals.
Excluding the isolated pH anomaly, most of the single event effluent concentration data
show an interesting profile for both zinc and copper, regardless of media. These profiles are
most evident in phase II where it can be seen that at the beginning of each event the effluent
concentration is relatively low and as the event proceeds, the effluent concentration increases.
For example, consider the event that begins at a cumulative stormwater volume of 900 L
(Figure 9). The initial effluent zinc concentration is 129 µg/L and as the event progresses the
concentration increases to 225 µg/L. This pattern is repeated for each event, that is, lower
initial effluent concentration following a 12‐24 hour no‐flow period, with concentration
increasing throughout the event. These “r‐shaped” profiles are the result of intraparticle metal
concentration decreasing between storm events (no flow period) as metal accesses harder to
reach sites of adsorption and adsorbs to the media surface. Consequently, at the initiation of a
run following a no‐flow period, the concentration gradient between the interparticle and
intraparticle water is relatively high resulting in a higher metal diffusion into the media and
lower concentrations in the column effluent.
33
Influent metal concentration fluctuations shown in Phase I are likely responsible for
corresponding effluent data perturbations. This is most visible on Figure 10 because the graph
is shown on a smaller scale. At first glance, zinc effluent concentrations appear to be more
consistent than copper across Phase I & II suggesting that zinc may be more stable than copper.
Upon closer inspection, the copper effluent trend line break, occurring at the point of phase
change, is in response to a 16 μg/L Cu influent increase whereas zinc influent concentrations
were stable from Phase I to Phase II. As experimental techniques were refined during Phase I
which resulted in more stable influent concentrations, effluent concentration trends also
stabilized. From this data set alone, it is unclear whether or not copper adsorption is more
sensitive than zinc, however, it is clear that both media showed increased effluent
concentrations corresponding with increased influent concentrations indicating that the lowest
achievable discharge limit is a function of influent concentration.
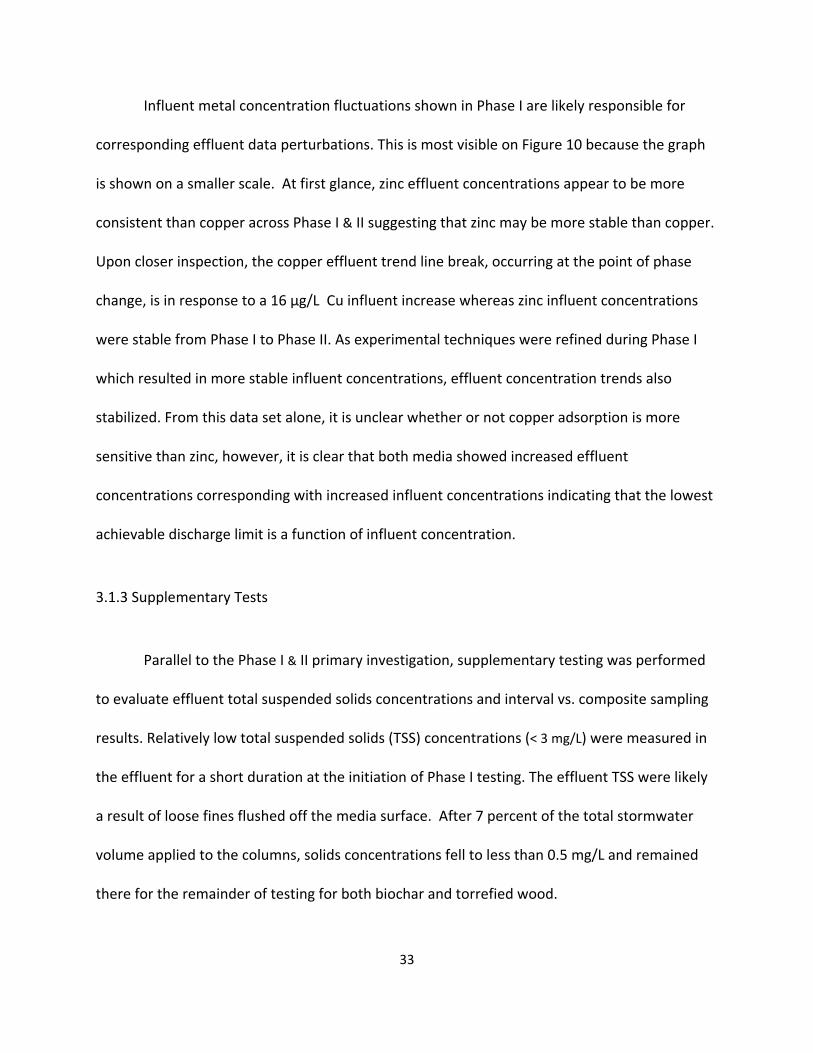
3.1.3 Supplementary Tests
Parallel to the Phase I & II primary investigation, supplementary testing was performed
to evaluate effluent total suspended solids concentrations and interval vs. composite sampling
results. Relatively low total suspended solids (TSS) concentrations (< 3 mg/L) were measured in
the effluent for a short duration at the initiation of Phase I testing. The effluent TSS were likely
a result of loose fines flushed off the media surface. After 7 percent of the total stormwater
volume applied to the columns, solids concentrations fell to less than 0.5 mg/L and remained
there for the remainder of testing for both biochar and torrefied wood.
34
For selected events in Phase I, discrete effluent samples (80 mL) were taken
simultaneously with and in addition to standard composite samples. The resulting discrete
metal concentrations were then compared against the composite sample concentrations as a
means of checking analytical techniques. Discrete sample concentrations supported the macro
trends described by the composite samples. This extra step confirmed laboratory techniques
and assisted in validating metal quantification.
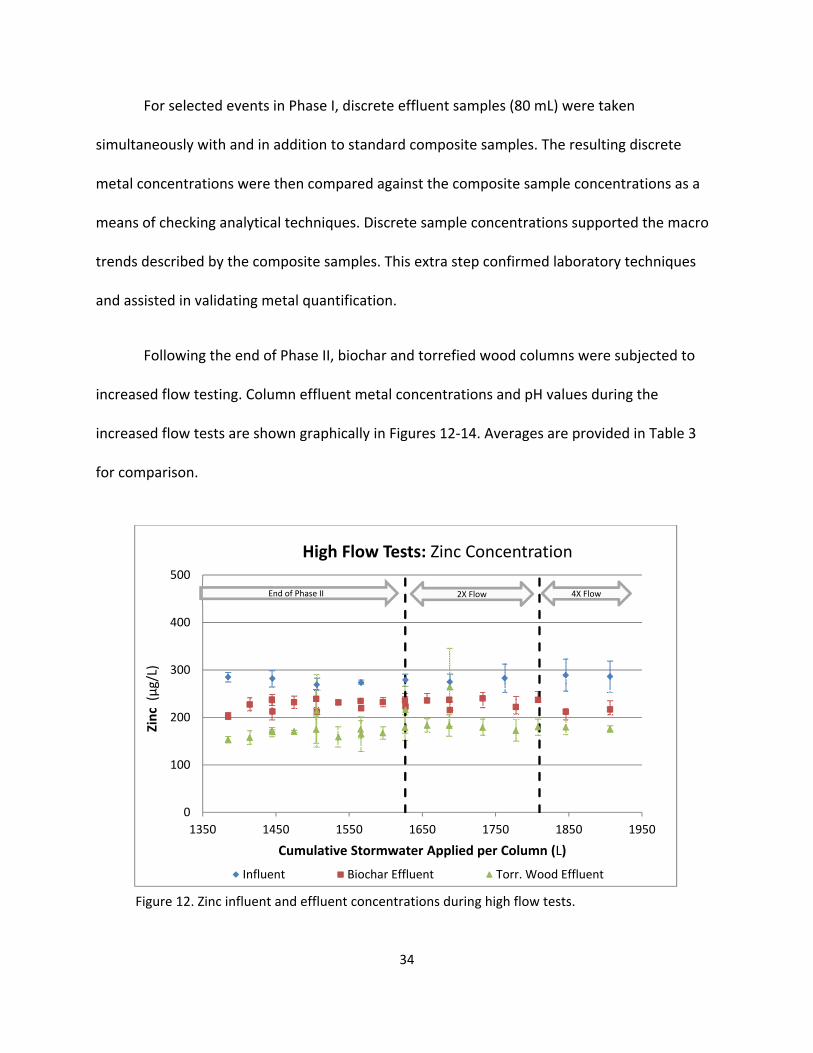
Following the end of Phase II, biochar and torrefied wood columns were subjected to
increased flow testing. Column effluent metal concentrations and pH values during the
increased flow tests are shown graphically in Figures 12‐14. Averages are provided in Table 3
for comparison.
Figure 12. Zinc influent and effluent concentrations during high flow tests.
0
100
200
300
400
500
1350 1450 1550 1650 1750 1850 1950
Zinc (μg/L)
Cumulative Stormwater Applied per Column (L)
High Flow Tests: Zinc Concentration
Influent Biochar Effluent Torr. Wood Effluent
2X Flow 4X FlowEnd of Phase II
35
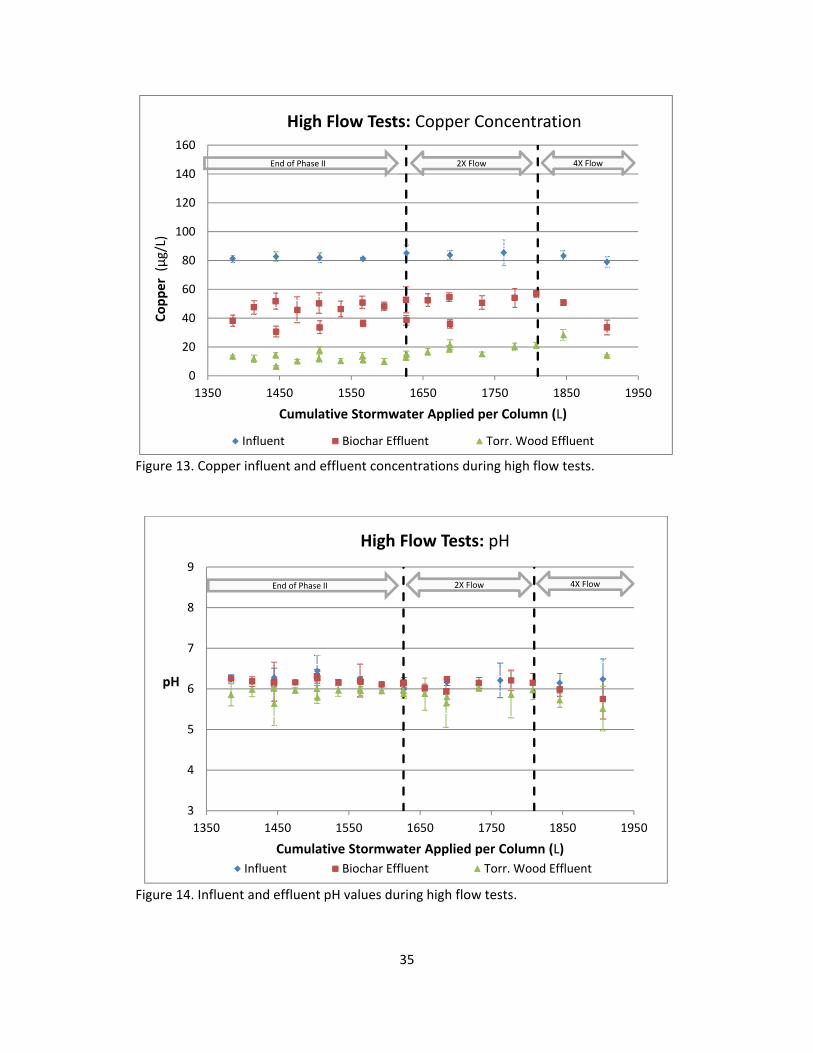
Figure 13. Copper influent and effluent concentrations during high flow tests.
Figure 14. Influent and effluent pH values during high flow tests.
0
20
40
60
80
100
120
140
160
1350 1450 1550 1650 1750 1850 1950
Copper (μg/L)
Cumulative Stormwater Applied per Column (L)
High Flow Tests: Copper Concentration
Influent Biochar Effluent Torr. Wood Effluent
2X Flow 4X FlowEnd of Phase II
3
4
5
6
7
8
9
1350 1450 1550 1650 1750 1850 1950
pH
Cumulative Stormwater Applied per Column (L)
High Flow Tests: pH
Influent Biochar Effluent Torr. Wood Effluent
2X Flow 4X FlowEnd of Phase II
36
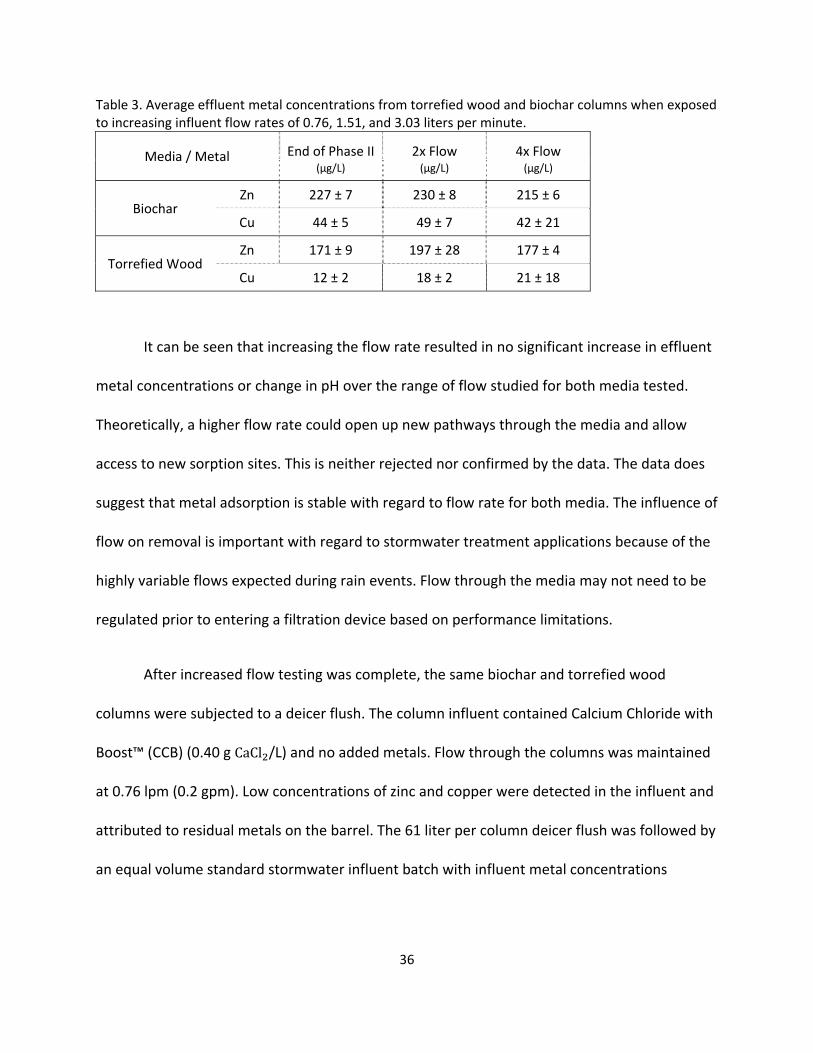
Table 3. Average effluent metal concentrations from torrefied wood and biochar columns when exposed to increasing influent flow rates of 0.76, 1.51, and 3.03 liters per minute.
Media / Metal End of Phase II 2x Flow 4x Flow (μg/L) (μg/L) (μg/L)
Biochar Zn 227 ± 7 230 ± 8 215 ± 6
Cu 44 ± 5 49 ± 7 42 ± 21
Torrefied Wood Zn 171 ± 9 197 ± 28 177 ± 4
Cu 12 ± 2 18 ± 2 21 ± 18
It can be seen that increasing the flow rate resulted in no significant increase in effluent
metal concentrations or change in pH over the range of flow studied for both media tested.
Theoretically, a higher flow rate could open up new pathways through the media and allow
access to new sorption sites. This is neither rejected nor confirmed by the data. The data does
suggest that metal adsorption is stable with regard to flow rate for both media. The influence of
flow on removal is important with regard to stormwater treatment applications because of the
highly variable flows expected during rain events. Flow through the media may not need to be
regulated prior to entering a filtration device based on performance limitations.
After increased flow testing was complete, the same biochar and torrefied wood
columns were subjected to a deicer flush. The column influent contained Calcium Chloride with
Boost™ (CCB) (0.40 g CaCl /L) and no added metals. Flow through the columns was maintained
at 0.76 lpm (0.2 gpm). Low concentrations of zinc and copper were detected in the influent and
attributed to residual metals on the barrel. The 61 liter per column deicer flush was followed by
an equal volume standard stormwater influent batch with influent metal concentrations
37
adjusted to 300 μg/L Zn and 100 μg/L Cu and the pH adjusted to 6.1 ± 0.1. The stormwater
application rate remained at 0.76 lpm. Influent and effluent metal concentrations and pH
values for the deicer tests are shown in Figures 15‐17. In Figures 15 & 16, the y‐axis metal
concentrations are displayed in log scale.
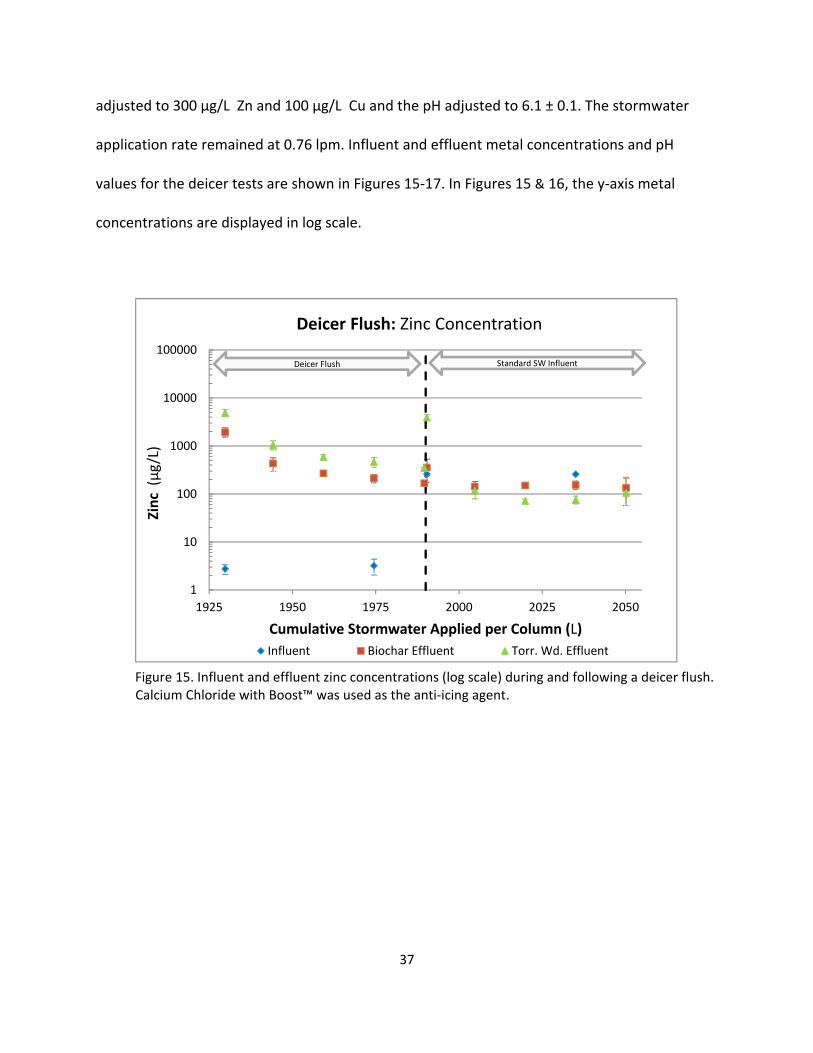
Figure 15. Influent and effluent zinc concentrations (log scale) during and following a deicer flush. Calcium Chloride with Boost™ was used as the anti‐icing agent.
1
10
100
1000
10000
100000
1925 1950 1975 2000 2025 2050
Zinc (μg/L)
Cumulative Stormwater Applied per Column (L)
Deicer Flush: Zinc Concentration
Influent Biochar Effluent Torr. Wd. Effluent
Standard SW InfluentDeicer Flush
38
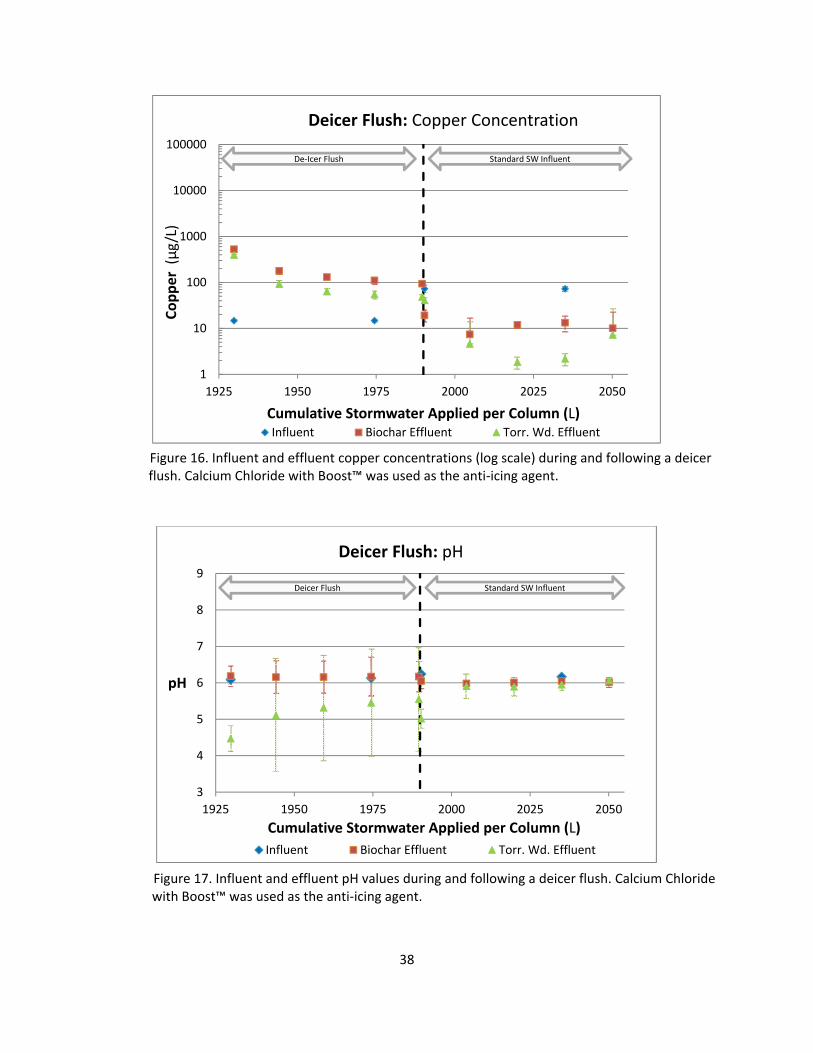
Figure 16. Influent and effluent copper concentrations (log scale) during and following a deicer flush. Calcium Chloride with Boost™ was used as the anti‐icing agent.
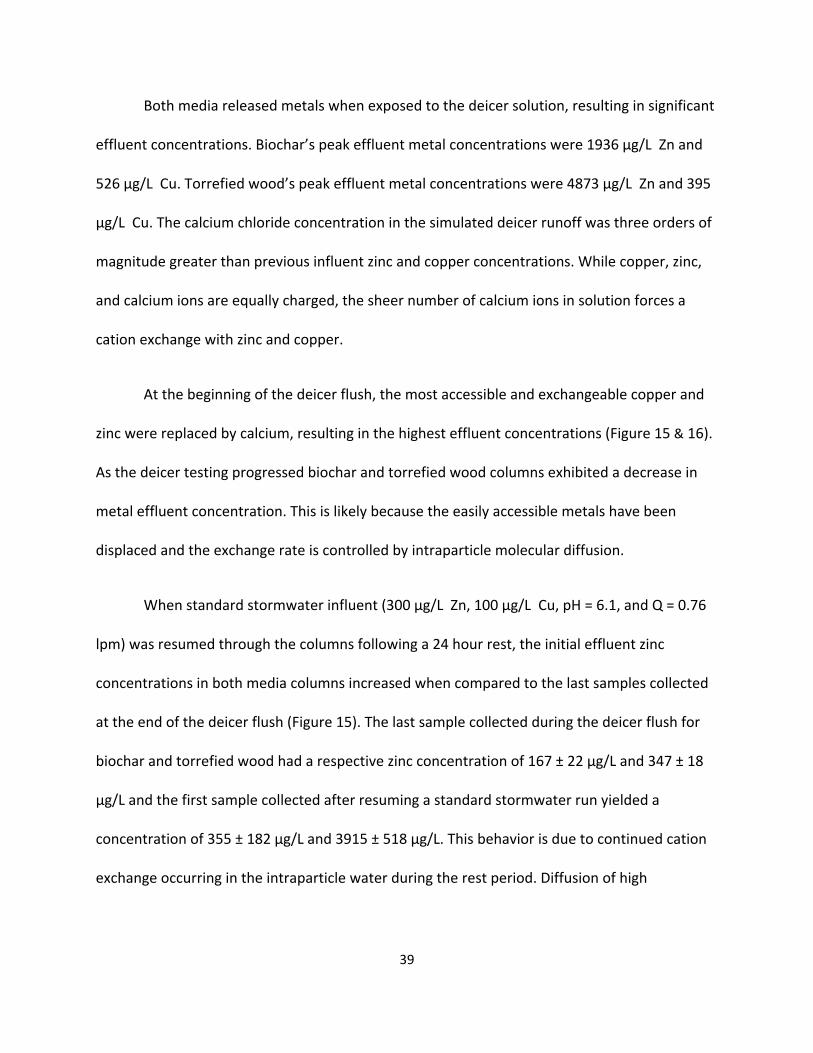
Figure 17. Influent and effluent pH values during and following a deicer flush. Calcium Chloride with Boost™ was used as the anti‐icing agent.
1
10
100
1000
10000
100000
1925 1950 1975 2000 2025 2050
Copper (μg/L)
Cumulative Stormwater Applied per Column (L)
Deicer Flush: Copper Concentration
Influent Biochar Effluent Torr. Wd. Effluent
Standard SW InfluentDe‐Icer Flush
3
4
5
6
7
8
9
1925 1950 1975 2000 2025 2050
pH
Cumulative Stormwater Applied per Column (L)
Deicer Flush: pH
Influent Biochar Effluent Torr. Wd. Effluent
Standard SW InfluentDeicer Flush
39
Both media released metals when exposed to the deicer solution, resulting in significant
effluent concentrations. Biochar’s peak effluent metal concentrations were 1936 μg/L Zn and
526 μg/L Cu. Torrefied wood’s peak effluent metal concentrations were 4873 μg/L Zn and 395
μg/L Cu. The calcium chloride concentration in the simulated deicer runoff was three orders of
magnitude greater than previous influent zinc and copper concentrations. While copper, zinc,
and calcium ions are equally charged, the sheer number of calcium ions in solution forces a
cation exchange with zinc and copper.
At the beginning of the deicer flush, the most accessible and exchangeable copper and
zinc were replaced by calcium, resulting in the highest effluent concentrations (Figure 15 & 16).
As the deicer testing progressed biochar and torrefied wood columns exhibited a decrease in
metal effluent concentration. This is likely because the easily accessible metals have been
displaced and the exchange rate is controlled by intraparticle molecular diffusion.
When standard stormwater influent (300 μg/L Zn, 100 μg/L Cu, pH = 6.1, and Q = 0.76
lpm) was resumed through the columns following a 24 hour rest, the initial effluent zinc
concentrations in both media columns increased when compared to the last samples collected
at the end of the deicer flush (Figure 15). The last sample collected during the deicer flush for
biochar and torrefied wood had a respective zinc concentration of 167 ± 22 μg/L and 347 ± 18
μg/L and the first sample collected after resuming a standard stormwater run yielded a
concentration of 355 ± 182 μg/L and 3915 ± 518 μg/L. This behavior is due to continued cation
exchange occurring in the intraparticle water during the rest period. Diffusion of high
40
concentration calcium into harder to reach sorption sites forced zinc back into solution. When
testing resumed after the rest period the zinc concentration gradient was initially reversed and
zinc moved from the intraparticle water into the interparticle water. The zinc concentration
spike at standard influent initiation was more pronounced in torrefied wood compared to
biochar, likely because torrefied wood has more difficult to reach adsorption sites. This
behavior was not observed for copper (Figure 16).
Torrefied wood columns exhibited a more acidic pH effluent during the salt flush (Figure
17). It’s likely the calcium ions were replacing hydrogen ions from hydroxyl groups along with
previously adsorbed metals. Biochar did not show an effluent pH change from the influent
primarily because the media was already close to metal adsorption capacity and available
carboxyl sites, either in their basic or acid form, were not prevalent enough to affect the pH.
The total mass of metals released during the salt flush for biochar and torrefied wood
columns were 17.5 mg Zn, 8.0 mg Cu and 40.0 mg Zn, 4.2 mg Cu, respectively. When compared
to the total mass of metals sorbed onto the media, the percentage of sorbed metals released
by biochar and torrefied wood were 11% Zn, 10% Cu and 17% Zn, 4% Cu, respectively. The
deicer tests indicate that steps may need to be taken to temporarily divert runoff from entering
field columns if an anti‐icing solution was applied prior to a runoff event. The tests also show
that both biochar and torrefied wood potentially can be regenerated with a high concentration
salt solution. Future tests should be conducted to determine true regeneration potential and
the long‐term effects on the media.
41
3.1.4 Raw wood and Pea Gravel
Based on the significant level of metal removal exhibited by torrefied wood, it was
decided to also test raw wood crumbles. A small volume of pea gravel was used in the media
columns and therefore was also subjected to full column tests. Influent and effluent zinc and
copper concentrations and pH values are shown in Figures 18‐20 for raw wood and pea gravel
columns. Phase I & II biochar and torrefied wood 7‐point moving average trend lines are also
displayed on the graphs for a visual comparison between all four media.
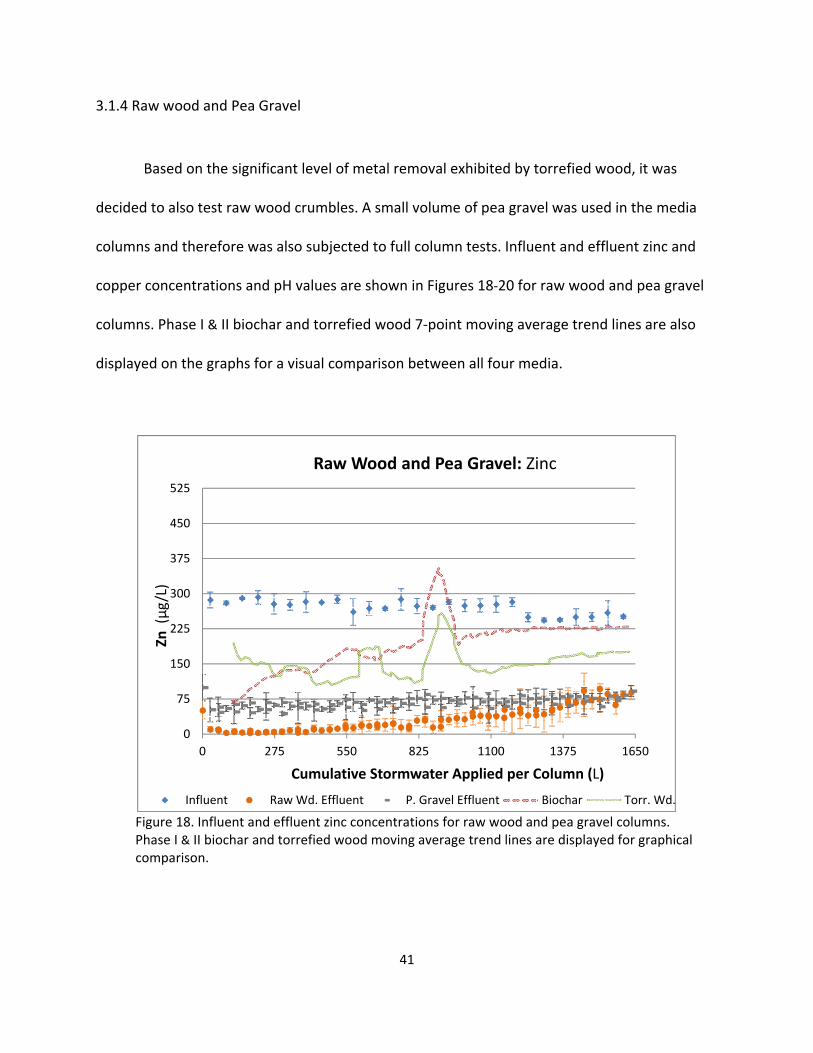
Figure 18. Influent and effluent zinc concentrations for raw wood and pea gravel columns. Phase I & II biochar and torrefied wood moving average trend lines are displayed for graphical comparison.
0
75
150
225
300
375
450
525
0 275 550 825 1100 1375 1650
Zn (μg/L)
Cumulative Stormwater Applied per Column (L)
Raw Wood and Pea Gravel: Zinc
Influent Raw Wd. Effluent P. Gravel Effluent Biochar Torr. Wd.
42
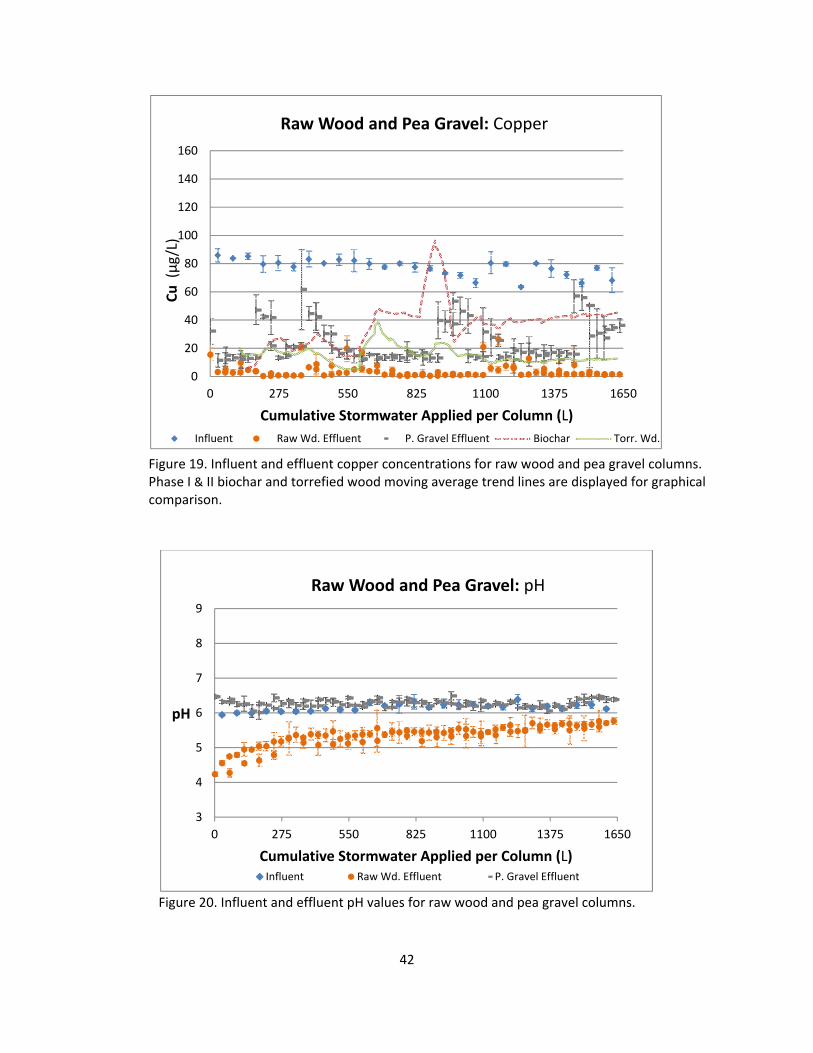
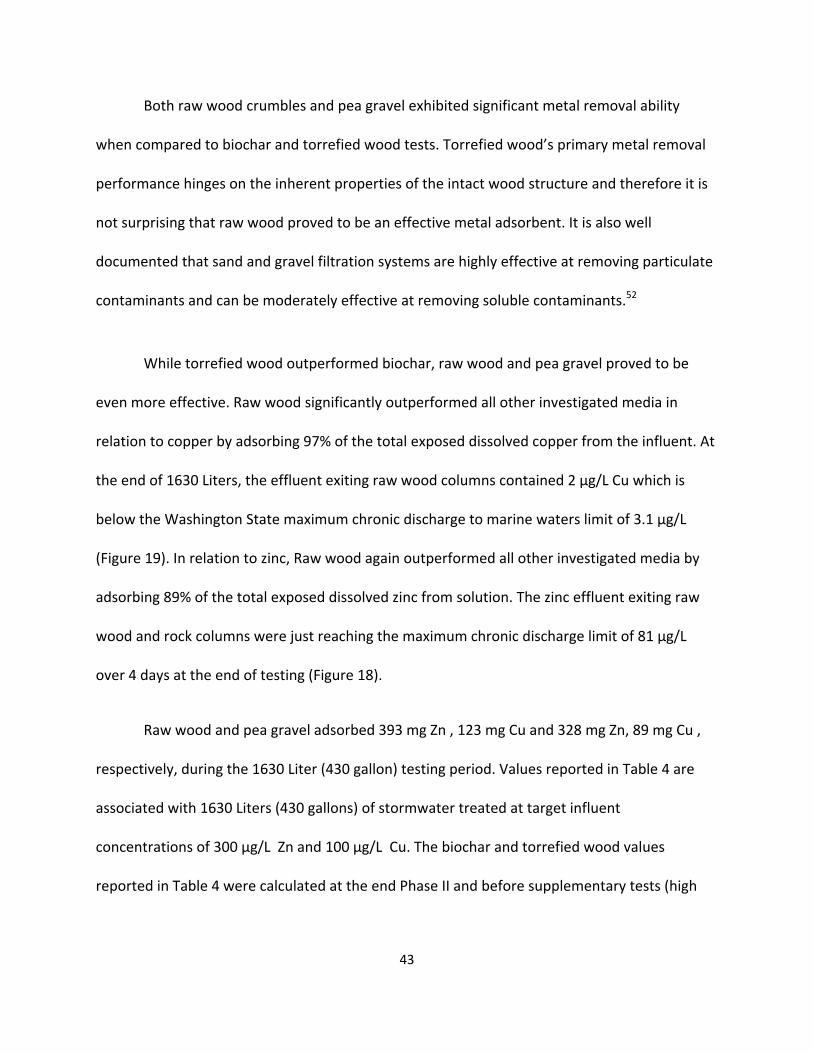
Figure 19. Influent and effluent copper concentrations for raw wood and pea gravel columns. Phase I & II biochar and torrefied wood moving average trend lines are displayed for graphical comparison.
Figure 20. Influent and effluent pH values for raw wood and pea gravel columns.
0
20
40
60
80
100
120
140
160
0 275 550 825 1100 1375 1650
Cu (μg/L)
Cumulative Stormwater Applied per Column (L)
Raw Wood and Pea Gravel: Copper
Influent Raw Wd. Effluent P. Gravel Effluent Biochar Torr. Wd.
3
4
5
6
7
8
9
0 275 550 825 1100 1375 1650
pH
Cumulative Stormwater Applied per Column (L)
Raw Wood and Pea Gravel: pH
Influent Raw Wd. Effluent P. Gravel Effluent
43
Both raw wood crumbles and pea gravel exhibited significant metal removal ability
when compared to biochar and torrefied wood tests. Torrefied wood’s primary metal removal
performance hinges on the inherent properties of the intact wood structure and therefore it is
not surprising that raw wood proved to be an effective metal adsorbent. It is also well
documented that sand and gravel filtration systems are highly effective at removing particulate
contaminants and can be moderately effective at removing soluble contaminants.52
While torrefied wood outperformed biochar, raw wood and pea gravel proved to be
even more effective. Raw wood significantly outperformed all other investigated media in
relation to copper by adsorbing 97% of the total exposed dissolved copper from the influent. At
the end of 1630 Liters, the effluent exiting raw wood columns contained 2 μg/L Cu which is
below the Washington State maximum chronic discharge to marine waters limit of 3.1 μg/L
(Figure 19). In relation to zinc, Raw wood again outperformed all other investigated media by
adsorbing 89% of the total exposed dissolved zinc from solution. The zinc effluent exiting raw
wood and rock columns were just reaching the maximum chronic discharge limit of 81 μg/L
over 4 days at the end of testing (Figure 18).
Raw wood and pea gravel adsorbed 393 mg Zn , 123 mg Cu and 328 mg Zn, 89 mg Cu ,
respectively, during the 1630 Liter (430 gallon) testing period. Values reported in Table 4 are
associated with 1630 Liters (430 gallons) of stormwater treated at target influent
concentrations of 300 μg/L Zn and 100 μg/L Cu. The biochar and torrefied wood values
reported in Table 4 were calculated at the end Phase II and before supplementary tests (high
44
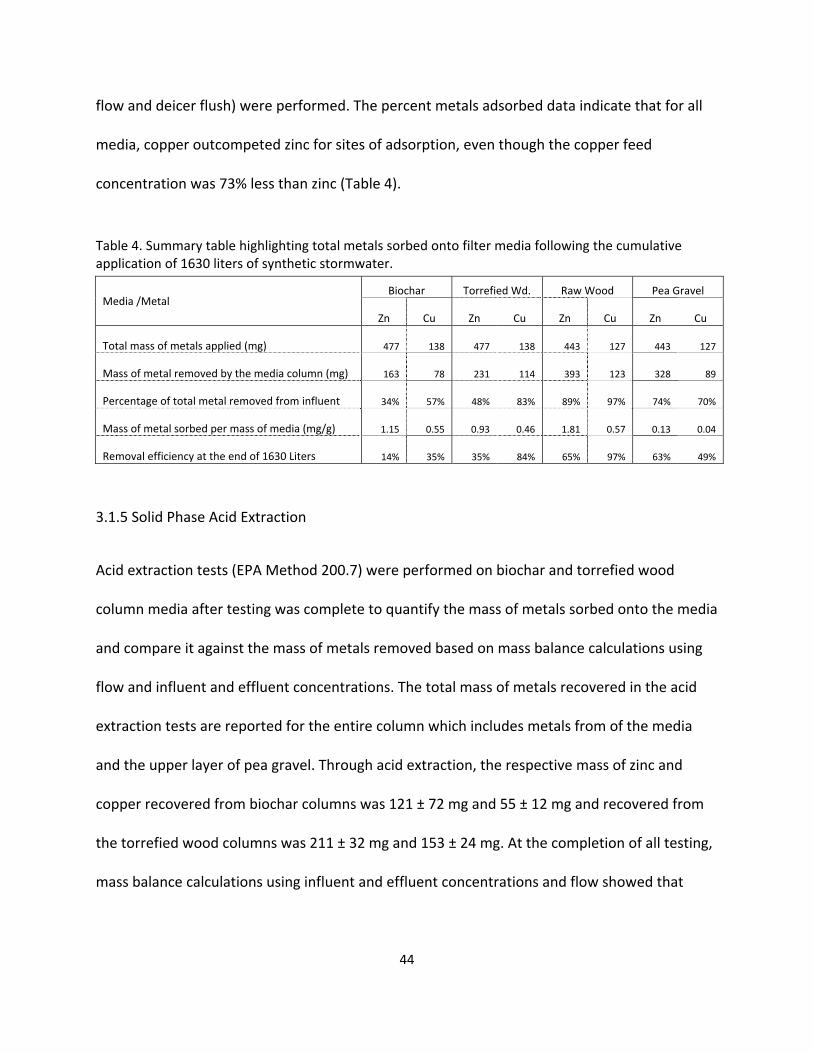
flow and deicer flush) were performed. The percent metals adsorbed data indicate that for all
media, copper outcompeted zinc for sites of adsorption, even though the copper feed
concentration was 73% less than zinc (Table 4).
Table 4. Summary table highlighting total metals sorbed onto filter media following the cumulative application of 1630 liters of synthetic stormwater.
Media /Metal Biochar Torrefied Wd. Raw Wood Pea Gravel
Zn Cu Zn Cu Zn Cu Zn Cu
Total mass of metals applied (mg) 477 138 477 138 443 127 443 127
Mass of metal removed by the media column (mg) 163 78 231 114 393 123 328 89
Percentage of total metal removed from influent 34% 57% 48% 83% 89% 97% 74% 70%
Mass of metal sorbed per mass of media (mg/g) 1.15 0.55 0.93 0.46 1.81 0.57 0.13 0.04
Removal efficiency at the end of 1630 Liters 14% 35% 35% 84% 65% 97% 63% 49%
3.1.5 Solid Phase Acid Extraction
Acid extraction tests (EPA Method 200.7) were performed on biochar and torrefied wood
column media after testing was complete to quantify the mass of metals sorbed onto the media
and compare it against the mass of metals removed based on mass balance calculations using
flow and influent and effluent concentrations. The total mass of metals recovered in the acid
extraction tests are reported for the entire column which includes metals from of the media
and the upper layer of pea gravel. Through acid extraction, the respective mass of zinc and
copper recovered from biochar columns was 121 ± 72 mg and 55 ± 12 mg and recovered from
the torrefied wood columns was 211 ± 32 mg and 153 ± 24 mg. At the completion of all testing,
mass balance calculations using influent and effluent concentrations and flow showed that
45
biochar columns retained 169 mg zinc and 85 mg copper and torrefied wood columns retained
228 mg zinc and 135 mg copper. The percent difference of acid extraction values from mass
balance values for biochar are 28% Zn, 35% Cu and for torrefied wood ‐8% Zn, 12% Cu. A
positive percent difference indicates the acid extraction result was less than the mass balance
calculation, with the opposite being true for a negative value.
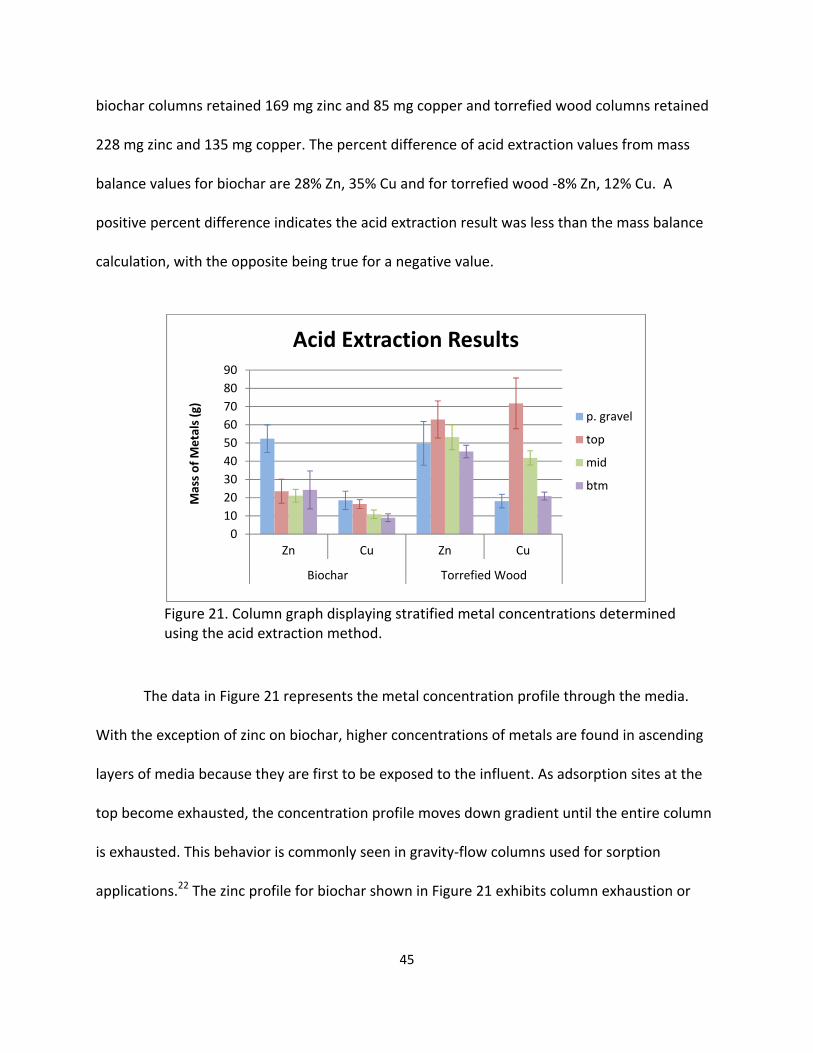
Figure 21. Column graph displaying stratified metal concentrations determined using the acid extraction method.
The data in Figure 21 represents the metal concentration profile through the media.
With the exception of zinc on biochar, higher concentrations of metals are found in ascending
layers of media because they are first to be exposed to the influent. As adsorption sites at the
top become exhausted, the concentration profile moves down gradient until the entire column
is exhausted. This behavior is commonly seen in gravity‐flow columns used for sorption
applications.22 The zinc profile for biochar shown in Figure 21 exhibits column exhaustion or
0
10
20
30
40
50
60
70
80
90
Zn Cu Zn Cu
Biochar Torrefied Wood
Mass of Metals (g)
Acid Extraction Results
p. gravel
top
mid
btm
46
near exhaustion which is consistent with the 14% zinc removal by biochar columns at the end of
testing (Table 4).
When compared to the total mass of metals removed by the columns, the fraction
retained by pea gravel, determined from acid extraction results, was considerable. While only
occupying 20% of the total column media volume, pea gravel respectively adsorbed 43% and
34% of zinc and copper in biochar columns. Still significant, although to a lesser degree, 24%
zinc and 12% copper adsorption was attributed to the pea gravel overlying the torrefied wood
crumbles.
3.2 Field Test
3.2.1 Field Column Results
Three stormwater runoff events were captured by the sampling equipment on August
14th, August 29th, and October 10th (Figure 22). A submersible pump was used inside the
subsurface vault to supply stormwater influent to the field column during the August 14th and
29th events. Clogging of the column occurred as a result of fine particulates being introduced by
the pump which prompted its removal after the Aug. 29th storm event. The top layer of pea
gravel was rinsed clean and permeability through the column was regained.
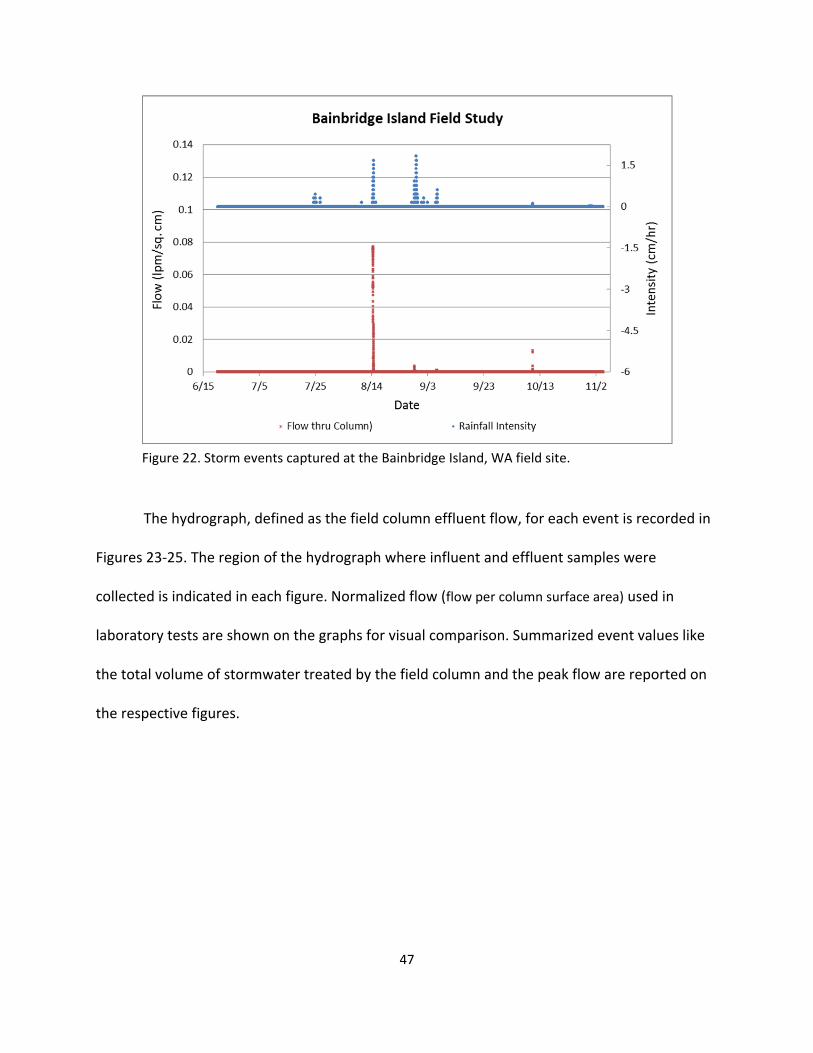
47
Figure 22. Storm events captured at the Bainbridge Island, WA field site.
The hydrograph, defined as the field column effluent flow, for each event is recorded in
Figures 23‐25. The region of the hydrograph where influent and effluent samples were
collected is indicated in each figure. Normalized flow (flow per column surface area) used in
laboratory tests are shown on the graphs for visual comparison. Summarized event values like
the total volume of stormwater treated by the field column and the peak flow are reported on
the respective figures.
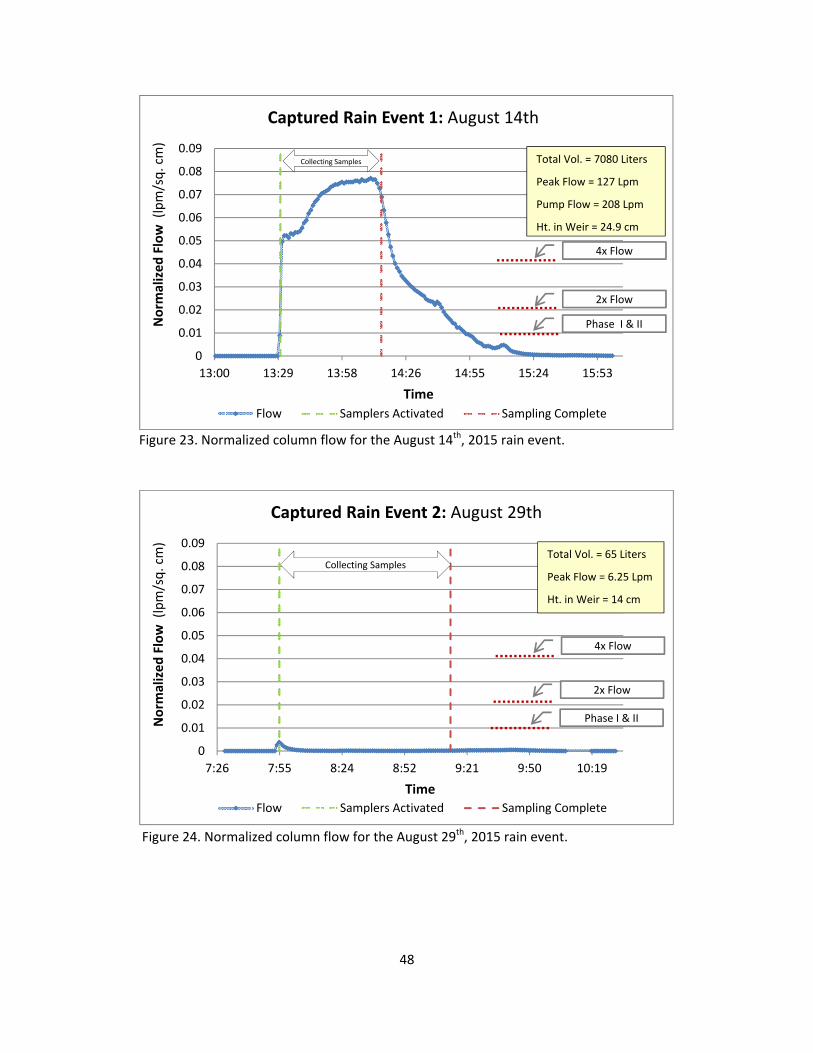
48
Figure 23. Normalized column flow for the August 14th, 2015 rain event.
Figure 24. Normalized column flow for the August 29th, 2015 rain event.
0
0.01
0.02
0.03
0.04
0.05
0.06
0.07
0.08
0.09
13:00 13:29 13:58 14:26 14:55 15:24 15:53
Norm
alized Flow (lpm/sq. cm)
Time
Captured Rain Event 1: August 14th
Flow Samplers Activated Sampling Complete
Collecting Samples Total Vol. = 7080 Liters
Peak Flow = 127 Lpm
Pump Flow = 208 Lpm
Ht. in Weir = 24.9 cm
4x Flow
2x Flow
Phase I & II
0
0.01
0.02
0.03
0.04
0.05
0.06
0.07
0.08
0.09
7:26 7:55 8:24 8:52 9:21 9:50 10:19
Norm
alized Flow (lpm/sq. cm)
Time
Captured Rain Event 2: August 29th
Flow Samplers Activated Sampling Complete
Total Vol. = 65 Liters
Peak Flow = 6.25 Lpm
Ht. in Weir = 14 cm
Phase I & II
2x Flow
Collecting Samples
4x Flow
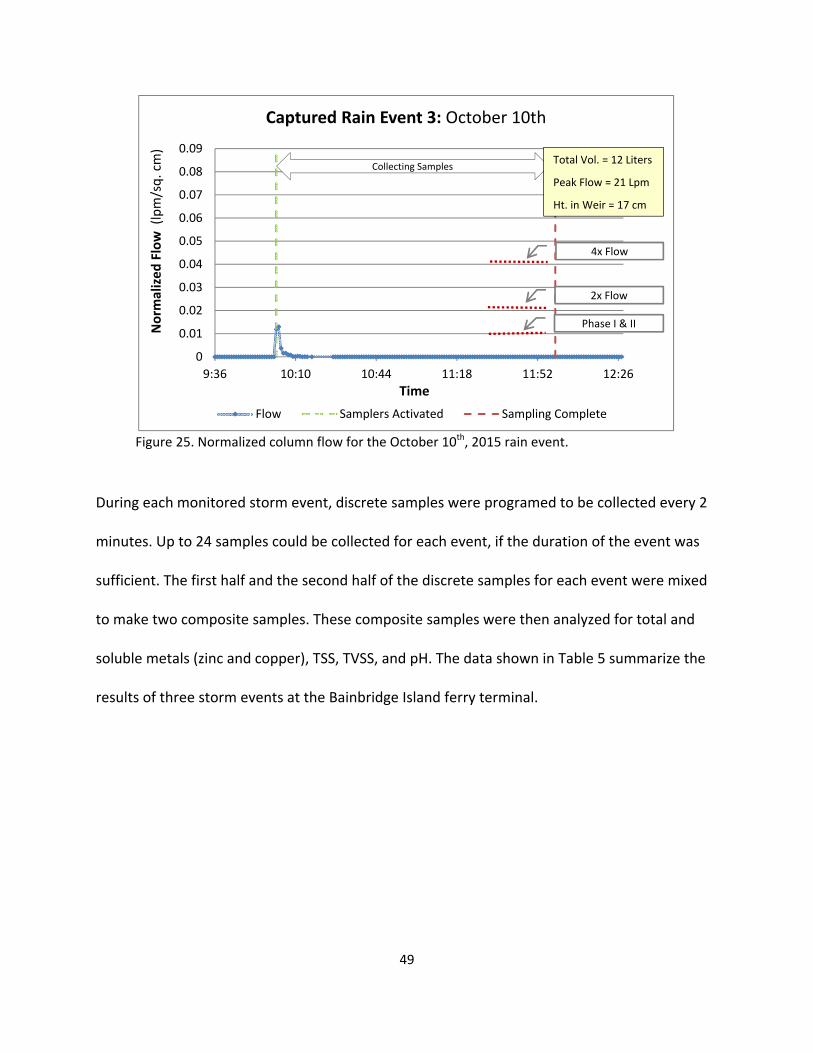
49
Figure 25. Normalized column flow for the October 10th, 2015 rain event.
During each monitored storm event, discrete samples were programed to be collected every 2
minutes. Up to 24 samples could be collected for each event, if the duration of the event was
sufficient. The first half and the second half of the discrete samples for each event were mixed
to make two composite samples. These composite samples were then analyzed for total and
soluble metals (zinc and copper), TSS, TVSS, and pH. The data shown in Table 5 summarize the
results of three storm events at the Bainbridge Island ferry terminal.
0
0.01
0.02
0.03
0.04
0.05
0.06
0.07
0.08
0.09
9:36 10:10 10:44 11:18 11:52 12:26
Norm
alized Flow (lpm/sq. cm)
Time
Captured Rain Event 3: October 10th
Flow Samplers Activated Sampling Complete
Phase I & II
2x Flow
Collecting Samples
4x Flow
Total Vol. = 12 Liters
Peak Flow = 21 Lpm
Ht. in Weir = 17 cm
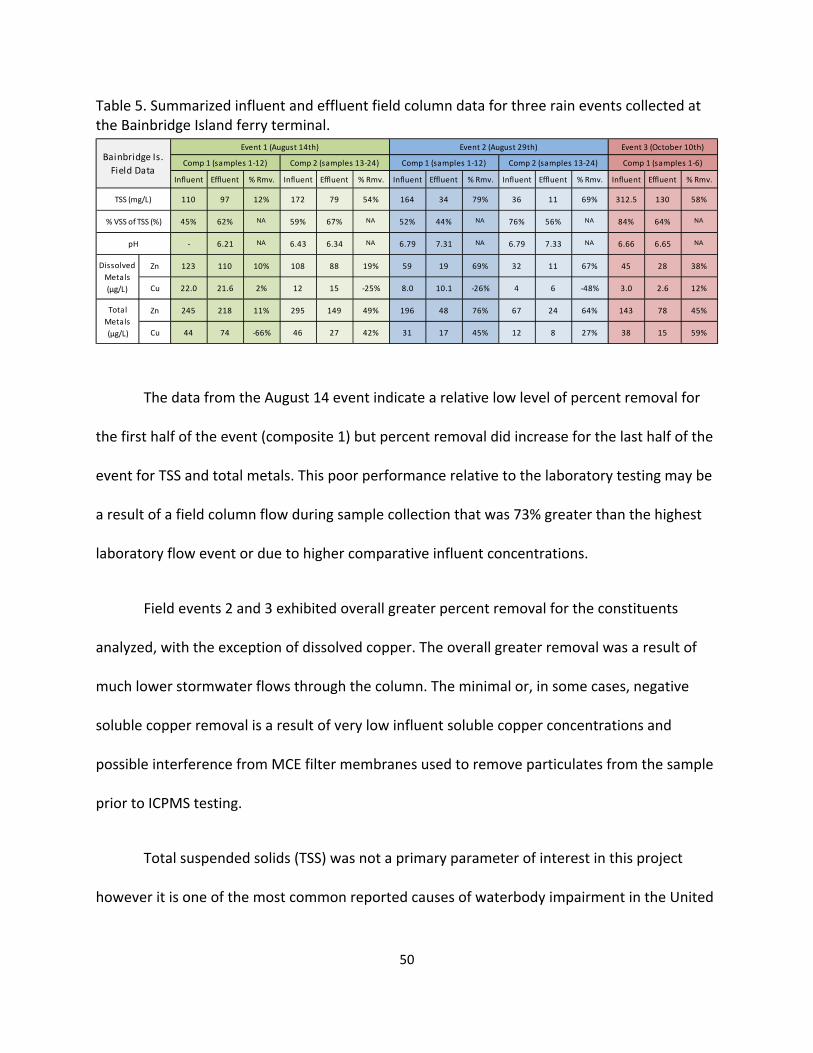
50
Table 5. Summarized influent and effluent field column data for three rain events collected at the Bainbridge Island ferry terminal.
The data from the August 14 event indicate a relative low level of percent removal for
the first half of the event (composite 1) but percent removal did increase for the last half of the
event for TSS and total metals. This poor performance relative to the laboratory testing may be
a result of a field column flow during sample collection that was 73% greater than the highest
laboratory flow event or due to higher comparative influent concentrations.
Field events 2 and 3 exhibited overall greater percent removal for the constituents
analyzed, with the exception of dissolved copper. The overall greater removal was a result of
much lower stormwater flows through the column. The minimal or, in some cases, negative
soluble copper removal is a result of very low influent soluble copper concentrations and
possible interference from MCE filter membranes used to remove particulates from the sample
prior to ICPMS testing.
Total suspended solids (TSS) was not a primary parameter of interest in this project
however it is one of the most common reported causes of waterbody impairment in the United
Influent Effluent % Rmv. Influent Effluent % Rmv. Influent Effluent % Rmv. Influent Effluent % Rmv. Influent Effluent % Rmv.
110 97 12% 172 79 54% 164 34 79% 36 11 69% 312.5 130 58%
45% 62% NA 59% 67% NA 52% 44% NA 76% 56% NA 84% 64% NA
‐ 6.21 NA 6.43 6.34 NA 6.79 7.31 NA 6.79 7.33 NA 6.66 6.65 NA
Zn 123 110 10% 108 88 19% 59 19 69% 32 11 67% 45 28 38%
Cu 22.0 21.6 2% 12 15 ‐25% 8.0 10.1 ‐26% 4 6 ‐48% 3.0 2.6 12%
Zn 245 218 11% 295 149 49% 196 48 76% 67 24 64% 143 78 45%
Cu 44 74 ‐66% 46 27 42% 31 17 45% 12 8 27% 38 15 59%
Event 1 (August 14th) Event 2 (August 29th)
Comp 1 (samples 1‐12) Comp 2 (samples 13‐24) Comp 1 (samples 1‐12) Comp 2 (samples 13‐24) Comp 1 (samples 1‐6)
Event 3 (October 10th)
Total
Metals
(μg/L)
Dissolved
Metals
(μg/L)
pH
Bainbridge Is.
Field Data
TSS (mg/L)
% VSS of TSS (%)
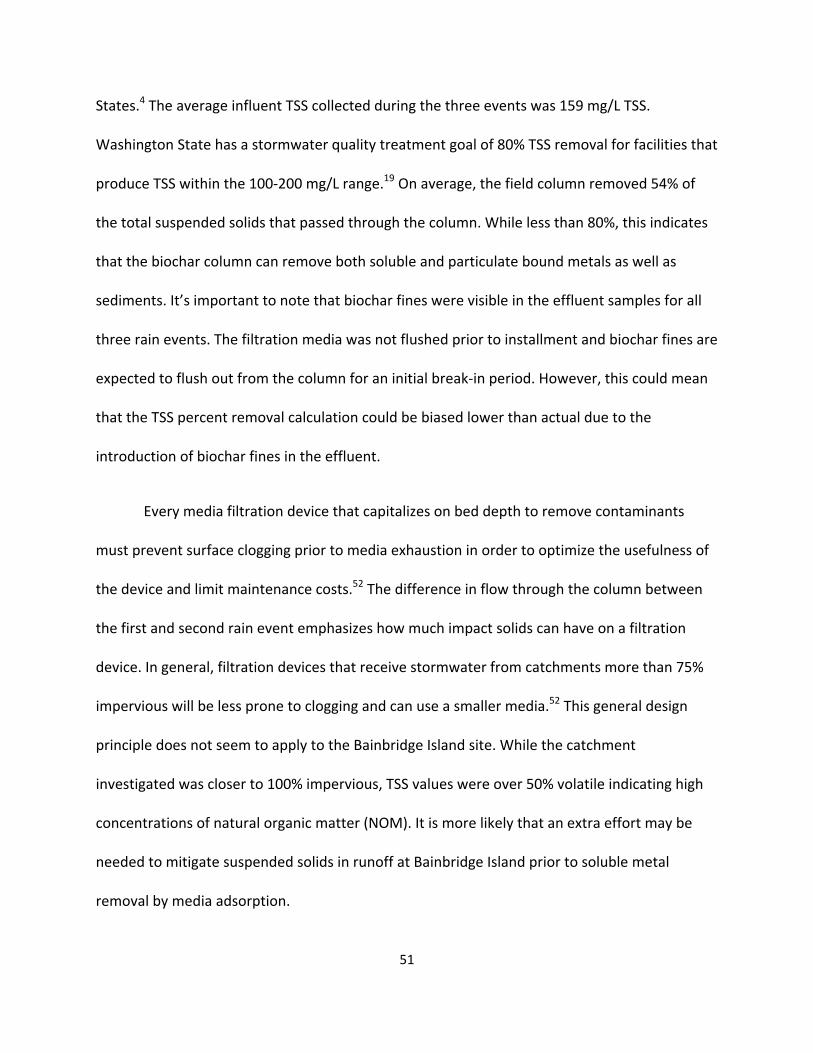
51
States.4 The average influent TSS collected during the three events was 159 mg/L TSS.
Washington State has a stormwater quality treatment goal of 80% TSS removal for facilities that
produce TSS within the 100‐200 mg/L range.19 On average, the field column removed 54% of
the total suspended solids that passed through the column. While less than 80%, this indicates
that the biochar column can remove both soluble and particulate bound metals as well as
sediments. It’s important to note that biochar fines were visible in the effluent samples for all
three rain events. The filtration media was not flushed prior to installment and biochar fines are
expected to flush out from the column for an initial break‐in period. However, this could mean
that the TSS percent removal calculation could be biased lower than actual due to the
introduction of biochar fines in the effluent.
Every media filtration device that capitalizes on bed depth to remove contaminants
must prevent surface clogging prior to media exhaustion in order to optimize the usefulness of
the device and limit maintenance costs.52 The difference in flow through the column between
the first and second rain event emphasizes how much impact solids can have on a filtration
device. In general, filtration devices that receive stormwater from catchments more than 75%
impervious will be less prone to clogging and can use a smaller media.52 This general design
principle does not seem to apply to the Bainbridge Island site. While the catchment
investigated was closer to 100% impervious, TSS values were over 50% volatile indicating high
concentrations of natural organic matter (NOM). It is more likely that an extra effort may be
needed to mitigate suspended solids in runoff at Bainbridge Island prior to soluble metal
removal by media adsorption.
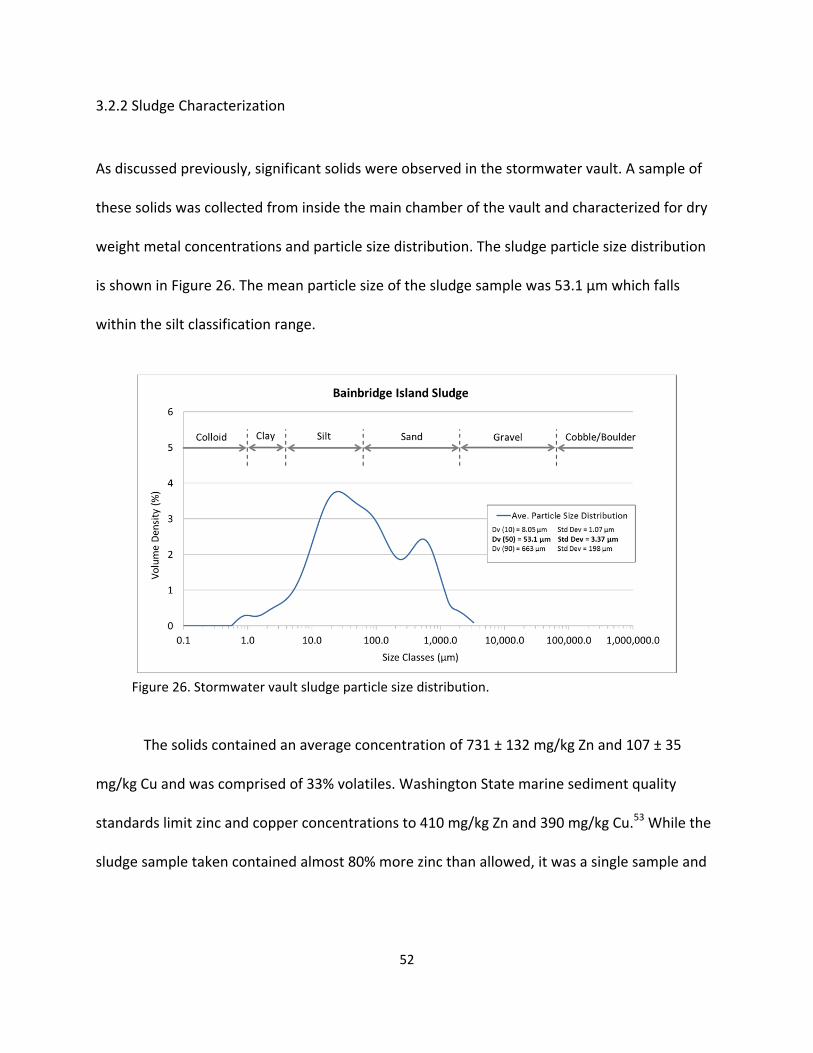
52
3.2.2 Sludge Characterization
As discussed previously, significant solids were observed in the stormwater vault. A sample of
these solids was collected from inside the main chamber of the vault and characterized for dry
weight metal concentrations and particle size distribution. The sludge particle size distribution
is shown in Figure 26. The mean particle size of the sludge sample was 53.1 μm which falls
within the silt classification range.
Figure 26. Stormwater vault sludge particle size distribution.
The solids contained an average concentration of 731 ± 132 mg/kg Zn and 107 ± 35
mg/kg Cu and was comprised of 33% volatiles. Washington State marine sediment quality
standards limit zinc and copper concentrations to 410 mg/kg Zn and 390 mg/kg Cu.53 While the
sludge sample taken contained almost 80% more zinc than allowed, it was a single sample and
53
several more tests should be performed to determine a more seasonally or annually
representative mean.
4. CONCLUSIONS
The purpose of this project was to determine the applicability of biochar and torrefied
wood serving as gravity fed column filter media to adsorb soluble zinc and copper from urban
stormwater. Torrefied wood out performed biochar by adsorbing 26% more copper and 14%
more zinc in laboratory column tests. However, non‐torrefied wood (raw wood) columns
outperformed all other media evaluated by adsorbing 97% of total exposed dissolved copper
and 89% of total exposed dissolved zinc. Peak sorption performance for torrefied wood and raw
wood was not realized until the media was hydrated past the fiber saturation point allowing
metals to diffuse more readily into the wood cellular structure. Even though torrefaction was
shown to increase metal bonding surface functional groups from hemicellulose degradation, it
proved to be insignificant when compared to preserved intercellular adsorption sites attributed
to the intact hemicellulose fraction of raw wood.
As in previous studies, pH proved to be a significant factor for metal adsorption and
retention onto the sorbents. Torrefied wood showed greater resilience to pH fluctuation than
biochar. Raw wood and pea gravel were not tested for pH sensitivity, however, it is likely that
raw wood will exhibit the same resilience to pH based on similar characteristics with torrefied
wood.

54
Flow rate had no effect on metal effluent concentration in laboratory tests. This is
promising for stormwater applications where flow rates can vary widely. The deicer flush
through the media resulted in a significant increase in effluent metal concentrations due to the
displacement of zinc and copper by calcium. While only a relatively small percentage of the
total metals sorbed were released, both media resumed zinc and copper adsorption after the
salt flush, indicating media regeneration may be possible.
Moving forward, laboratory tests revealed raw wood to be the most effective metal
adsorbent. However, leachate from wood can result in increased stormwater biochemical
oxygen demand (BOD5) and acidity.54 BOD5 and pH are both regulated parameters for
stormwater discharge.1 A decrease in raw wood effluent pH was observed during column tests
and the degree of pH impact relative to metal removal should be evaluated. Effluent BOD5 from
laboratory columns should be measured to ensure lower effluent metal concentrations are not
simply being traded for higher than regulation BOD5. Likely, these parameters will not disqualify
raw wood from application rather they will determine where a raw wood media filter would be
applicable. Additionally, high flow tests should be performed on virgin material and a deicer salt
flush should be conducted on raw wood to complete the investigation. The possibility of media
regeneration was presented during testing and should be further investigated for economic and
practical feasibility.
Biochar was used as the filter media in the Bainbridge Island field column. Averaging
across the three rain events captured, the field column removed 41% soluble zinc, ‐17% soluble
55
copper, and 54% TSS. Soluble copper concentrations in the runoff were very low and it is
suspected that interference from sample filtering (prior to ICPMS analysis) had a significant
influence on the readings. Sludge taken from inside the stormwater vault contained higher than
allowable concentrations of zinc. Additional sludge tests should be conducted over time to
better define an average sediment metal concentration.
Biochar in the field column should be replaced with raw wood and more field tests
should be conducted to evaluate field performance of the media. The field design proved to be
successful as a whole, however, the pump caused the column to clog and should not be used
again.
56
5. WORKS CITED
(1) National Research Council. Urban Stormwater Management in the United States; The National Academies Press: Washington DC, 2009.
(2) National Water Quality Inventory: Report to Congress. 2004 Reporting Cycle.; EPA 841‐R‐08‐001; United States Environmental Protection Agency: Washington, DC, 2009.
(3) Burton, G. Allen Jr.; Pitt, Robert E. Stormwater effects handbook: a toolbox for watershed managers, scientists, and engineers; CRC Press, 2001.
(4) Summaries of Water Pollution Reporting Categories; EPA841‐R‐12‐104; United States Environmental Protection Agency, 2012.
(5) Barbosa, A. E.; Fernandes, J. N.; David, L. M. Key issues for sustainable urban stormwater management. Water Research 2012, 46 (20), 6787–6798 DOI: 10.1016/j.watres.2012.05.029.
(6) National Recommended Water Quality Criteria: 2002; EPA‐822‐R‐02‐047; United States Environmental Protection Agency, 2002.
(7) Brooks, K. M.; Mahnken, C. V. W. Interactions of Atlantic salmon in the Pacific Northwest environment: III. Accumulation of zinc and copper. Fisheries Research 2003, 62 (3), 295–305 DOI: 10.1016/S0165‐7836(03)00065‐1.
(8) Reducing copper in industrial stormwater; Fact sheet; State of Oregon Department of Environmental Quality, 2014.
(9) Reducing Zinc in industrial stormwater; Fact sheet; Department of Environmental Quality: The State of Oregon, 2014.
(10) Endangered and threatened marine species under NMFS’ jurisdiction http://www.nmfs.noaa.gov/pr/species/esa/listed.htm#fish (accessed Oct 4, 2015).
(11) Wilson, M. F.; Halupka, K. C. Anadromous fish as keystone species in vertebrate communities. Conservation Biology 1995, 9 (3), 489–497.
(12) Mahrosh, U.; Kleiven, M.; Meland, S.; Rosseland, B. O.; Salbu, B.; Teien, H.‐C. Toxicity of road deicing salt (NaCl) and copper (Cu) to fertilization and early developmental stages of Atlantic salmon (Salmo salar). Journal of Hazardous Materials 2014, 280, 331–339 DOI: 10.1016/j.jhazmat.2014.07.076.
(13) Skidmore, J. F. Toxicity of zinc compounds to aquatic animals, with special reference to fish. The Quaterly Review of Biology 1964, 39 (3), 227–248.
57
(14) The dictionary of substances and their effects: t‐z and index, Second.; Gangolli, S., Ed.; Royal Society of Chemistry, 1999.
(15) United States Environmental Protection Agency. Environmental toxicity data for tri‐listed chemicals http://www2.epa.gov/toxics‐release‐inventory‐tri‐program/environmental‐toxicity‐data‐tri‐listed‐chemicals (accessed Oct 18, 2015).
(16) Davis, A. P.; Shokouhian, M.; Ni, S. Loading estimates of lead, copper, cadmium, and zinc in urban runoff from specific sources. Chemosphere 2001, 44 (5), 997–1009 DOI: 10.1016/S0045‐6535(00)00561‐0.
(17) Golding, S. Suggested practices to reduce zinc concentrations in industrial stormwater discharges; Water Quality Program 08‐10‐025; Department of Ecology: The State of Washington, 2008.
(18) Harrison, F. L.; Knezovich, J. P.; Rice Jr., D. W.; Lam, J. R. Distribution, fate and effects of energy‐related residuals in marine environments.; DOE/ER‐0317; USDOE Office of Energy Research, Washington, DC. Ecological Research Div., 1987; pp 251–258.
(19) Stormwater management manual for Western Washington: Amended December 2014.; WADOE 14‐10‐055; Department of Ecology: The State of Washington, 2014.
(20) Reynolds, T. D.; Richards, P. Unit Operations and Processes in Environmental engineering, 2nd ed.; CL Engineering, 1995.
(21) Crittenden, J. C.; Hand, D. W.; Howe, K. J.; Trussell, R. R.; Tchobanoglous, G. MWH’s water treatment: Principles and design, 3rd ed.; John Wiley & Sons, 2012.
(22) Watts, R. J. Hazardous wastes: Sources, pathways, receptors, 1st ed.; John Wiley & Sons, 1998.
(23) Nartey, O. D.; Zhao, B.; Nartey, O. D.; Zhao, B. Biochar preparation, characterization, and adsorptive capacity and its effect on bioavailability of contaminants: an overview, biochar preparation, characterization, and adsorptive capacity and its effect on bioavailability of contaminants: An overview. Advances in Materials Science and Engineering 2014, 2014, 12 DOI: 10.1155/2014/715398.
(24) Chen, J. P.; Wang, X. Removing copper, zinc, and lead ion by granular activated carbon in pretreated fixed‐bed columns. Separation and Purification Technology 2000, 19 (3), 157–167 DOI: 10.1016/S1383‐5866(99)00069‐6.
(25) Chen, X.; Chen, G.; Chen, L.; Chen, Y.; Lehmann, J.; McBride, M. B.; Hay, A. G. Adsorption of copper and zinc by biochars produced from pyrolysis of hardwood and corn straw in aqueous solution. Bioresource Technology 2011, 102 (19), 8877–8884 DOI: 10.1016/j.biortech.2011.06.078.
(26) Demirbas, A. Heavy metal adsorption onto agro‐based waste materials: A review. Journal of Hazardous Materials 2008, 157 (2–3), 220–229 DOI: 10.1016/j.jhazmat.2008.01.024.
58
(27) Yonge, D.; Roelen, P. An evaluation of stormwater permeable rapid infiltration barriers for use in class V stormwater injection wells; Research Report WA‐RD 559.1; Washington State Department of Transportation: Washington State University, Pullman, WA, 2003.
(28) Mohan, D.; Sarswat, A.; Ok, Y. S.; Pittman Jr., C. U. Organic and inorganic contaminants removal from water with biochar, a renewable, low cost and sustainable adsorbent – A critical review. Bioresource Technology 2014, 160, 191–202 DOI: 10.1016/j.biortech.2014.01.120.
(29) Mohan, D.; Pittman, Charles U.; Steele, P. H. Pyrolysis of Wood/Biomass for Bio‐oil: A Critical Review. Energy Fuels 2006, 20 (3), 848–889 DOI: 10.1021/ef0502397.
(30) Thea Whitman. What is Biochar? Soil Science, Microbiology, and Biogeochemistry.
(31) Smith, J. Assessing copper and zinc adsorption to thermally treated lignocellulosic biomass. M.S., Washington State University: Pullman, WA, 2015.
(32) Jung, C.; Park, J.; Lim, K. H.; Park, S.; Heo, J.; Her, N.; Oh, J.; Yun, S.; Yoon, Y. Adsorption of selected endocrine disrupting compounds and pharmaceuticals on activated biochars. Journal of Hazardous Materials 2013, 263, Part 2, 702–710 DOI: 10.1016/j.jhazmat.2013.10.033.
(33) Mohanty, S. K.; Cantrell, K. B.; Nelson, K. L.; Boehm, A. B. Efficacy of biochar to remove Escherichia coli from stormwater under steady and intermittent flow. Water Research 2014, 61, 288–296 DOI: 10.1016/j.watres.2014.05.026.
(34) Sarvaramini, A.; Assima, G. P.; Larachi, F. Dry torrefaction of biomass – Torrefied products and torrefaction kinetics using the distributed activation energy model. Chemical Engineering Journal 2013, 229, 498–507 DOI: 10.1016/j.cej.2013.06.056.
(35) Prins, M. J.; Ptasinski, K. J.; Janssen, F. J. J. G. Torrefaction of wood: Part 2. Analysis of products. Journal of Analytical and Applied Pyrolysis 2006, 77 (1), 35–40 DOI: 10.1016/j.jaap.2006.01.001.
(36) Hubbe, M. A. New Horizons for Use of Cellulose‐Based Materials to Adsorb Pollutants from Aqueous Solutions. Lignocellulose Journal 2013, 2 (2), 386–411.
(37) H7 Solutions. About Biochar Products http://www.biocharproducts.com/about‐biochar‐products.html (accessed Sep 16, 2015).
(38) Dumroese, D.; Englund, K.; Smith, J. Biochar Origins, 2015.
(39) Lanning, D. N.; Dooley, J. H.; Lanning, C. J. Low‐energy comminution of woody biomass to create precision feedstock particles; 12‐1337409; ASABE: Dallas, Texas, 2012.
(40) Martin, T. D.; Brockhoff, C. A.; Creed, J. T.; EMMC Methods Work Group. Determination of metals and trace elements in water and wastes by inductively coupled plasma‐atomic emission spectrometry; Standard Method 200.7; Environmental Monitoring Systems Laboratory, Office of Research and Development, U.S. Environmental Protection Agency: Cincinnati, OH, 1994.
59
(41) Lytle, D.; Kelty, K.; Pham, M.; Schaub, M. A systematic evaluation of dissolved metals loss during water sample filtration; Science in Action; Research Report EPA 600/F‐11/029b; USEPA: Office of Research and Development: EPA Region 6, 2014; p 2.
(42) U.S. Environmental Protection Agency. Total, fixed, and volatile solids in water, solids, and biosolids; Method 1684; USEPA: Washington, DC, 2001.
(43) Washington State Department of Transportation. Statewide snow and ice plan. 2014‐2015.
(44) Boost with Calcium Chloride http://www.caclwithboost.com/home.html (accessed Oct 18, 2015).
(45) Hand, J. Calcium Chloride with Boost, 2015.
(46) America West. Material safety data sheet: Calcium chloride with boost. July 25, 2006.
(47) Mays, L. W. Water resources engineering; John Wiley & Sons, 2010.
(48) Water measurement manual; Technical Publication; U.S. Department of the Interior Bureau of Reclamation: Washington, DC, 2001.
(49) Reeb, J. E. Wood and moisture relationships; Catalog EM 8600; Oregon State University, 1995; p 7.
(50) Engelund, E. T.; Thygesen, L. G.; Svensson, S.; Hill, C. A. S. A critical discussion of the physics of wood–water interactions. Wood Science Technology 2013, No. 47, 141–161 DOI: 10.1007/s00226‐012‐0514‐7.
(51) Fengel, D. Wood: chemistry, ultrastructure, reactions; Walter de Gruyter, 2011.
(52) Claytor, R. A.; Schueler, T. R. Design of stormwater filtering systems; Design Manual; The Center for Watershed Protection: Ellicott City, MD, 1996.
(53) Sediment management standards; WAC 173‐204‐320; Department of Ecology: Washington State, 2013.
(54) Washington State Department of Ecology. Industrial stormwater general permit implementation manual for log yards; Water Quality Program; Manual 04‐10‐031; Olympia, WA, 2004.
(55) Lambe, T. W.; Whitman, R. V. Soil mechanics; Series in soil engineering; John Wiley & Sons: New York, 1969.
(56) Bear, J. Dynamics of Fluids in Porous Media; Courier Corporation, 2013.
(57) Herrera Environmental Consultants Inc. Untreated highway runoff in Western Washington; White Paper wp4 /06‐03427‐004; Washington State Department of Transportation: Seattle, Washington, 2007; p 66.
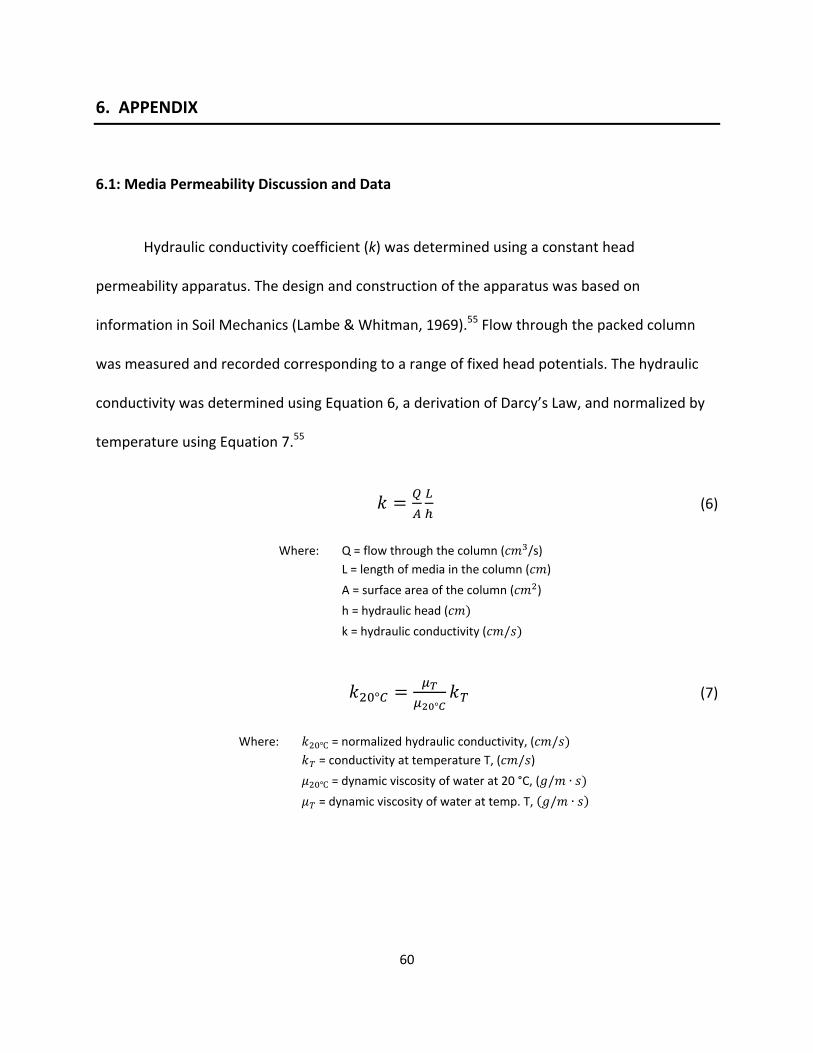
60
6. APPENDIX
6.1: Media Permeability Discussion and Data
Hydraulic conductivity coefficient (k) was determined using a constant head
permeability apparatus. The design and construction of the apparatus was based on
information in Soil Mechanics (Lambe & Whitman, 1969).55 Flow through the packed column
was measured and recorded corresponding to a range of fixed head potentials. The hydraulic
conductivity was determined using Equation 6, a derivation of Darcy’s Law, and normalized by
temperature using Equation 7.55
(6)
°°
(7)
Where: Q = flow through the column ( /s)
L = length of media in the column ( )
A = surface area of the column ( )
h = hydraulic head (
k = hydraulic conductivity ( /
Where: = normalized hydraulic conductivity, ( / = conductivity at temperature T, ( / )
= dynamic viscosity of water at 20 °C, ( / ∙
= dynamic viscosity of water at temp. T, / ∙
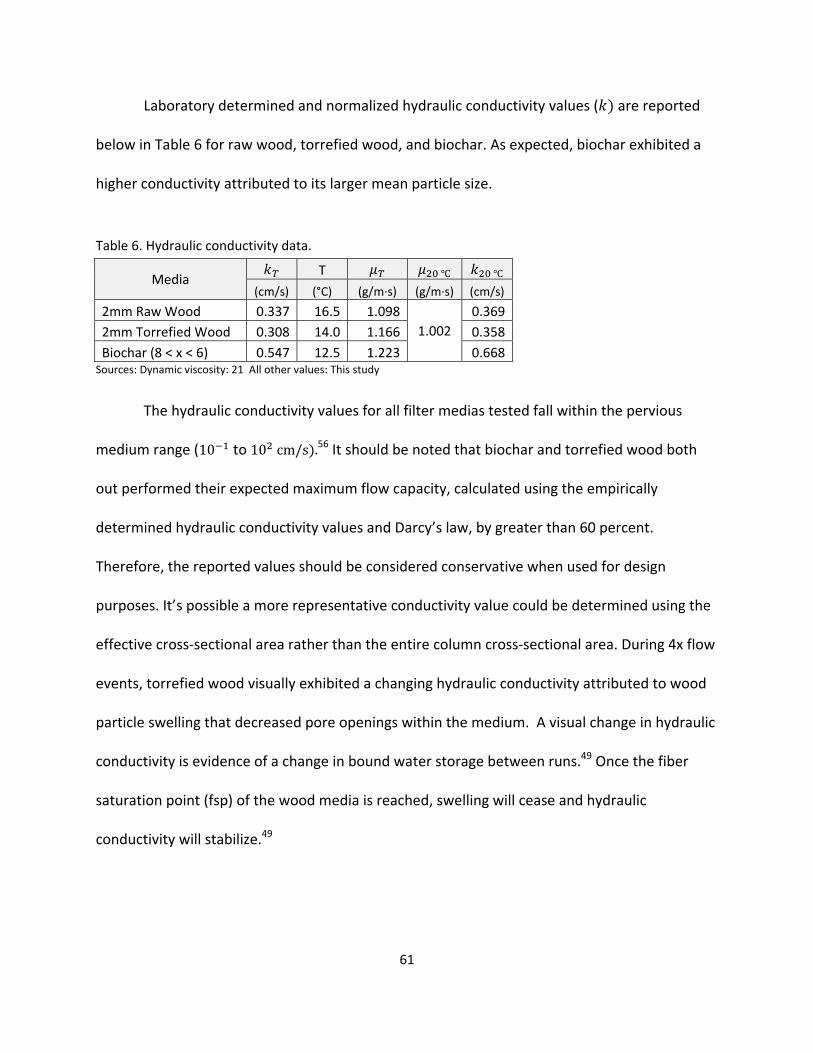
61
Laboratory determined and normalized hydraulic conductivity values ( are reported
below in Table 6 for raw wood, torrefied wood, and biochar. As expected, biochar exhibited a
higher conductivity attributed to its larger mean particle size.
Table 6. Hydraulic conductivity data.
Media T
(cm/s) (°C) (g/m∙s) (g/m∙s) (cm/s)
2mm Raw Wood 0.337 16.5 1.098
1.002
0.369
2mm Torrefied Wood 0.308 14.0 1.166 0.358
Biochar (8 < x < 6) 0.547 12.5 1.223 0.668Sources: Dynamic viscosity: 21 All other values: This study
The hydraulic conductivity values for all filter medias tested fall within the pervious
medium range (10 to 10 cm/s .56 It should be noted that biochar and torrefied wood both
out performed their expected maximum flow capacity, calculated using the empirically
determined hydraulic conductivity values and Darcy’s law, by greater than 60 percent.
Therefore, the reported values should be considered conservative when used for design
purposes. It’s possible a more representative conductivity value could be determined using the
effective cross‐sectional area rather than the entire column cross‐sectional area. During 4x flow
events, torrefied wood visually exhibited a changing hydraulic conductivity attributed to wood
particle swelling that decreased pore openings within the medium. A visual change in hydraulic
conductivity is evidence of a change in bound water storage between runs.49 Once the fiber
saturation point (fsp) of the wood media is reached, swelling will cease and hydraulic
conductivity will stabilize.49
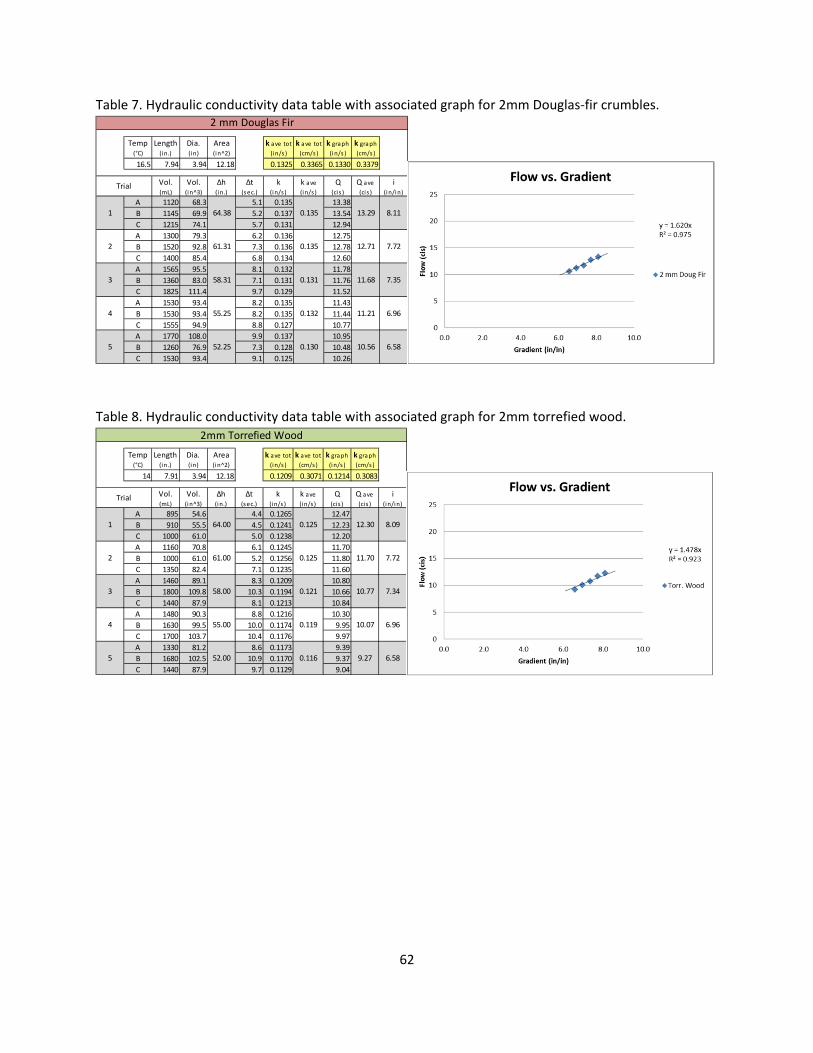
62
Table 7. Hydraulic conductivity data table with associated graph for 2mm Douglas‐fir crumbles.
Table 8. Hydraulic conductivity data table with associated graph for 2mm torrefied wood.
Temp (°C)
Length (in.)
Dia. (in)
Area (in^2)
k ave tot (in/s )
k ave tot (cm/s)
k graph (in/s )
k graph
(cm/s)
16.5 7.94 3.94 12.18 0.1325 0.3365 0.1330 0.3379
Vol. (mL)
Vol. (in^3)
Δh (in.)
Δt (sec.)
k (in/s )
k ave (in/s )
Q (ci s )
Q ave (ci s )
i (in/in)
A 1120 68.3 5.1 0.135 13.38
B 1145 69.9 5.2 0.137 13.54
C 1215 74.1 5.7 0.131 12.94
A 1300 79.3 6.2 0.136 12.75
B 1520 92.8 7.3 0.136 12.78
C 1400 85.4 6.8 0.134 12.60
A 1565 95.5 8.1 0.132 11.78
B 1360 83.0 7.1 0.131 11.76
C 1825 111.4 9.7 0.129 11.52
A 1530 93.4 8.2 0.135 11.43
B 1530 93.4 8.2 0.135 11.44
C 1555 94.9 8.8 0.127 10.77
A 1770 108.0 9.9 0.137 10.95
B 1260 76.9 7.3 0.128 10.48
C 1530 93.4 9.1 0.125 10.26
5 52.25 0.130 10.56 6.58
3 58.31 0.131 11.68 7.35
4 55.25 0.132 11.21 6.96
2 mm Douglas Fir
Trial
1 64.38 0.135 13.29 8.11
2 61.31 0.135 12.71 7.72
Temp (°C)
Length (in.)
Dia. (in)
Area (in^2)
k ave tot (in/s )
k ave tot (cm/s )
k graph (in/s )
k graph
(cm/s )
14 7.91 3.94 12.18 0.1209 0.3071 0.1214 0.3083
Vol. (mL)
Vol. (in^3)
Δh (in.)
Δt (sec.)
k (in/s )
k ave (in/s )
Q (ci s )
Q ave (ci s )
i (in/in)
A 895 54.6 4.4 0.1265 12.47
B 910 55.5 4.5 0.1241 12.23
C 1000 61.0 5.0 0.1238 12.20
A 1160 70.8 6.1 0.1245 11.70
B 1000 61.0 5.2 0.1256 11.80
C 1350 82.4 7.1 0.1235 11.60
A 1460 89.1 8.3 0.1209 10.80
B 1800 109.8 10.3 0.1194 10.66
C 1440 87.9 8.1 0.1213 10.84
A 1480 90.3 8.8 0.1216 10.30
B 1630 99.5 10.0 0.1174 9.95
C 1700 103.7 10.4 0.1176 9.97
A 1330 81.2 8.6 0.1173 9.39
B 1680 102.5 10.9 0.1170 9.37
C 1440 87.9 9.7 0.1129 9.04
2mm Torrefied Wood
Trial
1 64.00 0.125 12.30 8.09
2 61.00 0.125 11.70 7.72
5 52.00 0.116 9.27 6.58
3 58.00 0.121 10.77 7.34
4 55.00 0.119 10.07 6.96
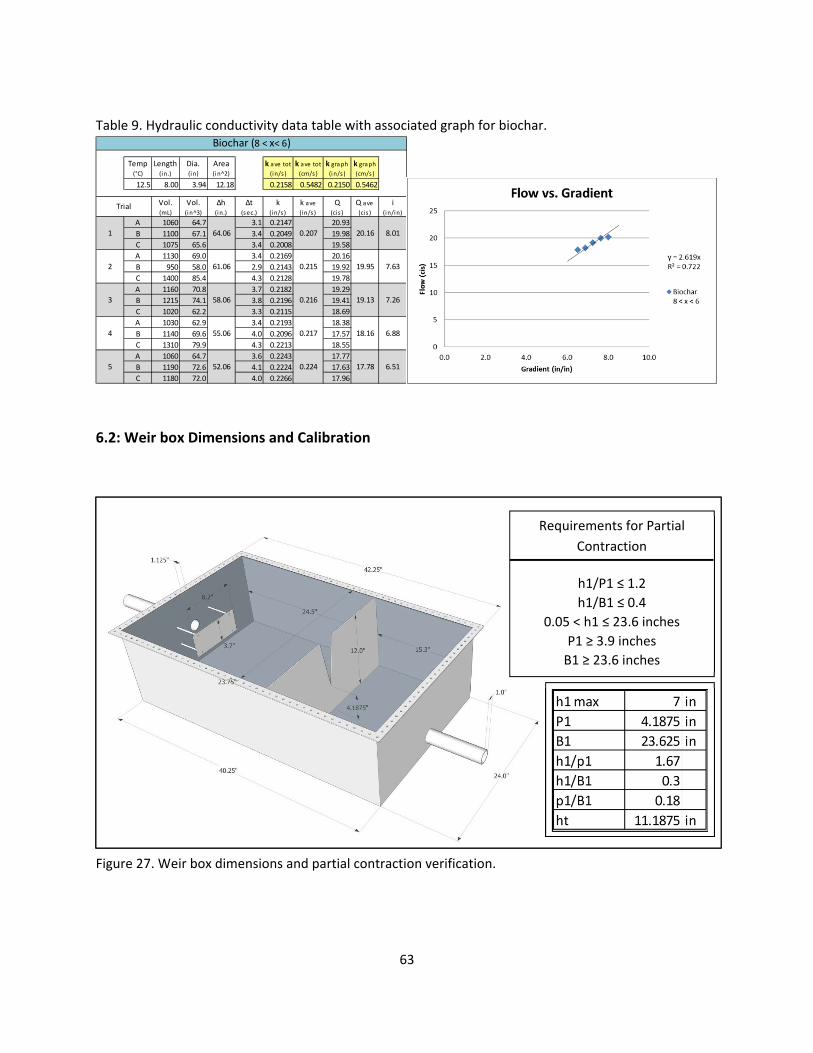
63
Table 9. Hydraulic conductivity data table with associated graph for biochar.
6.2: Weir box Dimensions and Calibration
Figure 27. Weir box dimensions and partial contraction verification.
Temp (°C)
Length (in.)
Dia. (in)
Area (in^2)
k ave tot (in/s )
k ave tot (cm/s )
k graph (in/s )
k graph
(cm/s )
12.5 8.00 3.94 12.18 0.2158 0.5482 0.2150 0.5462
Vol. (mL)
Vol. (in^3)
Δh (in.)
Δt (sec.)
k (in/s )
k ave (in/s )
Q (ci s )
Q ave (ci s )
i (in/in)
A 1060 64.7 3.1 0.2147 20.93
B 1100 67.1 3.4 0.2049 19.98
C 1075 65.6 3.4 0.2008 19.58
A 1130 69.0 3.4 0.2169 20.16
B 950 58.0 2.9 0.2143 19.92
C 1400 85.4 4.3 0.2128 19.78
A 1160 70.8 3.7 0.2182 19.29
B 1215 74.1 3.8 0.2196 19.41
C 1020 62.2 3.3 0.2115 18.69
A 1030 62.9 3.4 0.2193 18.38
B 1140 69.6 4.0 0.2096 17.57
C 1310 79.9 4.3 0.2213 18.55
A 1060 64.7 3.6 0.2243 17.77
B 1190 72.6 4.1 0.2224 17.63
C 1180 72.0 4.0 0.2266 17.96
Biochar (8 < x< 6)
Trial
1 64.06 0.207 20.16 8.01
2 61.06 0.215 19.95 7.63
3 58.06 0.216 19.13 7.26
4 55.06 0.217 18.16 6.88
5 52.06 0.224 17.78 6.51
Requirements for Partial
Contraction
h1/P1 ≤ 1.2
h1/B1 ≤ 0.4
0.05 < h1 ≤ 23.6 inches
P1 ≥ 3.9 inches
B1 ≥ 23.6 inches
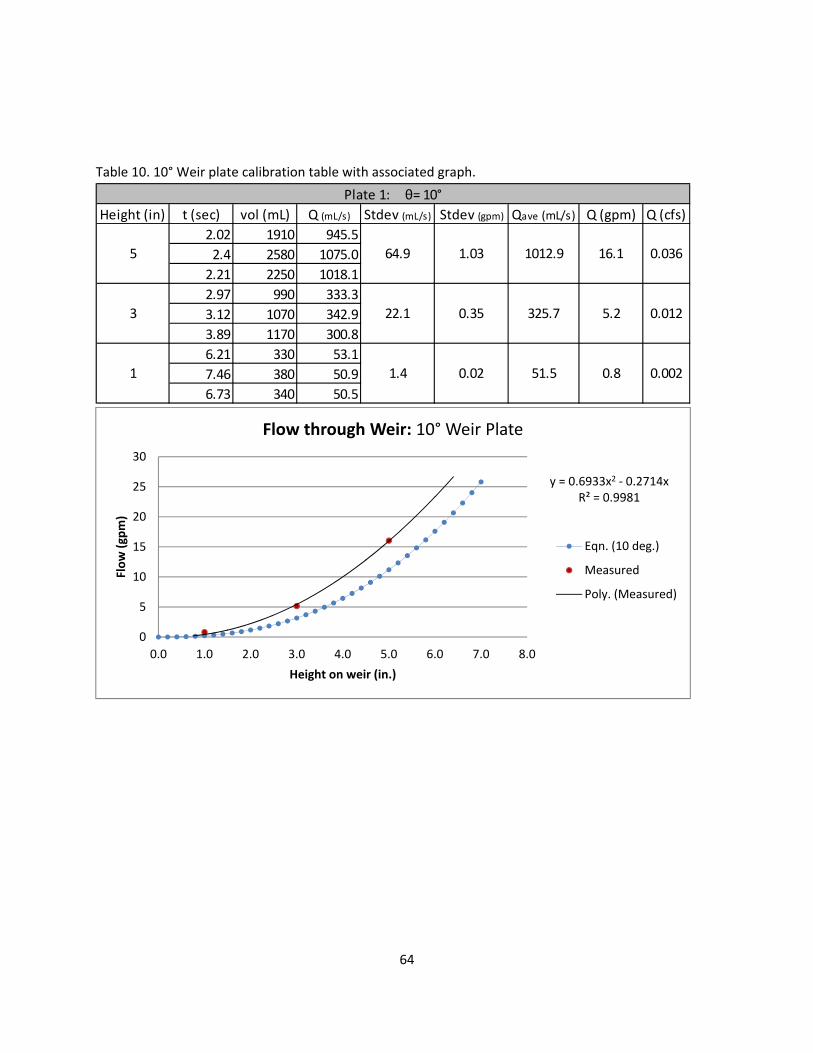
64
Table 10. 10° Weir plate calibration table with associated graph.
Height (in) t (sec) vol (mL) Q (mL/s) Stdev (mL/s) Stdev (gpm) Qave (mL/s) Q (gpm) Q (cfs)
2.02 1910 945.5
2.4 2580 1075.0
2.21 2250 1018.1
2.97 990 333.3
3.12 1070 342.9
3.89 1170 300.8
6.21 330 53.1
7.46 380 50.9
6.73 340 50.5
0.012
0.002
Plate 1: θ= 10°
0.02
5
3
1
1012.9
325.7
51.5
16.1 0.036
5.2
64.9 1.03
22.1 0.35
1.4 0.8
y = 0.6933x2 ‐ 0.2714xR² = 0.9981
0
5
10
15
20
25
30
0.0 1.0 2.0 3.0 4.0 5.0 6.0 7.0 8.0
Flow (gpm)
Height on weir (in.)
Flow through Weir: 10° Weir Plate
Eqn. (10 deg.)
Measured
Poly. (Measured)
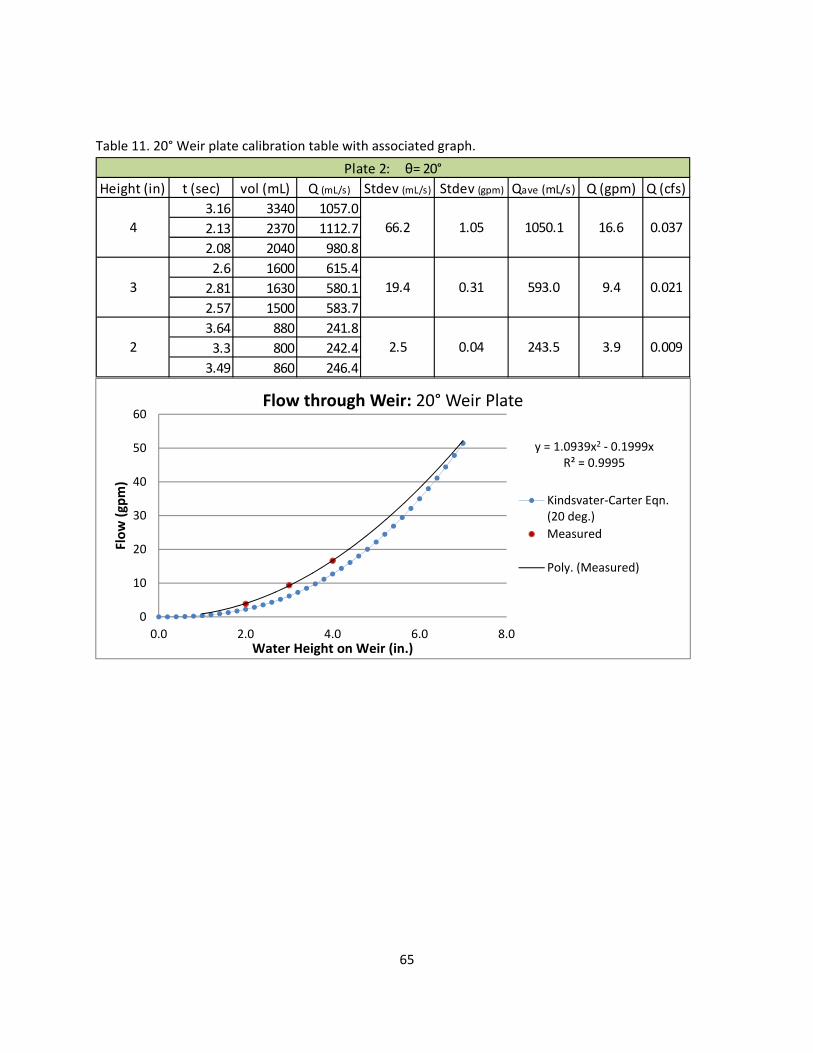
65
Table 11. 20° Weir plate calibration table with associated graph.
Height (in) t (sec) vol (mL) Q (mL/s) Stdev (mL/s) Stdev (gpm) Qave (mL/s) Q (gpm) Q (cfs)
3.16 3340 1057.0
2.13 2370 1112.7
2.08 2040 980.8
2.6 1600 615.4
2.81 1630 580.1
2.57 1500 583.7
3.64 880 241.8
3.3 800 242.4
3.49 860 246.4
Plate 2: θ= 20°
4 66.2 1.05 1050.1 16.6 0.037
0.009
3 19.4 0.31 593.0 9.4 0.021
2 2.5 0.04 243.5 3.9
y = 1.0939x2 ‐ 0.1999xR² = 0.9995
0
10
20
30
40
50
60
0.0 2.0 4.0 6.0 8.0
Flow (gpm)
Water Height on Weir (in.)
Flow through Weir: 20° Weir Plate
Kindsvater‐Carter Eqn.(20 deg.)
Measured
Poly. (Measured)
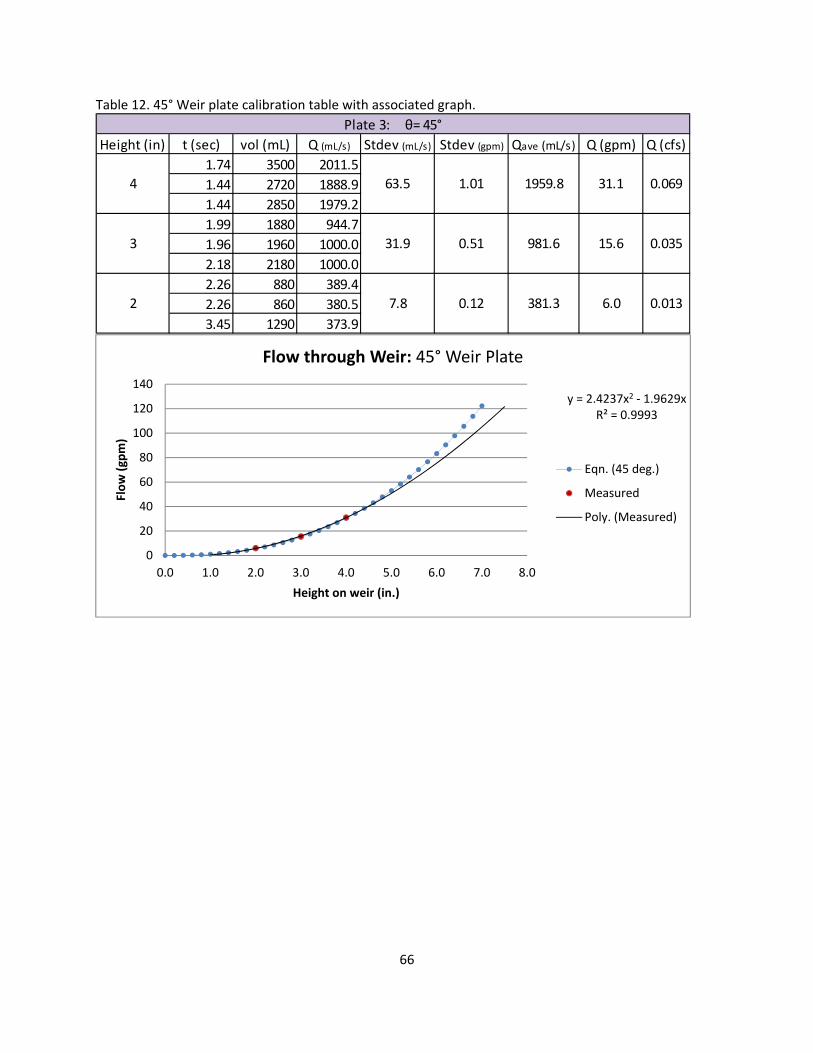
66
Table 12. 45° Weir plate calibration table with associated graph.
Height (in) t (sec) vol (mL) Q (mL/s) Stdev (mL/s) Stdev (gpm) Qave (mL/s) Q (gpm) Q (cfs)
1.74 3500 2011.5
1.44 2720 1888.9
1.44 2850 1979.2
1.99 1880 944.7
1.96 1960 1000.0
2.18 2180 1000.0
2.26 880 389.4
2.26 860 380.5
3.45 1290 373.9
Plate 3: θ= 45°
4 63.5 1.01 1959.8 31.1 0.069
0.013
3 31.9 0.51 981.6 15.6 0.035
2 7.8 0.12 381.3 6.0
y = 2.4237x2 ‐ 1.9629xR² = 0.9993
0
20
40
60
80
100
120
140
0.0 1.0 2.0 3.0 4.0 5.0 6.0 7.0 8.0
Flow (gpm)
Height on weir (in.)
Flow through Weir: 45° Weir Plate
Eqn. (45 deg.)
Measured
Poly. (Measured)
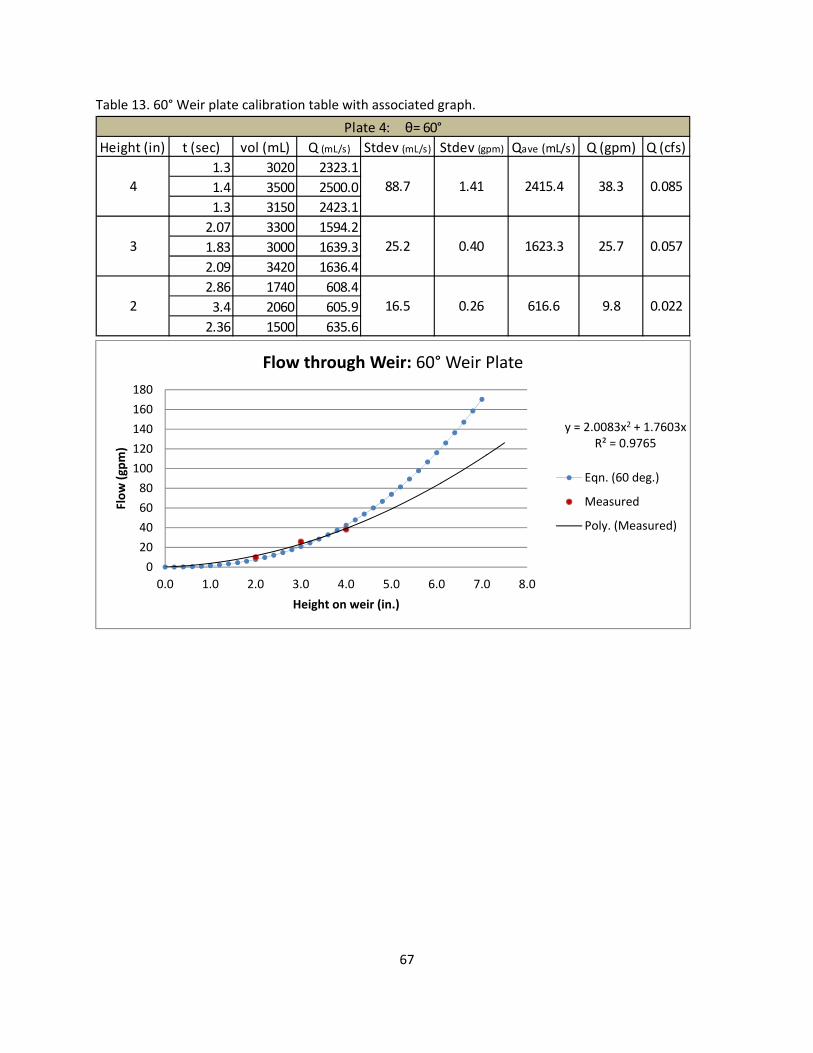
67
Table 13. 60° Weir plate calibration table with associated graph.
Height (in) t (sec) vol (mL) Q (mL/s) Stdev (mL/s) Stdev (gpm) Qave (mL/s) Q (gpm) Q (cfs)
1.3 3020 2323.1
1.4 3500 2500.0
1.3 3150 2423.1
2.07 3300 1594.2
1.83 3000 1639.3
2.09 3420 1636.4
2.86 1740 608.4
3.4 2060 605.9
2.36 1500 635.6
Plate 4: θ= 60°
4 88.7 1.41 2415.4 38.3 0.085
0.022
3 25.2 0.40 1623.3 25.7 0.057
2 16.5 0.26 616.6 9.8
y = 2.0083x2 + 1.7603xR² = 0.9765
0
20
40
60
80
100
120
140
160
180
0.0 1.0 2.0 3.0 4.0 5.0 6.0 7.0 8.0
Flow (gpm)
Height on weir (in.)
Flow through Weir: 60° Weir Plate
Eqn. (60 deg.)
Measured
Poly. (Measured)
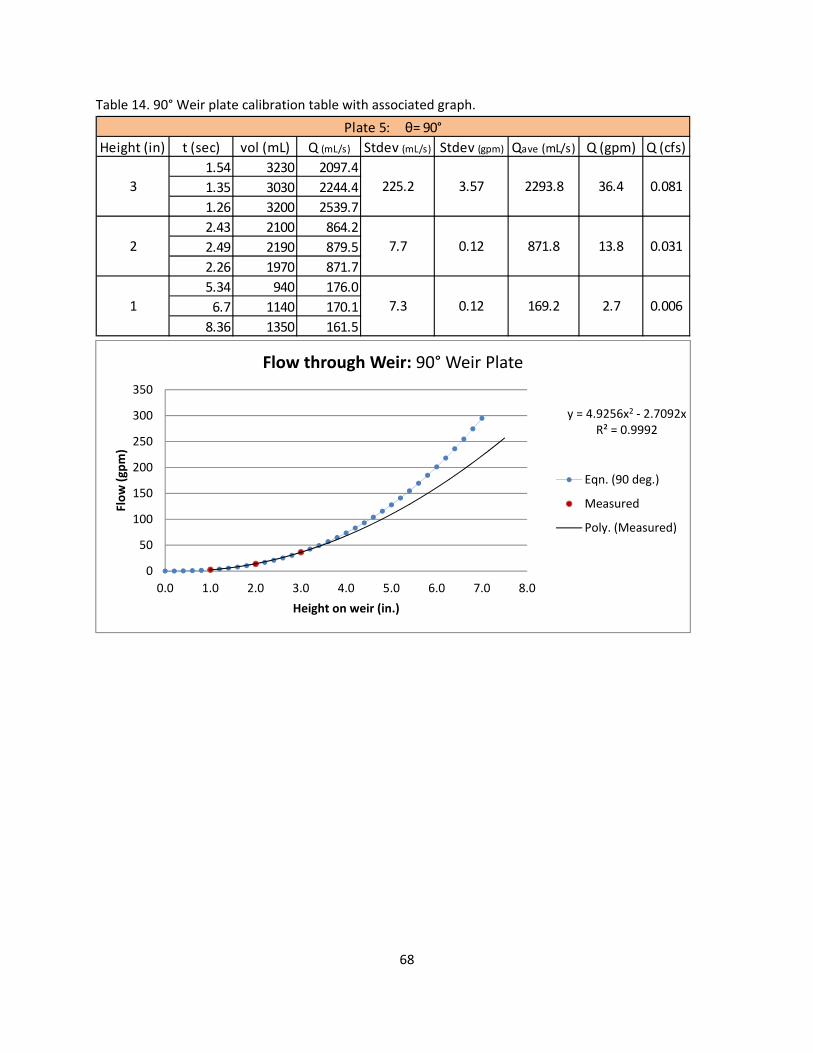
68
Table 14. 90° Weir plate calibration table with associated graph.
Height (in) t (sec) vol (mL) Q (mL/s) Stdev (mL/s) Stdev (gpm) Qave (mL/s) Q (gpm) Q (cfs)
1.54 3230 2097.4
1.35 3030 2244.4
1.26 3200 2539.7
2.43 2100 864.2
2.49 2190 879.5
2.26 1970 871.7
5.34 940 176.0
6.7 1140 170.1
8.36 1350 161.5
Plate 5: θ= 90°
3 225.2 3.57 2293.8 36.4 0.081
0.006
2 7.7 0.12 871.8 13.8 0.031
1 7.3 0.12 169.2 2.7
y = 4.9256x2 ‐ 2.7092xR² = 0.9992
0
50
100
150
200
250
300
350
0.0 1.0 2.0 3.0 4.0 5.0 6.0 7.0 8.0
Flow (gpm)
Height on weir (in.)
Flow through Weir: 90° Weir Plate
Eqn. (90 deg.)
Measured
Poly. (Measured)
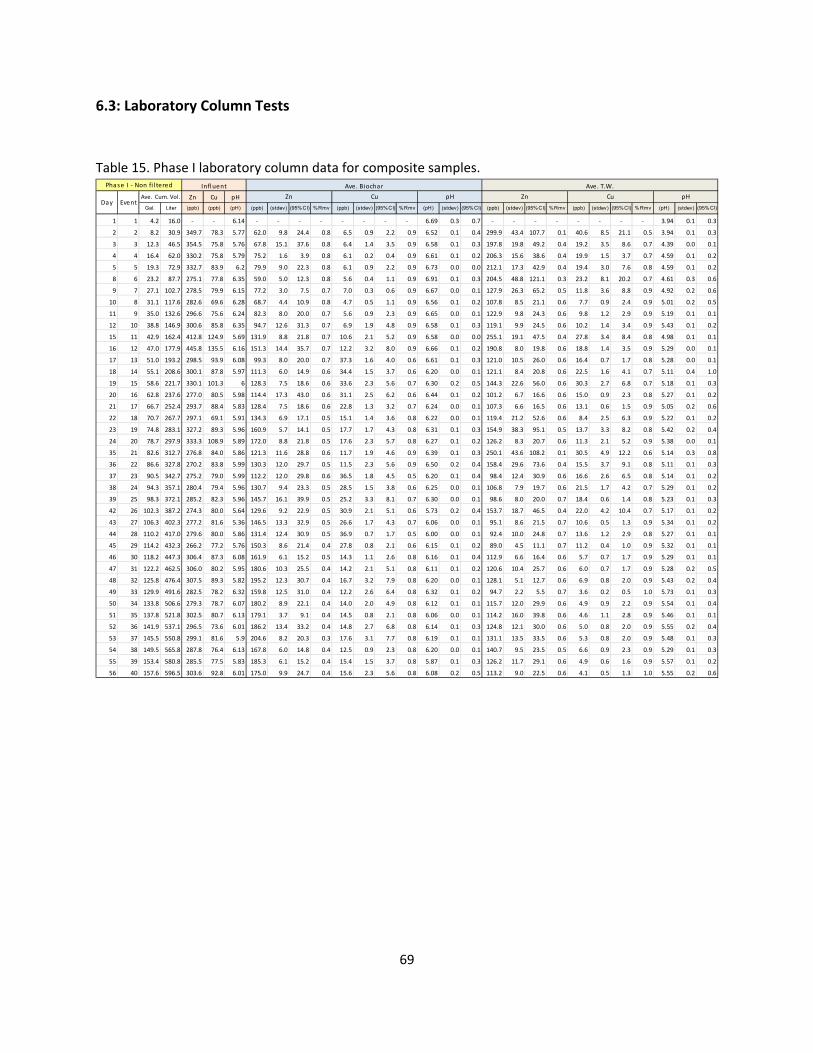
69
6.3: Laboratory Column Tests
Table 15. Phase I laboratory column data for composite samples.
Zn Cu pH
Gal. Liter (ppb) (ppb) (pH) (ppb) (stdev) (95% CI) % Rmv (ppb) (stdev) (95% CI) % Rmv (pH) (stdev) (95% CI) (ppb) (stdev) (95% CI) % Rmv (ppb) (stdev) (95% CI) % Rmv (pH) (stdev) (95% CI)
1 1 4.2 16.0 ‐ ‐ 6.14 ‐ ‐ ‐ ‐ ‐ ‐ ‐ ‐ 6.69 0.3 0.7 ‐ ‐ ‐ ‐ ‐ ‐ ‐ ‐ 3.94 0.1 0.3
2 2 8.2 30.9 349.7 78.3 5.77 62.0 9.8 24.4 0.8 6.5 0.9 2.2 0.9 6.52 0.1 0.4 299.9 43.4 107.7 0.1 40.6 8.5 21.1 0.5 3.94 0.1 0.3
3 3 12.3 46.5 354.5 75.8 5.76 67.8 15.1 37.6 0.8 6.4 1.4 3.5 0.9 6.58 0.1 0.3 197.8 19.8 49.2 0.4 19.2 3.5 8.6 0.7 4.39 0.0 0.1
4 4 16.4 62.0 330.2 75.8 5.79 75.2 1.6 3.9 0.8 6.1 0.2 0.4 0.9 6.61 0.1 0.2 206.3 15.6 38.6 0.4 19.9 1.5 3.7 0.7 4.59 0.1 0.2
5 5 19.3 72.9 332.7 83.9 6.2 79.9 9.0 22.3 0.8 6.1 0.9 2.2 0.9 6.73 0.0 0.0 212.1 17.3 42.9 0.4 19.4 3.0 7.6 0.8 4.59 0.1 0.2
8 6 23.2 87.7 275.1 77.8 6.35 59.0 5.0 12.3 0.8 5.6 0.4 1.1 0.9 6.91 0.1 0.3 204.5 48.8 121.1 0.3 23.2 8.1 20.2 0.7 4.61 0.3 0.6
9 7 27.1 102.7 278.5 79.9 6.15 77.2 3.0 7.5 0.7 7.0 0.3 0.6 0.9 6.67 0.0 0.1 127.9 26.3 65.2 0.5 11.8 3.6 8.8 0.9 4.92 0.2 0.6
10 8 31.1 117.6 282.6 69.6 6.28 68.7 4.4 10.9 0.8 4.7 0.5 1.1 0.9 6.56 0.1 0.2 107.8 8.5 21.1 0.6 7.7 0.9 2.4 0.9 5.01 0.2 0.5
11 9 35.0 132.6 296.6 75.6 6.24 82.3 8.0 20.0 0.7 5.6 0.9 2.3 0.9 6.65 0.0 0.1 122.9 9.8 24.3 0.6 9.8 1.2 2.9 0.9 5.19 0.1 0.1
12 10 38.8 146.9 300.6 85.8 6.35 94.7 12.6 31.3 0.7 6.9 1.9 4.8 0.9 6.58 0.1 0.3 119.1 9.9 24.5 0.6 10.2 1.4 3.4 0.9 5.43 0.1 0.2
15 11 42.9 162.4 412.8 124.9 5.69 131.9 8.8 21.8 0.7 10.6 2.1 5.2 0.9 6.58 0.0 0.0 255.1 19.1 47.5 0.4 27.8 3.4 8.4 0.8 4.98 0.1 0.1
16 12 47.0 177.9 445.8 135.5 6.16 151.3 14.4 35.7 0.7 12.2 3.2 8.0 0.9 6.66 0.1 0.2 190.8 8.0 19.8 0.6 18.8 1.4 3.5 0.9 5.29 0.0 0.1
17 13 51.0 193.2 298.5 93.9 6.08 99.3 8.0 20.0 0.7 37.3 1.6 4.0 0.6 6.61 0.1 0.3 121.0 10.5 26.0 0.6 16.4 0.7 1.7 0.8 5.28 0.0 0.1
18 14 55.1 208.6 300.1 87.8 5.97 111.3 6.0 14.9 0.6 34.4 1.5 3.7 0.6 6.20 0.0 0.1 121.1 8.4 20.8 0.6 22.5 1.6 4.1 0.7 5.11 0.4 1.0
19 15 58.6 221.7 330.1 101.3 6 128.3 7.5 18.6 0.6 33.6 2.3 5.6 0.7 6.30 0.2 0.5 144.3 22.6 56.0 0.6 30.3 2.7 6.8 0.7 5.18 0.1 0.3
20 16 62.8 237.6 277.0 80.5 5.98 114.4 17.3 43.0 0.6 31.1 2.5 6.2 0.6 6.44 0.1 0.2 101.2 6.7 16.6 0.6 15.0 0.9 2.3 0.8 5.27 0.1 0.2
21 17 66.7 252.4 293.7 88.4 5.83 128.4 7.5 18.6 0.6 22.8 1.3 3.2 0.7 6.24 0.0 0.1 107.3 6.6 16.5 0.6 13.1 0.6 1.5 0.9 5.05 0.2 0.6
22 18 70.7 267.7 297.1 69.1 5.91 134.3 6.9 17.1 0.5 15.1 1.4 3.6 0.8 6.22 0.0 0.1 119.4 21.2 52.6 0.6 8.4 2.5 6.3 0.9 5.22 0.1 0.2
23 19 74.8 283.1 327.2 89.3 5.96 160.9 5.7 14.1 0.5 17.7 1.7 4.3 0.8 6.31 0.1 0.3 154.9 38.3 95.1 0.5 13.7 3.3 8.2 0.8 5.42 0.2 0.4
24 20 78.7 297.9 333.3 108.9 5.89 172.0 8.8 21.8 0.5 17.6 2.3 5.7 0.8 6.27 0.1 0.2 126.2 8.3 20.7 0.6 11.3 2.1 5.2 0.9 5.38 0.0 0.1
35 21 82.6 312.7 276.8 84.0 5.86 121.3 11.6 28.8 0.6 11.7 1.9 4.6 0.9 6.39 0.1 0.3 250.1 43.6 108.2 0.1 30.5 4.9 12.2 0.6 5.14 0.3 0.8
36 22 86.6 327.8 270.2 83.8 5.99 130.3 12.0 29.7 0.5 11.5 2.3 5.6 0.9 6.50 0.2 0.4 158.4 29.6 73.6 0.4 15.5 3.7 9.1 0.8 5.11 0.1 0.3
37 23 90.5 342.7 275.2 79.0 5.99 112.2 12.0 29.8 0.6 36.5 1.8 4.5 0.5 6.20 0.1 0.4 98.4 12.4 30.9 0.6 16.6 2.6 6.5 0.8 5.14 0.1 0.2
38 24 94.3 357.1 280.4 79.4 5.96 130.7 9.4 23.3 0.5 28.5 1.5 3.8 0.6 6.25 0.0 0.1 106.8 7.9 19.7 0.6 21.5 1.7 4.2 0.7 5.29 0.1 0.2
39 25 98.3 372.1 285.2 82.3 5.96 145.7 16.1 39.9 0.5 25.2 3.3 8.1 0.7 6.30 0.0 0.1 98.6 8.0 20.0 0.7 18.4 0.6 1.4 0.8 5.23 0.1 0.3
42 26 102.3 387.2 274.3 80.0 5.64 129.6 9.2 22.9 0.5 30.9 2.1 5.1 0.6 5.73 0.2 0.4 153.7 18.7 46.5 0.4 22.0 4.2 10.4 0.7 5.17 0.1 0.2
43 27 106.3 402.3 277.2 81.6 5.36 146.5 13.3 32.9 0.5 26.6 1.7 4.3 0.7 6.06 0.0 0.1 95.1 8.6 21.5 0.7 10.6 0.5 1.3 0.9 5.34 0.1 0.2
44 28 110.2 417.0 279.6 80.0 5.86 131.4 12.4 30.9 0.5 36.9 0.7 1.7 0.5 6.00 0.0 0.1 92.4 10.0 24.8 0.7 13.6 1.2 2.9 0.8 5.27 0.1 0.1
45 29 114.2 432.3 266.2 77.2 5.76 150.3 8.6 21.4 0.4 27.8 0.8 2.1 0.6 6.15 0.1 0.2 89.0 4.5 11.1 0.7 11.2 0.4 1.0 0.9 5.32 0.1 0.1
46 30 118.2 447.3 306.4 87.3 6.08 161.9 6.1 15.2 0.5 14.3 1.1 2.6 0.8 6.16 0.1 0.4 112.9 6.6 16.4 0.6 5.7 0.7 1.7 0.9 5.29 0.1 0.1
47 31 122.2 462.5 306.0 80.2 5.95 180.6 10.3 25.5 0.4 14.2 2.1 5.1 0.8 6.11 0.1 0.2 120.6 10.4 25.7 0.6 6.0 0.7 1.7 0.9 5.28 0.2 0.5
48 32 125.8 476.4 307.5 89.3 5.82 195.2 12.3 30.7 0.4 16.7 3.2 7.9 0.8 6.20 0.0 0.1 128.1 5.1 12.7 0.6 6.9 0.8 2.0 0.9 5.43 0.2 0.4
49 33 129.9 491.6 282.5 78.2 6.32 159.8 12.5 31.0 0.4 12.2 2.6 6.4 0.8 6.32 0.1 0.2 94.7 2.2 5.5 0.7 3.6 0.2 0.5 1.0 5.73 0.1 0.3
50 34 133.8 506.6 279.3 78.7 6.07 180.2 8.9 22.1 0.4 14.0 2.0 4.9 0.8 6.12 0.1 0.1 115.7 12.0 29.9 0.6 4.9 0.9 2.2 0.9 5.54 0.1 0.4
51 35 137.8 521.8 302.5 80.7 6.13 179.1 3.7 9.1 0.4 14.5 0.8 2.1 0.8 6.06 0.0 0.1 114.2 16.0 39.8 0.6 4.6 1.1 2.8 0.9 5.46 0.1 0.1
52 36 141.9 537.1 296.5 73.6 6.01 186.2 13.4 33.2 0.4 14.8 2.7 6.8 0.8 6.14 0.1 0.3 124.8 12.1 30.0 0.6 5.0 0.8 2.0 0.9 5.55 0.2 0.4
53 37 145.5 550.8 299.1 81.6 5.9 204.6 8.2 20.3 0.3 17.6 3.1 7.7 0.8 6.19 0.1 0.1 131.1 13.5 33.5 0.6 5.3 0.8 2.0 0.9 5.48 0.1 0.3
54 38 149.5 565.8 287.8 76.4 6.13 167.8 6.0 14.8 0.4 12.5 0.9 2.3 0.8 6.20 0.0 0.1 140.7 9.5 23.5 0.5 6.6 0.9 2.3 0.9 5.29 0.1 0.3
55 39 153.4 580.8 285.5 77.5 5.83 185.3 6.1 15.2 0.4 15.4 1.5 3.7 0.8 5.87 0.1 0.3 126.2 11.7 29.1 0.6 4.9 0.6 1.6 0.9 5.57 0.1 0.2
56 40 157.6 596.5 303.6 92.8 6.01 175.0 9.9 24.7 0.4 15.6 2.3 5.6 0.8 6.08 0.2 0.5 113.2 9.0 22.5 0.6 4.1 0.5 1.3 1.0 5.55 0.2 0.6
Cu pHAve. Cum. Vol.
Phase I ‐ Non fi l tered Influent Ave. Biochar Ave. T.W.
Day EventZn Cu pH Zn
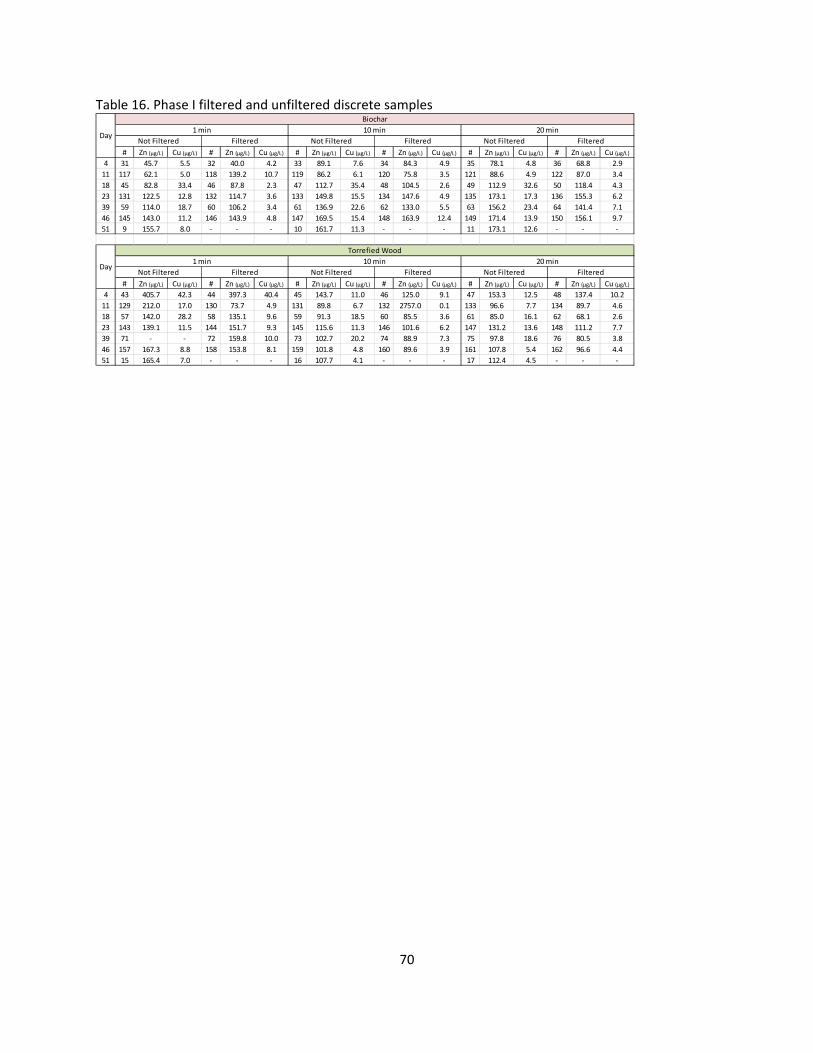
70
Table 16. Phase I filtered and unfiltered discrete samples
# Zn (μg/L) Cu (μg/L) # Zn (μg/L) Cu (μg/L) # Zn (μg/L) Cu (μg/L) # Zn (μg/L) Cu (μg/L) # Zn (μg/L) Cu (μg/L) # Zn (μg/L) Cu (μg/L)
4 31 45.7 5.5 32 40.0 4.2 33 89.1 7.6 34 84.3 4.9 35 78.1 4.8 36 68.8 2.9
11 117 62.1 5.0 118 139.2 10.7 119 86.2 6.1 120 75.8 3.5 121 88.6 4.9 122 87.0 3.4
18 45 82.8 33.4 46 87.8 2.3 47 112.7 35.4 48 104.5 2.6 49 112.9 32.6 50 118.4 4.3
23 131 122.5 12.8 132 114.7 3.6 133 149.8 15.5 134 147.6 4.9 135 173.1 17.3 136 155.3 6.2
39 59 114.0 18.7 60 106.2 3.4 61 136.9 22.6 62 133.0 5.5 63 156.2 23.4 64 141.4 7.1
46 145 143.0 11.2 146 143.9 4.8 147 169.5 15.4 148 163.9 12.4 149 171.4 13.9 150 156.1 9.7
51 9 155.7 8.0 ‐ ‐ ‐ 10 161.7 11.3 ‐ ‐ ‐ 11 173.1 12.6 ‐ ‐ ‐
# Zn (μg/L) Cu (μg/L) # Zn (μg/L) Cu (μg/L) # Zn (μg/L) Cu (μg/L) # Zn (μg/L) Cu (μg/L) # Zn (μg/L) Cu (μg/L) # Zn (μg/L) Cu (μg/L)
4 43 405.7 42.3 44 397.3 40.4 45 143.7 11.0 46 125.0 9.1 47 153.3 12.5 48 137.4 10.2
11 129 212.0 17.0 130 73.7 4.9 131 89.8 6.7 132 2757.0 0.1 133 96.6 7.7 134 89.7 4.6
18 57 142.0 28.2 58 135.1 9.6 59 91.3 18.5 60 85.5 3.6 61 85.0 16.1 62 68.1 2.6
23 143 139.1 11.5 144 151.7 9.3 145 115.6 11.3 146 101.6 6.2 147 131.2 13.6 148 111.2 7.7
39 71 ‐ ‐ 72 159.8 10.0 73 102.7 20.2 74 88.9 7.3 75 97.8 18.6 76 80.5 3.8
46 157 167.3 8.8 158 153.8 8.1 159 101.8 4.8 160 89.6 3.9 161 107.8 5.4 162 96.6 4.4
51 15 165.4 7.0 ‐ ‐ ‐ 16 107.7 4.1 ‐ ‐ ‐ 17 112.4 4.5 ‐ ‐ ‐
Day
Day1 min 10 min 20 min
Not Filtered Filtered Not Filtered Filtered Not Filtered Filtered
Filtered
Biochar
Torrefied Wood
Not Filtered Filtered Not Filtered Filtered Not Filtered
1 min 10 min 20 min
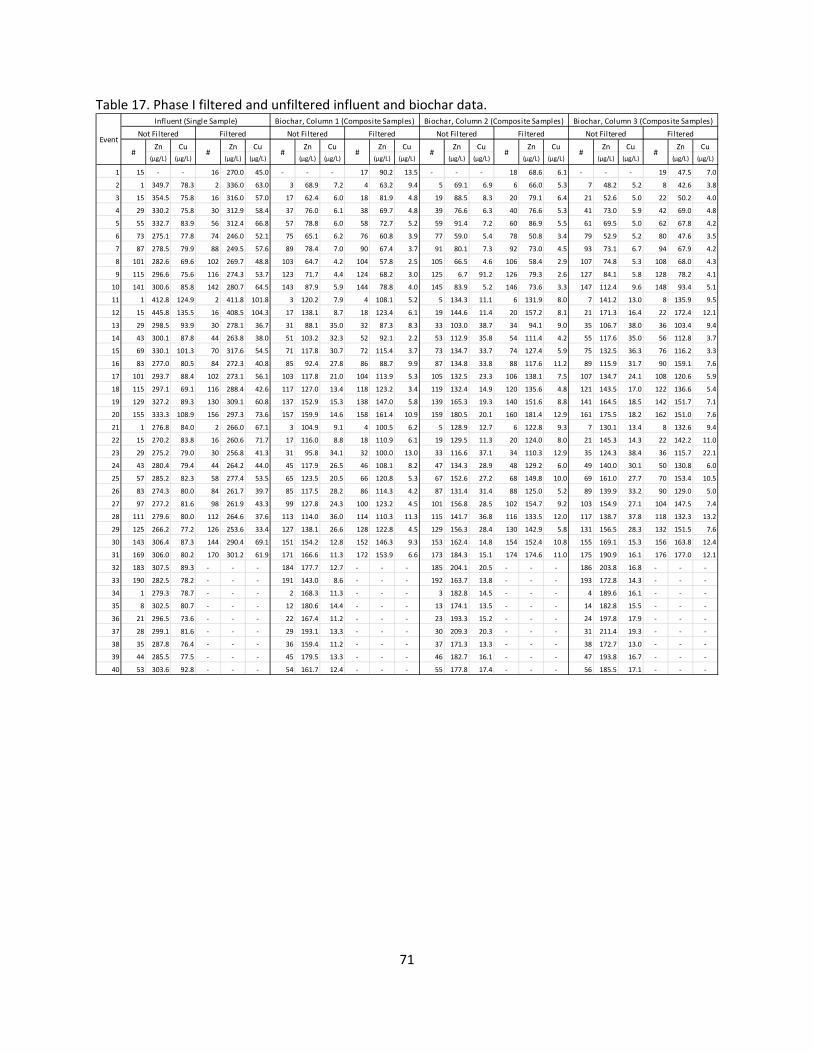
71
Table 17. Phase I filtered and unfiltered influent and biochar data.
Zn Cu Zn Cu Zn Cu Zn Cu Zn Cu Zn Cu Zn Cu Zn Cu
(μg/L) (μg/L) (μg/L) (μg/L) (μg/L) (μg/L) (μg/L) (μg/L) (μg/L) (μg/L) (μg/L) (μg/L) (μg/L) (μg/L) (μg/L) (μg/L)
1 15 ‐ ‐ 16 270.0 45.0 ‐ ‐ ‐ 17 90.2 13.5 ‐ ‐ ‐ 18 68.6 6.1 ‐ ‐ ‐ 19 47.5 7.0
2 1 349.7 78.3 2 336.0 63.0 3 68.9 7.2 4 63.2 9.4 5 69.1 6.9 6 66.0 5.3 7 48.2 5.2 8 42.6 3.8
3 15 354.5 75.8 16 316.0 57.0 17 62.4 6.0 18 81.9 4.8 19 88.5 8.3 20 79.1 6.4 21 52.6 5.0 22 50.2 4.0
4 29 330.2 75.8 30 312.9 58.4 37 76.0 6.1 38 69.7 4.8 39 76.6 6.3 40 76.6 5.3 41 73.0 5.9 42 69.0 4.8
5 55 332.7 83.9 56 312.4 66.8 57 78.8 6.0 58 72.7 5.2 59 91.4 7.2 60 86.9 5.5 61 69.5 5.0 62 67.8 4.2
6 73 275.1 77.8 74 246.0 52.1 75 65.1 6.2 76 60.8 3.9 77 59.0 5.4 78 50.8 3.4 79 52.9 5.2 80 47.6 3.5
7 87 278.5 79.9 88 249.5 57.6 89 78.4 7.0 90 67.4 3.7 91 80.1 7.3 92 73.0 4.5 93 73.1 6.7 94 67.9 4.2
8 101 282.6 69.6 102 269.7 48.8 103 64.7 4.2 104 57.8 2.5 105 66.5 4.6 106 58.4 2.9 107 74.8 5.3 108 68.0 4.3
9 115 296.6 75.6 116 274.3 53.7 123 71.7 4.4 124 68.2 3.0 125 6.7 91.2 126 79.3 2.6 127 84.1 5.8 128 78.2 4.1
10 141 300.6 85.8 142 280.7 64.5 143 87.9 5.9 144 78.8 4.0 145 83.9 5.2 146 73.6 3.3 147 112.4 9.6 148 93.4 5.1
11 1 412.8 124.9 2 411.8 101.8 3 120.2 7.9 4 108.1 5.2 5 134.3 11.1 6 131.9 8.0 7 141.2 13.0 8 135.9 9.5
12 15 445.8 135.5 16 408.5 104.3 17 138.1 8.7 18 123.4 6.1 19 144.6 11.4 20 157.2 8.1 21 171.3 16.4 22 172.4 12.1
13 29 298.5 93.9 30 278.1 36.7 31 88.1 35.0 32 87.3 8.3 33 103.0 38.7 34 94.1 9.0 35 106.7 38.0 36 103.4 9.4
14 43 300.1 87.8 44 263.8 38.0 51 103.2 32.3 52 92.1 2.2 53 112.9 35.8 54 111.4 4.2 55 117.6 35.0 56 112.8 3.7
15 69 330.1 101.3 70 317.6 54.5 71 117.8 30.7 72 115.4 3.7 73 134.7 33.7 74 127.4 5.9 75 132.5 36.3 76 116.2 3.3
16 83 277.0 80.5 84 272.3 40.8 85 92.4 27.8 86 88.7 9.9 87 134.8 33.8 88 117.6 11.2 89 115.9 31.7 90 159.1 7.6
17 101 293.7 88.4 102 273.1 56.1 103 117.8 21.0 104 113.9 5.3 105 132.5 23.3 106 138.1 7.5 107 134.7 24.1 108 120.6 5.9
18 115 297.1 69.1 116 288.4 42.6 117 127.0 13.4 118 123.2 3.4 119 132.4 14.9 120 135.6 4.8 121 143.5 17.0 122 136.6 5.4
19 129 327.2 89.3 130 309.1 60.8 137 152.9 15.3 138 147.0 5.8 139 165.3 19.3 140 151.6 8.8 141 164.5 18.5 142 151.7 7.1
20 155 333.3 108.9 156 297.3 73.6 157 159.9 14.6 158 161.4 10.9 159 180.5 20.1 160 181.4 12.9 161 175.5 18.2 162 151.0 7.6
21 1 276.8 84.0 2 266.0 67.1 3 104.9 9.1 4 100.5 6.2 5 128.9 12.7 6 122.8 9.3 7 130.1 13.4 8 132.6 9.4
22 15 270.2 83.8 16 260.6 71.7 17 116.0 8.8 18 110.9 6.1 19 129.5 11.3 20 124.0 8.0 21 145.3 14.3 22 142.2 11.0
23 29 275.2 79.0 30 256.8 41.3 31 95.8 34.1 32 100.0 13.0 33 116.6 37.1 34 110.3 12.9 35 124.3 38.4 36 115.7 22.1
24 43 280.4 79.4 44 264.2 44.0 45 117.9 26.5 46 108.1 8.2 47 134.3 28.9 48 129.2 6.0 49 140.0 30.1 50 130.8 6.0
25 57 285.2 82.3 58 277.4 53.5 65 123.5 20.5 66 120.8 5.3 67 152.6 27.2 68 149.8 10.0 69 161.0 27.7 70 153.4 10.5
26 83 274.3 80.0 84 261.7 39.7 85 117.5 28.2 86 114.3 4.2 87 131.4 31.4 88 125.0 5.2 89 139.9 33.2 90 129.0 5.0
27 97 277.2 81.6 98 261.9 43.3 99 127.8 24.3 100 123.2 4.5 101 156.8 28.5 102 154.7 9.2 103 154.9 27.1 104 147.5 7.4
28 111 279.6 80.0 112 264.6 37.6 113 114.0 36.0 114 110.3 11.3 115 141.7 36.8 116 133.5 12.0 117 138.7 37.8 118 132.3 13.2
29 125 266.2 77.2 126 253.6 33.4 127 138.1 26.6 128 122.8 4.5 129 156.3 28.4 130 142.9 5.8 131 156.5 28.3 132 151.5 7.6
30 143 306.4 87.3 144 290.4 69.1 151 154.2 12.8 152 146.3 9.3 153 162.4 14.8 154 152.4 10.8 155 169.1 15.3 156 163.8 12.4
31 169 306.0 80.2 170 301.2 61.9 171 166.6 11.3 172 153.9 6.6 173 184.3 15.1 174 174.6 11.0 175 190.9 16.1 176 177.0 12.1
32 183 307.5 89.3 ‐ ‐ ‐ 184 177.7 12.7 ‐ ‐ ‐ 185 204.1 20.5 ‐ ‐ ‐ 186 203.8 16.8 ‐ ‐ ‐
33 190 282.5 78.2 ‐ ‐ ‐ 191 143.0 8.6 ‐ ‐ ‐ 192 163.7 13.8 ‐ ‐ ‐ 193 172.8 14.3 ‐ ‐ ‐
34 1 279.3 78.7 ‐ ‐ ‐ 2 168.3 11.3 ‐ ‐ ‐ 3 182.8 14.5 ‐ ‐ ‐ 4 189.6 16.1 ‐ ‐ ‐
35 8 302.5 80.7 ‐ ‐ ‐ 12 180.6 14.4 ‐ ‐ ‐ 13 174.1 13.5 ‐ ‐ ‐ 14 182.8 15.5 ‐ ‐ ‐
36 21 296.5 73.6 ‐ ‐ ‐ 22 167.4 11.2 ‐ ‐ ‐ 23 193.3 15.2 ‐ ‐ ‐ 24 197.8 17.9 ‐ ‐ ‐
37 28 299.1 81.6 ‐ ‐ ‐ 29 193.1 13.3 ‐ ‐ ‐ 30 209.3 20.3 ‐ ‐ ‐ 31 211.4 19.3 ‐ ‐ ‐
38 35 287.8 76.4 ‐ ‐ ‐ 36 159.4 11.2 ‐ ‐ ‐ 37 171.3 13.3 ‐ ‐ ‐ 38 172.7 13.0 ‐ ‐ ‐
39 44 285.5 77.5 ‐ ‐ ‐ 45 179.5 13.3 ‐ ‐ ‐ 46 182.7 16.1 ‐ ‐ ‐ 47 193.8 16.7 ‐ ‐ ‐
40 53 303.6 92.8 ‐ ‐ ‐ 54 161.7 12.4 ‐ ‐ ‐ 55 177.8 17.4 ‐ ‐ ‐ 56 185.5 17.1 ‐ ‐ ‐
## # # # # # #
Not Filtered Filtered
Influent (Single Sample)
Event
Biochar, Column 1 (Composite Samples) Biochar, Column 2 (Composite Samples) Biochar, Column 3 (Composite Samples)
FilteredNot FilteredNot Filtered FilteredNot Filtered Filtered
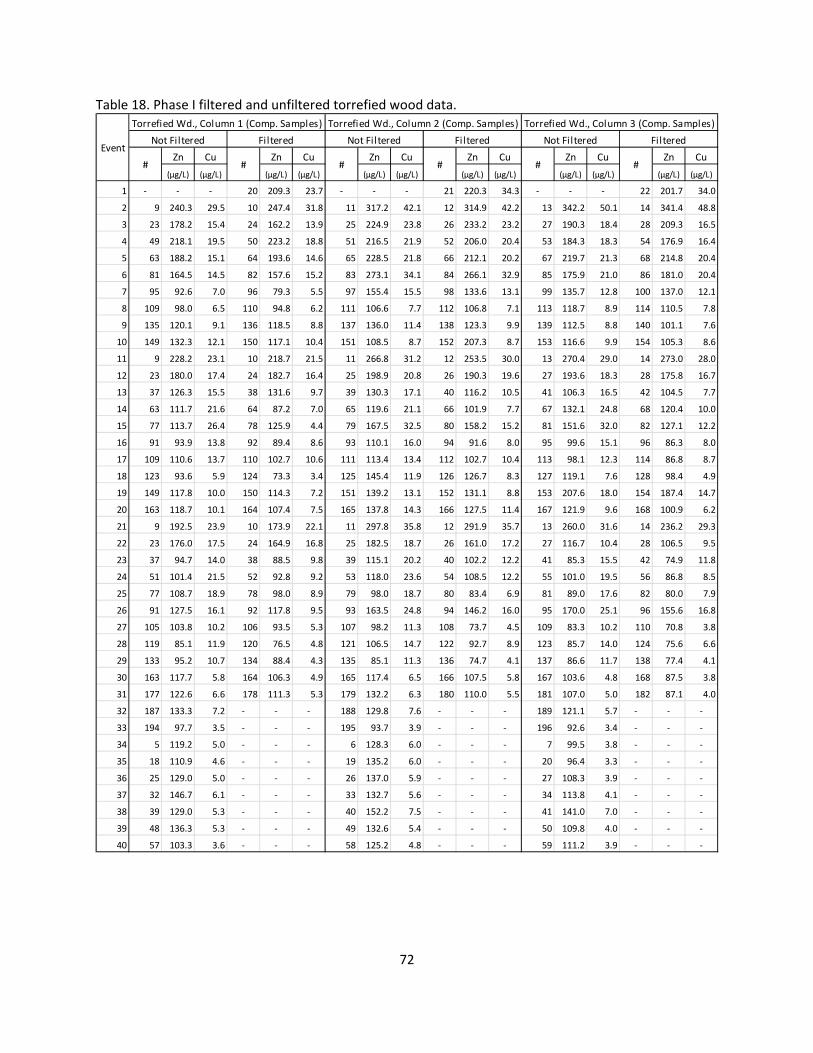
72
Table 18. Phase I filtered and unfiltered torrefied wood data.
Zn Cu Zn Cu Zn Cu Zn Cu Zn Cu Zn Cu
(μg/L) (μg/L) (μg/L) (μg/L) (μg/L) (μg/L) (μg/L) (μg/L) (μg/L) (μg/L) (μg/L) (μg/L)
1 ‐ ‐ ‐ 20 209.3 23.7 ‐ ‐ ‐ 21 220.3 34.3 ‐ ‐ ‐ 22 201.7 34.0
2 9 240.3 29.5 10 247.4 31.8 11 317.2 42.1 12 314.9 42.2 13 342.2 50.1 14 341.4 48.8
3 23 178.2 15.4 24 162.2 13.9 25 224.9 23.8 26 233.2 23.2 27 190.3 18.4 28 209.3 16.5
4 49 218.1 19.5 50 223.2 18.8 51 216.5 21.9 52 206.0 20.4 53 184.3 18.3 54 176.9 16.4
5 63 188.2 15.1 64 193.6 14.6 65 228.5 21.8 66 212.1 20.2 67 219.7 21.3 68 214.8 20.4
6 81 164.5 14.5 82 157.6 15.2 83 273.1 34.1 84 266.1 32.9 85 175.9 21.0 86 181.0 20.4
7 95 92.6 7.0 96 79.3 5.5 97 155.4 15.5 98 133.6 13.1 99 135.7 12.8 100 137.0 12.1
8 109 98.0 6.5 110 94.8 6.2 111 106.6 7.7 112 106.8 7.1 113 118.7 8.9 114 110.5 7.8
9 135 120.1 9.1 136 118.5 8.8 137 136.0 11.4 138 123.3 9.9 139 112.5 8.8 140 101.1 7.6
10 149 132.3 12.1 150 117.1 10.4 151 108.5 8.7 152 207.3 8.7 153 116.6 9.9 154 105.3 8.6
11 9 228.2 23.1 10 218.7 21.5 11 266.8 31.2 12 253.5 30.0 13 270.4 29.0 14 273.0 28.0
12 23 180.0 17.4 24 182.7 16.4 25 198.9 20.8 26 190.3 19.6 27 193.6 18.3 28 175.8 16.7
13 37 126.3 15.5 38 131.6 9.7 39 130.3 17.1 40 116.2 10.5 41 106.3 16.5 42 104.5 7.7
14 63 111.7 21.6 64 87.2 7.0 65 119.6 21.1 66 101.9 7.7 67 132.1 24.8 68 120.4 10.0
15 77 113.7 26.4 78 125.9 4.4 79 167.5 32.5 80 158.2 15.2 81 151.6 32.0 82 127.1 12.2
16 91 93.9 13.8 92 89.4 8.6 93 110.1 16.0 94 91.6 8.0 95 99.6 15.1 96 86.3 8.0
17 109 110.6 13.7 110 102.7 10.6 111 113.4 13.4 112 102.7 10.4 113 98.1 12.3 114 86.8 8.7
18 123 93.6 5.9 124 73.3 3.4 125 145.4 11.9 126 126.7 8.3 127 119.1 7.6 128 98.4 4.9
19 149 117.8 10.0 150 114.3 7.2 151 139.2 13.1 152 131.1 8.8 153 207.6 18.0 154 187.4 14.7
20 163 118.7 10.1 164 107.4 7.5 165 137.8 14.3 166 127.5 11.4 167 121.9 9.6 168 100.9 6.2
21 9 192.5 23.9 10 173.9 22.1 11 297.8 35.8 12 291.9 35.7 13 260.0 31.6 14 236.2 29.3
22 23 176.0 17.5 24 164.9 16.8 25 182.5 18.7 26 161.0 17.2 27 116.7 10.4 28 106.5 9.5
23 37 94.7 14.0 38 88.5 9.8 39 115.1 20.2 40 102.2 12.2 41 85.3 15.5 42 74.9 11.8
24 51 101.4 21.5 52 92.8 9.2 53 118.0 23.6 54 108.5 12.2 55 101.0 19.5 56 86.8 8.5
25 77 108.7 18.9 78 98.0 8.9 79 98.0 18.7 80 83.4 6.9 81 89.0 17.6 82 80.0 7.9
26 91 127.5 16.1 92 117.8 9.5 93 163.5 24.8 94 146.2 16.0 95 170.0 25.1 96 155.6 16.8
27 105 103.8 10.2 106 93.5 5.3 107 98.2 11.3 108 73.7 4.5 109 83.3 10.2 110 70.8 3.8
28 119 85.1 11.9 120 76.5 4.8 121 106.5 14.7 122 92.7 8.9 123 85.7 14.0 124 75.6 6.6
29 133 95.2 10.7 134 88.4 4.3 135 85.1 11.3 136 74.7 4.1 137 86.6 11.7 138 77.4 4.1
30 163 117.7 5.8 164 106.3 4.9 165 117.4 6.5 166 107.5 5.8 167 103.6 4.8 168 87.5 3.8
31 177 122.6 6.6 178 111.3 5.3 179 132.2 6.3 180 110.0 5.5 181 107.0 5.0 182 87.1 4.0
32 187 133.3 7.2 ‐ ‐ ‐ 188 129.8 7.6 ‐ ‐ ‐ 189 121.1 5.7 ‐ ‐ ‐
33 194 97.7 3.5 ‐ ‐ ‐ 195 93.7 3.9 ‐ ‐ ‐ 196 92.6 3.4 ‐ ‐ ‐
34 5 119.2 5.0 ‐ ‐ ‐ 6 128.3 6.0 ‐ ‐ ‐ 7 99.5 3.8 ‐ ‐ ‐
35 18 110.9 4.6 ‐ ‐ ‐ 19 135.2 6.0 ‐ ‐ ‐ 20 96.4 3.3 ‐ ‐ ‐
36 25 129.0 5.0 ‐ ‐ ‐ 26 137.0 5.9 ‐ ‐ ‐ 27 108.3 3.9 ‐ ‐ ‐
37 32 146.7 6.1 ‐ ‐ ‐ 33 132.7 5.6 ‐ ‐ ‐ 34 113.8 4.1 ‐ ‐ ‐
38 39 129.0 5.3 ‐ ‐ ‐ 40 152.2 7.5 ‐ ‐ ‐ 41 141.0 7.0 ‐ ‐ ‐
39 48 136.3 5.3 ‐ ‐ ‐ 49 132.6 5.4 ‐ ‐ ‐ 50 109.8 4.0 ‐ ‐ ‐
40 57 103.3 3.6 ‐ ‐ ‐ 58 125.2 4.8 ‐ ‐ ‐ 59 111.2 3.9 ‐ ‐ ‐
Torrefied Wd., Column 1 (Comp. Samples)
Event
Torrefied Wd., Column 2 (Comp. Samples) Torrefied Wd., Column 3 (Comp. Samples)
# # # #
Not Filtered Filtered Not Filtered FilteredNot Filtered Filtered
# #
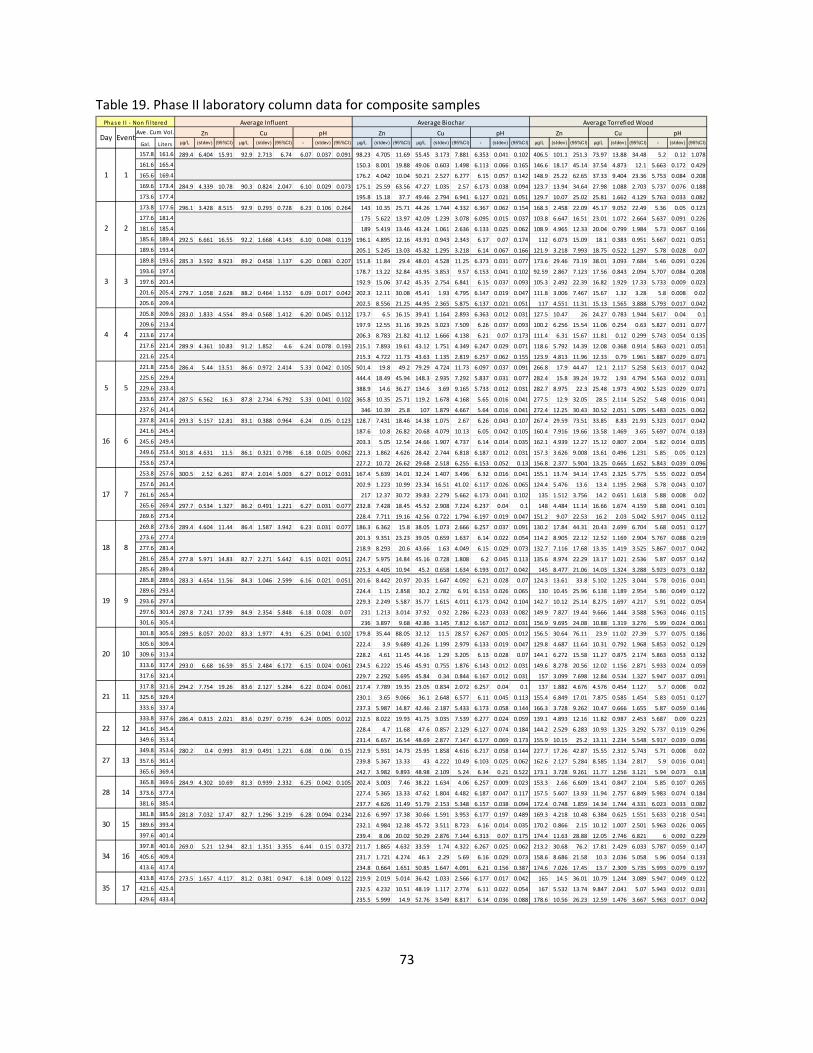
73
Table 19. Phase II laboratory column data for composite samples
Gal. Liters μg/L (stdev) (95%CI) μg/L (stdev) (95%CI) - (stdev) (95%CI) μg/L (stdev) (95%CI) μg/L (stdev) (95%CI) - (stdev) (95%CI) μg/L (stdev) (95%CI) μg/L (stdev) (95%CI) - (stdev) (95%CI)
157.8 161.6 289.4 6.404 15.91 92.9 2.713 6.74 6.07 0.037 0.091 98.23 4.705 11.69 55.45 3.173 7.881 6.353 0.041 0.102 406.5 101.1 251.3 73.97 13.88 34.48 5.2 0.12 1.078
161.6 165.4 150.3 8.001 19.88 49.06 0.603 1.498 6.113 0.066 0.165 146.6 18.17 45.14 37.54 4.873 12.1 5.663 0.172 0.429
165.6 169.4 176.2 4.042 10.04 50.21 2.527 6.277 6.15 0.057 0.142 148.9 25.22 62.65 37.33 9.404 23.36 5.753 0.084 0.208
169.6 173.4 284.9 4.339 10.78 90.3 0.824 2.047 6.10 0.029 0.073 175.1 25.59 63.56 47.27 1.035 2.57 6.173 0.038 0.094 123.7 13.94 34.64 27.98 1.088 2.703 5.737 0.076 0.188
173.6 177.4 195.8 15.18 37.7 49.46 2.794 6.941 6.127 0.021 0.051 129.7 10.07 25.02 25.81 1.662 4.129 5.763 0.033 0.082
173.8 177.6 296.1 3.428 8.515 92.9 0.293 0.728 6.23 0.106 0.264 143 10.35 25.71 44.26 1.744 4.332 6.367 0.062 0.154 168.3 2.458 22.09 45.17 9.052 22.49 5.36 0.05 0.123
177.6 181.4 175 5.622 13.97 42.09 1.239 3.078 6.095 0.015 0.037 103.8 6.647 16.51 23.01 1.072 2.664 5.637 0.091 0.226
181.6 185.4 189 5.419 13.46 43.24 1.061 2.636 6.133 0.025 0.062 108.9 4.965 12.33 20.04 0.799 1.984 5.73 0.067 0.166
185.6 189.4 292.5 6.661 16.55 92.2 1.668 4.143 6.10 0.048 0.119 196.1 4.895 12.16 43.91 0.943 2.343 6.17 0.07 0.174 112 6.073 15.09 18.1 0.383 0.951 5.667 0.021 0.051
189.6 193.4 205.1 5.245 13.03 45.82 1.295 3.218 6.14 0.067 0.166 121.9 3.218 7.993 18.75 0.522 1.297 5.78 0.028 0.07
189.8 193.6 285.3 3.592 8.923 89.2 0.458 1.137 6.20 0.083 0.207 151.8 11.84 29.4 48.01 4.528 11.25 6.373 0.031 0.077 173.6 29.46 73.19 38.01 3.093 7.684 5.46 0.091 0.226
193.6 197.4 178.7 13.22 32.84 43.95 3.853 9.57 6.153 0.041 0.102 92.59 2.867 7.123 17.56 0.843 2.094 5.707 0.084 0.208
197.6 201.4 192.9 15.06 37.42 45.35 2.754 6.841 6.15 0.037 0.093 105.3 2.492 22.39 16.82 1.929 17.33 5.733 0.009 0.023
201.6 205.4 279.7 1.058 2.628 88.2 0.464 1.152 6.09 0.017 0.042 202.3 12.11 30.08 45.41 1.93 4.795 6.147 0.019 0.047 111.8 3.006 7.467 15.67 1.32 3.28 5.8 0.008 0.02
205.6 209.4 202.5 8.556 21.25 44.95 2.365 5.875 6.137 0.021 0.051 117 4.551 11.31 15.13 1.565 3.888 5.793 0.017 0.042
205.8 209.6 283.0 1.833 4.554 89.4 0.568 1.412 6.20 0.045 0.112 173.7 6.5 16.15 39.41 1.164 2.893 6.363 0.012 0.031 127.5 10.47 26 24.27 0.783 1.944 5.617 0.04 0.1
209.6 213.4 197.9 12.55 31.16 39.25 3.023 7.509 6.26 0.037 0.093 100.2 6.256 15.54 11.06 0.254 0.63 5.827 0.031 0.077
213.6 217.4 206.3 8.783 21.82 41.12 1.666 4.138 6.21 0.07 0.173 111.4 6.31 15.67 11.81 0.12 0.299 5.743 0.054 0.135
217.6 221.4 289.9 4.361 10.83 91.2 1.852 4.6 6.24 0.078 0.193 215.1 7.893 19.61 43.12 1.751 4.349 6.247 0.029 0.071 118.6 5.792 14.39 12.08 0.368 0.914 5.863 0.021 0.051
221.6 225.4 215.3 4.722 11.73 43.63 1.135 2.819 6.257 0.062 0.155 123.9 4.813 11.96 12.33 0.79 1.961 5.887 0.029 0.071
221.8 225.6 286.4 5.44 13.51 86.6 0.972 2.414 5.33 0.042 0.105 501.4 19.8 49.2 79.29 4.724 11.73 6.097 0.037 0.091 266.8 17.9 44.47 12.1 2.117 5.258 5.613 0.017 0.042
225.6 229.4 444.4 18.49 45.94 148.3 2.935 7.292 5.837 0.031 0.077 282.4 15.8 39.24 19.72 1.93 4.794 5.563 0.012 0.031
229.6 233.4 388.9 14.6 36.27 134.6 3.69 9.165 5.733 0.012 0.031 282.7 8.975 22.3 25.48 1.973 4.902 5.523 0.029 0.071
233.6 237.4 287.5 6.562 16.3 87.8 2.734 6.792 5.33 0.041 0.102 365.8 10.35 25.71 119.2 1.678 4.168 5.65 0.016 0.041 277.5 12.9 32.05 28.5 2.114 5.252 5.48 0.016 0.041
237.6 241.4 346 10.39 25.8 107 1.879 4.667 5.64 0.016 0.041 272.4 12.25 30.43 30.52 2.051 5.095 5.483 0.025 0.062
237.8 241.6 293.3 5.157 12.81 83.1 0.388 0.964 6.24 0.05 0.123 128.7 7.431 18.46 14.38 1.075 2.67 6.26 0.043 0.107 267.4 29.59 73.51 33.85 8.83 21.93 5.323 0.017 0.042
241.6 245.4 187.6 10.8 26.82 20.68 4.079 10.13 6.05 0.042 0.105 160.4 7.916 19.66 13.58 1.469 3.65 5.697 0.074 0.183
245.6 249.4 203.3 5.05 12.54 24.66 1.907 4.737 6.14 0.014 0.035 162.1 4.939 12.27 15.12 0.807 2.004 5.82 0.014 0.035
249.6 253.4 301.8 4.631 11.5 86.1 0.321 0.798 6.18 0.025 0.062 221.3 1.862 4.626 28.42 2.744 6.818 6.187 0.012 0.031 157.3 3.626 9.008 13.61 0.496 1.231 5.85 0.05 0.123
253.6 257.4 227.2 10.72 26.62 29.68 2.518 6.255 6.153 0.052 0.13 156.8 2.377 5.904 13.25 0.665 1.652 5.843 0.039 0.096
253.8 257.6 300.5 2.52 6.261 87.4 2.014 5.003 6.27 0.012 0.031 167.4 5.639 14.01 32.24 1.407 3.496 6.32 0.016 0.041 155.1 13.74 34.14 17.43 2.325 5.775 5.55 0.022 0.054
257.6 261.4 202.9 1.223 10.99 23.34 16.51 41.02 6.117 0.026 0.065 124.4 5.476 13.6 13.4 1.195 2.968 5.78 0.043 0.107
261.6 265.4 217 12.37 30.72 39.83 2.279 5.662 6.173 0.041 0.102 135 1.512 3.756 14.2 0.651 1.618 5.88 0.008 0.02
265.6 269.4 297.7 0.534 1.327 86.2 0.491 1.221 6.27 0.031 0.077 232.8 7.428 18.45 45.52 2.908 7.224 6.237 0.04 0.1 148 4.484 11.14 16.66 1.674 4.159 5.88 0.041 0.101
269.6 273.4 228.4 7.711 19.16 42.56 0.722 1.794 6.197 0.019 0.047 151.2 9.07 22.53 16.2 2.03 5.042 5.917 0.045 0.112
269.8 273.6 289.4 4.604 11.44 86.4 1.587 3.942 6.23 0.031 0.077 186.3 6.362 15.8 38.05 1.073 2.666 6.257 0.037 0.091 130.2 17.84 44.31 20.43 2.699 6.704 5.68 0.051 0.127
273.6 277.4 201.3 9.351 23.23 39.05 0.659 1.637 6.14 0.022 0.054 114.2 8.905 22.12 12.52 1.169 2.904 5.767 0.088 0.219
277.6 281.4 218.9 8.293 20.6 43.66 1.63 4.049 6.15 0.029 0.073 132.7 7.116 17.68 13.35 1.419 3.525 5.867 0.017 0.042
281.6 285.4 277.8 5.971 14.83 82.7 2.271 5.642 6.15 0.021 0.051 224.7 5.975 14.84 45.16 0.728 1.808 6.2 0.045 0.113 135.6 8.974 22.29 13.17 1.021 2.536 5.87 0.057 0.142
285.6 289.4 225.3 4.405 10.94 45.2 0.658 1.634 6.193 0.017 0.042 145 8.477 21.06 14.03 1.324 3.288 5.923 0.073 0.182
285.8 289.6 283.3 4.654 11.56 84.3 1.046 2.599 6.16 0.021 0.051 201.6 8.442 20.97 20.35 1.647 4.092 6.21 0.028 0.07 124.3 13.61 33.8 5.102 1.225 3.044 5.78 0.016 0.041
289.6 293.4 224.4 1.15 2.858 30.2 2.782 6.91 6.153 0.026 0.065 130 10.45 25.96 6.138 1.189 2.954 5.86 0.049 0.122
293.6 297.4 229.3 2.249 5.587 35.77 1.615 4.011 6.173 0.042 0.104 142.7 10.12 25.14 8.275 1.697 4.217 5.91 0.022 0.054
297.6 301.4 287.8 7.241 17.99 84.9 2.354 5.848 6.18 0.028 0.07 231 1.213 3.014 37.92 0.92 2.286 6.223 0.033 0.082 149.9 7.827 19.44 9.666 1.444 3.588 5.963 0.046 0.115
301.6 305.4 236 3.897 9.68 42.86 3.145 7.812 6.167 0.012 0.031 156.9 9.695 24.08 10.88 1.319 3.276 5.99 0.024 0.061
301.8 305.6 289.5 8.057 20.02 83.3 1.977 4.91 6.25 0.041 0.102 179.8 35.44 88.05 32.12 11.5 28.57 6.267 0.005 0.012 156.5 30.64 76.11 23.9 11.02 27.39 5.77 0.075 0.186
305.6 309.4 222.4 3.9 9.689 41.26 1.199 2.979 6.133 0.019 0.047 129.8 4.687 11.64 10.31 0.792 1.968 5.853 0.052 0.129
309.6 313.4 228.2 4.61 11.45 44.16 1.29 3.205 6.13 0.028 0.07 144.1 6.272 15.58 11.27 0.875 2.174 5.863 0.053 0.132
313.6 317.4 293.0 6.68 16.59 85.5 2.484 6.172 6.15 0.024 0.061 234.5 6.222 15.46 45.91 0.755 1.876 6.143 0.012 0.031 149.6 8.278 20.56 12.02 1.156 2.871 5.933 0.024 0.059
317.6 321.4 229.7 2.292 5.695 45.84 0.34 0.844 6.167 0.012 0.031 157 3.099 7.698 12.84 0.534 1.327 5.947 0.037 0.091
317.8 321.6 294.2 7.754 19.26 83.6 2.127 5.284 6.22 0.024 0.061 217.4 7.789 19.35 23.05 0.834 2.072 6.257 0.04 0.1 137 1.882 4.676 4.576 0.454 1.127 5.7 0.008 0.02
325.6 329.4 230.1 3.65 9.066 36.1 2.648 6.577 6.11 0.045 0.113 155.4 6.849 17.01 7.875 0.585 1.454 5.83 0.051 0.127
333.6 337.4 237.3 5.987 14.87 42.46 2.187 5.433 6.173 0.058 0.144 166.3 3.728 9.262 10.47 0.666 1.655 5.87 0.059 0.146
333.8 337.6 286.4 0.813 2.021 83.6 0.297 0.739 6.24 0.005 0.012 212.5 8.022 19.93 41.75 3.035 7.539 6.277 0.024 0.059 139.1 4.893 12.16 11.82 0.987 2.453 5.687 0.09 0.223
341.6 345.4 228.4 4.7 11.68 47.6 0.857 2.129 6.127 0.074 0.184 144.2 2.529 6.283 10.93 1.325 3.292 5.737 0.119 0.296
349.6 353.4 231.4 6.657 16.54 48.69 2.877 7.147 6.177 0.069 0.173 155.9 10.15 25.2 13.11 2.234 5.548 5.917 0.039 0.096
349.8 353.6 280.2 0.4 0.993 81.9 0.491 1.221 6.08 0.06 0.15 212.9 5.931 14.73 25.95 1.858 4.616 6.217 0.058 0.144 227.7 17.26 42.87 15.55 2.312 5.743 5.71 0.008 0.02
357.6 361.4 239.8 5.367 13.33 43 4.222 10.49 6.103 0.025 0.062 162.6 2.127 5.284 8.585 1.134 2.817 5.9 0.016 0.041
365.6 369.4 242.7 3.982 9.893 48.98 2.109 5.24 6.34 0.21 0.522 173.1 3.728 9.261 11.77 1.256 3.121 5.94 0.073 0.18
365.8 369.6 284.9 4.302 10.69 81.3 0.939 2.332 6.25 0.042 0.105 202.4 3.003 7.46 38.22 1.634 4.06 6.257 0.009 0.023 153.3 2.66 6.609 13.41 0.847 2.104 5.85 0.107 0.265
373.6 377.4 227.4 5.365 13.33 47.62 1.804 4.482 6.187 0.047 0.117 157.5 5.607 13.93 11.94 2.757 6.849 5.983 0.074 0.184
381.6 385.4 237.7 4.626 11.49 51.79 2.153 5.348 6.157 0.038 0.094 172.4 0.748 1.859 14.34 1.744 4.331 6.023 0.033 0.082
381.8 385.6 281.8 7.032 17.47 82.7 1.296 3.219 6.28 0.094 0.234 212.6 6.997 17.38 30.66 1.591 3.953 6.177 0.197 0.489 169.3 4.218 10.48 6.384 0.625 1.551 5.633 0.218 0.541
389.6 393.4 232.1 4.984 12.38 45.72 3.511 8.723 6.16 0.014 0.035 170.2 0.866 2.15 10.12 1.007 2.501 5.963 0.026 0.065
397.6 401.4 239.4 8.06 20.02 50.29 2.876 7.144 6.313 0.07 0.175 174.4 11.63 28.88 12.05 2.746 6.821 6 0.092 0.229
397.8 401.6 269.0 5.21 12.94 82.1 1.351 3.355 6.44 0.15 0.372 211.7 1.865 4.632 33.59 1.74 4.322 6.267 0.025 0.062 213.2 30.68 76.2 17.81 2.429 6.033 5.787 0.059 0.147
405.6 409.4 231.7 1.721 4.274 46.3 2.29 5.69 6.16 0.029 0.073 158.6 8.686 21.58 10.3 2.036 5.058 5.96 0.054 0.133
413.6 417.4 234.8 0.664 1.651 50.85 1.647 4.091 6.21 0.156 0.387 174.6 7.026 17.45 13.7 2.309 5.735 5.993 0.079 0.197
413.8 417.6 273.5 1.657 4.117 81.2 0.381 0.947 6.18 0.049 0.122 219.9 2.019 5.014 36.42 1.033 2.566 6.177 0.017 0.042 165 14.5 36.01 10.79 1.244 3.089 5.947 0.049 0.122
421.6 425.4 232.5 4.232 10.51 48.19 1.117 2.774 6.11 0.022 0.054 167 5.532 13.74 9.847 2.041 5.07 5.943 0.012 0.031
429.6 433.4 235.5 5.999 14.9 52.76 3.549 8.817 6.14 0.036 0.088 178.6 10.56 26.23 12.59 1.476 3.667 5.963 0.017 0.042
34 16
35 17
27 13
28 14
30 15
20 10
21 11
22 12
17 7
18 8
19 9
4 4
5 5
16 6
1 1
2 2
3 3
Zn Cu pH Zn Cu pHDay Event
Ave. Cum Vol . Zn Cu pH
Phase I I ‐ Non fi l tered Average Influent Average Biochar Average Torrefied Wood

74
Table 20. High flow and deicer flush column data.
Table 21. Acid extraction data table for biochar (BC) and torrefied wood (TW). Crossed out values were considered outliers and omitted from calculations. “Rock” refers to the covering layer of pea gravel.
Gal. Liters μg/L (stdev) (95%CI) μg/L (stdev) (95%CI) - (stdev) (95%CI) μg/L (stdev) (95%CI) μg/L (stdev) (95%CI) - (stdev) (95%CI) μg/L (stdev) (95%CI) μg/L (stdev) (95%CI) - (stdev) (95%CI)
429.8 433.6 279.1 5.133 12.75 85.1 2.282 5.668 5.99 0.048 0.119 223.1 7.998 19.87 38.66 1.43 3.553 6.153 0.05 0.124 216.3 19.5 48.44 15.02 2.494 6.195 5.877 0.045 0.112
437.6 441.4 235.9 5.999 14.9 52.46 1.834 4.555 6.023 0.037 0.091 183.1 5.502 13.67 16.52 2.372 5.893 5.877 0.159 0.396
445.6 449.4 237.1 2.221 5.516 54.58 1.293 3.212 5.94 0.033 0.081 182.7 8.855 22 18.38 2.386 5.926 5.643 0.236 0.587
445.8 449.6 274.9 6.867 17.06 83.8 1.333 3.312 6.16 0.029 0.073 215.6 7.196 17.88 36.07 1.257 3.122 6.24 0.029 0.073 264.1 33.03 82.06 21.48 3.181 7.901 5.8 0.073 0.18
449.6 453.4
453.6 457.4
457.6 461.4 240.4 4.623 11.49 50.66 1.824 4.532 6.147 0.054 0.135 178.7 6.679 16.59 15.11 1.496 3.717 6.01 0.016 0.041
461.6 465.4
465.6 469.4 282.8 11.64 28.91 85.5 3.69 9.167 6.21 0.175 0.434
469.6 473.4 222.3 9.209 22.88 54.16 2.554 6.344 6.21 0.099 0.247 172.1 9.247 22.97 20.26 2.479 6.157 5.86 0.227 0.564
473.6 477.4
477.6 481.4 237.2 6.641 16.5 57.06 0.967 2.403 6.15 0.094 0.234 179.7 6.605 16.41 21.08 2.017 5.011 5.97 0.091 0.226
487.6 491.4 288.9 13.57 33.71 83.2 1.326 3.293 6.15 0.092 0.228 212.2 2.429 6.035 50.79 0.735 1.826 5.99 0.071 0.177 179.1 6.338 15.74 28.24 3.826 9.504 5.72 0.071 0.177
503.6 507.4 286.3 13.16 32.68 78.9 1.5 3.727 6.24 0.2 0.498 217 7.013 17.42 33.61 2.12 5.265 5.75 0.202 0.502 175.6 2.361 5.864 14.06 0.624 1.551 5.51 0.219 0.545
509.8 513.6 2.751 0.249 0.618 14.69 0.1 0.249 6.087 0.031 0.077 1936 164.9 409.6 526.3 26.8 66.57 6.187 0.109 0.27 4873 312 776 395 8.3 20.6 4.47 0.14 0.36
513.6 517.4 434.1 54.06 134.3 178 12.98 32.25 6.157 0.18 0.447 1048 87.04 216.2 92.7 6.272 15.6 5.11 0.62 1.55
517.6 521.4 269 13.68 33.99 130.1 6.161 15.31 6.16 0.177 0.439 591 26.05 64.72 63.37 3.162 7.85 5.32 0.58 1.45
521.6 525.4 3.2 0.453 1.126 14.74 0.576 1.43 6.13 0.091 0.226 212.1 17.24 42.84 110.8 7.489 18.6 6.173 0.218 0.542 467.3 46.12 114.6 54.88 4.206 10.4 5.45 0.59 1.47
525.6 529.4 167 8.984 22.32 93.49 4.831 12 6.173 0.169 0.419 347 7.388 18.35 48.63 2.385 5.92 5.55 0.57 1.42
525.8 529.6 259.8 5.251 13.04 73.06 2.883 7.161 6.24 0.036 0.088 354.5 73.28 182 19.2 2.141 5.319 6.05 0.083 0.206 3915 208.3 517.5 40.81 2.269 5.64 5.02 0.11 0.27
529.6 533.4 143.6 14.47 35.96 7.417 3.625 9.006 5.983 0.026 0.065 118 15.21 37.78 4.597 3.634 9.03 5.91 0.13 0.33
533.6 537.4 150.3 3.649 9.065 11.93 0.683 1.698 6.01 0.036 0.088 71.65 2.435 6.05 1.855 0.21 0.52 5.89 0.1 0.24
537.6 541.4 258.7 3.293 8.181 72.49 0.584 1.451 6.167 0.049 0.122 154.4 11.99 29.78 13.31 1.947 4.838 6.05 0.008 0.02 75.2 5.543 13.77 2.188 0.271 0.67 5.95 0.07 0.17
541.6 545.4 133.6 30.88 76.72 10.11 5.051 12.55 6.013 0.052 0.13 105.6 49.74 123.6 7.226 7.617 18.9 6.07 0.03 0.07
Post
Salt
Flush
2 1
3
4X
Flow1 1
Salt
Flush1 1
Cu pH Zn Cu pH
2X
Flow
1 1
2
2
Average Biochar Average Torrefied Wood
Type Day EventAve. Cum Vol. Zn Cu pH Zn
Tests After Phase I I ‐ Non fi l tered Average Influent
# Zn (μg/L) Cu (μg/L) Zn (mg/g) Cu (mg/g) # Zn (μg/L) Cu (μg/L) Zn (mg/g) Cu (mg/g)
Rock 15.1524 0.0 232 12564 4167 0.083 0.028 256 13205 4384 0.087 0.029
Top 1.0056 0.45 233 2742 1848 0.496 0.334 257 2710 1843 0.490 0.333
Mid 1.0071 0.45 234 2617 1232 0.472 0.222 258 2608 1235 0.471 0.223
Btm 1.0104 0.45 235 2346 1060 0.422 0.191 259 2359 1070 0.425 0.192
Rock 15.0311 0.0 236 13169 4648 0.088 0.031 260 13289 4655 0.088 0.031
Top 1.0055 0.45 237 3149 2069 0.569 0.374 261 3148 2087 0.569 0.377
Mid 1.0023 0.45 238 2076 1073 0.377 0.195 262 2228 1158 0.404 0.210
Btm 1.0083 0.45 239 3261 1146 0.588 0.207 263 3336 1171 0.601 0.211
Rock 15.1188 0.0 240 14528 5520 0.096 0.037 264 14970 5631 0.099 0.037
Top 1.0000 0.45 241 2364 1836 0.430 0.334 265 2380 1844 0.433 0.335
Mid 1.0011 0.45 242 2518 1403 0.457 0.255 266 2546 1420 0.462 0.258
Btm 1.007 0.45 243 12654 940 2.285 0.170 267 13001 923 2.347 0.167
Rock 15.0005 0.0 244 13394 4811 0.089 0.032 268 13388 4807 0.089 0.032
Top 1.0116 0.45 245 4257 5083 0.765 0.914 269 4292 5181 0.771 0.931
Mid 1.0177 0.45 246 3177 2505 0.568 0.448 270 3422 2698 0.611 0.482
Btm 1.0084 0.45 247 2749 1249 0.496 0.225 271 3101 1406 0.559 0.254
Rock 15.0273 0.0 248 14422 5134 0.096 0.034 272 14439 5208 0.096 0.035
Top 0.9986 0.45 249 4077 4882 0.742 0.889 273 4087 4886 0.744 0.890
Mid 1.0118 0.45 250 3603 2732 0.647 0.491 274 3826 2939 0.688 0.528
Btm 1.0035 0.45 251 2883 1292 0.522 0.234 275 2884 1311 0.523 0.238
Rock 15.0066 0.0 252 11170 4214 0.074 0.028 276 11375 4239 0.076 0.028
Top 1.0037 0.45 253 50599 3930 9.166 0.712 277 54703 4262 9.909 0.772
Mid 0.9994 0.45 254 3366 2674 0.612 0.487 278 3434 2751 0.625 0.501
Btm 0.9986 0.45 255 3051 1421 0.555 0.259 279 3055 1445 0.556 0.263
Filtered
TW 2
TW 3
Mass (g)LevelColumn
BC 3
TW 1
MC
BC 1
BC 2
UnFiltered
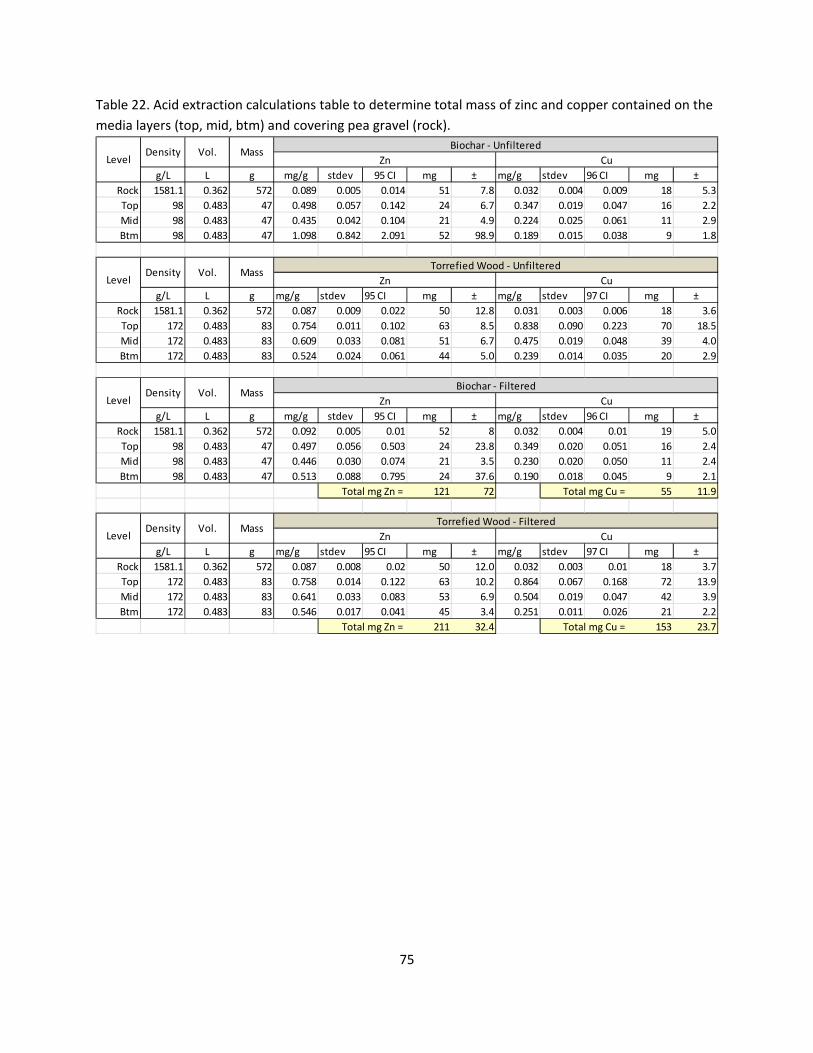
75
Table 22. Acid extraction calculations table to determine total mass of zinc and copper contained on the
media layers (top, mid, btm) and covering pea gravel (rock).
g/L L g mg/g stdev 95 CI mg ± mg/g stdev 96 CI mg ±
Rock 1581.1 0.362 572 0.089 0.005 0.014 51 7.8 0.032 0.004 0.009 18 5.3
Top 98 0.483 47 0.498 0.057 0.142 24 6.7 0.347 0.019 0.047 16 2.2
Mid 98 0.483 47 0.435 0.042 0.104 21 4.9 0.224 0.025 0.061 11 2.9
Btm 98 0.483 47 1.098 0.842 2.091 52 98.9 0.189 0.015 0.038 9 1.8
g/L L g mg/g stdev 95 CI mg ± mg/g stdev 97 CI mg ±
Rock 1581.1 0.362 572 0.087 0.009 0.022 50 12.8 0.031 0.003 0.006 18 3.6
Top 172 0.483 83 0.754 0.011 0.102 63 8.5 0.838 0.090 0.223 70 18.5
Mid 172 0.483 83 0.609 0.033 0.081 51 6.7 0.475 0.019 0.048 39 4.0
Btm 172 0.483 83 0.524 0.024 0.061 44 5.0 0.239 0.014 0.035 20 2.9
g/L L g mg/g stdev 95 CI mg ± mg/g stdev 96 CI mg ±
Rock 1581.1 0.362 572 0.092 0.005 0.01 52 8 0.032 0.004 0.01 19 5.0
Top 98 0.483 47 0.497 0.056 0.503 24 23.8 0.349 0.020 0.051 16 2.4
Mid 98 0.483 47 0.446 0.030 0.074 21 3.5 0.230 0.020 0.050 11 2.4
Btm 98 0.483 47 0.513 0.088 0.795 24 37.6 0.190 0.018 0.045 9 2.1
Total mg Zn = 121 72 Total mg Cu = 55 11.9
g/L L g mg/g stdev 95 CI mg ± mg/g stdev 97 CI mg ±
Rock 1581.1 0.362 572 0.087 0.008 0.02 50 12.0 0.032 0.003 0.01 18 3.7
Top 172 0.483 83 0.758 0.014 0.122 63 10.2 0.864 0.067 0.168 72 13.9
Mid 172 0.483 83 0.641 0.033 0.083 53 6.9 0.504 0.019 0.047 42 3.9
Btm 172 0.483 83 0.546 0.017 0.041 45 3.4 0.251 0.011 0.026 21 2.2
Total mg Zn = 211 32.4 Total mg Cu = 153 23.7
LevelDensity Vol. Mass
Torrefied Wood ‐ Filtered
Zn Cu
LevelDensity Vol. Mass
Biochar ‐ Filtered
Zn Cu
Level
LevelDensity Vol. Mass
Density Vol.Zn
MassCu
Biochar ‐ Unfiltered
Zn Cu
Torrefied Wood ‐ Unfiltered
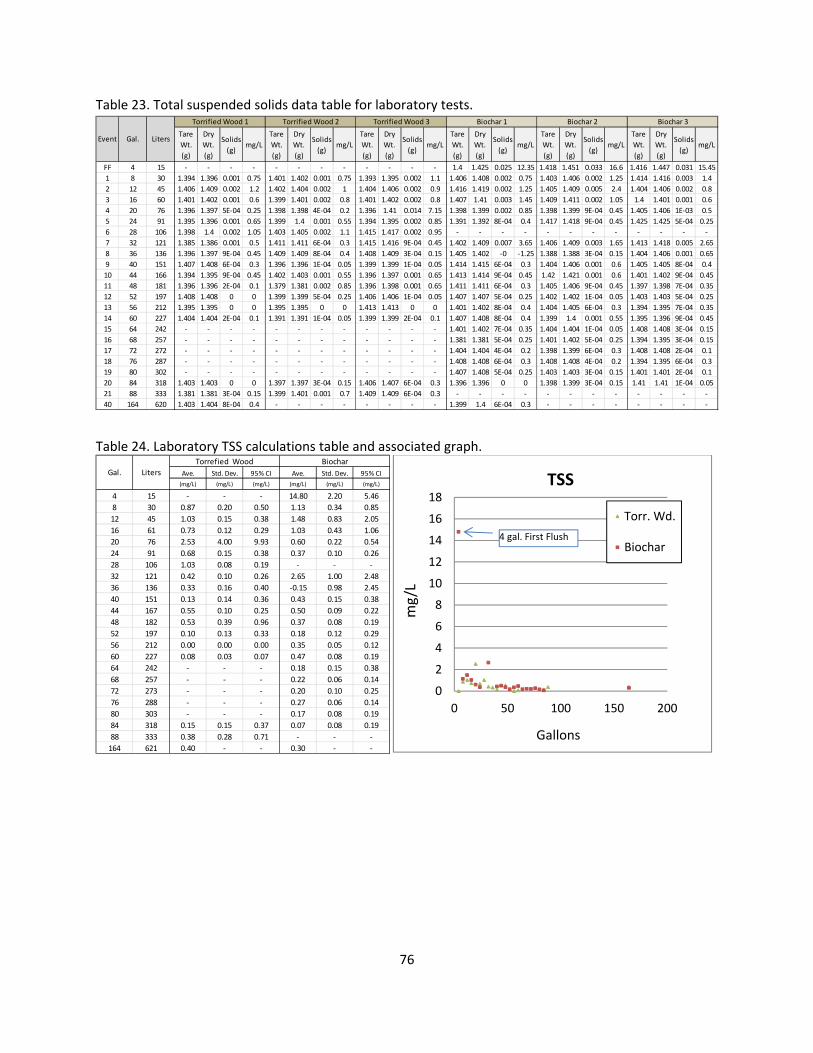
76
Table 23. Total suspended solids data table for laboratory tests.
Table 24. Laboratory TSS calculations table and associated graph.
Tare
Wt.
(g)
Dry
Wt.
(g)
Solids
(g)mg/L
Tare
Wt.
(g)
Dry
Wt.
(g)
Solids
(g)mg/L
Tare
Wt.
(g)
Dry
Wt.
(g)
Solids
(g)mg/L
Tare
Wt.
(g)
Dry
Wt.
(g)
Solids
(g)mg/L
Tare
Wt.
(g)
Dry
Wt.
(g)
Solids
(g)mg/L
Tare
Wt.
(g)
Dry
Wt.
(g)
Solids
(g)mg/L
FF 4 15 ‐ ‐ ‐ ‐ ‐ ‐ ‐ ‐ ‐ ‐ ‐ ‐ 1.4 1.425 0.025 12.35 1.418 1.451 0.033 16.6 1.416 1.447 0.031 15.45
1 8 30 1.394 1.396 0.001 0.75 1.401 1.402 0.001 0.75 1.393 1.395 0.002 1.1 1.406 1.408 0.002 0.75 1.403 1.406 0.002 1.25 1.414 1.416 0.003 1.4
2 12 45 1.406 1.409 0.002 1.2 1.402 1.404 0.002 1 1.404 1.406 0.002 0.9 1.416 1.419 0.002 1.25 1.405 1.409 0.005 2.4 1.404 1.406 0.002 0.8
3 16 60 1.401 1.402 0.001 0.6 1.399 1.401 0.002 0.8 1.401 1.402 0.002 0.8 1.407 1.41 0.003 1.45 1.409 1.411 0.002 1.05 1.4 1.401 0.001 0.6
4 20 76 1.396 1.397 5E‐04 0.25 1.398 1.398 4E‐04 0.2 1.396 1.41 0.014 7.15 1.398 1.399 0.002 0.85 1.398 1.399 9E‐04 0.45 1.405 1.406 1E‐03 0.5
5 24 91 1.395 1.396 0.001 0.65 1.399 1.4 0.001 0.55 1.394 1.395 0.002 0.85 1.391 1.392 8E‐04 0.4 1.417 1.418 9E‐04 0.45 1.425 1.425 5E‐04 0.25
6 28 106 1.398 1.4 0.002 1.05 1.403 1.405 0.002 1.1 1.415 1.417 0.002 0.95 ‐ ‐ ‐ ‐ ‐ ‐ ‐ ‐ ‐ ‐ ‐ ‐
7 32 121 1.385 1.386 0.001 0.5 1.411 1.411 6E‐04 0.3 1.415 1.416 9E‐04 0.45 1.402 1.409 0.007 3.65 1.406 1.409 0.003 1.65 1.413 1.418 0.005 2.65
8 36 136 1.396 1.397 9E‐04 0.45 1.409 1.409 8E‐04 0.4 1.408 1.409 3E‐04 0.15 1.405 1.402 ‐0 ‐1.25 1.388 1.388 3E‐04 0.15 1.404 1.406 0.001 0.65
9 40 151 1.407 1.408 6E‐04 0.3 1.396 1.396 1E‐04 0.05 1.399 1.399 1E‐04 0.05 1.414 1.415 6E‐04 0.3 1.404 1.406 0.001 0.6 1.405 1.405 8E‐04 0.4
10 44 166 1.394 1.395 9E‐04 0.45 1.402 1.403 0.001 0.55 1.396 1.397 0.001 0.65 1.413 1.414 9E‐04 0.45 1.42 1.421 0.001 0.6 1.401 1.402 9E‐04 0.45
11 48 181 1.396 1.396 2E‐04 0.1 1.379 1.381 0.002 0.85 1.396 1.398 0.001 0.65 1.411 1.411 6E‐04 0.3 1.405 1.406 9E‐04 0.45 1.397 1.398 7E‐04 0.35
12 52 197 1.408 1.408 0 0 1.399 1.399 5E‐04 0.25 1.406 1.406 1E‐04 0.05 1.407 1.407 5E‐04 0.25 1.402 1.402 1E‐04 0.05 1.403 1.403 5E‐04 0.25
13 56 212 1.395 1.395 0 0 1.395 1.395 0 0 1.413 1.413 0 0 1.401 1.402 8E‐04 0.4 1.404 1.405 6E‐04 0.3 1.394 1.395 7E‐04 0.35
14 60 227 1.404 1.404 2E‐04 0.1 1.391 1.391 1E‐04 0.05 1.399 1.399 2E‐04 0.1 1.407 1.408 8E‐04 0.4 1.399 1.4 0.001 0.55 1.395 1.396 9E‐04 0.45
15 64 242 ‐ ‐ ‐ ‐ ‐ ‐ ‐ ‐ ‐ ‐ ‐ ‐ 1.401 1.402 7E‐04 0.35 1.404 1.404 1E‐04 0.05 1.408 1.408 3E‐04 0.15
16 68 257 ‐ ‐ ‐ ‐ ‐ ‐ ‐ ‐ ‐ ‐ ‐ ‐ 1.381 1.381 5E‐04 0.25 1.401 1.402 5E‐04 0.25 1.394 1.395 3E‐04 0.15
17 72 272 ‐ ‐ ‐ ‐ ‐ ‐ ‐ ‐ ‐ ‐ ‐ ‐ 1.404 1.404 4E‐04 0.2 1.398 1.399 6E‐04 0.3 1.408 1.408 2E‐04 0.1
18 76 287 ‐ ‐ ‐ ‐ ‐ ‐ ‐ ‐ ‐ ‐ ‐ ‐ 1.408 1.408 6E‐04 0.3 1.408 1.408 4E‐04 0.2 1.394 1.395 6E‐04 0.3
19 80 302 ‐ ‐ ‐ ‐ ‐ ‐ ‐ ‐ ‐ ‐ ‐ ‐ 1.407 1.408 5E‐04 0.25 1.403 1.403 3E‐04 0.15 1.401 1.401 2E‐04 0.1
20 84 318 1.403 1.403 0 0 1.397 1.397 3E‐04 0.15 1.406 1.407 6E‐04 0.3 1.396 1.396 0 0 1.398 1.399 3E‐04 0.15 1.41 1.41 1E‐04 0.05
21 88 333 1.381 1.381 3E‐04 0.15 1.399 1.401 0.001 0.7 1.409 1.409 6E‐04 0.3 ‐ ‐ ‐ ‐ ‐ ‐ ‐ ‐ ‐ ‐ ‐ ‐
40 164 620 1.403 1.404 8E‐04 0.4 ‐ ‐ ‐ ‐ ‐ ‐ ‐ ‐ 1.399 1.4 6E‐04 0.3 ‐ ‐ ‐ ‐ ‐ ‐ ‐ ‐
Event Gal.
Torrified Wood 1 Torrified Wood 2 Torrified Wood 3 Biochar 1 Biochar 2 Biochar 3
Liters
Ave. Std. Dev. 95% CI Ave. Std. Dev. 95% CI
(mg/L) (mg/L) (mg/L) (mg/L) (mg/L) (mg/L)
4 15 ‐ ‐ ‐ 14.80 2.20 5.46
8 30 0.87 0.20 0.50 1.13 0.34 0.85
12 45 1.03 0.15 0.38 1.48 0.83 2.05
16 61 0.73 0.12 0.29 1.03 0.43 1.06
20 76 2.53 4.00 9.93 0.60 0.22 0.54
24 91 0.68 0.15 0.38 0.37 0.10 0.26
28 106 1.03 0.08 0.19 ‐ ‐ ‐
32 121 0.42 0.10 0.26 2.65 1.00 2.48
36 136 0.33 0.16 0.40 ‐0.15 0.98 2.45
40 151 0.13 0.14 0.36 0.43 0.15 0.38
44 167 0.55 0.10 0.25 0.50 0.09 0.22
48 182 0.53 0.39 0.96 0.37 0.08 0.19
52 197 0.10 0.13 0.33 0.18 0.12 0.29
56 212 0.00 0.00 0.00 0.35 0.05 0.12
60 227 0.08 0.03 0.07 0.47 0.08 0.19
64 242 ‐ ‐ ‐ 0.18 0.15 0.38
68 257 ‐ ‐ ‐ 0.22 0.06 0.14
72 273 ‐ ‐ ‐ 0.20 0.10 0.25
76 288 ‐ ‐ ‐ 0.27 0.06 0.14
80 303 ‐ ‐ ‐ 0.17 0.08 0.19
84 318 0.15 0.15 0.37 0.07 0.08 0.19
88 333 0.38 0.28 0.71 ‐ ‐ ‐
164 621 0.40 ‐ ‐ 0.30 ‐ ‐
Torrefied Wood Biochar
Gal. Liters
0
2
4
6
8
10
12
14
16
18
0 50 100 150 200
mg/L
Gallons
TSS
Torr. Wd.
Biochar4 gal. First Flush
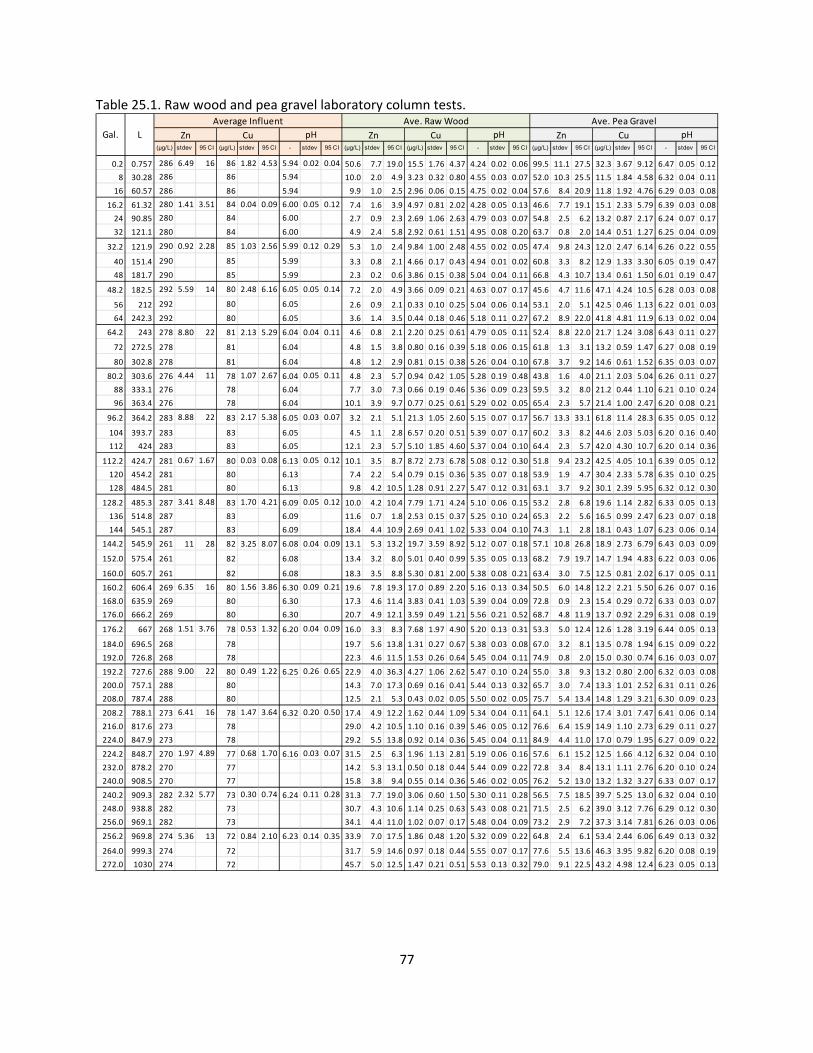
77
Table 25.1. Raw wood and pea gravel laboratory column tests.
(µg/L) stdev 95 CI (µg/L) stdev 95 CI - stdev 95 CI (µg/L) stdev 95 CI (µg/L) stdev 95 CI - stdev 95 CI (µg/L) stdev 95 CI (µg/L) stdev 95 CI - stdev 95 CI
0.2 0.757 286 6.49 16 86 1.82 4.53 5.94 0.02 0.04 50.6 7.7 19.0 15.5 1.76 4.37 4.24 0.02 0.06 99.5 11.1 27.5 32.3 3.67 9.12 6.47 0.05 0.12
8 30.28 286 86 5.94 10.0 2.0 4.9 3.23 0.32 0.80 4.55 0.03 0.07 52.0 10.3 25.5 11.5 1.84 4.58 6.32 0.04 0.11
16 60.57 286 86 5.94 9.9 1.0 2.5 2.96 0.06 0.15 4.75 0.02 0.04 57.6 8.4 20.9 11.8 1.92 4.76 6.29 0.03 0.08
16.2 61.32 280 1.41 3.51 84 0.04 0.09 6.00 0.05 0.12 7.4 1.6 3.9 4.97 0.81 2.02 4.28 0.05 0.13 46.6 7.7 19.1 15.1 2.33 5.79 6.39 0.03 0.08
24 90.85 280 84 6.00 2.7 0.9 2.3 2.69 1.06 2.63 4.79 0.03 0.07 54.8 2.5 6.2 13.2 0.87 2.17 6.24 0.07 0.17
32 121.1 280 84 6.00 4.9 2.4 5.8 2.92 0.61 1.51 4.95 0.08 0.20 63.7 0.8 2.0 14.4 0.51 1.27 6.25 0.04 0.09
32.2 121.9 290 0.92 2.28 85 1.03 2.56 5.99 0.12 0.29 5.3 1.0 2.4 9.84 1.00 2.48 4.55 0.02 0.05 47.4 9.8 24.3 12.0 2.47 6.14 6.26 0.22 0.55
40 151.4 290 85 5.99 3.3 0.8 2.1 4.66 0.17 0.43 4.94 0.01 0.02 60.8 3.3 8.2 12.9 1.33 3.30 6.05 0.19 0.47
48 181.7 290 85 5.99 2.3 0.2 0.6 3.86 0.15 0.38 5.04 0.04 0.11 66.8 4.3 10.7 13.4 0.61 1.50 6.01 0.19 0.47
48.2 182.5 292 5.59 14 80 2.48 6.16 6.05 0.05 0.14 7.2 2.0 4.9 3.66 0.09 0.21 4.63 0.07 0.17 45.6 4.7 11.6 47.1 4.24 10.5 6.28 0.03 0.08
56 212 292 80 6.05 2.6 0.9 2.1 0.33 0.10 0.25 5.04 0.06 0.14 53.1 2.0 5.1 42.5 0.46 1.13 6.22 0.01 0.03
64 242.3 292 80 6.05 3.6 1.4 3.5 0.44 0.18 0.46 5.18 0.11 0.27 67.2 8.9 22.0 41.8 4.81 11.9 6.13 0.02 0.04
64.2 243 278 8.80 22 81 2.13 5.29 6.04 0.04 0.11 4.6 0.8 2.1 2.20 0.25 0.61 4.79 0.05 0.11 52.4 8.8 22.0 21.7 1.24 3.08 6.43 0.11 0.27
72 272.5 278 81 6.04 4.8 1.5 3.8 0.80 0.16 0.39 5.18 0.06 0.15 61.8 1.3 3.1 13.2 0.59 1.47 6.27 0.08 0.19
80 302.8 278 81 6.04 4.8 1.2 2.9 0.81 0.15 0.38 5.26 0.04 0.10 67.8 3.7 9.2 14.6 0.61 1.52 6.35 0.03 0.07
80.2 303.6 276 4.44 11 78 1.07 2.67 6.04 0.05 0.11 4.8 2.3 5.7 0.94 0.42 1.05 5.28 0.19 0.48 43.8 1.6 4.0 21.1 2.03 5.04 6.26 0.11 0.27
88 333.1 276 78 6.04 7.7 3.0 7.3 0.66 0.19 0.46 5.36 0.09 0.23 59.5 3.2 8.0 21.2 0.44 1.10 6.21 0.10 0.24
96 363.4 276 78 6.04 10.1 3.9 9.7 0.77 0.25 0.61 5.29 0.02 0.05 65.4 2.3 5.7 21.4 1.00 2.47 6.20 0.08 0.21
96.2 364.2 283 8.88 22 83 2.17 5.38 6.05 0.03 0.07 3.2 2.1 5.1 21.3 1.05 2.60 5.15 0.07 0.17 56.7 13.3 33.1 61.8 11.4 28.3 6.35 0.05 0.12
104 393.7 283 83 6.05 4.5 1.1 2.8 6.57 0.20 0.51 5.39 0.07 0.17 60.2 3.3 8.2 44.6 2.03 5.03 6.20 0.16 0.40
112 424 283 83 6.05 12.1 2.3 5.7 5.10 1.85 4.60 5.37 0.04 0.10 64.4 2.3 5.7 42.0 4.30 10.7 6.20 0.14 0.36
112.2 424.7 281 0.67 1.67 80 0.03 0.08 6.13 0.05 0.12 10.1 3.5 8.7 8.72 2.73 6.78 5.08 0.12 0.30 51.8 9.4 23.2 42.5 4.05 10.1 6.39 0.05 0.12
120 454.2 281 80 6.13 7.4 2.2 5.4 0.79 0.15 0.36 5.35 0.07 0.18 53.9 1.9 4.7 30.4 2.33 5.78 6.35 0.10 0.25
128 484.5 281 80 6.13 9.8 4.2 10.5 1.28 0.91 2.27 5.47 0.12 0.31 63.1 3.7 9.2 30.1 2.39 5.95 6.32 0.12 0.30
128.2 485.3 287 3.41 8.48 83 1.70 4.21 6.09 0.05 0.12 10.0 4.2 10.4 7.79 1.71 4.24 5.10 0.06 0.15 53.2 2.8 6.8 19.6 1.14 2.82 6.33 0.05 0.13
136 514.8 287 83 6.09 11.6 0.7 1.8 2.53 0.15 0.37 5.25 0.10 0.24 65.3 2.2 5.6 16.5 0.99 2.47 6.23 0.07 0.18
144 545.1 287 83 6.09 18.4 4.4 10.9 2.69 0.41 1.02 5.33 0.04 0.10 74.3 1.1 2.8 18.1 0.43 1.07 6.23 0.06 0.14
144.2 545.9 261 11 28 82 3.25 8.07 6.08 0.04 0.09 13.1 5.3 13.2 19.7 3.59 8.92 5.12 0.07 0.18 57.1 10.8 26.8 18.9 2.73 6.79 6.43 0.03 0.09
152.0 575.4 261 82 6.08 13.4 3.2 8.0 5.01 0.40 0.99 5.35 0.05 0.13 68.2 7.9 19.7 14.7 1.94 4.83 6.22 0.03 0.06
160.0 605.7 261 82 6.08 18.3 3.5 8.8 5.30 0.81 2.00 5.38 0.08 0.21 63.4 3.0 7.5 12.5 0.81 2.02 6.17 0.05 0.11
160.2 606.4 269 6.35 16 80 1.56 3.86 6.30 0.09 0.21 19.6 7.8 19.3 17.0 0.89 2.20 5.16 0.13 0.34 50.5 6.0 14.8 12.2 2.21 5.50 6.26 0.07 0.16
168.0 635.9 269 80 6.30 17.3 4.6 11.4 3.83 0.41 1.03 5.39 0.04 0.09 72.8 0.9 2.3 15.4 0.29 0.72 6.33 0.03 0.07
176.0 666.2 269 80 6.30 20.7 4.9 12.1 3.59 0.49 1.21 5.56 0.21 0.52 68.7 4.8 11.9 13.7 0.92 2.29 6.31 0.08 0.19
176.2 667 268 1.51 3.76 78 0.53 1.32 6.20 0.04 0.09 16.0 3.3 8.3 7.68 1.97 4.90 5.20 0.13 0.31 53.3 5.0 12.4 12.6 1.28 3.19 6.44 0.05 0.13
184.0 696.5 268 78 19.7 5.6 13.8 1.31 0.27 0.67 5.38 0.03 0.08 67.0 3.2 8.1 13.5 0.78 1.94 6.15 0.09 0.22
192.0 726.8 268 78 22.3 4.6 11.5 1.53 0.26 0.64 5.45 0.04 0.11 74.9 0.8 2.0 15.0 0.30 0.74 6.16 0.03 0.07
192.2 727.6 288 9.00 22 80 0.49 1.22 6.25 0.26 0.65 22.9 4.0 36.3 4.27 1.06 2.62 5.47 0.10 0.24 55.0 3.8 9.3 13.2 0.80 2.00 6.32 0.03 0.08
200.0 757.1 288 80 14.3 7.0 17.3 0.69 0.16 0.41 5.44 0.13 0.32 65.7 3.0 7.4 13.3 1.01 2.52 6.31 0.11 0.26
208.0 787.4 288 80 12.5 2.1 5.3 0.43 0.02 0.05 5.50 0.02 0.05 75.7 5.4 13.4 14.8 1.29 3.21 6.30 0.09 0.23
208.2 788.1 273 6.41 16 78 1.47 3.64 6.32 0.20 0.50 17.4 4.9 12.2 1.62 0.44 1.09 5.34 0.04 0.11 64.1 5.1 12.6 17.4 3.01 7.47 6.41 0.06 0.14
216.0 817.6 273 78 29.0 4.2 10.5 1.10 0.16 0.39 5.46 0.05 0.12 76.6 6.4 15.9 14.9 1.10 2.73 6.29 0.11 0.27
224.0 847.9 273 78 29.2 5.5 13.8 0.92 0.14 0.36 5.45 0.04 0.11 84.9 4.4 11.0 17.0 0.79 1.95 6.27 0.09 0.22
224.2 848.7 270 1.97 4.89 77 0.68 1.70 6.16 0.03 0.07 31.5 2.5 6.3 1.96 1.13 2.81 5.19 0.06 0.16 57.6 6.1 15.2 12.5 1.66 4.12 6.32 0.04 0.10
232.0 878.2 270 77 14.2 5.3 13.1 0.50 0.18 0.44 5.44 0.09 0.22 72.8 3.4 8.4 13.1 1.11 2.76 6.20 0.10 0.24
240.0 908.5 270 77 15.8 3.8 9.4 0.55 0.14 0.36 5.46 0.02 0.05 76.2 5.2 13.0 13.2 1.32 3.27 6.33 0.07 0.17
240.2 909.3 282 2.32 5.77 73 0.30 0.74 6.24 0.11 0.28 31.3 7.7 19.0 3.06 0.60 1.50 5.30 0.11 0.28 56.5 7.5 18.5 39.7 5.25 13.0 6.32 0.04 0.10
248.0 938.8 282 73 30.7 4.3 10.6 1.14 0.25 0.63 5.43 0.08 0.21 71.5 2.5 6.2 39.0 3.12 7.76 6.29 0.12 0.30
256.0 969.1 282 73 34.1 4.4 11.0 1.02 0.07 0.17 5.48 0.04 0.09 73.2 2.9 7.2 37.3 3.14 7.81 6.26 0.03 0.06
256.2 969.8 274 5.36 13 72 0.84 2.10 6.23 0.14 0.35 33.9 7.0 17.5 1.86 0.48 1.20 5.32 0.09 0.22 64.8 2.4 6.1 53.4 2.44 6.06 6.49 0.13 0.32
264.0 999.3 274 72 31.7 5.9 14.6 0.97 0.18 0.44 5.55 0.07 0.17 77.6 5.5 13.6 46.3 3.95 9.82 6.20 0.08 0.19
272.0 1030 274 72 45.7 5.0 12.5 1.47 0.21 0.51 5.53 0.13 0.32 79.0 9.1 22.5 43.2 4.98 12.4 6.23 0.05 0.13
L Zn Cu
Average Influent
pH
Ave. Raw Wood
pHZn Cu Zn Cu pH
Ave. Pea Gravel
Gal.
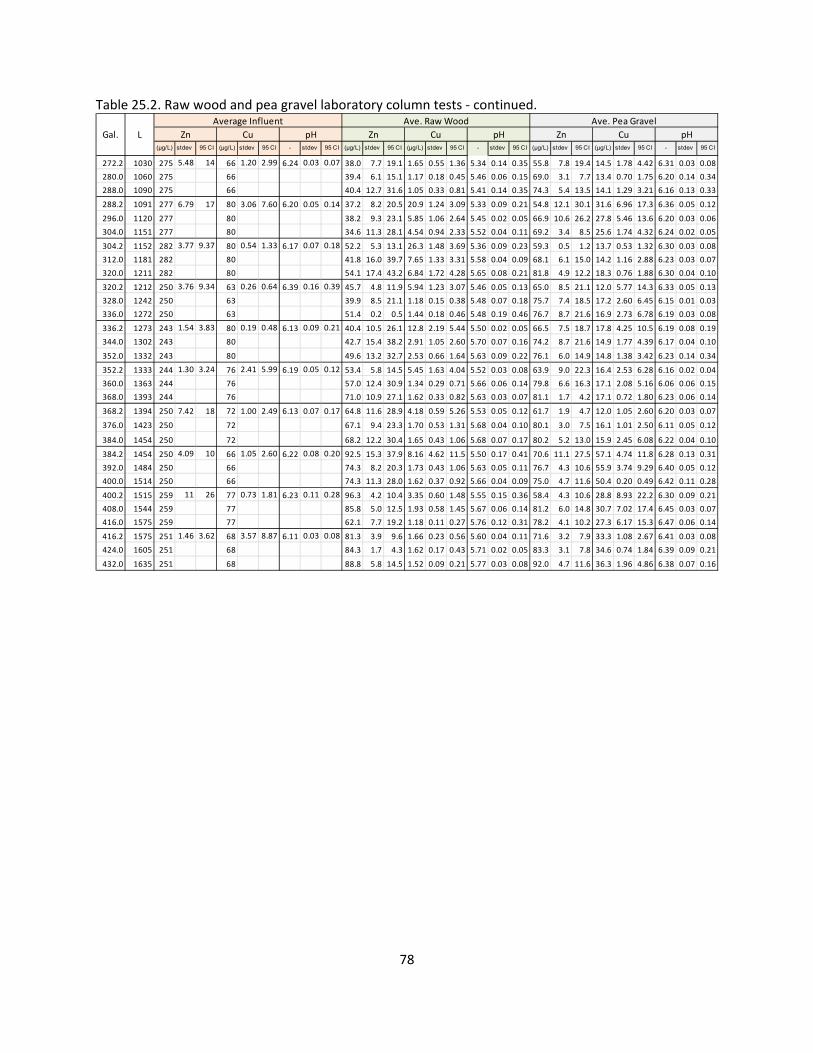
78
Table 25.2. Raw wood and pea gravel laboratory column tests ‐ continued.
(µg/L) stdev 95 CI (µg/L) stdev 95 CI - stdev 95 CI (µg/L) stdev 95 CI (µg/L) stdev 95 CI - stdev 95 CI (µg/L) stdev 95 CI (µg/L) stdev 95 CI - stdev 95 CI
272.2 1030 275 5.48 14 66 1.20 2.99 6.24 0.03 0.07 38.0 7.7 19.1 1.65 0.55 1.36 5.34 0.14 0.35 55.8 7.8 19.4 14.5 1.78 4.42 6.31 0.03 0.08
280.0 1060 275 66 39.4 6.1 15.1 1.17 0.18 0.45 5.46 0.06 0.15 69.0 3.1 7.7 13.4 0.70 1.75 6.20 0.14 0.34
288.0 1090 275 66 40.4 12.7 31.6 1.05 0.33 0.81 5.41 0.14 0.35 74.3 5.4 13.5 14.1 1.29 3.21 6.16 0.13 0.33
288.2 1091 277 6.79 17 80 3.06 7.60 6.20 0.05 0.14 37.2 8.2 20.5 20.9 1.24 3.09 5.33 0.09 0.21 54.8 12.1 30.1 31.6 6.96 17.3 6.36 0.05 0.12
296.0 1120 277 80 38.2 9.3 23.1 5.85 1.06 2.64 5.45 0.02 0.05 66.9 10.6 26.2 27.8 5.46 13.6 6.20 0.03 0.06
304.0 1151 277 80 34.6 11.3 28.1 4.54 0.94 2.33 5.52 0.04 0.11 69.2 3.4 8.5 25.6 1.74 4.32 6.24 0.02 0.05
304.2 1152 282 3.77 9.37 80 0.54 1.33 6.17 0.07 0.18 52.2 5.3 13.1 26.3 1.48 3.69 5.36 0.09 0.23 59.3 0.5 1.2 13.7 0.53 1.32 6.30 0.03 0.08
312.0 1181 282 80 41.8 16.0 39.7 7.65 1.33 3.31 5.58 0.04 0.09 68.1 6.1 15.0 14.2 1.16 2.88 6.23 0.03 0.07
320.0 1211 282 80 54.1 17.4 43.2 6.84 1.72 4.28 5.65 0.08 0.21 81.8 4.9 12.2 18.3 0.76 1.88 6.30 0.04 0.10
320.2 1212 250 3.76 9.34 63 0.26 0.64 6.39 0.16 0.39 45.7 4.8 11.9 5.94 1.23 3.07 5.46 0.05 0.13 65.0 8.5 21.1 12.0 5.77 14.3 6.33 0.05 0.13
328.0 1242 250 63 39.9 8.5 21.1 1.18 0.15 0.38 5.48 0.07 0.18 75.7 7.4 18.5 17.2 2.60 6.45 6.15 0.01 0.03
336.0 1272 250 63 51.4 0.2 0.5 1.44 0.18 0.46 5.48 0.19 0.46 76.7 8.7 21.6 16.9 2.73 6.78 6.19 0.03 0.08
336.2 1273 243 1.54 3.83 80 0.19 0.48 6.13 0.09 0.21 40.4 10.5 26.1 12.8 2.19 5.44 5.50 0.02 0.05 66.5 7.5 18.7 17.8 4.25 10.5 6.19 0.08 0.19
344.0 1302 243 80 42.7 15.4 38.2 2.91 1.05 2.60 5.70 0.07 0.16 74.2 8.7 21.6 14.9 1.77 4.39 6.17 0.04 0.10
352.0 1332 243 80 49.6 13.2 32.7 2.53 0.66 1.64 5.63 0.09 0.22 76.1 6.0 14.9 14.8 1.38 3.42 6.23 0.14 0.34
352.2 1333 244 1.30 3.24 76 2.41 5.99 6.19 0.05 0.12 53.4 5.8 14.5 5.45 1.63 4.04 5.52 0.03 0.08 63.9 9.0 22.3 16.4 2.53 6.28 6.16 0.02 0.04
360.0 1363 244 76 57.0 12.4 30.9 1.34 0.29 0.71 5.66 0.06 0.14 79.8 6.6 16.3 17.1 2.08 5.16 6.06 0.06 0.15
368.0 1393 244 76 71.0 10.9 27.1 1.62 0.33 0.82 5.63 0.03 0.07 81.1 1.7 4.2 17.1 0.72 1.80 6.23 0.06 0.14
368.2 1394 250 7.42 18 72 1.00 2.49 6.13 0.07 0.17 64.8 11.6 28.9 4.18 0.59 5.26 5.53 0.05 0.12 61.7 1.9 4.7 12.0 1.05 2.60 6.20 0.03 0.07
376.0 1423 250 72 67.1 9.4 23.3 1.70 0.53 1.31 5.68 0.04 0.10 80.1 3.0 7.5 16.1 1.01 2.50 6.11 0.05 0.12
384.0 1454 250 72 68.2 12.2 30.4 1.65 0.43 1.06 5.68 0.07 0.17 80.2 5.2 13.0 15.9 2.45 6.08 6.22 0.04 0.10
384.2 1454 250 4.09 10 66 1.05 2.60 6.22 0.08 0.20 92.5 15.3 37.9 8.16 4.62 11.5 5.50 0.17 0.41 70.6 11.1 27.5 57.1 4.74 11.8 6.28 0.13 0.31
392.0 1484 250 66 74.3 8.2 20.3 1.73 0.43 1.06 5.63 0.05 0.11 76.7 4.3 10.6 55.9 3.74 9.29 6.40 0.05 0.12
400.0 1514 250 66 74.3 11.3 28.0 1.62 0.37 0.92 5.66 0.04 0.09 75.0 4.7 11.6 50.4 0.20 0.49 6.42 0.11 0.28
400.2 1515 259 11 26 77 0.73 1.81 6.23 0.11 0.28 96.3 4.2 10.4 3.35 0.60 1.48 5.55 0.15 0.36 58.4 4.3 10.6 28.8 8.93 22.2 6.30 0.09 0.21
408.0 1544 259 77 85.8 5.0 12.5 1.93 0.58 1.45 5.67 0.06 0.14 81.2 6.0 14.8 30.7 7.02 17.4 6.45 0.03 0.07
416.0 1575 259 77 62.1 7.7 19.2 1.18 0.11 0.27 5.76 0.12 0.31 78.2 4.1 10.2 27.3 6.17 15.3 6.47 0.06 0.14
416.2 1575 251 1.46 3.62 68 3.57 8.87 6.11 0.03 0.08 81.3 3.9 9.6 1.66 0.23 0.56 5.60 0.04 0.11 71.6 3.2 7.9 33.3 1.08 2.67 6.41 0.03 0.08
424.0 1605 251 68 84.3 1.7 4.3 1.62 0.17 0.43 5.71 0.02 0.05 83.3 3.1 7.8 34.6 0.74 1.84 6.39 0.09 0.21
432.0 1635 251 68 88.8 5.8 14.5 1.52 0.09 0.21 5.77 0.03 0.08 92.0 4.7 11.6 36.3 1.96 4.86 6.38 0.07 0.16
Gal. L
Average Influent Ave. Raw Wood Ave. Pea Gravel
Zn Cu pH Zn Cu pH Zn Cu pH
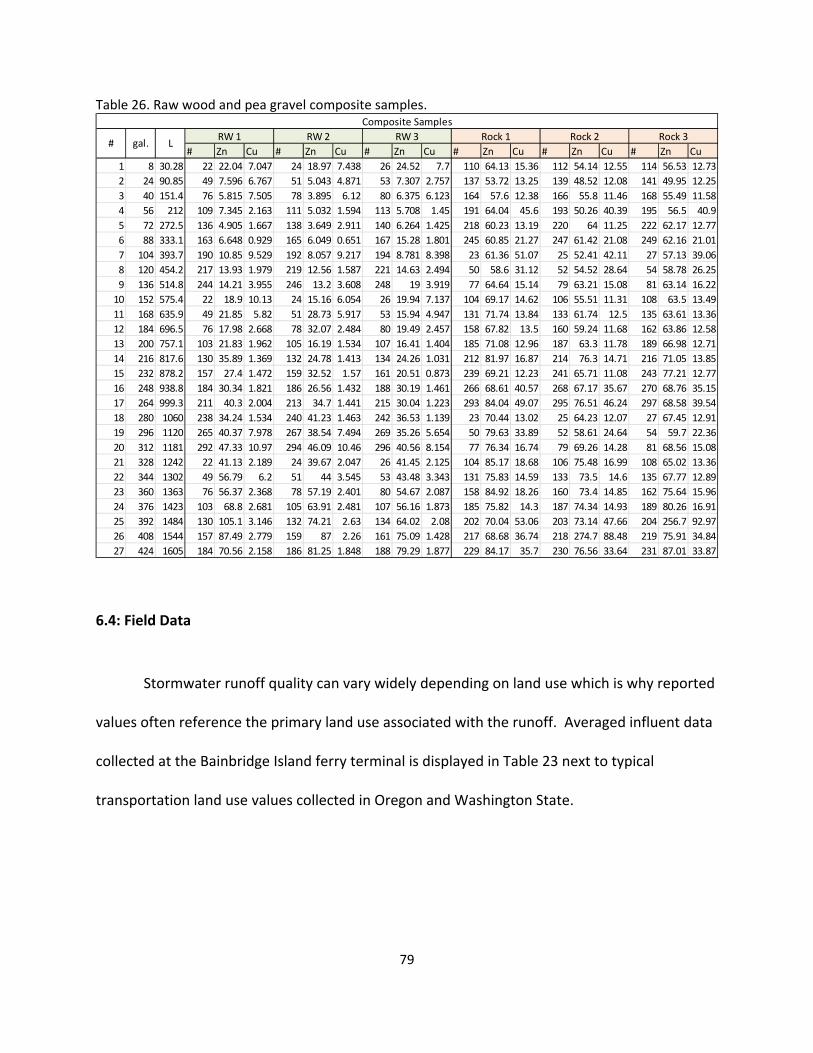
79
Table 26. Raw wood and pea gravel composite samples.
6.4: Field Data
Stormwater runoff quality can vary widely depending on land use which is why reported
values often reference the primary land use associated with the runoff. Averaged influent data
collected at the Bainbridge Island ferry terminal is displayed in Table 23 next to typical
transportation land use values collected in Oregon and Washington State.
# Zn Cu # Zn Cu # Zn Cu # Zn Cu # Zn Cu # Zn Cu
1 8 30.28 22 22.04 7.047 24 18.97 7.438 26 24.52 7.7 110 64.13 15.36 112 54.14 12.55 114 56.53 12.73
2 24 90.85 49 7.596 6.767 51 5.043 4.871 53 7.307 2.757 137 53.72 13.25 139 48.52 12.08 141 49.95 12.25
3 40 151.4 76 5.815 7.505 78 3.895 6.12 80 6.375 6.123 164 57.6 12.38 166 55.8 11.46 168 55.49 11.58
4 56 212 109 7.345 2.163 111 5.032 1.594 113 5.708 1.45 191 64.04 45.6 193 50.26 40.39 195 56.5 40.9
5 72 272.5 136 4.905 1.667 138 3.649 2.911 140 6.264 1.425 218 60.23 13.19 220 64 11.25 222 62.17 12.77
6 88 333.1 163 6.648 0.929 165 6.049 0.651 167 15.28 1.801 245 60.85 21.27 247 61.42 21.08 249 62.16 21.01
7 104 393.7 190 10.85 9.529 192 8.057 9.217 194 8.781 8.398 23 61.36 51.07 25 52.41 42.11 27 57.13 39.06
8 120 454.2 217 13.93 1.979 219 12.56 1.587 221 14.63 2.494 50 58.6 31.12 52 54.52 28.64 54 58.78 26.25
9 136 514.8 244 14.21 3.955 246 13.2 3.608 248 19 3.919 77 64.64 15.14 79 63.21 15.08 81 63.14 16.22
10 152 575.4 22 18.9 10.13 24 15.16 6.054 26 19.94 7.137 104 69.17 14.62 106 55.51 11.31 108 63.5 13.49
11 168 635.9 49 21.85 5.82 51 28.73 5.917 53 15.94 4.947 131 71.74 13.84 133 61.74 12.5 135 63.61 13.36
12 184 696.5 76 17.98 2.668 78 32.07 2.484 80 19.49 2.457 158 67.82 13.5 160 59.24 11.68 162 63.86 12.58
13 200 757.1 103 21.83 1.962 105 16.19 1.534 107 16.41 1.404 185 71.08 12.96 187 63.3 11.78 189 66.98 12.71
14 216 817.6 130 35.89 1.369 132 24.78 1.413 134 24.26 1.031 212 81.97 16.87 214 76.3 14.71 216 71.05 13.85
15 232 878.2 157 27.4 1.472 159 32.52 1.57 161 20.51 0.873 239 69.21 12.23 241 65.71 11.08 243 77.21 12.77
16 248 938.8 184 30.34 1.821 186 26.56 1.432 188 30.19 1.461 266 68.61 40.57 268 67.17 35.67 270 68.76 35.15
17 264 999.3 211 40.3 2.004 213 34.7 1.441 215 30.04 1.223 293 84.04 49.07 295 76.51 46.24 297 68.58 39.54
18 280 1060 238 34.24 1.534 240 41.23 1.463 242 36.53 1.139 23 70.44 13.02 25 64.23 12.07 27 67.45 12.91
19 296 1120 265 40.37 7.978 267 38.54 7.494 269 35.26 5.654 50 79.63 33.89 52 58.61 24.64 54 59.7 22.36
20 312 1181 292 47.33 10.97 294 46.09 10.46 296 40.56 8.154 77 76.34 16.74 79 69.26 14.28 81 68.56 15.08
21 328 1242 22 41.13 2.189 24 39.67 2.047 26 41.45 2.125 104 85.17 18.68 106 75.48 16.99 108 65.02 13.36
22 344 1302 49 56.79 6.2 51 44 3.545 53 43.48 3.343 131 75.83 14.59 133 73.5 14.6 135 67.77 12.89
23 360 1363 76 56.37 2.368 78 57.19 2.401 80 54.67 2.087 158 84.92 18.26 160 73.4 14.85 162 75.64 15.96
24 376 1423 103 68.8 2.681 105 63.91 2.481 107 56.16 1.873 185 75.82 14.3 187 74.34 14.93 189 80.26 16.91
25 392 1484 130 105.1 3.146 132 74.21 2.63 134 64.02 2.08 202 70.04 53.06 203 73.14 47.66 204 256.7 92.97
26 408 1544 157 87.49 2.779 159 87 2.26 161 75.09 1.428 217 68.68 36.74 218 274.7 88.48 219 75.91 34.84
27 424 1605 184 70.56 2.158 186 81.25 1.848 188 79.29 1.877 229 84.17 35.7 230 76.56 33.64 231 87.01 33.87
Composite Samples
Rock 3Rock 2Rock 1RW 3RW 2RW 1Lgal.#
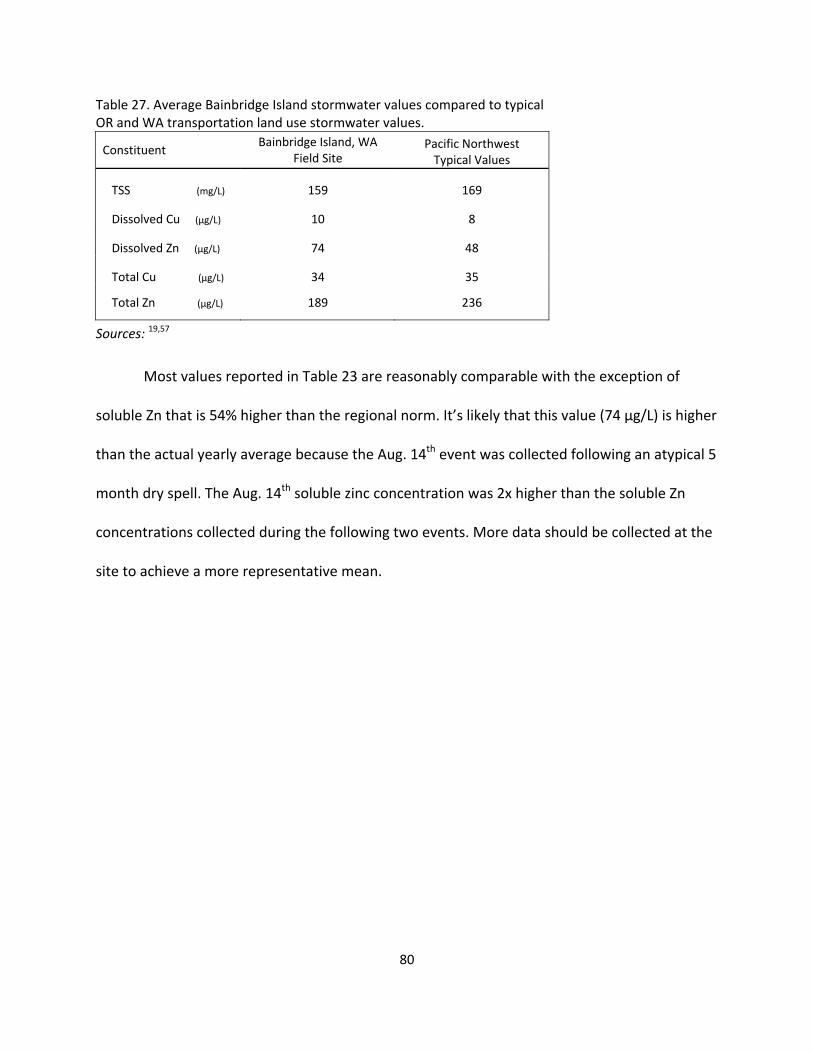
80
Table 27. Average Bainbridge Island stormwater values compared to typical OR and WA transportation land use stormwater values.
Constituent Bainbridge Island, WA
Field Site Pacific Northwest Typical Values
TSS (mg/L) 159 169
Dissolved Cu (μg/L) 10 8
Dissolved Zn (µg/L) 74 48
Total Cu (µg/L) 34 35
Total Zn (µg/L) 189 236
Sources: 19,57
Most values reported in Table 23 are reasonably comparable with the exception of
soluble Zn that is 54% higher than the regional norm. It’s likely that this value (74 μg/L) is higher
than the actual yearly average because the Aug. 14th event was collected following an atypical 5
month dry spell. The Aug. 14th soluble zinc concentration was 2x higher than the soluble Zn
concentrations collected during the following two events. More data should be collected at the
site to achieve a more representative mean.
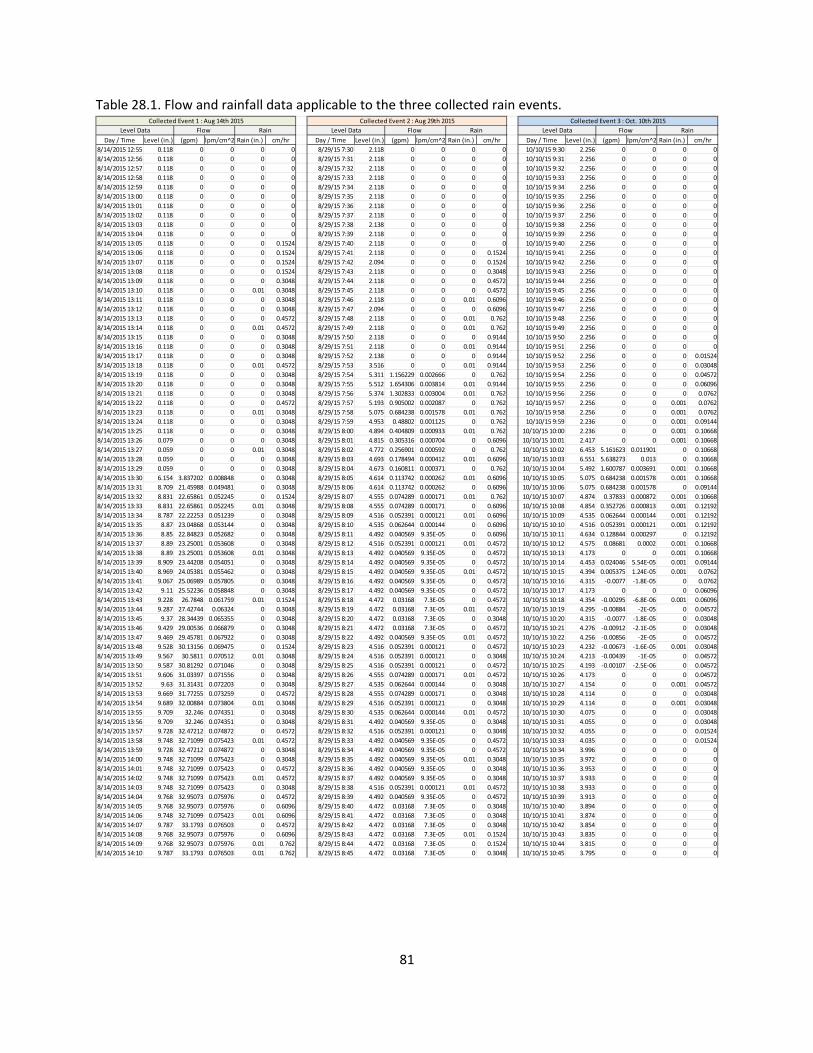
81
Table 28.1. Flow and rainfall data applicable to the three collected rain events.
Day / Time Level (in.) (gpm) lpm/cm^2 Rain (in.) cm/hr Day / Time Level (in.) (gpm) lpm/cm^2 Rain (in.) cm/hr Day / Time Level (in.) (gpm) lpm/cm^2 Rain (in.) cm/hr
8/14/2015 12:55 0.118 0 0 0 0 8/29/15 7:30 2.118 0 0 0 0 10/10/15 9:30 2.256 0 0 0 0
8/14/2015 12:56 0.118 0 0 0 0 8/29/15 7:31 2.118 0 0 0 0 10/10/15 9:31 2.256 0 0 0 0
8/14/2015 12:57 0.118 0 0 0 0 8/29/15 7:32 2.118 0 0 0 0 10/10/15 9:32 2.256 0 0 0 0
8/14/2015 12:58 0.118 0 0 0 0 8/29/15 7:33 2.118 0 0 0 0 10/10/15 9:33 2.256 0 0 0 0
8/14/2015 12:59 0.118 0 0 0 0 8/29/15 7:34 2.118 0 0 0 0 10/10/15 9:34 2.256 0 0 0 0
8/14/2015 13:00 0.118 0 0 0 0 8/29/15 7:35 2.118 0 0 0 0 10/10/15 9:35 2.256 0 0 0 0
8/14/2015 13:01 0.118 0 0 0 0 8/29/15 7:36 2.118 0 0 0 0 10/10/15 9:36 2.256 0 0 0 0
8/14/2015 13:02 0.118 0 0 0 0 8/29/15 7:37 2.118 0 0 0 0 10/10/15 9:37 2.256 0 0 0 0
8/14/2015 13:03 0.118 0 0 0 0 8/29/15 7:38 2.138 0 0 0 0 10/10/15 9:38 2.256 0 0 0 0
8/14/2015 13:04 0.118 0 0 0 0 8/29/15 7:39 2.118 0 0 0 0 10/10/15 9:39 2.256 0 0 0 0
8/14/2015 13:05 0.118 0 0 0 0.1524 8/29/15 7:40 2.118 0 0 0 0 10/10/15 9:40 2.256 0 0 0 0
8/14/2015 13:06 0.118 0 0 0 0.1524 8/29/15 7:41 2.118 0 0 0 0.1524 10/10/15 9:41 2.256 0 0 0 0
8/14/2015 13:07 0.118 0 0 0 0.1524 8/29/15 7:42 2.094 0 0 0 0.1524 10/10/15 9:42 2.256 0 0 0 0
8/14/2015 13:08 0.118 0 0 0 0.1524 8/29/15 7:43 2.118 0 0 0 0.3048 10/10/15 9:43 2.256 0 0 0 0
8/14/2015 13:09 0.118 0 0 0 0.3048 8/29/15 7:44 2.118 0 0 0 0.4572 10/10/15 9:44 2.256 0 0 0 0
8/14/2015 13:10 0.118 0 0 0.01 0.3048 8/29/15 7:45 2.118 0 0 0 0.4572 10/10/15 9:45 2.256 0 0 0 0
8/14/2015 13:11 0.118 0 0 0 0.3048 8/29/15 7:46 2.118 0 0 0.01 0.6096 10/10/15 9:46 2.256 0 0 0 0
8/14/2015 13:12 0.118 0 0 0 0.3048 8/29/15 7:47 2.094 0 0 0 0.6096 10/10/15 9:47 2.256 0 0 0 0
8/14/2015 13:13 0.118 0 0 0 0.4572 8/29/15 7:48 2.118 0 0 0.01 0.762 10/10/15 9:48 2.256 0 0 0 0
8/14/2015 13:14 0.118 0 0 0.01 0.4572 8/29/15 7:49 2.118 0 0 0.01 0.762 10/10/15 9:49 2.256 0 0 0 0
8/14/2015 13:15 0.118 0 0 0 0.3048 8/29/15 7:50 2.118 0 0 0 0.9144 10/10/15 9:50 2.256 0 0 0 0
8/14/2015 13:16 0.118 0 0 0 0.3048 8/29/15 7:51 2.118 0 0 0.01 0.9144 10/10/15 9:51 2.256 0 0 0 0
8/14/2015 13:17 0.118 0 0 0 0.3048 8/29/15 7:52 2.138 0 0 0 0.9144 10/10/15 9:52 2.256 0 0 0 0.01524
8/14/2015 13:18 0.118 0 0 0.01 0.4572 8/29/15 7:53 3.516 0 0 0.01 0.9144 10/10/15 9:53 2.256 0 0 0 0.03048
8/14/2015 13:19 0.118 0 0 0 0.3048 8/29/15 7:54 5.311 1.156229 0.002666 0 0.762 10/10/15 9:54 2.256 0 0 0 0.04572
8/14/2015 13:20 0.118 0 0 0 0.3048 8/29/15 7:55 5.512 1.654306 0.003814 0.01 0.9144 10/10/15 9:55 2.256 0 0 0 0.06096
8/14/2015 13:21 0.118 0 0 0 0.3048 8/29/15 7:56 5.374 1.302833 0.003004 0.01 0.762 10/10/15 9:56 2.256 0 0 0 0.0762
8/14/2015 13:22 0.118 0 0 0 0.4572 8/29/15 7:57 5.193 0.905002 0.002087 0 0.762 10/10/15 9:57 2.256 0 0 0.001 0.0762
8/14/2015 13:23 0.118 0 0 0.01 0.3048 8/29/15 7:58 5.075 0.684238 0.001578 0.01 0.762 10/10/15 9:58 2.256 0 0 0.001 0.0762
8/14/2015 13:24 0.118 0 0 0 0.3048 8/29/15 7:59 4.953 0.48802 0.001125 0 0.762 10/10/15 9:59 2.236 0 0 0.001 0.09144
8/14/2015 13:25 0.118 0 0 0 0.3048 8/29/15 8:00 4.894 0.404809 0.000933 0.01 0.762 10/10/15 10:00 2.236 0 0 0.001 0.10668
8/14/2015 13:26 0.079 0 0 0 0.3048 8/29/15 8:01 4.815 0.305316 0.000704 0 0.6096 10/10/15 10:01 2.417 0 0 0.001 0.10668
8/14/2015 13:27 0.059 0 0 0.01 0.3048 8/29/15 8:02 4.772 0.256901 0.000592 0 0.762 10/10/15 10:02 6.453 5.161623 0.011901 0 0.10668
8/14/2015 13:28 0.059 0 0 0 0.3048 8/29/15 8:03 4.693 0.178494 0.000412 0.01 0.6096 10/10/15 10:03 6.551 5.638273 0.013 0 0.10668
8/14/2015 13:29 0.059 0 0 0 0.3048 8/29/15 8:04 4.673 0.160811 0.000371 0 0.762 10/10/15 10:04 5.492 1.600787 0.003691 0.001 0.10668
8/14/2015 13:30 6.154 3.837202 0.008848 0 0.3048 8/29/15 8:05 4.614 0.113742 0.000262 0.01 0.6096 10/10/15 10:05 5.075 0.684238 0.001578 0.001 0.10668
8/14/2015 13:31 8.709 21.45988 0.049481 0 0.3048 8/29/15 8:06 4.614 0.113742 0.000262 0 0.6096 10/10/15 10:06 5.075 0.684238 0.001578 0 0.09144
8/14/2015 13:32 8.831 22.65861 0.052245 0 0.1524 8/29/15 8:07 4.555 0.074289 0.000171 0.01 0.762 10/10/15 10:07 4.874 0.37833 0.000872 0.001 0.10668
8/14/2015 13:33 8.831 22.65861 0.052245 0.01 0.3048 8/29/15 8:08 4.555 0.074289 0.000171 0 0.6096 10/10/15 10:08 4.854 0.352726 0.000813 0.001 0.12192
8/14/2015 13:34 8.787 22.22253 0.051239 0 0.3048 8/29/15 8:09 4.516 0.052391 0.000121 0.01 0.6096 10/10/15 10:09 4.535 0.062644 0.000144 0.001 0.12192
8/14/2015 13:35 8.87 23.04868 0.053144 0 0.3048 8/29/15 8:10 4.535 0.062644 0.000144 0 0.6096 10/10/15 10:10 4.516 0.052391 0.000121 0.001 0.12192
8/14/2015 13:36 8.85 22.84823 0.052682 0 0.3048 8/29/15 8:11 4.492 0.040569 9.35E‐05 0 0.6096 10/10/15 10:11 4.634 0.128844 0.000297 0 0.12192
8/14/2015 13:37 8.89 23.25001 0.053608 0 0.3048 8/29/15 8:12 4.516 0.052391 0.000121 0.01 0.4572 10/10/15 10:12 4.575 0.08681 0.0002 0.001 0.10668
8/14/2015 13:38 8.89 23.25001 0.053608 0.01 0.3048 8/29/15 8:13 4.492 0.040569 9.35E‐05 0 0.4572 10/10/15 10:13 4.173 0 0 0.001 0.10668
8/14/2015 13:39 8.909 23.44208 0.054051 0 0.3048 8/29/15 8:14 4.492 0.040569 9.35E‐05 0 0.4572 10/10/15 10:14 4.453 0.024046 5.54E‐05 0.001 0.09144
8/14/2015 13:40 8.969 24.05381 0.055462 0 0.3048 8/29/15 8:15 4.492 0.040569 9.35E‐05 0.01 0.4572 10/10/15 10:15 4.394 0.005375 1.24E‐05 0.001 0.0762
8/14/2015 13:41 9.067 25.06989 0.057805 0 0.3048 8/29/15 8:16 4.492 0.040569 9.35E‐05 0 0.4572 10/10/15 10:16 4.315 ‐0.0077 ‐1.8E‐05 0 0.0762
8/14/2015 13:42 9.11 25.52236 0.058848 0 0.3048 8/29/15 8:17 4.492 0.040569 9.35E‐05 0 0.4572 10/10/15 10:17 4.173 0 0 0 0.06096
8/14/2015 13:43 9.228 26.7848 0.061759 0.01 0.1524 8/29/15 8:18 4.472 0.03168 7.3E‐05 0 0.4572 10/10/15 10:18 4.354 ‐0.00295 ‐6.8E‐06 0.001 0.06096
8/14/2015 13:44 9.287 27.42744 0.06324 0 0.3048 8/29/15 8:19 4.472 0.03168 7.3E‐05 0.01 0.4572 10/10/15 10:19 4.295 ‐0.00884 ‐2E‐05 0 0.04572
8/14/2015 13:45 9.37 28.34439 0.065355 0 0.3048 8/29/15 8:20 4.472 0.03168 7.3E‐05 0 0.3048 10/10/15 10:20 4.315 ‐0.0077 ‐1.8E‐05 0 0.03048
8/14/2015 13:46 9.429 29.00536 0.066879 0 0.3048 8/29/15 8:21 4.472 0.03168 7.3E‐05 0 0.4572 10/10/15 10:21 4.276 ‐0.00912 ‐2.1E‐05 0 0.03048
8/14/2015 13:47 9.469 29.45781 0.067922 0 0.3048 8/29/15 8:22 4.492 0.040569 9.35E‐05 0.01 0.4572 10/10/15 10:22 4.256 ‐0.00856 ‐2E‐05 0 0.04572
8/14/2015 13:48 9.528 30.13156 0.069475 0 0.1524 8/29/15 8:23 4.516 0.052391 0.000121 0 0.4572 10/10/15 10:23 4.232 ‐0.00673 ‐1.6E‐05 0.001 0.03048
8/14/2015 13:49 9.567 30.5811 0.070512 0.01 0.3048 8/29/15 8:24 4.516 0.052391 0.000121 0 0.3048 10/10/15 10:24 4.213 ‐0.00439 ‐1E‐05 0 0.04572
8/14/2015 13:50 9.587 30.81292 0.071046 0 0.3048 8/29/15 8:25 4.516 0.052391 0.000121 0 0.4572 10/10/15 10:25 4.193 ‐0.00107 ‐2.5E‐06 0 0.04572
8/14/2015 13:51 9.606 31.03397 0.071556 0 0.3048 8/29/15 8:26 4.555 0.074289 0.000171 0.01 0.4572 10/10/15 10:26 4.173 0 0 0 0.04572
8/14/2015 13:52 9.63 31.31431 0.072203 0 0.3048 8/29/15 8:27 4.535 0.062644 0.000144 0 0.3048 10/10/15 10:27 4.154 0 0 0.001 0.04572
8/14/2015 13:53 9.669 31.77255 0.073259 0 0.4572 8/29/15 8:28 4.555 0.074289 0.000171 0 0.3048 10/10/15 10:28 4.114 0 0 0 0.03048
8/14/2015 13:54 9.689 32.00884 0.073804 0.01 0.3048 8/29/15 8:29 4.516 0.052391 0.000121 0 0.3048 10/10/15 10:29 4.114 0 0 0.001 0.03048
8/14/2015 13:55 9.709 32.246 0.074351 0 0.3048 8/29/15 8:30 4.535 0.062644 0.000144 0.01 0.4572 10/10/15 10:30 4.075 0 0 0 0.03048
8/14/2015 13:56 9.709 32.246 0.074351 0 0.3048 8/29/15 8:31 4.492 0.040569 9.35E‐05 0 0.3048 10/10/15 10:31 4.055 0 0 0 0.03048
8/14/2015 13:57 9.728 32.47212 0.074872 0 0.4572 8/29/15 8:32 4.516 0.052391 0.000121 0 0.3048 10/10/15 10:32 4.055 0 0 0 0.01524
8/14/2015 13:58 9.748 32.71099 0.075423 0.01 0.4572 8/29/15 8:33 4.492 0.040569 9.35E‐05 0 0.4572 10/10/15 10:33 4.035 0 0 0 0.01524
8/14/2015 13:59 9.728 32.47212 0.074872 0 0.3048 8/29/15 8:34 4.492 0.040569 9.35E‐05 0 0.4572 10/10/15 10:34 3.996 0 0 0 0
8/14/2015 14:00 9.748 32.71099 0.075423 0 0.3048 8/29/15 8:35 4.492 0.040569 9.35E‐05 0.01 0.3048 10/10/15 10:35 3.972 0 0 0 0
8/14/2015 14:01 9.748 32.71099 0.075423 0 0.4572 8/29/15 8:36 4.492 0.040569 9.35E‐05 0 0.3048 10/10/15 10:36 3.953 0 0 0 0
8/14/2015 14:02 9.748 32.71099 0.075423 0.01 0.4572 8/29/15 8:37 4.492 0.040569 9.35E‐05 0 0.3048 10/10/15 10:37 3.933 0 0 0 0
8/14/2015 14:03 9.748 32.71099 0.075423 0 0.3048 8/29/15 8:38 4.516 0.052391 0.000121 0.01 0.4572 10/10/15 10:38 3.933 0 0 0 0
8/14/2015 14:04 9.768 32.95073 0.075976 0 0.4572 8/29/15 8:39 4.492 0.040569 9.35E‐05 0 0.4572 10/10/15 10:39 3.913 0 0 0 0
8/14/2015 14:05 9.768 32.95073 0.075976 0 0.6096 8/29/15 8:40 4.472 0.03168 7.3E‐05 0 0.3048 10/10/15 10:40 3.894 0 0 0 0
8/14/2015 14:06 9.748 32.71099 0.075423 0.01 0.6096 8/29/15 8:41 4.472 0.03168 7.3E‐05 0 0.3048 10/10/15 10:41 3.874 0 0 0 0
8/14/2015 14:07 9.787 33.1793 0.076503 0 0.4572 8/29/15 8:42 4.472 0.03168 7.3E‐05 0 0.3048 10/10/15 10:42 3.854 0 0 0 0
8/14/2015 14:08 9.768 32.95073 0.075976 0 0.6096 8/29/15 8:43 4.472 0.03168 7.3E‐05 0.01 0.1524 10/10/15 10:43 3.835 0 0 0 0
8/14/2015 14:09 9.768 32.95073 0.075976 0.01 0.762 8/29/15 8:44 4.472 0.03168 7.3E‐05 0 0.1524 10/10/15 10:44 3.815 0 0 0 0
8/14/2015 14:10 9.787 33.1793 0.076503 0.01 0.762 8/29/15 8:45 4.472 0.03168 7.3E‐05 0 0.3048 10/10/15 10:45 3.795 0 0 0 0
Rain Level Data Flow Rain
Collected Event 1 : Aug 14th 2015 Collected Event 2 : Aug 29th 2015 Collected Event 3 : Oct. 10th 2015
Level Data Flow Rain Level Data Flow
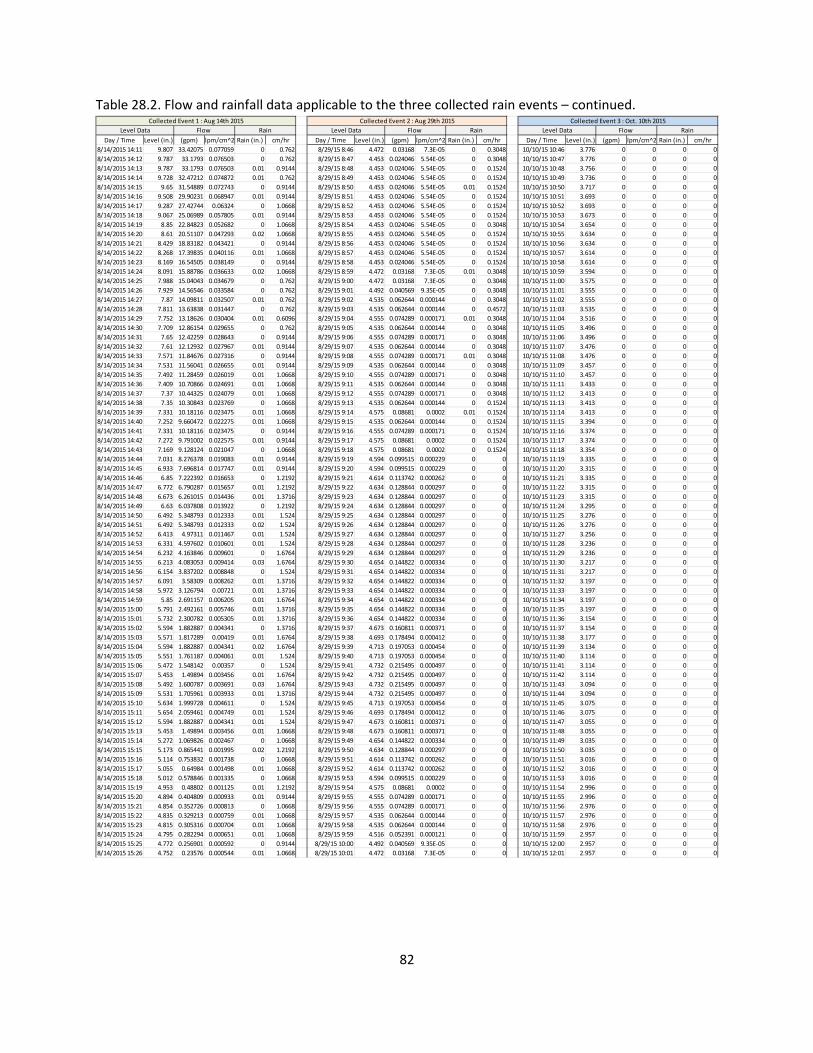
82
Table 28.2. Flow and rainfall data applicable to the three collected rain events – continued.
Day / Time Level (in.) (gpm) lpm/cm^2 Rain (in.) cm/hr Day / Time Level (in.) (gpm) lpm/cm^2 Rain (in.) cm/hr Day / Time Level (in.) (gpm) lpm/cm^2 Rain (in.) cm/hr
8/14/2015 14:11 9.807 33.42075 0.077059 0 0.762 8/29/15 8:46 4.472 0.03168 7.3E‐05 0 0.3048 10/10/15 10:46 3.776 0 0 0 0
8/14/2015 14:12 9.787 33.1793 0.076503 0 0.762 8/29/15 8:47 4.453 0.024046 5.54E‐05 0 0.3048 10/10/15 10:47 3.776 0 0 0 0
8/14/2015 14:13 9.787 33.1793 0.076503 0.01 0.9144 8/29/15 8:48 4.453 0.024046 5.54E‐05 0 0.1524 10/10/15 10:48 3.756 0 0 0 0
8/14/2015 14:14 9.728 32.47212 0.074872 0.01 0.762 8/29/15 8:49 4.453 0.024046 5.54E‐05 0 0.1524 10/10/15 10:49 3.736 0 0 0 0
8/14/2015 14:15 9.65 31.54889 0.072743 0 0.9144 8/29/15 8:50 4.453 0.024046 5.54E‐05 0.01 0.1524 10/10/15 10:50 3.717 0 0 0 0
8/14/2015 14:16 9.508 29.90231 0.068947 0.01 0.9144 8/29/15 8:51 4.453 0.024046 5.54E‐05 0 0.1524 10/10/15 10:51 3.693 0 0 0 0
8/14/2015 14:17 9.287 27.42744 0.06324 0 1.0668 8/29/15 8:52 4.453 0.024046 5.54E‐05 0 0.1524 10/10/15 10:52 3.693 0 0 0 0
8/14/2015 14:18 9.067 25.06989 0.057805 0.01 0.9144 8/29/15 8:53 4.453 0.024046 5.54E‐05 0 0.1524 10/10/15 10:53 3.673 0 0 0 0
8/14/2015 14:19 8.85 22.84823 0.052682 0 1.0668 8/29/15 8:54 4.453 0.024046 5.54E‐05 0 0.3048 10/10/15 10:54 3.654 0 0 0 0
8/14/2015 14:20 8.61 20.51107 0.047293 0.02 1.0668 8/29/15 8:55 4.453 0.024046 5.54E‐05 0 0.1524 10/10/15 10:55 3.634 0 0 0 0
8/14/2015 14:21 8.429 18.83182 0.043421 0 0.9144 8/29/15 8:56 4.453 0.024046 5.54E‐05 0 0.1524 10/10/15 10:56 3.634 0 0 0 0
8/14/2015 14:22 8.268 17.39835 0.040116 0.01 1.0668 8/29/15 8:57 4.453 0.024046 5.54E‐05 0 0.1524 10/10/15 10:57 3.614 0 0 0 0
8/14/2015 14:23 8.169 16.54505 0.038149 0 0.9144 8/29/15 8:58 4.453 0.024046 5.54E‐05 0 0.1524 10/10/15 10:58 3.614 0 0 0 0
8/14/2015 14:24 8.091 15.88786 0.036633 0.02 1.0668 8/29/15 8:59 4.472 0.03168 7.3E‐05 0.01 0.3048 10/10/15 10:59 3.594 0 0 0 0
8/14/2015 14:25 7.988 15.04043 0.034679 0 0.762 8/29/15 9:00 4.472 0.03168 7.3E‐05 0 0.3048 10/10/15 11:00 3.575 0 0 0 0
8/14/2015 14:26 7.929 14.56546 0.033584 0 0.762 8/29/15 9:01 4.492 0.040569 9.35E‐05 0 0.3048 10/10/15 11:01 3.555 0 0 0 0
8/14/2015 14:27 7.87 14.09811 0.032507 0.01 0.762 8/29/15 9:02 4.535 0.062644 0.000144 0 0.3048 10/10/15 11:02 3.555 0 0 0 0
8/14/2015 14:28 7.811 13.63838 0.031447 0 0.762 8/29/15 9:03 4.535 0.062644 0.000144 0 0.4572 10/10/15 11:03 3.535 0 0 0 0
8/14/2015 14:29 7.752 13.18626 0.030404 0.01 0.6096 8/29/15 9:04 4.555 0.074289 0.000171 0.01 0.3048 10/10/15 11:04 3.516 0 0 0 0
8/14/2015 14:30 7.709 12.86154 0.029655 0 0.762 8/29/15 9:05 4.535 0.062644 0.000144 0 0.3048 10/10/15 11:05 3.496 0 0 0 0
8/14/2015 14:31 7.65 12.42259 0.028643 0 0.9144 8/29/15 9:06 4.555 0.074289 0.000171 0 0.3048 10/10/15 11:06 3.496 0 0 0 0
8/14/2015 14:32 7.61 12.12932 0.027967 0.01 0.9144 8/29/15 9:07 4.535 0.062644 0.000144 0 0.3048 10/10/15 11:07 3.476 0 0 0 0
8/14/2015 14:33 7.571 11.84676 0.027316 0 0.9144 8/29/15 9:08 4.555 0.074289 0.000171 0.01 0.3048 10/10/15 11:08 3.476 0 0 0 0
8/14/2015 14:34 7.531 11.56041 0.026655 0.01 0.9144 8/29/15 9:09 4.535 0.062644 0.000144 0 0.3048 10/10/15 11:09 3.457 0 0 0 0
8/14/2015 14:35 7.492 11.28459 0.026019 0.01 1.0668 8/29/15 9:10 4.555 0.074289 0.000171 0 0.3048 10/10/15 11:10 3.457 0 0 0 0
8/14/2015 14:36 7.409 10.70866 0.024691 0.01 1.0668 8/29/15 9:11 4.535 0.062644 0.000144 0 0.3048 10/10/15 11:11 3.433 0 0 0 0
8/14/2015 14:37 7.37 10.44325 0.024079 0.01 1.0668 8/29/15 9:12 4.555 0.074289 0.000171 0 0.3048 10/10/15 11:12 3.413 0 0 0 0
8/14/2015 14:38 7.35 10.30843 0.023769 0 1.0668 8/29/15 9:13 4.535 0.062644 0.000144 0 0.1524 10/10/15 11:13 3.413 0 0 0 0
8/14/2015 14:39 7.331 10.18116 0.023475 0.01 1.0668 8/29/15 9:14 4.575 0.08681 0.0002 0.01 0.1524 10/10/15 11:14 3.413 0 0 0 0
8/14/2015 14:40 7.252 9.660472 0.022275 0.01 1.0668 8/29/15 9:15 4.535 0.062644 0.000144 0 0.1524 10/10/15 11:15 3.394 0 0 0 0
8/14/2015 14:41 7.331 10.18116 0.023475 0 0.9144 8/29/15 9:16 4.555 0.074289 0.000171 0 0.1524 10/10/15 11:16 3.374 0 0 0 0
8/14/2015 14:42 7.272 9.791002 0.022575 0.01 0.9144 8/29/15 9:17 4.575 0.08681 0.0002 0 0.1524 10/10/15 11:17 3.374 0 0 0 0
8/14/2015 14:43 7.169 9.128124 0.021047 0 1.0668 8/29/15 9:18 4.575 0.08681 0.0002 0 0.1524 10/10/15 11:18 3.354 0 0 0 0
8/14/2015 14:44 7.031 8.276378 0.019083 0.01 0.9144 8/29/15 9:19 4.594 0.099515 0.000229 0 0 10/10/15 11:19 3.335 0 0 0 0
8/14/2015 14:45 6.933 7.696814 0.017747 0.01 0.9144 8/29/15 9:20 4.594 0.099515 0.000229 0 0 10/10/15 11:20 3.315 0 0 0 0
8/14/2015 14:46 6.85 7.222392 0.016653 0 1.2192 8/29/15 9:21 4.614 0.113742 0.000262 0 0 10/10/15 11:21 3.335 0 0 0 0
8/14/2015 14:47 6.772 6.790287 0.015657 0.01 1.2192 8/29/15 9:22 4.634 0.128844 0.000297 0 0 10/10/15 11:22 3.315 0 0 0 0
8/14/2015 14:48 6.673 6.261015 0.014436 0.01 1.3716 8/29/15 9:23 4.634 0.128844 0.000297 0 0 10/10/15 11:23 3.315 0 0 0 0
8/14/2015 14:49 6.63 6.037808 0.013922 0 1.2192 8/29/15 9:24 4.634 0.128844 0.000297 0 0 10/10/15 11:24 3.295 0 0 0 0
8/14/2015 14:50 6.492 5.348793 0.012333 0.01 1.524 8/29/15 9:25 4.634 0.128844 0.000297 0 0 10/10/15 11:25 3.276 0 0 0 0
8/14/2015 14:51 6.492 5.348793 0.012333 0.02 1.524 8/29/15 9:26 4.634 0.128844 0.000297 0 0 10/10/15 11:26 3.276 0 0 0 0
8/14/2015 14:52 6.413 4.97311 0.011467 0.01 1.524 8/29/15 9:27 4.634 0.128844 0.000297 0 0 10/10/15 11:27 3.256 0 0 0 0
8/14/2015 14:53 6.331 4.597602 0.010601 0.01 1.524 8/29/15 9:28 4.634 0.128844 0.000297 0 0 10/10/15 11:28 3.236 0 0 0 0
8/14/2015 14:54 6.232 4.163846 0.009601 0 1.6764 8/29/15 9:29 4.634 0.128844 0.000297 0 0 10/10/15 11:29 3.236 0 0 0 0
8/14/2015 14:55 6.213 4.083053 0.009414 0.03 1.6764 8/29/15 9:30 4.654 0.144822 0.000334 0 0 10/10/15 11:30 3.217 0 0 0 0
8/14/2015 14:56 6.154 3.837202 0.008848 0 1.524 8/29/15 9:31 4.654 0.144822 0.000334 0 0 10/10/15 11:31 3.217 0 0 0 0
8/14/2015 14:57 6.091 3.58309 0.008262 0.01 1.3716 8/29/15 9:32 4.654 0.144822 0.000334 0 0 10/10/15 11:32 3.197 0 0 0 0
8/14/2015 14:58 5.972 3.126794 0.00721 0.01 1.3716 8/29/15 9:33 4.654 0.144822 0.000334 0 0 10/10/15 11:33 3.197 0 0 0 0
8/14/2015 14:59 5.85 2.691157 0.006205 0.01 1.6764 8/29/15 9:34 4.654 0.144822 0.000334 0 0 10/10/15 11:34 3.197 0 0 0 0
8/14/2015 15:00 5.791 2.492161 0.005746 0.01 1.3716 8/29/15 9:35 4.654 0.144822 0.000334 0 0 10/10/15 11:35 3.197 0 0 0 0
8/14/2015 15:01 5.732 2.300782 0.005305 0.01 1.3716 8/29/15 9:36 4.654 0.144822 0.000334 0 0 10/10/15 11:36 3.154 0 0 0 0
8/14/2015 15:02 5.594 1.882887 0.004341 0 1.3716 8/29/15 9:37 4.673 0.160811 0.000371 0 0 10/10/15 11:37 3.154 0 0 0 0
8/14/2015 15:03 5.571 1.817289 0.00419 0.01 1.6764 8/29/15 9:38 4.693 0.178494 0.000412 0 0 10/10/15 11:38 3.177 0 0 0 0
8/14/2015 15:04 5.594 1.882887 0.004341 0.02 1.6764 8/29/15 9:39 4.713 0.197053 0.000454 0 0 10/10/15 11:39 3.134 0 0 0 0
8/14/2015 15:05 5.551 1.761187 0.004061 0.01 1.524 8/29/15 9:40 4.713 0.197053 0.000454 0 0 10/10/15 11:40 3.114 0 0 0 0
8/14/2015 15:06 5.472 1.548142 0.00357 0 1.524 8/29/15 9:41 4.732 0.215495 0.000497 0 0 10/10/15 11:41 3.114 0 0 0 0
8/14/2015 15:07 5.453 1.49894 0.003456 0.01 1.6764 8/29/15 9:42 4.732 0.215495 0.000497 0 0 10/10/15 11:42 3.114 0 0 0 0
8/14/2015 15:08 5.492 1.600787 0.003691 0.03 1.6764 8/29/15 9:43 4.732 0.215495 0.000497 0 0 10/10/15 11:43 3.094 0 0 0 0
8/14/2015 15:09 5.531 1.705961 0.003933 0.01 1.3716 8/29/15 9:44 4.732 0.215495 0.000497 0 0 10/10/15 11:44 3.094 0 0 0 0
8/14/2015 15:10 5.634 1.999728 0.004611 0 1.524 8/29/15 9:45 4.713 0.197053 0.000454 0 0 10/10/15 11:45 3.075 0 0 0 0
8/14/2015 15:11 5.654 2.059461 0.004749 0.01 1.524 8/29/15 9:46 4.693 0.178494 0.000412 0 0 10/10/15 11:46 3.075 0 0 0 0
8/14/2015 15:12 5.594 1.882887 0.004341 0.01 1.524 8/29/15 9:47 4.673 0.160811 0.000371 0 0 10/10/15 11:47 3.055 0 0 0 0
8/14/2015 15:13 5.453 1.49894 0.003456 0.01 1.0668 8/29/15 9:48 4.673 0.160811 0.000371 0 0 10/10/15 11:48 3.055 0 0 0 0
8/14/2015 15:14 5.272 1.069826 0.002467 0 1.0668 8/29/15 9:49 4.654 0.144822 0.000334 0 0 10/10/15 11:49 3.035 0 0 0 0
8/14/2015 15:15 5.173 0.865441 0.001995 0.02 1.2192 8/29/15 9:50 4.634 0.128844 0.000297 0 0 10/10/15 11:50 3.035 0 0 0 0
8/14/2015 15:16 5.114 0.753832 0.001738 0 1.0668 8/29/15 9:51 4.614 0.113742 0.000262 0 0 10/10/15 11:51 3.016 0 0 0 0
8/14/2015 15:17 5.055 0.64984 0.001498 0.01 1.0668 8/29/15 9:52 4.614 0.113742 0.000262 0 0 10/10/15 11:52 3.016 0 0 0 0
8/14/2015 15:18 5.012 0.578846 0.001335 0 1.0668 8/29/15 9:53 4.594 0.099515 0.000229 0 0 10/10/15 11:53 3.016 0 0 0 0
8/14/2015 15:19 4.953 0.48802 0.001125 0.01 1.2192 8/29/15 9:54 4.575 0.08681 0.0002 0 0 10/10/15 11:54 2.996 0 0 0 0
8/14/2015 15:20 4.894 0.404809 0.000933 0.01 0.9144 8/29/15 9:55 4.555 0.074289 0.000171 0 0 10/10/15 11:55 2.996 0 0 0 0
8/14/2015 15:21 4.854 0.352726 0.000813 0 1.0668 8/29/15 9:56 4.555 0.074289 0.000171 0 0 10/10/15 11:56 2.976 0 0 0 0
8/14/2015 15:22 4.835 0.329213 0.000759 0.01 1.0668 8/29/15 9:57 4.535 0.062644 0.000144 0 0 10/10/15 11:57 2.976 0 0 0 0
8/14/2015 15:23 4.815 0.305316 0.000704 0.01 1.0668 8/29/15 9:58 4.535 0.062644 0.000144 0 0 10/10/15 11:58 2.976 0 0 0 0
8/14/2015 15:24 4.795 0.282294 0.000651 0.01 1.0668 8/29/15 9:59 4.516 0.052391 0.000121 0 0 10/10/15 11:59 2.957 0 0 0 0
8/14/2015 15:25 4.772 0.256901 0.000592 0 0.9144 8/29/15 10:00 4.492 0.040569 9.35E‐05 0 0 10/10/15 12:00 2.957 0 0 0 0
8/14/2015 15:26 4.752 0.23576 0.000544 0.01 1.0668 8/29/15 10:01 4.472 0.03168 7.3E‐05 0 0 10/10/15 12:01 2.957 0 0 0 0
Rain Level Data Flow Rain
Collected Event 1 : Aug 14th 2015 Collected Event 2 : Aug 29th 2015 Collected Event 3 : Oct. 10th 2015
Level Data Flow Rain Level Data Flow
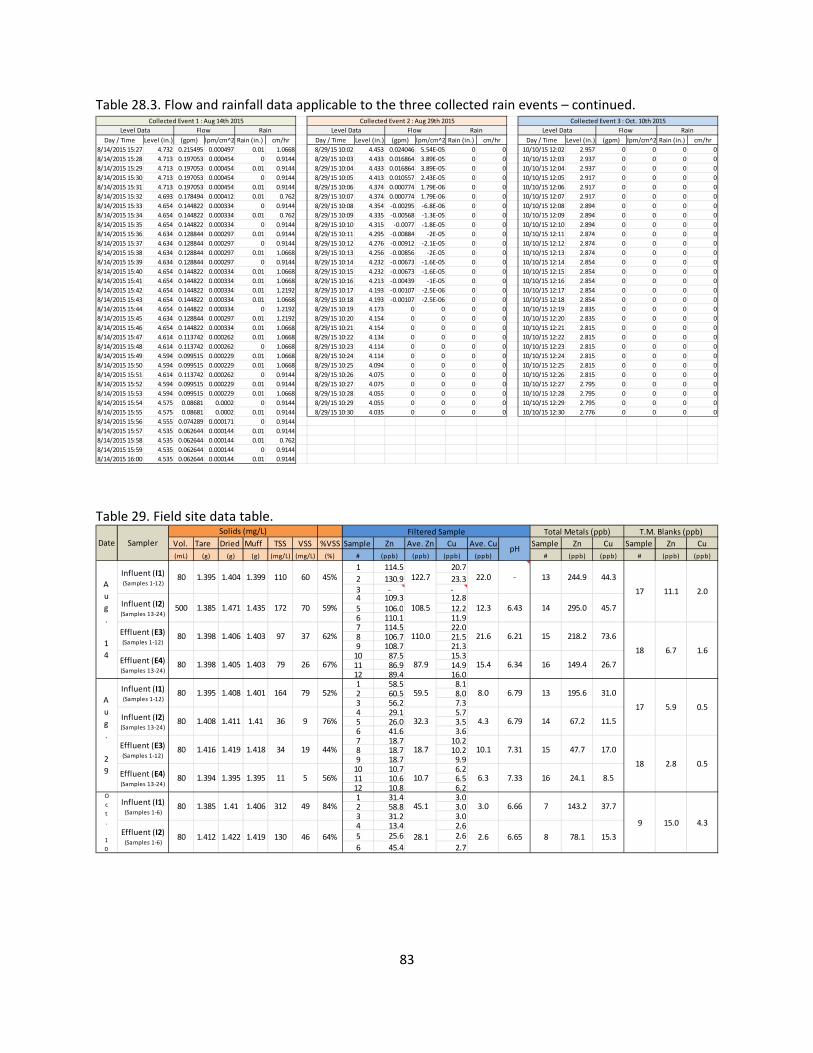
83
Table 28.3. Flow and rainfall data applicable to the three collected rain events – continued.
Table 29. Field site data table.
Day / Time Level (in.) (gpm) lpm/cm^2 Rain (in.) cm/hr Day / Time Level (in.) (gpm) lpm/cm^2 Rain (in.) cm/hr Day / Time Level (in.) (gpm) lpm/cm^2 Rain (in.) cm/hr
8/14/2015 15:27 4.732 0.215495 0.000497 0.01 1.0668 8/29/15 10:02 4.453 0.024046 5.54E‐05 0 0 10/10/15 12:02 2.957 0 0 0 0
8/14/2015 15:28 4.713 0.197053 0.000454 0 0.9144 8/29/15 10:03 4.433 0.016864 3.89E‐05 0 0 10/10/15 12:03 2.937 0 0 0 0
8/14/2015 15:29 4.713 0.197053 0.000454 0.01 0.9144 8/29/15 10:04 4.433 0.016864 3.89E‐05 0 0 10/10/15 12:04 2.937 0 0 0 0
8/14/2015 15:30 4.713 0.197053 0.000454 0 0.9144 8/29/15 10:05 4.413 0.010557 2.43E‐05 0 0 10/10/15 12:05 2.917 0 0 0 0
8/14/2015 15:31 4.713 0.197053 0.000454 0.01 0.9144 8/29/15 10:06 4.374 0.000774 1.79E‐06 0 0 10/10/15 12:06 2.917 0 0 0 0
8/14/2015 15:32 4.693 0.178494 0.000412 0.01 0.762 8/29/15 10:07 4.374 0.000774 1.79E‐06 0 0 10/10/15 12:07 2.917 0 0 0 0
8/14/2015 15:33 4.654 0.144822 0.000334 0 0.9144 8/29/15 10:08 4.354 ‐0.00295 ‐6.8E‐06 0 0 10/10/15 12:08 2.894 0 0 0 0
8/14/2015 15:34 4.654 0.144822 0.000334 0.01 0.762 8/29/15 10:09 4.335 ‐0.00568 ‐1.3E‐05 0 0 10/10/15 12:09 2.894 0 0 0 0
8/14/2015 15:35 4.654 0.144822 0.000334 0 0.9144 8/29/15 10:10 4.315 ‐0.0077 ‐1.8E‐05 0 0 10/10/15 12:10 2.894 0 0 0 0
8/14/2015 15:36 4.634 0.128844 0.000297 0.01 0.9144 8/29/15 10:11 4.295 ‐0.00884 ‐2E‐05 0 0 10/10/15 12:11 2.874 0 0 0 0
8/14/2015 15:37 4.634 0.128844 0.000297 0 0.9144 8/29/15 10:12 4.276 ‐0.00912 ‐2.1E‐05 0 0 10/10/15 12:12 2.874 0 0 0 0
8/14/2015 15:38 4.634 0.128844 0.000297 0.01 1.0668 8/29/15 10:13 4.256 ‐0.00856 ‐2E‐05 0 0 10/10/15 12:13 2.874 0 0 0 0
8/14/2015 15:39 4.634 0.128844 0.000297 0 0.9144 8/29/15 10:14 4.232 ‐0.00673 ‐1.6E‐05 0 0 10/10/15 12:14 2.854 0 0 0 0
8/14/2015 15:40 4.654 0.144822 0.000334 0.01 1.0668 8/29/15 10:15 4.232 ‐0.00673 ‐1.6E‐05 0 0 10/10/15 12:15 2.854 0 0 0 0
8/14/2015 15:41 4.654 0.144822 0.000334 0.01 1.0668 8/29/15 10:16 4.213 ‐0.00439 ‐1E‐05 0 0 10/10/15 12:16 2.854 0 0 0 0
8/14/2015 15:42 4.654 0.144822 0.000334 0.01 1.2192 8/29/15 10:17 4.193 ‐0.00107 ‐2.5E‐06 0 0 10/10/15 12:17 2.854 0 0 0 0
8/14/2015 15:43 4.654 0.144822 0.000334 0.01 1.0668 8/29/15 10:18 4.193 ‐0.00107 ‐2.5E‐06 0 0 10/10/15 12:18 2.854 0 0 0 0
8/14/2015 15:44 4.654 0.144822 0.000334 0 1.2192 8/29/15 10:19 4.173 0 0 0 0 10/10/15 12:19 2.835 0 0 0 0
8/14/2015 15:45 4.634 0.128844 0.000297 0.01 1.2192 8/29/15 10:20 4.154 0 0 0 0 10/10/15 12:20 2.835 0 0 0 0
8/14/2015 15:46 4.654 0.144822 0.000334 0.01 1.0668 8/29/15 10:21 4.154 0 0 0 0 10/10/15 12:21 2.815 0 0 0 0
8/14/2015 15:47 4.614 0.113742 0.000262 0.01 1.0668 8/29/15 10:22 4.134 0 0 0 0 10/10/15 12:22 2.815 0 0 0 0
8/14/2015 15:48 4.614 0.113742 0.000262 0 1.0668 8/29/15 10:23 4.114 0 0 0 0 10/10/15 12:23 2.815 0 0 0 0
8/14/2015 15:49 4.594 0.099515 0.000229 0.01 1.0668 8/29/15 10:24 4.114 0 0 0 0 10/10/15 12:24 2.815 0 0 0 0
8/14/2015 15:50 4.594 0.099515 0.000229 0.01 1.0668 8/29/15 10:25 4.094 0 0 0 0 10/10/15 12:25 2.815 0 0 0 0
8/14/2015 15:51 4.614 0.113742 0.000262 0 0.9144 8/29/15 10:26 4.075 0 0 0 0 10/10/15 12:26 2.815 0 0 0 0
8/14/2015 15:52 4.594 0.099515 0.000229 0.01 0.9144 8/29/15 10:27 4.075 0 0 0 0 10/10/15 12:27 2.795 0 0 0 0
8/14/2015 15:53 4.594 0.099515 0.000229 0.01 1.0668 8/29/15 10:28 4.055 0 0 0 0 10/10/15 12:28 2.795 0 0 0 0
8/14/2015 15:54 4.575 0.08681 0.0002 0 0.9144 8/29/15 10:29 4.055 0 0 0 0 10/10/15 12:29 2.795 0 0 0 0
8/14/2015 15:55 4.575 0.08681 0.0002 0.01 0.9144 8/29/15 10:30 4.035 0 0 0 0 10/10/15 12:30 2.776 0 0 0 0
8/14/2015 15:56 4.555 0.074289 0.000171 0 0.9144
8/14/2015 15:57 4.535 0.062644 0.000144 0.01 0.9144
8/14/2015 15:58 4.535 0.062644 0.000144 0.01 0.762
8/14/2015 15:59 4.535 0.062644 0.000144 0 0.9144
8/14/2015 16:00 4.535 0.062644 0.000144 0.01 0.9144
Level Data Flow RainLevel Data Flow Rain Level Data Flow Rain
Collected Event 1 : Aug 14th 2015 Collected Event 2 : Aug 29th 2015 Collected Event 3 : Oct. 10th 2015
Vol. Tare Dried Muff TSS VSS %VSS Sample Zn Ave. Zn Cu Ave. Cu Sample Zn Cu Sample Zn Cu
(mL) (g) (g) (g) (mg/L) (mg/L) (%) # (ppb) (ppb) (ppb) (ppb) # (ppb) (ppb) # (ppb) (ppb)
1 114.5 20.7
2 130.9 23.33 ‐ ‐4 109.3 12.85 106.0 12.26 110.1 11.97 114.5 22.08 106.7 21.59 108.7 21.310 87.5 15.311 86.9 14.912 89.4 16.01 58.5 8.12 60.5 8.03 56.2 7.34 29.1 5.75 26.0 3.56 41.6 3.67 18.7 10.28 18.7 10.29 18.7 9.910 10.7 6.211 10.6 6.512 10.8 6.21 31.4 3.02 58.8 3.03 31.2 3.04 13.4 2.65 25.6 2.6
6 45.4 2.7
80
6.21
‐122.7 22.0
2.0
1.6
244.9
295.0
218.2
149.4
44.3
21.6
15.4
Date
Solids (mg/L) T.M. Blanks (ppb)Total Metals (ppb)Filtered Sample
1.39580
500Influent (I2) (Samples 13‐24)
1.385
371.4061.398
pHSampler
26.7
108.5
110.0
87.9
12.3
1.4051.398Effluent (E4) (Samples 13‐24)
45.7
73.6
6.34
A
u
g
.
1
4
80Effluent (E3) (Samples 1‐12)
701721.4351.471
Influent (I1) (Samples 1‐12)
601101.3991.404
11.1
6.7
6.43
13
14
15
16
971.403
17
18
26791.403
5.9Influent (I2) (Samples 13‐24)
80 1.408 36 9 32.3 4.3 6.79
Influent (I1) (Samples 1‐12)
17
164 79 59.5 8.0 6.79 13 195.6 31.0
14 67.2
7.31
Influent (I1) (Samples 1‐6)
80 1.385 1.41 1.406 312 49 84%
Effluent (E3) (Samples 1‐12)
80 1.416 1.419 1.418
Effluent (E4) (Samples 13‐24)
80 1.394 1.395 1.395 11 5 10.7 6.3 7.33 16 24.1 8.5
34 19 18.7 10.1 15 47.7 17.0
1.395
11.5
1.401
15.328.1 2.6 6.65 8 78.1
0.5
18 2.8 0.5
9 15.0 4.3
37.745.1 3.0 6.66 7 143.2
1.408
64%
O
c
t
.
1
0
45%
59%
62%
67%
52%
76%
44%
56%
Effluent (I2) (Samples 1‐6)
80 1.412 1.422 1.419 130 46
1.411 1.41
A
u
g
.
2
9
80
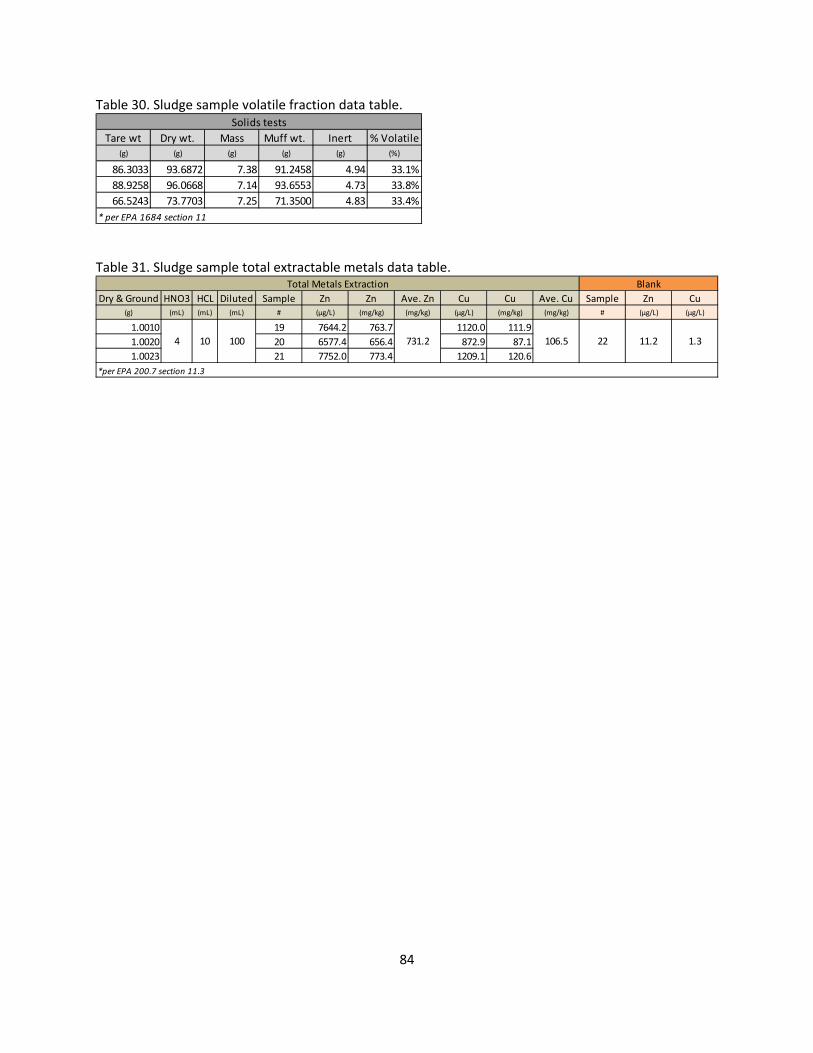
84
Table 30. Sludge sample volatile fraction data table.
Table 31. Sludge sample total extractable metals data table.
Tare wt Dry wt. Mass Muff wt. Inert % Volatile(g) (g) (g) (g) (g) (%)
86.3033 93.6872 7.38 91.2458 4.94 33.1%
88.9258 96.0668 7.14 93.6553 4.73 33.8%
66.5243 73.7703 7.25 71.3500 4.83 33.4%
* per EPA 1684 section 11
Solids tests
Dry & Ground HNO3 HCL Diluted Sample Zn Zn Ave. Zn Cu Cu Ave. Cu Sample Zn Cu(g) (mL) (mL) (mL) # (μg/L) (mg/kg) (mg/kg) (μg/L) (mg/kg) (mg/kg) # (μg/L) (μg/L)
1.0010 19 7644.2 763.7 1120.0 111.9
1.0020 20 6577.4 656.4 872.9 87.1
1.0023 21 7752.0 773.4 1209.1 120.6
Blank
22 11.2 1.3
*per EPA 200.7 section 11.3
731.21004 10 106.5
Total Metals Extraction
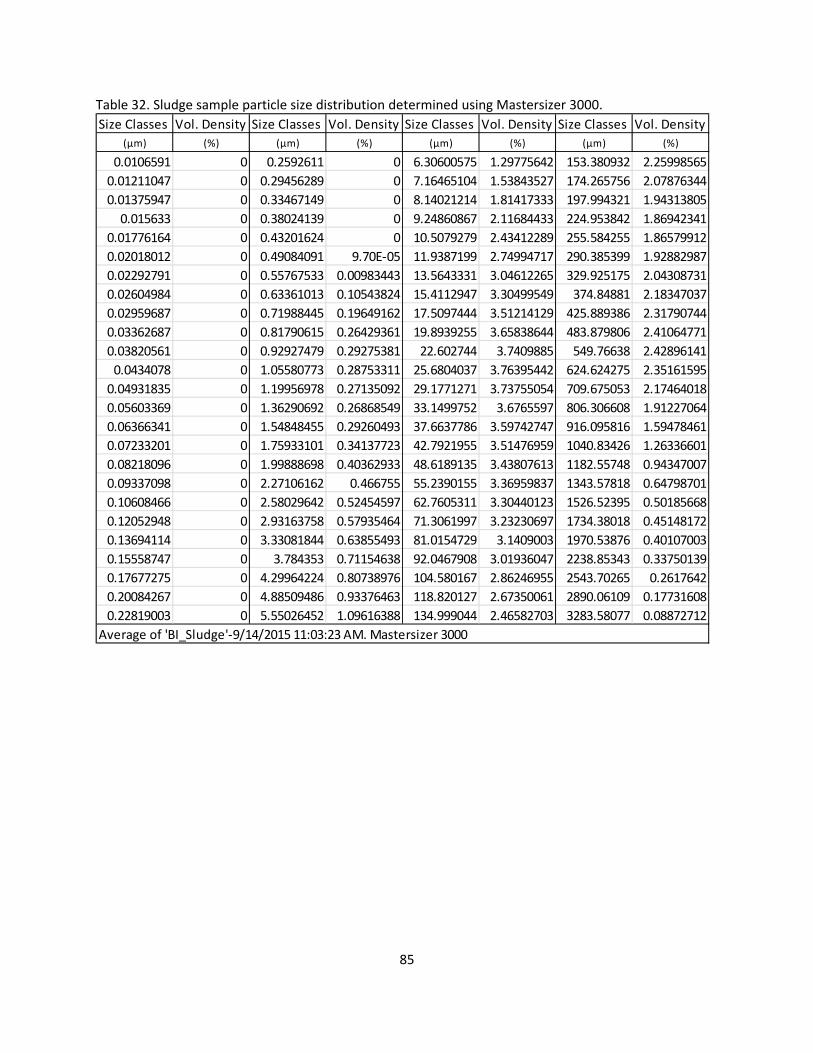
85
Table 32. Sludge sample particle size distribution determined using Mastersizer 3000.
Size Classes Vol. Density Size Classes Vol. Density Size Classes Vol. Density Size Classes Vol. Density
(μm) (%) (μm) (%) (μm) (%) (μm) (%)
0.0106591 0 0.2592611 0 6.30600575 1.29775642 153.380932 2.25998565
0.01211047 0 0.29456289 0 7.16465104 1.53843527 174.265756 2.07876344
0.01375947 0 0.33467149 0 8.14021214 1.81417333 197.994321 1.94313805
0.015633 0 0.38024139 0 9.24860867 2.11684433 224.953842 1.86942341
0.01776164 0 0.43201624 0 10.5079279 2.43412289 255.584255 1.86579912
0.02018012 0 0.49084091 9.70E‐05 11.9387199 2.74994717 290.385399 1.92882987
0.02292791 0 0.55767533 0.00983443 13.5643331 3.04612265 329.925175 2.04308731
0.02604984 0 0.63361013 0.10543824 15.4112947 3.30499549 374.84881 2.18347037
0.02959687 0 0.71988445 0.19649162 17.5097444 3.51214129 425.889386 2.31790744
0.03362687 0 0.81790615 0.26429361 19.8939255 3.65838644 483.879806 2.41064771
0.03820561 0 0.92927479 0.29275381 22.602744 3.7409885 549.76638 2.42896141
0.0434078 0 1.05580773 0.28753311 25.6804037 3.76395442 624.624275 2.35161595
0.04931835 0 1.19956978 0.27135092 29.1771271 3.73755054 709.675053 2.17464018
0.05603369 0 1.36290692 0.26868549 33.1499752 3.6765597 806.306608 1.91227064
0.06366341 0 1.54848455 0.29260493 37.6637786 3.59742747 916.095816 1.59478461
0.07233201 0 1.75933101 0.34137723 42.7921955 3.51476959 1040.83426 1.26336601
0.08218096 0 1.99888698 0.40362933 48.6189135 3.43807613 1182.55748 0.94347007
0.09337098 0 2.27106162 0.466755 55.2390155 3.36959837 1343.57818 0.64798701
0.10608466 0 2.58029642 0.52454597 62.7605311 3.30440123 1526.52395 0.50185668
0.12052948 0 2.93163758 0.57935464 71.3061997 3.23230697 1734.38018 0.45148172
0.13694114 0 3.33081844 0.63855493 81.0154729 3.1409003 1970.53876 0.40107003
0.15558747 0 3.784353 0.71154638 92.0467908 3.01936047 2238.85343 0.33750139
0.17677275 0 4.29964224 0.80738976 104.580167 2.86246955 2543.70265 0.2617642
0.20084267 0 4.88509486 0.93376463 118.820127 2.67350061 2890.06109 0.17731608
0.22819003 0 5.55026452 1.09616388 134.999044 2.46582703 3283.58077 0.08872712
Average of 'BI_Sludge'‐9/14/2015 11:03:23 AM. Mastersizer 3000
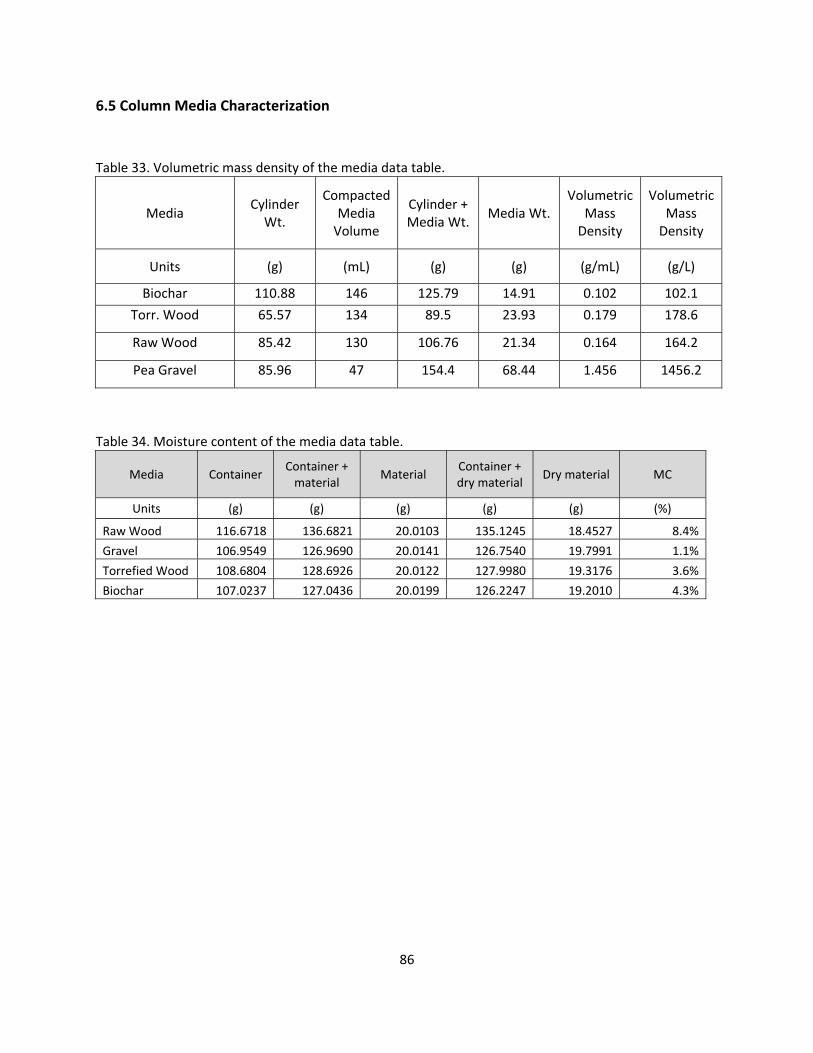
86
6.5 Column Media Characterization
Table 33. Volumetric mass density of the media data table.
Media Cylinder Wt.
Compacted Media Volume
Cylinder + Media Wt.
Media Wt. Volumetric
Mass Density
Volumetric Mass Density
Units (g) (mL) (g) (g) (g/mL) (g/L)
Biochar 110.88 146 125.79 14.91 0.102 102.1
Torr. Wood 65.57 134 89.5 23.93 0.179 178.6
Raw Wood 85.42 130 106.76 21.34 0.164 164.2
Pea Gravel 85.96 47 154.4 68.44 1.456 1456.2
Table 34. Moisture content of the media data table.
Media Container Container + material
Material Container + dry material
Dry material MC
Units (g) (g) (g) (g) (g) (%)
Raw Wood 116.6718 136.6821 20.0103 135.1245 18.4527 8.4%
Gravel 106.9549 126.9690 20.0141 126.7540 19.7991 1.1%
Torrefied Wood 108.6804 128.6926 20.0122 127.9980 19.3176 3.6%
Biochar 107.0237 127.0436 20.0199 126.2247 19.2010 4.3%