Embed Size (px)
Citation preview
sustainability
Article
Assessment of Ecological Efficiencyand Environmental Sustainability ofthe Minjiang-Source in China
Junlong Li 1, Chuangneng Cai 2,* and Feng Zhang 3
1 School of Economics and Management & Research Center of Low Carbon Economy, Sanming University,Sanming 365004, China; [email protected]
2 Business School, Shantou University, Shantou 515063, China3 State Key Laboratory of Grassland Agro-ecosystems, Institute of Arid Agroecology, School of Life Sciences,
Lanzhou University, Lanzhou 730000, China; [email protected]* Correspondence: [email protected]; Tel.: +86-1585-925-0061
Received: 21 April 2020; Accepted: 8 June 2020; Published: 11 June 2020�����������������
Abstract: Ecological sustainability is treated as a main reflection of the synergy among socialdevelopment, economic growth and environmental protection, while ecological efficiency is an indexused to reflect the sustainable development of the ecological environment. The super efficiency modelwith undesirable outputs (SE-SBM) model was applied to measure the eco-efficiency of the 12 countiesin the Minjiang-Source, China, in 2005–2017. The spatial and temporal evolution and spatialdifferentiation of the eco-efficiency were analyzed. The results showed that the eco-efficiency of67.7% of the 12 counties remains at a low level but with an increasing trend. A typical spatialaggregation effect was found with the characteristics of “high in the east and low in the west”.The Malmquist-Luenberger index shows a trend of fluctuation with the same trend between scaleefficiency and technical efficiency changes. The results proved the positive effect of technologicalprogress on local eco-efficiency. Environmental regulation has a positive impact on eco-efficiencyin the short term and an inhibition effect in the long run. Hence, technological innovation and industrialadjustment will be an effective way to improve the eco-efficiency of the Minjiang-Source and promoteits sustainability.
Keywords: eco-efficiency; SE-SBM model; sustainability assessment; key ecological functional areas;Minjiang-Source
1. Introduction
For ages, society has made great efforts towards economic development while consuming too manynatural resources, bringing severe pollution problems. Due to natural resource constraint, the world,especially China, is facing a lot of environmental and ecological problems, such as air pollutionand ecological damage. To overcome these problems, the Chinese government has taken a lot ofmeasures, such as laws like the Pollution Prevention Act and the Environmental Protection Act, measureslike cleaner production and a recycling economy, and systems like the environmental protectionadministrative system of interviews. It has experienced a great evolution, both in practice and theory,from an administrative management-based approach to an economic instruments-based approach,from environmental protection to sustainable development, and from pollution control to ecologicalconservation [1]. A vast work has been addressed towards awareness of ecological conservation.
Meanwhile, the Chinese government also chose some areas as the key ecological functional ones toundertake the ecological functions of ecological guarantee, resource reserve and landscape construction.Key ecological functional areas are areas with extremely important ecosystems and are closely related
Sustainability 2020, 12, 4783; doi:10.3390/su12114783 www.mdpi.com/journal/sustainability
Sustainability 2020, 12, 4783 2 of 15
to the ecological security of the country or a wide range of regions. However, these areas have beendeteriorating, and there is need to limit large-scale and high-strength development of urbanizationand industrialization in the nation to maintain and improve the supply capacity of ecologicalproducts [2]. For a long time, the key ecological functional areas have been troubled by the difficultyin coordinating ecological environment protection and regional economic development, as well asby the severe challenges of resource demand pressure and ecological environment destruction [3,4].How to optimally explore ecological benefits on the premise of minimum resource consumptionand environmental investment has become a key issue to promote the construction of ecologicalcivilization in the key ecological functional areas in China at the present stage. With the continuousadvance in ecological civilization construction and the proposition of the coordinated concept ofsocial development, economic growth and ecological environment protection, it is urgent to guidethe sustainable development of both the social economy and ecological environment in the keyecological functional areas in China.
Ecological efficiency (Eco-efficiency) is a representational index that reflects the coordinateddevelopment of regional social development, economic growth and ecological environment [5,6].Through embedding ecological consumption of resources into the traditional input-output accounting [7,8],eco-efficiency has become an important tool for regional sustainability assessment. Extant studies onregional eco-efficiency assessment mainly focus on the evaluation of large-scale regions, such as the nationallevel [9–11], trans-regional level [12,13] and provincial level [14,15]. However, there are few studies onregions at the county level, especially on the evaluation of eco-efficiency in key ecological functional areas.
Evaluation of ecological benefit is the basis and focus of ecological benefit research. With regardsto the selection of an eco-efficiency evaluation index, most studies choose environmental pollutionand resource consumption as input indicators, and regional production indicators as outputindicators [16,17]. For example, the discharge of waste water, waste gas and waste solid are used asinputs in efficiency evaluation, which is not consistent with the actual situation [18,19]. In the evaluationof regional eco-efficiency, the indexes should be expanded or adjusted appropriately according tothe differentiation in the connotation of the research objects [20]. Therefore, the establishment of ascientific and reasonable evaluation model and a scientific index system in typical regions is crucial tothe measurement of eco-efficiency and the assessment of sustainability.
Although the existing studies provide a good theoretical basis for the present study, there is alack of evaluation of eco-efficiency at the meso-level, and few studies on the evaluation of the keyecological functional areas. The key ecological functional areas are greatly restricted by the ecologicalenvironmental protection system and have great differences in eco-efficiency evaluations compared tothose at a larger scale area or macro level. Based on this, this study applies the undesirable output ofsuper efficiency (Super-SBM) model and the undesirable output model of total factor productivity index(ML) in Minjiang-Source to empirically analyze the temporal and spatial evolution of eco-efficiencyand the factors influencing it. The results provide reference for the sustainable development of keyecological function areas and provide scientific basis for local policy making.
2. Study Area, Indicators and Data
2.1. Study Area
Minjiang-Source is a key ecological functional area in Fujian province, China. The area islocated in the northwest of Fujian province, within the jurisdiction of two districts, one city and ninecounties, and a total area of 22,900 square kilometers (See Figure 1). There are six provincial-leveland five national-level nature reserves, covering a total area of 85,800 hectares, accounting for 3.7% ofthe land area. There are three national-level and four provincial-level scenic spots, with a total area of27,200 hectares, accounting for 1.18% of the land area. In 2017, the regional GDP reached 210.26 billionChinese yuan (RMB), the per capita GDP was 83,000 RMB, the per capita public revenue was 5700 RMB,

Sustainability 2020, 12, 4783 3 of 15
the per capita disposable income of rural residents was 15,000 RMB, and the per capita disposableincome of urban residents was 32,000 RMB.
Sustainability 2020, 12, x FOR PEER REVIEW 3 of 18
RMB, the per capita disposable income of rural residents was 15,000 RMB, and the per capita
disposable income of urban residents was 32,000 RMB.
Figure 1. Geographic location of Minjiang-Source.
2.2. Indicators and Data
2.2.1. Selection of Evaluation Indicators
Eco-efficiency refers to the ratio of the value obtained from regional economic activities and their
negative impact on the environment to the actual resource inputs [21]. Based on the evaluation index
of eco-efficiency from previous studies, construction land, water consumption, labor force, energy
and crop planting area were selected as input indexes according to the characteristics of Minjiang-
Source and data availability. Of these, construction land is represented by the urban construction
area, water consumption is represented by water consumption of industrial enterprises above
designated size, labor force is represented by the labor force at the end of the year, energy is
represented by the comprehensive energy consumption, and crop planting area is represented by the
area for planting crops. GDP, urban disposable income, rural disposable income, urban per capita
green area and major grain yields were selected as desirable output indicators. Industrial waste water
emissions, chemical oxygen demand (COD) emissions, ammonia nitrogen emissions, industrial
exhaust emissions, industrial soot (dust) emissions, sulfur dioxide (SO2) emissions and industrial
solid waste production were selected as undesirable output indicators; detailed indicators are shown
in Table 1.
Table 1. The evaluation indicators of eco-efficiency in the Minjiang-Source.
Categories Indicators Units
Inputs
Construction land Square Kilometers
Water consumption 10,000 Cube Meters
Labor force 10,000
Energy Tons of Standard Coal
Crop planting area Acre
Desirable Outputs
GDP 100 Million RMB
Urban disposable income RMB
Rural disposable income RMB
Urban per capita green area Square Meters
Figure 1. Geographic location of Minjiang-Source.
2.2. Indicators and Data
2.2.1. Selection of Evaluation Indicators
Eco-efficiency refers to the ratio of the value obtained from regional economic activities and theirnegative impact on the environment to the actual resource inputs [21]. Based on the evaluationindex of eco-efficiency from previous studies, construction land, water consumption, labor force,energy and crop planting area were selected as input indexes according to the characteristics ofMinjiang-Source and data availability. Of these, construction land is represented by the urbanconstruction area, water consumption is represented by water consumption of industrial enterprisesabove designated size, labor force is represented by the labor force at the end of the year, energy isrepresented by the comprehensive energy consumption, and crop planting area is represented bythe area for planting crops. GDP, urban disposable income, rural disposable income, urban per capitagreen area and major grain yields were selected as desirable output indicators. Industrial waste wateremissions, chemical oxygen demand (COD) emissions, ammonia nitrogen emissions, industrial exhaustemissions, industrial soot (dust) emissions, sulfur dioxide (SO2) emissions and industrial solid wasteproduction were selected as undesirable output indicators; detailed indicators are shown in Table 1.
Table 1. The evaluation indicators of eco-efficiency in the Minjiang-Source.
Categories Indicators Units
Inputs
Construction land Square KilometersWater consumption 10,000 Cube Meters
Labor force 10,000Energy Tons of Standard Coal
Crop planting area Acre
Desirable Outputs
GDP 100 Million RMBUrban disposable income RMBRural disposable income RMB
Urban per capita green area Square MetersMajor grain yields Ton
Undesirable Outputs
Industrial waste water emissions 10,000 TonsChemical oxygen demand (COD)
emissions Ton
Ammonia nitrogen emissions TonIndustrial exhaust emissions 100 Million Cube Meters
Industrial soot (dust) emissions TonSulfur dioxide (SO2) emissions Ton
Industrial solid waste production 10,000 Tons

Sustainability 2020, 12, 4783 4 of 15
2.2.2. Data
The data used mainly comes from Sanming statistical yearbook, county-level statistical yearbooks(Meilie, Sanyuan, Yongan, Mingxi, Qingliu, Ninghua, Datian, Youxi, Shaxian, Jiangle, Taining,and Jianning County), and the county-level environmental bulletin, environmental quality report,and statistical bulletin of the national economy and social development from 2005 to 2017.
2.2.3. Data Preprocessing
The purpose of data preprocessing is to eliminate the influences of inflation, magnitudeand dimensions on the evaluation. First, GDP, urban and rural disposable incomes, and environmentaltreatment investment were converted according to the consumer price index (CPI) based on 2005.Then the original data was standardized. Let standardized variables be z. j , the data of the jth variableon the ith year be xij, the mean of the jth variable be x. j. Thus, the formula is as follows:
z. j =xi j − x. j
x. j(1)
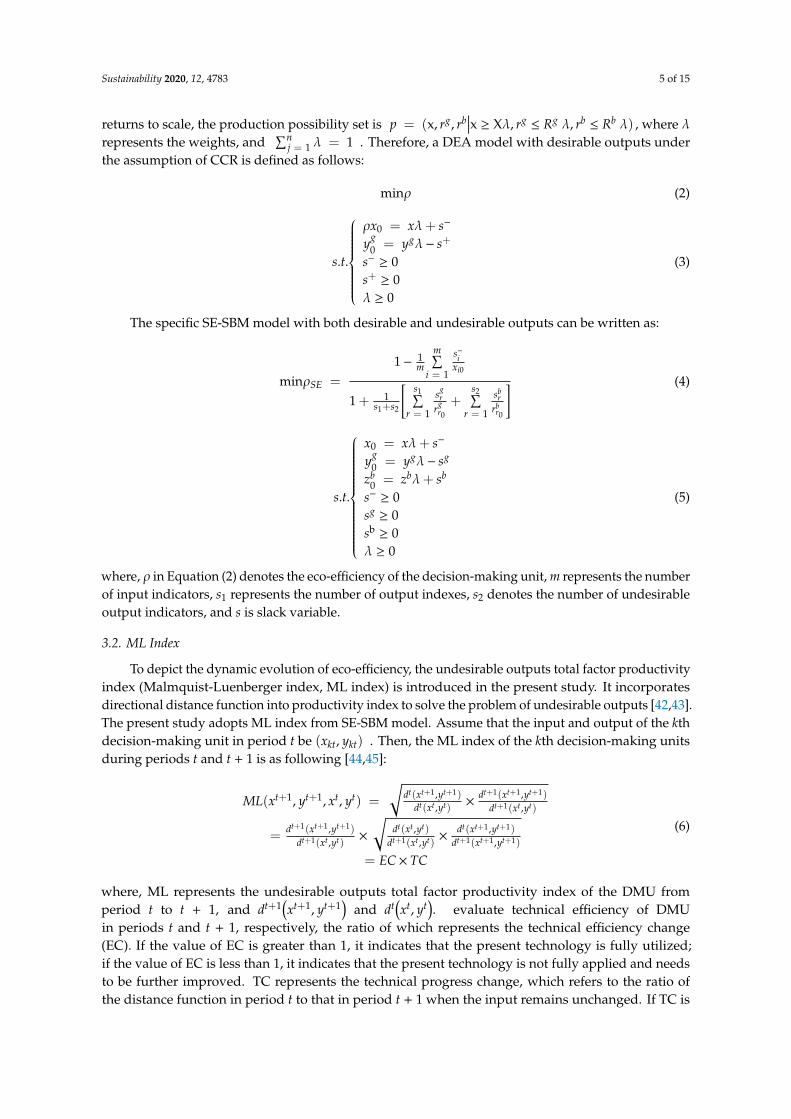
3. Research Method
3.1. SE-SBM Model
Existing methods on evaluation of eco-efficiency include logistics analysis [22], index method [23],stochastic frontier analysis (SFA) [24,25] and data envelopment analysis (DEA) [26,27]. The logisticsanalysis method requires strict restrictions on dataset of the evaluation object [8,28]. The indexmethod is more suitable for independent, discontinuous and single research object. When evaluatingsystems with continuous multi-inputs and multi-outputs, the weight in index method is difficult todetermine and vulnerable to subjective influence [29]. The SFA method can objectively and reasonablyassign weights [30], but it is a parameter estimation method which needs to determine a specificmathematical function form in advance, while the DEA model does not need to consider specificfunctions and weights when dealing with multi-inputs and multi-outputs problem [27,31], makingit a more extensive method for evaluating eco-efficiency [32,33]. It is a nonparametric evaluationmulti-objective decision model which is generally applied to measure the relative efficiency of adecision-making unit (DMU) with multiple inputs and outputs. Its biggest strength is not needing toconsider the specific function between the inputs and outputs and to presuppose the parameters whichto some extent helps to avoid subjectivity [19]. However, the traditional DEA uses input and outputslacks directly, while not taking into account the undesirable outputs, which leads the measurementresults deviating from the actual [34]. In addition, the efficiency values in the DEA models of Charnes,Cooper and Rhodes (CCR) [35] and Banker, Charnes and Cooper (BCC) [36] are between 0 and 1with 1 as the optimal efficiency. It is difficult to compare when there are multiple 1’s in the efficiencyvalue [37,38].
The super efficiency model (SE-DEA) solves the drawbacks of the CCR and BCC methods,that it is difficult to compare efficiency when there are multiples efficiency values equal to 1 [39].Furthermore, Zhou and Wang [38] proposed a Super-SBM model which effectively solves the problemsof slack variables and non-comparability. The undesirable output model (SBM) takes into accountboth the undesirable outputs and the problem of relaxation in the traditional DEA model, which canprovide a more accurate measurement of efficiency and overcome the problem of deviation fromthe actual results caused by the undesirable outputs [40]. Therefore, in order to solve the problem ofrelaxation and the incomparable problem when decision unit is greater than 1, the super efficiencymodel and undesirable output model (SBM) were incorporated as a super efficiency model withundesirable output (SE-SBM) in the study [41]. Supposing there are n decision units, the inputmatrix is denoted as X = (xio) ∈ Rm×n , the desirable output matrix as Rg =
(rg
r0
)∈ Rs1×n ,
and the undesirable output matrix as Rb = (rbr0) ∈ Rs2×n , where X >0, Rg > 0, Rb > 0. In cases of
Sustainability 2020, 12, 4783 5 of 15
returns to scale, the production possibility set is p = (x, rg, rb∣∣∣x ≥ Xλ, rg
≤ Rg λ, rb≤ Rb λ) , where λ
represents the weights, and∑n
j = 1 λ = 1 . Therefore, a DEA model with desirable outputs underthe assumption of CCR is defined as follows:
minρ (2)
s.t.
ρx0 = xλ+ s−
yg0 = ygλ− s+
s− ≥ 0s+ ≥ 0λ ≥ 0
(3)
The specific SE-SBM model with both desirable and undesirable outputs can be written as:
minρSE =
1− 1m
m∑i = 1
s−ixi0
1 + 1s1+s2
[s1∑
r = 1
sgr
rgr0
+s2∑
r = 1
sbr
rbr0
] (4)
s.t.
x0 = xλ+ s−
yg0 = ygλ− sg
zb0 = zbλ+ sb
s− ≥ 0sg≥ 0
sb≥ 0
λ ≥ 0
(5)
where, ρ in Equation (2) denotes the eco-efficiency of the decision-making unit, m represents the numberof input indicators, s1 represents the number of output indexes, s2 denotes the number of undesirableoutput indicators, and s is slack variable.
3.2. ML Index
To depict the dynamic evolution of eco-efficiency, the undesirable outputs total factor productivityindex (Malmquist-Luenberger index, ML index) is introduced in the present study. It incorporatesdirectional distance function into productivity index to solve the problem of undesirable outputs [42,43].The present study adopts ML index from SE-SBM model. Assume that the input and output of the kthdecision-making unit in period t be (xkt, ykt) . Then, the ML index of the kth decision-making unitsduring periods t and t + 1 is as following [44,45]:
ML(xt+1, yt+1, xt, yt) =
√dt(xt+1,yt+1)
dt(xt,yt)×
dt+1(xt+1,yt+1)
dt+1(xt,yt)
=dt+1(xt+1,yt+1)
dt+1(xt,yt)×
√dt(xt,yt)
dt+1(xt,yt)×
dt(xt+1,yt+1)
dt+1(xt+1,yt+1)
= EC× TC
(6)
where, ML represents the undesirable outputs total factor productivity index of the DMU fromperiod t to t + 1, and dt+1
(xt+1, yt+1
)and dt
(xt, yt
). evaluate technical efficiency of DMU
in periods t and t + 1, respectively, the ratio of which represents the technical efficiency change(EC). If the value of EC is greater than 1, it indicates that the present technology is fully utilized;if the value of EC is less than 1, it indicates that the present technology is not fully applied and needsto be further improved. TC represents the technical progress change, which refers to the ratio ofthe distance function in period t to that in period t + 1 when the input remains unchanged. If TC is
Sustainability 2020, 12, 4783 6 of 15
greater than 1, it represents the forward movement, indicating the technical progress. The detailedflow chart of the proposed method is reported in Figure 2.
Sustainability 2020, 12, x FOR PEER REVIEW 6 of 18
where, ML represents the undesirable outputs total factor productivity index of the DMU from period
t to t + 1, and ����(����,����) and ��(��,��) evaluate technical efficiency of DMU in periods t
and t + 1, respectively, the ratio of which represents the technical efficiency change (EC). If the value
of EC is greater than 1, it indicates that the present technology is fully utilized; if the value of EC is
less than 1, it indicates that the present technology is not fully applied and needs to be further
improved. TC represents the technical progress change, which refers to the ratio of the distance
function in period t to that in period t + 1 when the input remains unchanged. If TC is greater than 1,
it represents the forward movement, indicating the technical progress. The detailed flow chart of the
proposed method is reported in Figure 2.
Figure 2. Flow chart of the proposed model.
4. Empirical Analysis and Results
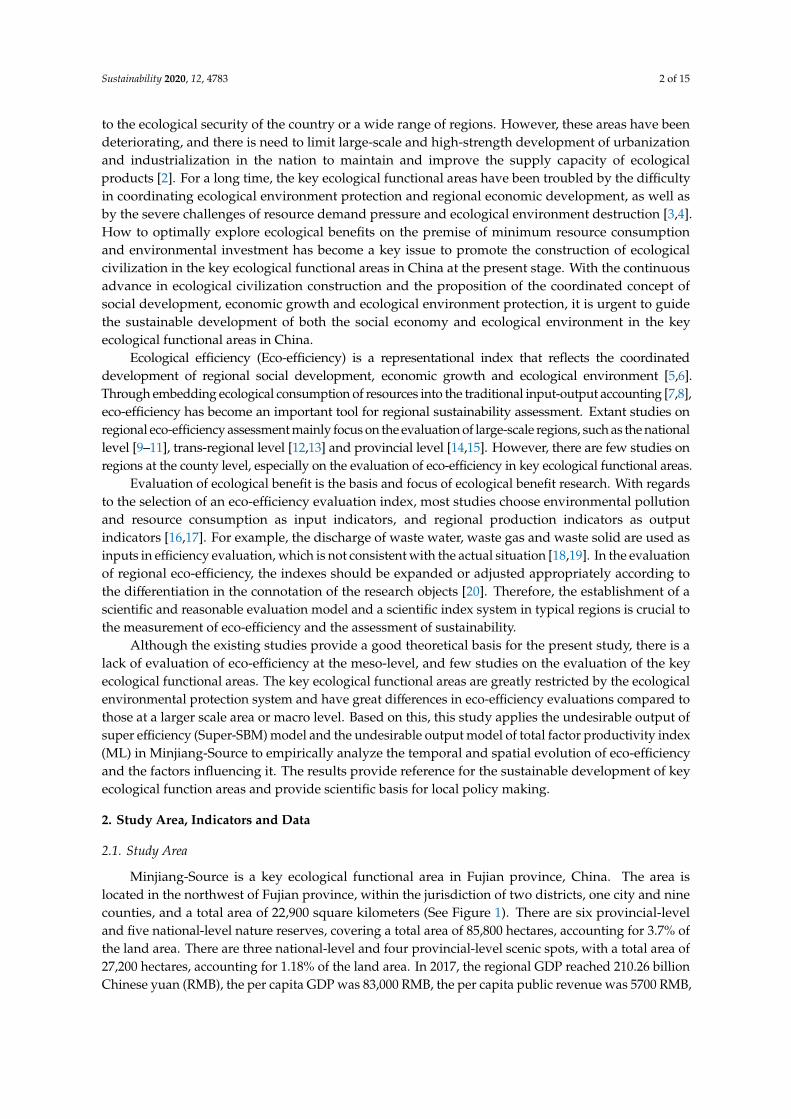
4.1. Eco-Efficiency Analysis of Minjiang-Source
The eco-efficiency value of Minjiang-Source from 2005 to 2017 was calculated by SE-SBM, the
result of which is shown in Table 2. In this study, eco-efficiency is divided into four levels, which are
super efficiency ( � ≥ 1 ), medium efficiency ( 0.8 ≤ � < 1 ), low efficiency ( 0.6 ≤ � < 0.8 ) and
inefficiency ( � < 0.6 ) [46].
From the perspective of time dimension (Table 2), the eco-efficiency values of Minjiang-Source
from 2005 to 2017 were at the following efficiency levels: the eco-efficiency from 2005 to 2012 was at
the low efficiency level, from 2013 to 2016 at the medium efficiency level, and in 2017 at the super
efficiency level. However, in the past 13 years, the growth rate of eco-efficiency exhibited a trend of
fluctuation, gradually increasing year by year at first, then decreasing sharply, and then gradually
increasing again. According to the analysis from the regional dimension (Table 2), among the 12
counties in Minjiang-Source, 67.7% of which were at the inefficiency level, in Meilie at the super
efficiency level, and in Ninghua at the low efficiency level. The mean of the eco-efficiency value in
two districts located in the downtown, Sanyuan and Meilie, were 1.084 and 0.939, significantly higher
than that of other counties in the city. This is probably because the overall economic development
level in the downtown is better than other counties, with a typical urban cluster effect, such as a
Choose DMUs
Identification of input/output variables and collection of data
SE-SBM model
Eco-efficiency
ML index model Panel data
Regression model Spatial analysis
ML index Influence factors Spatial dynamic change
Conclusion
Figure 2. Flow chart of the proposed model.
4. Empirical Analysis and Results
4.1. Eco-Efficiency Analysis of Minjiang-Source
The eco-efficiency value of Minjiang-Source from 2005 to 2017 was calculated by SE-SBM, the resultof which is shown in Table 2. In this study, eco-efficiency is divided into four levels, which are superefficiency (ρ ≥ 1 ), medium efficiency (0.8 ≤ ρ < 1 ), low efficiency ( 0.6 ≤ ρ < 0.8 ) and inefficiency(ρ < 0.6) [46].
Table 2. Eco-efficiency in the Minjiang-Source during 2005–2017.
Year Meilie Sanyuan Yongan Mingxi Qingliu Ninhua Datian Youxi Shaxian Jiangle Taining Jianning Mean
2005 1.160 0.801 0.482 0.582 0.566 0.442 0.510 0.474 0.463 0.526 0.577 0.624 0.6012006 0.989 0.830 0.500 0.602 0.560 0.456 0.455 0.497 0.487 0.545 0.726 0.641 0.6072007 0.948 0.766 0.523 0.595 0.540 0.445 0.809 0.512 0.498 0.546 0.891 0.568 0.6372008 1.027 0.957 0.572 0.617 0.616 0.467 0.509 0.544 0.538 0.566 0.671 0.644 0.6442009 1.167 0.938 0.700 0.641 0.693 0.505 0.587 0.581 0.577 0.614 0.703 0.708 0.7012010 1.596 1.246 0.678 0.645 0.689 0.520 0.623 0.642 0.612 0.632 0.694 0.734 0.7762011 1.035 0.970 0.880 0.721 0.741 0.602 0.788 0.734 0.778 0.730 0.802 0.729 0.7922012 1.025 0.866 0.783 0.751 0.797 0.625 0.742 0.741 0.760 0.748 0.820 0.810 0.7892013 0.938 0.852 0.806 0.752 0.790 0.661 0.771 0.809 0.824 0.789 0.865 0.884 0.8122014 0.928 0.902 0.874 0.785 0.817 0.702 0.813 0.881 0.878 0.813 0.906 0.934 0.8532015 0.931 0.944 0.889 0.830 0.869 0.726 0.828 0.908 0.896 0.840 0.940 0.963 0.8802016 0.921 0.966 0.944 0.850 0.909 0.807 0.872 0.987 0.945 0.866 0.980 0.982 0.9192017 1.737 1.325 1.320 0.896 0.980 0.858 1.016 1.219 1.168 0.903 1.016 0.973 1.117Mean 1.084 0.939 0.735 0.706 0.723 0.586 0.698 0.704 0.696 0.689 0.804 0.771
From the perspective of time dimension (Table 2), the eco-efficiency values of Minjiang-Sourcefrom 2005 to 2017 were at the following efficiency levels: the eco-efficiency from 2005 to 2012 was at

Sustainability 2020, 12, 4783 7 of 15
the low efficiency level, from 2013 to 2016 at the medium efficiency level, and in 2017 at the superefficiency level. However, in the past 13 years, the growth rate of eco-efficiency exhibited a trend offluctuation, gradually increasing year by year at first, then decreasing sharply, and then graduallyincreasing again. According to the analysis from the regional dimension (Table 2), among the 12 countiesin Minjiang-Source, 67.7% of which were at the inefficiency level, in Meilie at the super efficiency level,and in Ninghua at the low efficiency level. The mean of the eco-efficiency value in two districts locatedin the downtown, Sanyuan and Meilie, were 1.084 and 0.939, significantly higher than that of othercounties in the city. This is probably because the overall economic development level in the downtownis better than other counties, with a typical urban cluster effect, such as a relatively stronger talentaggregation effect, a more developed science and technology, medical and health care, and a relativelyhigher investment in ecological environment governances, etc.
From the perspective of decomposed efficiency, Figure 3 reflects comprehensive eco-efficiency (CE),pure technical efficiency (TE) and scale efficiency (SE) of the average eco-efficiency of Minjiang-Sourcefrom 2005 to 2017. Specifically, the comprehensive eco-efficiency of Minjiang-Source showed anincreasing trend. The change rules of comprehensive eco-efficiency and technical efficiency are similar,indicating a strong positive correlation between eco-efficiency and technical efficiency, and technologicalprogress plays a positive role in improving eco-efficiency. Therefore, to improve eco-efficiency meansadjusting the industrial structure, promoting industrial transformation and upgrading, increasinginvestment in science and technology, and focusing on the development of high-tech industry.
Sustainability 2020, 12, x FOR PEER REVIEW 9 of 18
From the perspective of decomposed efficiency, Figure 3 reflects comprehensive eco-efficiency
(CE), pure technical efficiency (TE) and scale efficiency (SE) of the average eco-efficiency of Minjiang-
Source from 2005 to 2017. Specifically, the comprehensive eco-efficiency of Minjiang-Source showed
an increasing trend. The change rules of comprehensive eco-efficiency and technical efficiency are
similar, indicating a strong positive correlation between eco-efficiency and technical efficiency, and
technological progress plays a positive role in improving eco-efficiency. Therefore, to improve eco-
efficiency means adjusting the industrial structure, promoting industrial transformation and
upgrading, increasing investment in science and technology, and focusing on the development of
high-tech industry.
The overall variation of the eco-efficiency across the 12 counties of Minjiang-Source was not
significant over the years (Figure 4). The dispersion degree of the eco-efficiency of Yongan, Shaxian
and Youxi counties was relatively high, which indicates that the eco-efficiency values of these three
counties fluctuate greatly and the stability is relatively poor. Meilie, Sanyuan, Taining and Mingxi
had a smaller degree of dispersion, indicating a relatively stable eco-efficiency. However, there are
outliers in Meilie and Sanyua; both appeared in 2010 and 2017.
Figure 3. Temporal change trend of decomposed value of eco-efficiency in the Minjiang-Source
during 2005–2017. Note: CE = Comprehensive Efficiency, TE = Pure Technical Efficiency, SE = Scale
Efficiency.
0.4
0.5
0.6
0.7
0.8
0.9
1
1.1
1.2
1.3
2005 2006 2007 2008 2009 2010 2011 2012 2013 2014 2015 2016 2017
Eco
-eff
icie
ncy
Year
CE SE TE
Figure 3. Temporal change trend of decomposed value of eco-efficiency in the Minjiang-Source during2005–2017. Note: CE = Comprehensive Efficiency, TE = Pure Technical Efficiency, SE = Scale Efficiency.
The overall variation of the eco-efficiency across the 12 counties of Minjiang-Source was notsignificant over the years (Figure 4). The dispersion degree of the eco-efficiency of Yongan, Shaxianand Youxi counties was relatively high, which indicates that the eco-efficiency values of these threecounties fluctuate greatly and the stability is relatively poor. Meilie, Sanyuan, Taining and Mingxi hada smaller degree of dispersion, indicating a relatively stable eco-efficiency. However, there are outliersin Meilie and Sanyua; both appeared in 2010 and 2017.

Sustainability 2020, 12, 4783 8 of 15Sustainability 2020, 12, x FOR PEER REVIEW 10 of 18
Figure 4. Boxplot of average eco-efficiency in the Minjiang-Source during 2005–2017.
4.2. Index Analysis of ML Index in Minjiang Source
In order to further analyze the dynamic change trend of the eco-efficiency of Minjiang-Source
over time, this paper calculated the Malmquist-Luenberger index (ML), technical efficiency change
(EC) and technical progress change (TC) of the undesirable output total factor production efficiency
index. The mean value across different counties was calculated and is shown in Figure 5. From 2006
to 2017, the ML indexes of Minjiang-Source showed a fluctuating trend, with an average of 1.046,
indicating that ecological environment, social development and economic development of Minjiang-
Source basically reached a coordinated development.
Figure 5. Average Malmquist-Luenberger Index in the Minjiang-Source in 2006–2017.
0
0.2
0.4
0.6
0.8
1
1.2
1.4
2006 2007 2008 2009 2010 2011 2012 2013 2014 2015 2016 2017
ML
Ind
ex
Year
Figure 4. Boxplot of average eco-efficiency in the Minjiang-Source during 2005–2017.
4.2. Index Analysis of ML Index in Minjiang Source
In order to further analyze the dynamic change trend of the eco-efficiency of Minjiang-Source overtime, this paper calculated the Malmquist-Luenberger index (ML), technical efficiency change (EC)and technical progress change (TC) of the undesirable output total factor production efficiency index.The mean value across different counties was calculated and is shown in Figure 5. From 2006 to 2017,the ML indexes of Minjiang-Source showed a fluctuating trend, with an average of 1.046, indicating thatecological environment, social development and economic development of Minjiang-Source basicallyreached a coordinated development.
Sustainability 2020, 12, x FOR PEER REVIEW 10 of 18
Figure 4. Boxplot of average eco-efficiency in the Minjiang-Source during 2005–2017.
4.2. Index Analysis of ML Index in Minjiang Source
In order to further analyze the dynamic change trend of the eco-efficiency of Minjiang-Source
over time, this paper calculated the Malmquist-Luenberger index (ML), technical efficiency change
(EC) and technical progress change (TC) of the undesirable output total factor production efficiency
index. The mean value across different counties was calculated and is shown in Figure 5. From 2006
to 2017, the ML indexes of Minjiang-Source showed a fluctuating trend, with an average of 1.046,
indicating that ecological environment, social development and economic development of Minjiang-
Source basically reached a coordinated development.
Figure 5. Average Malmquist-Luenberger Index in the Minjiang-Source in 2006–2017.
0
0.2
0.4
0.6
0.8
1
1.2
1.4
2006 2007 2008 2009 2010 2011 2012 2013 2014 2015 2016 2017
ML
Ind
ex
Year
Figure 5. Average Malmquist-Luenberger Index in the Minjiang-Source in 2006–2017.
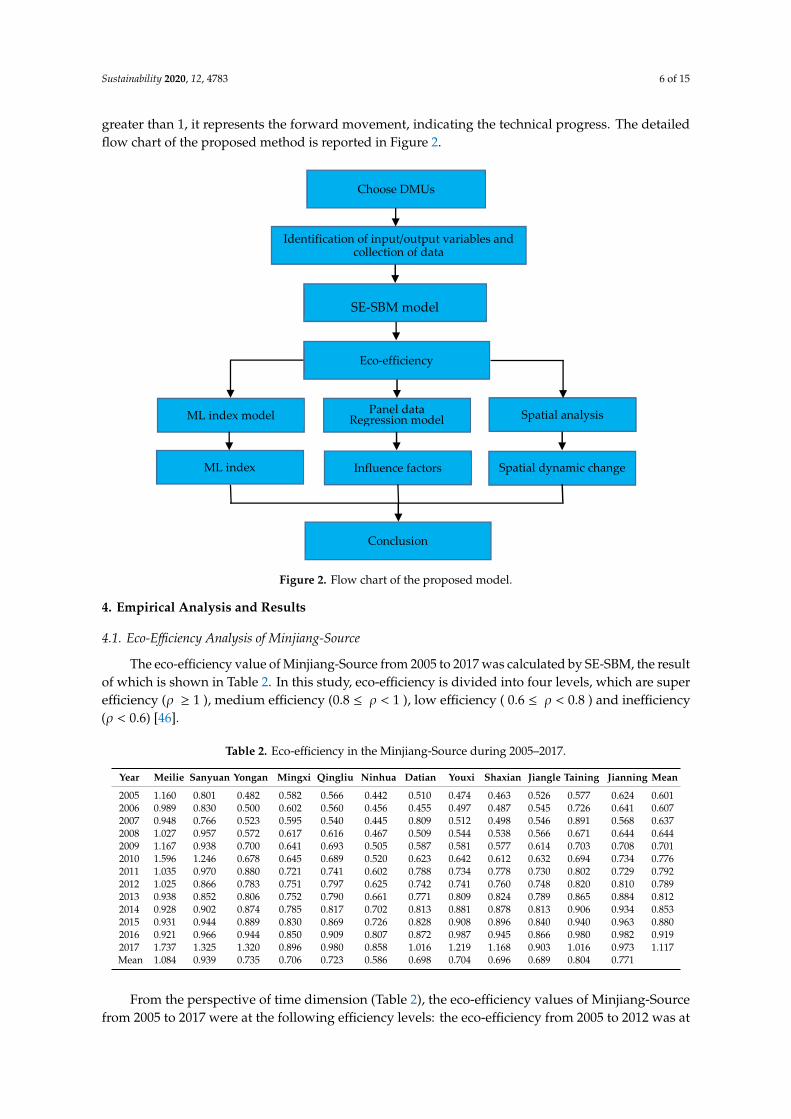
The Malmquist-Luenberger index (ML), technical efficiency change (EC) and technical progresschange (TC) is shown in Figure 6. The comprehensive efficiency (ML) of Meilie and Sanyuan washigher, while that of Ninghua was lower. Overall, in 2006–2017, technological progress efficiency values
Sustainability 2020, 12, 4783 9 of 15
of all counties in Minjiang-Source had no significant difference, all wandering up and down around 1,with a mean value of 1.011. The distribution of TC tallies with that of comprehensive efficiency, whichfurther proves that technological progress is an important influence factor on sustainable development.
Sustainability 2020, 12, x FOR PEER REVIEW 11 of 18
The Malmquist-Luenberger index (ML), technical efficiency change (EC) and technical progress
change (TC) is shown in Figure 6. The comprehensive efficiency (ML) of Meilie and Sanyuan was
higher, while that of Ninghua was lower. Overall, in 2006–2017, technological progress efficiency
values of all counties in Minjiang-Source had no significant difference, all wandering up and down
around 1, with a mean value of 1.011. The distribution of TC tallies with that of comprehensive
efficiency, which further proves that technological progress is an important influence factor on
sustainable development.
Figure 6. Decomposed index of Malmquist-Luenberger during 2006–2017. Note: ML = Malmquist-
Luenberger Index, EC = Technical Efficiency Change, TC = Technical Progress Change.
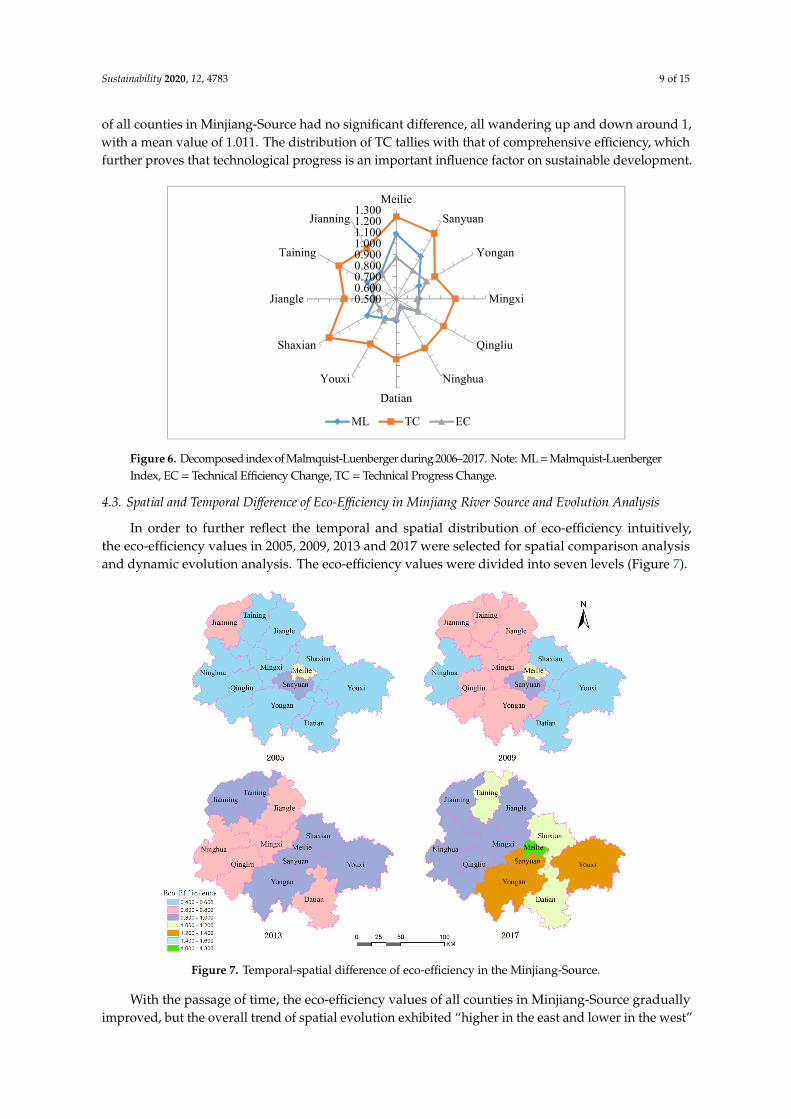
4.3. Spatial and Temporal Difference of Eco-Efficiency in Minjiang River Source and Evolution Analysis
In order to further reflect the temporal and spatial distribution of eco-efficiency intuitively, the
eco-efficiency values in 2005, 2009, 2013 and 2017 were selected for spatial comparison analysis and
dynamic evolution analysis. The eco-efficiency values were divided into seven levels (Figure 7).
0.5000.6000.7000.8000.9001.0001.1001.2001.300
Meilie
Sanyuan
Yongan
Mingxi
Qingliu
Ninghua
Datian
Youxi
Shaxian
Jiangle
Taining
Jianning
ML TC EC
Figure 6. Decomposed index of Malmquist-Luenberger during 2006–2017. Note: ML = Malmquist-LuenbergerIndex, EC = Technical Efficiency Change, TC = Technical Progress Change.
4.3. Spatial and Temporal Difference of Eco-Efficiency in Minjiang River Source and Evolution Analysis
In order to further reflect the temporal and spatial distribution of eco-efficiency intuitively,the eco-efficiency values in 2005, 2009, 2013 and 2017 were selected for spatial comparison analysisand dynamic evolution analysis. The eco-efficiency values were divided into seven levels (Figure 7).Sustainability 2020, 12, x FOR PEER REVIEW 12 of 18
Figure 7. Temporal-spatial difference of eco-efficiency in the Minjiang-Source.
With the passage of time, the eco-efficiency values of all counties in Minjiang-Source gradually
improved, but the overall trend of spatial evolution exhibited “higher in the east and lower in the
west” (Figure 7). In 2005, the eco-efficiency values of 75% of the counties were at the level of
inefficiency, the efficiency value of the Sanyuan was medium, and only the eco-efficiency of Meilie
was over 1 showing super efficiency. By 2009, Ninghua, Datian, Youxi and Shaxian were still at the
level of inefficiency, Jianning, Taining, Jiangle, Mingxi, Qingliu and Yongan were at the level of low
efficiency, and Sanyuan was at the level of medium efficiency, while Meilie was still at the level of
super efficiency. By 2013, the eco-efficiency value of Meilie was reduced to the level of medium
efficiency, that of Jianning, Taining, Shaxian, Datian and Youxi raised to the level of medium
efficiency, the level of Sanyuan did not change level, and the other counties were at the level of
medium efficiency. Finally, by 2017, all counties were above the medium efficiency level, and six
counties in the eastern part of the city (Meilie, Sanyuan, Yongan, Datian, Shaxian and Youxi) were at
the super efficiency level, accounting for 58% of the whole city.
In order to further reveal the evolution law of the eco-efficiency, the density distribution curve
of the eco-efficiency in Minjiang-Source was estimated by using non-parametric kernel density
function (Figure 8). The peaks are scattered and move to the right over time, indicating that the eco-
efficiency was improving. The density function of each year is dispersed and presents a unimodal
mode, fluctuating greatly in the low-density areas with a significantly increased heavy right tail. This
may be due to the difference in environmental regulation influence on eco-efficiency in different
regions, resulting in larger fluctuation of the kernel density curve in high eco-efficiency areas.
Figure 7. Temporal-spatial difference of eco-efficiency in the Minjiang-Source.
With the passage of time, the eco-efficiency values of all counties in Minjiang-Source graduallyimproved, but the overall trend of spatial evolution exhibited “higher in the east and lower in the west”

Sustainability 2020, 12, 4783 10 of 15
(Figure 7). In 2005, the eco-efficiency values of 75% of the counties were at the level of inefficiency,the efficiency value of the Sanyuan was medium, and only the eco-efficiency of Meilie was over1 showing super efficiency. By 2009, Ninghua, Datian, Youxi and Shaxian were still at the level ofinefficiency, Jianning, Taining, Jiangle, Mingxi, Qingliu and Yongan were at the level of low efficiency,and Sanyuan was at the level of medium efficiency, while Meilie was still at the level of super efficiency.By 2013, the eco-efficiency value of Meilie was reduced to the level of medium efficiency, that ofJianning, Taining, Shaxian, Datian and Youxi raised to the level of medium efficiency, the level ofSanyuan did not change level, and the other counties were at the level of medium efficiency. Finally,by 2017, all counties were above the medium efficiency level, and six counties in the eastern partof the city (Meilie, Sanyuan, Yongan, Datian, Shaxian and Youxi) were at the super efficiency level,accounting for 58% of the whole city.
In order to further reveal the evolution law of the eco-efficiency, the density distribution curve ofthe eco-efficiency in Minjiang-Source was estimated by using non-parametric kernel density function(Figure 8). The peaks are scattered and move to the right over time, indicating that the eco-efficiencywas improving. The density function of each year is dispersed and presents a unimodal mode,fluctuating greatly in the low-density areas with a significantly increased heavy right tail. This maybe due to the difference in environmental regulation influence on eco-efficiency in different regions,resulting in larger fluctuation of the kernel density curve in high eco-efficiency areas.
Sustainability 2020, 12, x FOR PEER REVIEW 13 of 18
Figure 8. The kernel density curve of eco-efficiency evolution the Minjiang-Source during 2005–2017.
4.4. Influence Factors of Eco-Efficiency of Minjiang-Source
Further analysis was conducted on the influence factors of eco-efficiency and sustainable
development. Eco-efficiency was selected as the explained variable, with regional economic
development, environmental regulation, industrial structure, science and technology investment and
labor investment as explaining variables. Regional economic development was measured by per
capita GDP, environmental regulation was characterized by the cost on industrial pollution
treatment, industrial structure was represented by the accounted proportion of the tertiary industry
for GDP, R&D investment was used to measure science and technology investment and labor
investment was the number of labor at the end of each year.
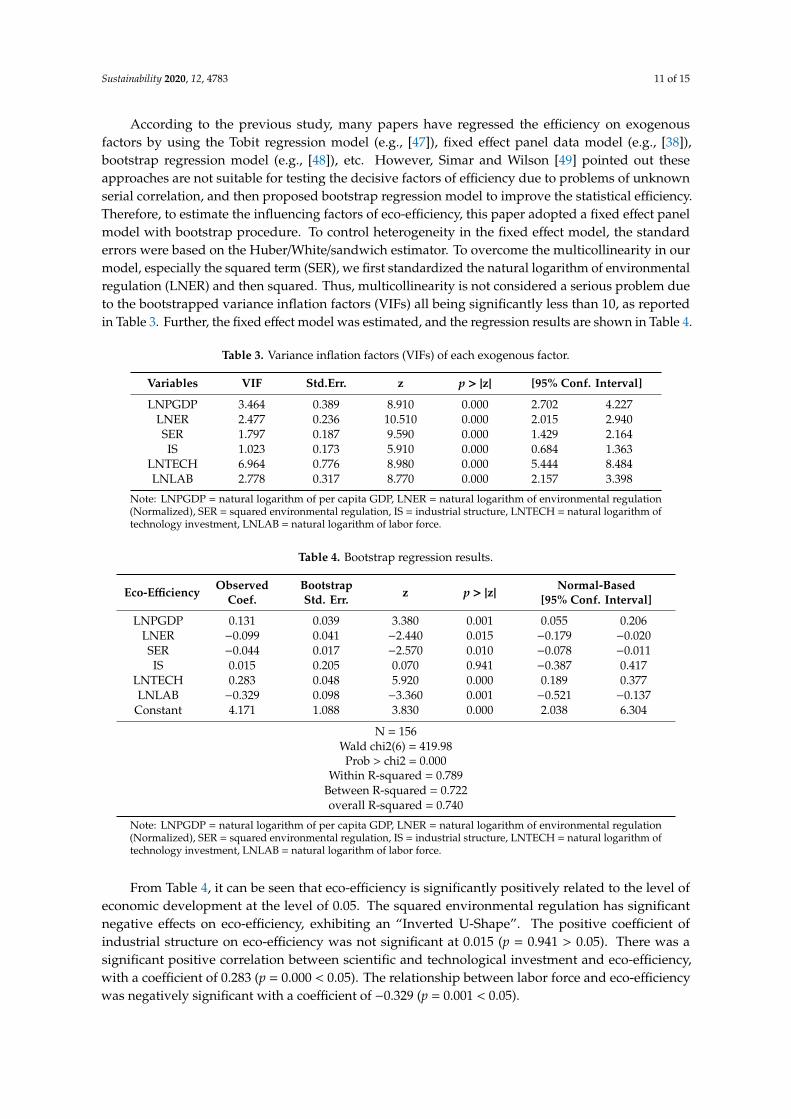
According to the previous study, many papers have regressed the efficiency on exogenous
factors by using the Tobit regression model (e.g., [47]), fixed effect panel data model (e.g., [38]),
bootstrap regression model (e.g., [48]), etc. However, Simar and Wilson [49] pointed out these
approaches are not suitable for testing the decisive factors of efficiency due to problems of unknown
serial correlation, and then proposed bootstrap regression model to improve the statistical efficiency.
Therefore, to estimate the influencing factors of eco-efficiency, this paper adopted a fixed effect panel
model with bootstrap procedure. To control heterogeneity in the fixed effect model, the standard
errors were based on the Huber/White/sandwich estimator. To overcome the multicollinearity in our
model, especially the squared term (SER), we first standardized the natural logarithm of
environmental regulation (LNER) and then squared. Thus, multicollinearity is not considered a
serious problem due to the bootstrapped variance inflation factors (VIFs) all being significantly less
than 10, as reported in Table 3. Further, the fixed effect model was estimated, and the regression
results are shown in Table 4.
Figure 8. The kernel density curve of eco-efficiency evolution the Minjiang-Source during 2005–2017.
4.4. Influence Factors of Eco-Efficiency of Minjiang-Source
Further analysis was conducted on the influence factors of eco-efficiency and sustainabledevelopment. Eco-efficiency was selected as the explained variable, with regional economicdevelopment, environmental regulation, industrial structure, science and technology investmentand labor investment as explaining variables. Regional economic development was measured by percapita GDP, environmental regulation was characterized by the cost on industrial pollution treatment,industrial structure was represented by the accounted proportion of the tertiary industry for GDP,R&D investment was used to measure science and technology investment and labor investment wasthe number of labor at the end of each year.
Sustainability 2020, 12, 4783 11 of 15
According to the previous study, many papers have regressed the efficiency on exogenousfactors by using the Tobit regression model (e.g., [47]), fixed effect panel data model (e.g., [38]),bootstrap regression model (e.g., [48]), etc. However, Simar and Wilson [49] pointed out theseapproaches are not suitable for testing the decisive factors of efficiency due to problems of unknownserial correlation, and then proposed bootstrap regression model to improve the statistical efficiency.Therefore, to estimate the influencing factors of eco-efficiency, this paper adopted a fixed effect panelmodel with bootstrap procedure. To control heterogeneity in the fixed effect model, the standarderrors were based on the Huber/White/sandwich estimator. To overcome the multicollinearity in ourmodel, especially the squared term (SER), we first standardized the natural logarithm of environmentalregulation (LNER) and then squared. Thus, multicollinearity is not considered a serious problem dueto the bootstrapped variance inflation factors (VIFs) all being significantly less than 10, as reportedin Table 3. Further, the fixed effect model was estimated, and the regression results are shown in Table 4.
Table 3. Variance inflation factors (VIFs) of each exogenous factor.
Variables VIF Std.Err. z p > |z| [95% Conf. Interval]
LNPGDP 3.464 0.389 8.910 0.000 2.702 4.227LNER 2.477 0.236 10.510 0.000 2.015 2.940SER 1.797 0.187 9.590 0.000 1.429 2.164IS 1.023 0.173 5.910 0.000 0.684 1.363
LNTECH 6.964 0.776 8.980 0.000 5.444 8.484LNLAB 2.778 0.317 8.770 0.000 2.157 3.398
Note: LNPGDP = natural logarithm of per capita GDP, LNER = natural logarithm of environmental regulation(Normalized), SER = squared environmental regulation, IS = industrial structure, LNTECH = natural logarithm oftechnology investment, LNLAB = natural logarithm of labor force.
Table 4. Bootstrap regression results.
Eco-Efficiency ObservedCoef.
BootstrapStd. Err. z p > |z|
Normal-Based[95% Conf. Interval]
LNPGDP 0.131 0.039 3.380 0.001 0.055 0.206LNER −0.099 0.041 −2.440 0.015 −0.179 −0.020SER −0.044 0.017 −2.570 0.010 −0.078 −0.011IS 0.015 0.205 0.070 0.941 −0.387 0.417
LNTECH 0.283 0.048 5.920 0.000 0.189 0.377LNLAB −0.329 0.098 −3.360 0.001 −0.521 −0.137
Constant 4.171 1.088 3.830 0.000 2.038 6.304
N = 156Wald chi2(6) = 419.98Prob > chi2 = 0.000
Within R-squared = 0.789Between R-squared = 0.722overall R-squared = 0.740
Note: LNPGDP = natural logarithm of per capita GDP, LNER = natural logarithm of environmental regulation(Normalized), SER = squared environmental regulation, IS = industrial structure, LNTECH = natural logarithm oftechnology investment, LNLAB = natural logarithm of labor force.
From Table 4, it can be seen that eco-efficiency is significantly positively related to the level ofeconomic development at the level of 0.05. The squared environmental regulation has significantnegative effects on eco-efficiency, exhibiting an “Inverted U-Shape”. The positive coefficient ofindustrial structure on eco-efficiency was not significant at 0.015 (p = 0.941 > 0.05). There was asignificant positive correlation between scientific and technological investment and eco-efficiency,with a coefficient of 0.283 (p = 0.000 < 0.05). The relationship between labor force and eco-efficiencywas negatively significant with a coefficient of −0.329 (p = 0.001 < 0.05).

Sustainability 2020, 12, 4783 12 of 15
5. Discussions and Conclusions
In this paper, the SE-SBM model was used to calculate the eco-efficiency of the Minjiang-Sourcein the key ecological function area of Fujian Province, China, and the Malmquist-Luenberger indexwas applied to analyze the dynamic evolution of eco-efficiency. A fixed effect panel data modelwas adopted to assess the influencing factors of eco-efficiency. The results show some consistenciesand inconsistencies when compared to previous studies.
First, the level of sustainable development of ecological environment in Minjiang-Source isunbalanced, and the eco-efficiency shows a spatial differentiation of “high in the east and low in the west”.Previous studies also report similar results at a different research level. Eco-efficiency studies onChinese cities at the prefecture-level show the highest eco-efficiency in the eastern region and the lowesteco-efficiency in the western and central regions [10]. Prefecture-level research in different provincesshows slightly different results. For instance, the eastern part in Guangdong presents the highesteco-efficiency, while the mountainous northern area has the lowest eco-efficiency [48]. Therefore,spatial differentiation may exist due to the typical aggregation effect resulting from the economicdevelopment level, the industrial structure, etc.
Second, a significant temporal change has been found. From 2005 to 2017, the eco-efficiency valuesof 67.7% of counties in Minjiang-Source were low, with an average annual growth rate of 5.98%. By 2017,eco-efficiency was above the level of medium efficiency, and 58% of counties were above the level ofsuper efficiency, achieving the coordinated development of ecological environment and social economy.The undesirable outputs total factor production efficiency index (ML) of Minjiang-Source shows afluctuation trend, and the correlation between comprehensive efficiency and technical efficiency issignificant. The fluctuation may be a lagged effect of ecological protection measures like the localgovernment’s emphasis on the urban ecological environment treatment or environmental sewageand garbage treatment action. Extant literature has shown other factors which drive the fluctuation,such as the pursuit of a GDP growth model and financial crisis [38].
Third, the fixed effect model shows that scientific and technological progress, environmentalregulation, labor force and economic development level are the main factors affecting the eco-efficiencyand sustainable development of Minjiang-Source. Technological progress was found to have agreat positive effect on eco-efficiency. Investment in R&D activities helps local industries upgradethe production process, thus fewer undesirable outputs are discharged, improving the eco-efficiencyin turn. Labor force has a high negative effect on eco-efficiency. With the development ofscience and technology, a labor-intensive industry may restrain the improvement of eco-efficiency,and the development of human capital will gradually upgrade. The “Inverted U-Shape” relationshipbetween environmental regulation and eco-efficiency is consistent with the Porter’s hypothesis,showing that proper environmental regulation will enhance eco-efficiency initially and damageeco-efficiency after reaching the extreme point. The coefficient of industrial structure on eco-efficiencyis not significant, which may due to that the contribution of tertiary industry to GDP in Minjiang-Sourcearea is relatively small, accounting for an average of only 33.6% of GDP.
To sum up, in the process of regional economic development, with the increase of production scale(scale efficiency increases year by year), accompanied with increased ecological environment pollutionand energy consumption, the eco-efficiency will decrease to some extent. However, the upgrading ofindustrial structure brought by scientific and technological innovation will improve the utilizationefficiency of resources, reduce resource consumption and pollution emissions, relieve the pressureof production on resource demand, improve eco-efficiency and promote sustainable environmentaldevelopment [31]. Therefore, it is necessary to explore the sustainable development of key ecologicalfunctional areas under the constraint of resources and environmental protection. First of all, it is urgentto strengthen the investment in science and technology. Developing a high-tech, low-carbon,and environmental protection focused advanced technology industry, eliminating or transformtraditional industries with high pollution and high energy consumption, and speeding up localindustry transformation and upgrading can help to reduce the destructive effects of lower-end
Sustainability 2020, 12, 4783 13 of 15
industries on the environment, improve economic productivity of per unit environmental cost,and guarantee the development of economy and the environment. In addition, it is necessary tostep up efforts on ecological environment protection, reduce the risks of ecological degradation,and ensure ecological security [50]. Efforts should be made to develop ecological industries thatproduce valuable ecological product, such as ecotourism, ecological health, green finance, forest carbonsink, and undergrowth economy, etc., so as to reduce the interference and damage to the environmentin the process of economic development. Therefore, this study not only effectively evaluates the regionalecological environment and economic development and serves as an aid to the formulation of economicdevelopment policies, but also provides reference for the ecological environment protection in otherkey ecological functional areas.
However, factors influencing the eco-efficiency of key ecological functional areas have yet tobe further thorough examined, which may include the economy, society, environment, and eventhe stages and targeted policy of the areas. With the differences among different scales of researchareas and the heterogeneities of human activities, evaluations of eco-efficiency may have a largevariation. Further consideration on the environmental sustainability assessment system of macro-,meso- and micro-level of scales could improve the overall evaluation system. Moreover, incorporatedwith more complex climate change, human activities and policy factors might also help to evaluateeco-efficiency more thoroughly and help government to promote specific policies.
Author Contributions: Conceptualization, J.L.; methodology, J.L. and C.C.; software, J.L. and C.C.; validation,J.L., C.C. and F.Z.; formal analysis, J.L. and F.Z.; investigation, C.C and F.Z.; resources, J.L.; data curation, J.L.;writing—original draft preparation, J.L.; writing—review and editing, C.C. and J.L.; visualization, J.L.; supervision,J.L. and F.Z.; project administration, J.L.; funding acquisition, J.L. All authors have read and agreed to the publishedversion of the manuscript.
Funding: This research was funded by the National Social Science Foundation Project for western China,grant number 16XJY004.
Acknowledgments: We thank the reviewers for their valuable feedback, which helped to improvethe manuscript quality.
Conflicts of Interest: The authors declare no conflict of interest.
References
1. Zhang, K.M.; Wen, Z.G. Review and challenges of policies of environmental protection and sustainabledevelopment in China. J. Environ. Manag. 2008, 88, 1249–1261. [CrossRef]
2. The National Development and Reform Commission. The Planning of National and Regional Main FunctionalAreas; People′s Publishing House: Beijing, China, 2015.
3. Xu, J.; Xie, G.; Xiao, Y.; Li, N.; Yu, F.; Pei, S.; Jiang, Y. Dynamic Analysis of Ecological EnvironmentQuality Combined with Water Conservation Changes in National Key Ecological Function Areas in China.Sustainability 2018, 10, 1202. [CrossRef]
4. Wang, G.; Yang, D.; Xia, F.; Zhong, R.; Xiong, C. Three Types of Spatial Function Zoning in Key EcologicalFunction Areas Based on Ecological and Economic Coordinated Development: A Case Study of TachengBasin, China. Chin. Geogr. Sci. 2019, 4, 689–699. [CrossRef]
5. Organization for Economic Cooperation and Development (OECD). Eco-Efficiency; OECD: Paris, France,1998; pp. 7–11.
6. Chu, D.J.; Zhu, Y. Ecological efficiency and circular economy. Fudan J. 2005, 2, 60–66.7. Schaltegger, S.; Sturm, A. Ökologische Rationalität: Ansatzpunkte zur Ausgestaltung von ökologieorientierten
Managementinstrumenten. Unternehmung 1990, 44, 273–290.8. Rybaczewska-Błazejowska, M.; Masternak-Janus, A. Eco-efficiency assessment of Polish regions:
Joint application of life cycle assessment and data envelopment analysis. J. Clean. Prod. 2018, 172,1180–1192. [CrossRef]
9. Huang, J.; Xia, J.; Yu, Y. Composite eco-efficiency indicators for China based on data envelopment analysis.Ecol. Indic. 2018, 85, 674–697. [CrossRef]

Sustainability 2020, 12, 4783 14 of 15
10. Ren, Y.; Fang, C.; Li, G. Spatiotemporal characteristics and influential factors of eco-efficiency in Chineseprefecture-level cities: A spatial panel econometric analysis. J. Clean. Prod. 2017, 72, 2047–2063. [CrossRef]
11. Guo, S.; Li, H.; Zhao, R.; Zhou, X. Industrial environmental efficiency assessment for China’s western regionsby using a SBM-based DEA. Environ. Sci. Pollut. Res. 2019, 26, 27542–27550. [CrossRef]
12. Xing, Z.; Wang, J.; Zhang, J. Total-factor ecological efficiency and productivity in Yangtze River EconomicBelt, China: A non-parametric distance function approach. J. Clean. Prod. 2018, 200, 844–857. [CrossRef]
13. Zhu, W.; Xu, L.; Tang, L.; Xiang, X. Eco-efficiency of the Western Taiwan Straits Economic Zone: An evaluationbased on a novel eco-efficiency model and empirical analysis of influencing factors. J. Clean. Prod. 2019, 234,638–652. [CrossRef]
14. Wang, Y.; Liu, J.; Hansson, L.; Zhang, K.; Wang, R. Implementing stricter environmental regulation to enhanceeco-efficiency and sustainability: A case study of Shandong Province′s pulp and paper industry, China.J. Clean. Prod. 2011, 19, 303–310. [CrossRef]
15. Xing, L.; Xue, M.; Wang, X. Spatial correction of ecosystem service value and the evaluation of eco-efficiency:A case for China’s provincial level. Ecol. Indic. 2018, 95, 841–850. [CrossRef]
16. Chen, L.; Jia, G. Environmental efficiency analysis of China’s regional industry: A data envelopment analysis(DEA) based approach. J. Clean. Prod. 2017, 142, 846–853. [CrossRef]
17. Zhou, Y.; Xing, X.; Fang, K.; Liang, D.; Xu, C. Environmental efficiency analysis of power industry in Chinabased on an entropy SBM model. Energy Policy 2013, 57, 68–75. [CrossRef]
18. Ma, X.; Wang, C.; Yu, Y.; Li, Y.; Dong, B.; Zhang, X.; Gu, Y. Ecological efficiency in China and its influencingfactors—A super-efficient SBM metafrontier-Malmquist-Tobit model study. Environ. Sci. Pollut. Res. 2018,25, 20880–20898. [CrossRef]
19. Chansarn, S. The Evaluation of the Sustainable Human Development: A Cross-country Analysis EmployingSlack-based DEA. Procedia Environ. Sci. 2014, 20, 3–11. [CrossRef]
20. Jin, W.; Zhang, H.; Liu, S.; Zhang, H. Technological innovation, environmental regulation, and green totalfactor efficiency of industrial water resources. J. Clean. Prod. 2019, 211, 61–69. [CrossRef]
21. Sun, X.; Loh, L. Sustainability Governance in China: An Analysis of Regional Ecological Efficiency.Sustainability 2019, 11, 1958. [CrossRef]
22. Page, B.; Wohlgemuth, V. Advances in Environmental Informatics: Integration of Discrete Event SimulationMethodology with ecological Material Flow Analysis for Modelling eco-efficient Systems. Procedia Environ.Sci. 2010, 2, 696–705. [CrossRef]
23. Wursthorn, S.; Poganietz, W.R.; Schebek, L. Economic environmental monitoring indicators for Europeancountries: A disaggregated sector-basedapproach for monitoring eco-efficiency. Ecol. Econ. 2011, 70, 487–496.[CrossRef]
24. Beames, A.; Broekx, S.; Heijungs, R.; Lookman, R.; Boonen, K.; Geert, Y.V.; Dendoncker, K.; Seuntjens, P.Accounting for land-use efficiency and temporal variationsbetween brownfield remediation alternativesin lifecycle assessment. J. Clean. Prod. 2015, 101, 109–117. [CrossRef]
25. Bai, Y.P.; Deng, X.Z.; Jiang, S.; Zhang, Q.; Wang, Z. Exploring the relationship between urbanization and urbaneco–efficiency: Evidence from prefecture–level cities in China. J. Clean. Prod. 2018, 195, 1487–1496. [CrossRef]
26. Zhou, P.; Poh, K.L.; Ang, B.W. A non-radial DEA approach to measuring environmental performance. Eur. J.Oper. Res. 2007, 178, 1–9. [CrossRef]
27. Moutinho, V.; Fuinhas, J.A.; Marques, A.C.; Santiago, R. Assessing eco-efficiency through the DEA analysisand decoupling index in the Latin America countries. J. Clean. Prod. 2018. [CrossRef]
28. Zhang, B.; Bi, J.; Fan, Z.; Yuan, Z.; Ge, J. Eco-efficiency analysis of industrial system in China: A dataenvelopment analysis approach. Ecol. Econ. 2008, 68, 306–316. [CrossRef]
29. Yin, K.; Wang, R.S.; Zhou, C.B.; Liang, J. Review of eco-efficiency accounting method and its applications.Acta Ecol. Sin. 2012, 32, 3595–3605. [CrossRef]
30. Lin, B.Q.; Wang, X.L. Exploring energy efficiency in China′s iron and steel industry: A stochastic frontierapproach. Energy Policy 2014, 72, 87–96. [CrossRef]
31. Halkos, G.; Petrou, K. Assessing 28 EU member states′ environmental effi-ciency in national waste generationwith DEA. J. Clean. Prod. 2019, 208, 509–521. [CrossRef]
32. Ali, E.; Yang, G. A survey and analysis of the first 40 years of scholarly literature in DEA: 1978–2016.Socio-Econ. Plan. Sci. 2018, 61, 4–8.

Sustainability 2020, 12, 4783 15 of 15
33. Wu, J.; Xiong, B.; An, Q.; Sun, J.; Wu, H. Total-factor energy efficiency evaluation of Chinese industry byusing two-stage DEA model with shared inputs. Ann. Oper. Res. 2015, 255, 257–276. [CrossRef]
34. Deng, G.; Li, L.; Song, Y. Provincial water use efficiency measurement and factor analysis in China: Based onSBM-DEA model. Ecol. Indic. 2016, 69, 12–18. [CrossRef]
35. Charnes, A.; Cooper, W.W.; Rhodes, E. Measuring the efficiency of decision making units. Eur. J. Oper. Res.1978, 2, 429–444. [CrossRef]
36. Banker, R.D.; Charnes, A.; Cooper, W.W. Some models for estimating technical and scale inefficiencies in dataenvelopment analysis. Manag. Sci. 1984, 30, 1078–1092. [CrossRef]
37. Yang, L.; Ouyang, H.; Fang, K.; Ye, L.; Zhang, J. Evaluation of regional environmental efficiencies in Chinabased on super-efficiency-DEA. Ecol. Indic. 2015, 51, 13–19. [CrossRef]
38. Zhou, C.S.; Shi, C.Y.; Wang, S. Estimation of eco-efficiency and its influencing factors in Guangdong provincebased on Super-SBM and panel regression models. Ecol. Indic. 2018, 86, 67–68. [CrossRef]
39. Zhang, X.Q. Research on Scientific Research Performance of Humanities and Social Sciences in China’sFirst-class Universities Based on SE-DEA. J. Econ. Sustain. Dev. 2019, 10, 15–32.
40. Huang, Y.S.; Liu, S.J. Efficiency evaluation of a sustainable hydrogen production scheme based on superefficiency SBM model. J. Clean. Prod. 2020, 256, 1–25. [CrossRef]
41. Tone, K.A. Slacks-based measure of efficiency in data envelopment analysis. Eur. J. Oper. Res. 2001, 130,498–509. [CrossRef]
42. Fare, B.R.; Grosskopf, S.; Norris, M.; Zhang, Z. Productivity growth, technical progress and efficiency changein industrialized countries. Am. Econ. Rev. 1994, 84, 66–83.
43. Tang, D.C.; Tang, J.X.; Xiao, Z.; Ma, T.; Bethel, B.J. Environmental regulation efficiency and total factorproductivity—Effect analysis based on Chinese data from 2003 to 2013. Ecol. Indic. 2017, 73, 312–318.[CrossRef]
44. Ren, Y.F.; Fang, C.L.; Lin, X.Q. Evaluation of eco-efficiecy of four major urban agglomerations in easterncoastal area of China. Acta Geogr. Sin. 2017, 72, 2047–2063.
45. Yue, S.; Shen, Y.; Yuan, J. Sustainable total factor productivity growth for 55 states: An application of the newmalmquist index considering ecological footprint and human development index. Resour. Conserv. Recycl.2019, 146, 475–483. [CrossRef]
46. Pan, J.H.; Yin, J. Analysison the Urban Development Efficiency of Citiesat Prefecture Level or abovein ChinaBasedon DEA-ESDA. Econ. Geogr. 2012, 32, 53–60.
47. Diaz-Villavicencio, G.; Didonet, S.R.; Dodd, A. Influencing factors of eco-efficient urban waste management:Evidence from Spanish municipalities. J. Clean. Prod. 2017, 164, 1486–1496. [CrossRef]
48. Liu, T.; Li, J.; Chen, J.; Yang, S. Urban Ecological Efficiency and Its Influencing Factors—A Case Studyin Henan Province, China. Sustainability 2019, 11, 5048. [CrossRef]
49. Simar, L.; Wilson, P.W. Estimation and inference in two-stage, semi-parametric models of productionprocesses. J. Econom. 2007, 136, 31–64. [CrossRef]
50. Rak, J.R.; Pietrucha-Urbanik, K. An Approach to Determine Risk Indices for Drinking Water–StudyInvestigation. Sustainability 2019, 11, 3189. [CrossRef]
© 2020 by the authors. Licensee MDPI, Basel, Switzerland. This article is an open accessarticle distributed under the terms and conditions of the Creative Commons Attribution(CC BY) license (http://creativecommons.org/licenses/by/4.0/).