Embed Size (px)
Citation preview

© Poverty-Environment Initiative of Lao PDR (2011)
Assessment of Economic, Social and Environmental Costs and Benefits of Investment in Saravan Province
Prepared by:
International Union for Conservation of Nature (IUCN) Lao PDR
&
The National Economic Research Institute (NERI), Ministry of Planning and Investment of Lao PDR
For the Poverty-Environment Initiative in Lao PDR
Final Report, January 2011
Photo: NERI

Data used in this research is obtained from official statistics, published literature and field surveys carried out between May and December 2010, with reasonable efforts to ensure that these are factually correct. The views expressed in this report are those of the authors and do not necessarily reflect the view of the Ministry of Planning and Investment of Lao PDR.

ii
Contents Executive Summary…………………………………………………………………………………………………………………………….6
1. Introduction ...........................................................................................................................................10
1.1. Rationale and background to the project ........................................................................................10
1.2. Research objectives .........................................................................................................................12
1.3. Research methodologies.................................................................................................................. 13
2. Geography, natural resources and socio‐economic development in Saravan Province ....................14
2.1 Geography of Saravan Province....................................................................................................14
2.2 Natural Resources in Saravan Province ........................................................................................17
2.3. Socio‐economic development in Saravan Province.........................................................................22
2.3.1. Macro‐economic development.................................................................................................22
2.3.2 Poverty reduction ...................................................................................................................... 25
2.3.3 Population and labor force ........................................................................................................27
2.3.4 Infrastructure development and regional integration...............................................................29
2.3.5 Access to health services ...........................................................................................................31
2.3.6 Access to education ...................................................................................................................31
2.3.7 Tourism development................................................................................................................32
3. Investment management system investments in Saravan Province ......................................................33
3.1. Laws and regulations related to investments and concessions.......................................................33
3.2 Key actors in investment approval and management system at provincial level ............................40
3.3. Investment approval and management procedure.........................................................................44
3.4 Data on Investments and Concessions in Saravan Province.............................................................49
4. Agricultural production in Saravan Province ..........................................................................................54
4.1 Overview ...........................................................................................................................................54
4.1.1 Shifting cultivation .....................................................................................................................56
4.1.2 Industrialized agricultural production .......................................................................................56
4.2 Agricultural land and forestry allocation ..........................................................................................58
5. Economic, social and environmental impacts of investment in Saravan Province: summary of case studies....................................................................................................................................................60
5.1. Economic impacts ............................................................................................................................60
5.2. Social impacts...................................................................................................................................63
iii
5.3. Environment impacts .......................................................................................................................65
6. Conclusion...............................................................................................................................................66
Document references .................................................................................................................................69
Annexes.......................................................................................................................................................74
Tables
Table 1: Forest categories in Saravan Province, 2010. ...............................................................................18 Table 2: Vertebrate species found in Saravan and Savannakhet provinces ...............................................19 Table 3: Major hydropower projects in Saravan Province, 2010 ................................................................20 Table 4: Changing GDP structure in Saravan Province, 2006‐2010 ............................................................24 Table 5: Poverty incidence in Saravan Province in 2009 .............................................................................27 Table 6: Road infrastructure in Saravan Province.......................................................................................29 Table 7: Some important heath indicators in Saravan province .................................................................31 Table 8: Some education indicators in Saravan Province, 2010 .................................................................32 Table 9: Area and productivity of rice, industrial crops and tree plantation in Saravan province, 2008‐2009 ............................................................................................................................................................55 Table 10: Upland rice production in fiscal year 2008‐2009........................................................................56 Table 11: Concession areas and productivity..............................................................................................57 Table 12: Decreasing land size managed by village (ha)…………………………………………………………………………62 Table 13: Quantitative economic impacts of the two case studies………………………………………………………….63 Table 14: Matrix of social impacts identified in the two case studies …………………………………………………….65 Table 15: Matrix of environmental impacts identified in the two case studies………………………………. …….. 66
Maps
Map 1: Geographical location of Saravan Province....................................................................................15 Map 2: Landscape types in Saravan Province ............................................................................................16 Map 3: Forest and land types, Saravan Province, 2010..............................................................................18 Map 4: Poverty concentration in Saravan Province, 2005 ..........................................................................26 Map 5: Basic land allocation in Saravan Province ......................................................................................59
Figures Figure 1: Increasing economic growth of Saravan Province 2006‐2010 (percent) .....................................22 Figure 2: Increasing GDP per capita in Saravan province, 2001‐2010 (USD) .............................................23

iv
Figure 3: Changing economic structure in Saravan Province, 2001‐2010...................................................24 Figure 4: Percentage of poverty in Saravan Province, by district................................................................26 Figure 5: Proportion of investment in Saravan Province, 2006‐2009. .......................................................50 Figure 6: Private domestic and overseas investment in Saravan Province, 1999‐2010 (%) ......................51 Figure 7: Private Domestic and foreign investment in Saravan Province, by sector, 1999‐2010 ...............52 Figure 8: FDI and Joint venture investment in Saravan Province, 2004‐2010............................................52 Figure 9: Share of FDI in Saravan Province, by source country, 1999‐2010................................................53

v
Acronyms and Abbreviations
APB: Agricultural Promotion Bank BCEL: Banque Pour Le Commerce Exterier Lao CPMI: Committee for Promoting and Managing Investment DB: Development Bank EIA: Environmental Impact Assessment FDI: Foreign Direct Investment GDP: Gross Domestic Product GoL Government of Lao PDR Ha Hectares HIV/AIDS: Human Immunodeficiency Virus/Acquired Immune Deficiency syndrome ICOR: Incremental Capital Output Ratio IEE: Initial Environmental Examination IUCN: International Union for Conservation of Nature Km Kilometer LAK: Lao Kip Lao PDR: Lao People’s Democratic Republic LDC: Least Development Country MAF: The Ministry of Agriculture and Forestry MOU: Memorandum of Understanding MPI: The Ministry of Planning and Investment NERI: The National Economic Research Institute NGO: Non Government Organization NLMA: National Land Management Authority NTFP: Non Timber Forestry Product ODA: Official Development Assistance PA: Participatory Assessment PAFO: Provincial Agriculture and Forestry Office PB: Policy Bank PCPMI: Provincial Committee for Promoting and Managing Investment PDIC: Provincial Department for Industry and Commerce PDPI: Provincial Department for Planning and Investment PLMO: Provincial Land Management Office PWREO: Provincial Water Resource and Environment Office SOE: State Owned Enterprise STEA: Science Technology and Environmental Agency UNDP: United Nations Development Program USD: United States Dollar WREA: Water Resources and Environmental Administration

6
EXECUTIVE SUMMARY
Background
The majority of Lao PDR’s population of about 6 million live in rural areas and are dependent on subsistence agriculture, and the country remains amongst the poorest in the region, ranking 122 out of 169 countries on the 2010 United Nations Human Development Index.1 The Government of Lao PDR (GoL) has set goals to eradicate poverty by 2015 and to graduate from “least‐developed country” status by 2020.2 Lao PDR began a shift towards a market economy with the introduction of economic liberalization in 1986. Since these reforms, the Lao economy has grown and become increasingly interlinked with the economies of its neighbours and with the region as a whole. To graduate from the LDC list by 2020, Lao PDR aims to accelerate its economic growth to at least 8% per year on average, and capitalizing on its abundant land and natural resources is a key growth strategy.3 Foreign direct investment (FDI) flowing into in Lao PDR is predominantly in the natural resource sector (particularly mining and hydropower), accounting for approximately 80% of all FDI in 2008.4 Investment is likely to remain a key element of Lao PDR’s growth strategies and is likely to continue to focus on exploitation of the country’s natural resources over the coming years.
This study
This study on the economic, social and environmental costs and benefits of investments in Saravan Province is one component of a project to develop investment strategies and improve investment management systems in Lao PDR, implemented under the Poverty‐Environment Initiative (PEI). PEI is a joint program of the United Nations Development Program (UNDP) and the United Nations Environment Programme (UNEP). The purpose of this study is to review the status of investments, concessions, natural resources and socio‐economic development indicators in Saravan Province, as well as the capacity of the provincial investment management system, in order to support the work of PEI in the province. This study also examines the economic, social and environmental impacts of investments, both through an examination of provincial‐level trends and two case studies. The two case studies selected in Saravan Province are: the Caosu Dak Lak Rubber Plantation; and several wood processing facilities.
Given the important role of investment in Lao PDR’s growth strategy, and in order to promote sustainable economic growth and poverty reduction, Lao PDR needs highly efficient and balanced investment promotion and management strategies and processes. As the country’s natural resources will likely be the target of much of the investment and because the country’s
1 United Nations Development Program. United Nations Human Development Indicators, 2010. “Lao PDR”. http://hdrstats.undp.org/en/countries/profiles/LAO.html (accessed December 2010). 2 The Ministry of Planning and Investment, Five Year Plan VII, 2011‐2015 [Draft]. 3 The World Bank. 2008. Lao PDR Economic Monitor 2008. 4 Saravan PDPI: Investment data sheets, 2010.

7
large rural population is reliant on these resources, the social and environmental impacts of investments will be closely linked. As stated in the 2009 Law on Investment Promotion of Lao PDR (LIP 2009), investment is to serve the “continuous and sustainable economic growth of the country”.
Investment in Saravan Province
Investment in Saravan Province, although increasing, remains lower than in its neighboring provinces, partly due to its lack of infrastructure. According to the Saravan Province Department of Planning and Investment (PDPI), there were 411 projects in the province worth
LAK 1,174.27 billion between 2006 and 2009. Of that investment, more than 56% is still sourced from the public sector; just over 43% is from private investment, including both domestic and overseas investors. 5 Between 1999 and 2010, the total in‐flow of foreign investment accounted for only 0.5 percent of total FDI in the Lao PDR in the same period. China is largest investor in Saravan Province, following by Vietnam and Thailand.6
As in other provinces in Lao PDR, investment in Saravan is focused on the natural resource sectors, such as agriculture, forestry, hydropower and mining, with the agriculture and forestry sector claiming the major share (see chart above).
Impacts of investment
The Saravan provincial government aims to attract more investments in order to stimulate for the economic development and in turn help poverty reduction. Based on the findings of this assessment, including the results of the two local‐level case studies, investments in the Province are associated with a range of both positive and negative economic, social and environmental impacts. These include contributions to community and infrastructure development, as well as job creation. However, the lack of transparency concerning profits, taxes and fees, and how these are recycled to the local level makes it difficult to accurately judge their impact on local level socio‐economic development. Investments also have indirect
5 Saravan PDPI: Investment data sheets, 2010. 6 Saravan PDPI: Investment data sheets, 2010.
.
Private Domestic and foreign investment in Saravan Province, by sector, 1999‐2010
Source: Saravan PDPI. 2010. Investment data sheets

8
economic benefits, stimulating growth in local economies and helping to attract more investment.
However, this study shows that investments in the province are associated with a range of negative impacts. The limited capacity and uneven implementation of the province’s investment approval and management system has been unable to control the negative effects identified by both local officials and local communities.
Economic Impacts Social Impacts Environmental & Health
Impacts
☺ Health care service improvement
☺ Contribution to government revenues
☺ Lao employment
☺ Contracts with local households for labour/farming (successful)
☺ Stimulates other investment/opportunities
☺ Contribution to community development activities/infrastructure
Positive Impacts
Subjective
Shift from traditional livelihoods to industrial livelihoods
Increased wage labor
Negative Impacts
Increased household expenditure
Contracts with local households for labour/farming (unsuccessful)
Increased desire for material goods
Increased conflicts over land
Child labour/negative impacts on education
Loss of forest cover
Loss of NTFPs
Impacts on water sources
Chemical contamination of land/water
Occupational health problems/injuries
Loss of aquatic species
These include: decreased forest cover and quality, conflicts over land, declining water supplies and quality, decreased livestock production, loss of biodiversity and NTFPs, health problems, and declining school attendance. In both case studies, local people increased their household

9
income as a result of employment but also experienced growing household expenditures. The investments are also linked to the degradation of natural resources and land alienation, loss of agricultural and forests, and increased conflicts over land. Loss of access to non‐timber forest products and agricultural land, in particular, are causing concerns for future food security.
The matrix above shows the range of on‐the‐ground impacts identified in the Saravan Province case studies, both positive and negative. This includes impacts identified in both case studies, without an attempt to weight whether one impact is more serious or more positive than another. However, it provides a picture of the overall affect of the investments on the local communities involved in the studies, by showing the distribution of impacts between the positive upper half of the table and the negative lower half of the table. For the case studies in Saravan Province, it is clear that the investments have resulted in a range of economic benefits, and one health improvement (in the case of Caosu Dak Lak Rubber Plantation); however, no other social or environmental benefits were acknowledged, while a substantial number of economic, social and environmental impacts were identified.
A key finding of this study is that because of the environmental and social problems associated with certain investments in the province, the positive and negative impacts of investments may cancel each other out. Local people are unsure as to whether they truly benefit from the investments in their area or suffer more from their ill effects. In particular, the costs and benefits of investment appear to be unevenly shared between the communities and people of the province: while one group may disproportionately share in the gains brought by investment, other groups are bearing a greater burden of the costs. Importantly, investment projects are prompting a shift in traditional livelihoods but not necessarily providing a reliable alternative.

10
1. Introduction 1.1. Rationale and background to the project
Lao PDR, a small and relatively sparsely populated country in the Mekong region, is characterized by an abundance of natural resources. The majority of its small population of about 6 million live in rural areas and are dependent on subsistence agriculture. The country remains amongst the poorest in the region and ranks 122 out of 169 countries on the 2010 United Nations Human Development Index.7 The country fits into the socio‐economic category of “least developed country” (LDC) with an annual per capita income of USD 880 in 20098 and around 28% of the population living under the poverty line (as of 2008). The Government of Lao PDR (GoL) has set goals to eradicate poverty by 2015 and to graduate from “least‐developed country” status by 2020.9
Lao PDR began a shift towards a market economy with the introduction of economic liberalization (called the New Economic Mechanism) in 1986. Since the introduction of these economic reforms, the Lao economy has grown and become increasingly interlinked with the economies of its neighbours and with the region as a whole. Lao PDR’s gross domestic product (GDP) grew at an average rate of 7.6% between 2006‐2009, with the World Bank projecting that 2010’s rate will reach 7.8%.10 To graduate from the LDC list by 2020, Lao PDR’s per capita income must reach USD1,800 per annum. To achieve this goal, the country has to accelerate its economic growth to at least 8% per year on average. The GoL now promotes Lao PDR as “land‐linked” rather than “land‐locked”, and capitalizing on the country’s relatively abundant land and natural resources is a key growth strategy. Natural resources are a main target for both domestic and foreign investment. Foreign direct investment (FDI) flowing into in Lao PDR is predominantly in the natural resource sector (particularly mining and hydropower), accounting for approximately 80% of all FDI in 2008.11
To date, the GoL has promoted investment through the formulation of land concession policy, export and import facilitation, and tax breaks for certain investors (such as those investing in remote areas of the country). A number of sectors have also been identified as “priority sectors” for investment and industrialization: agriculture and agroforestry; energy; mining; and
7 United Nations Development Program. United Nations Human Development Indicators, 2010. “Lao PDR”. http://hdrstats.undp.org/en/countries/profiles/LAO.html (accessed December 2010). 8 Gross National Income per capita in 2009, using Atlas method. The World Bank. 2010a.http://data.worldbank.org/indicator/NY.GNP.PCAP.CD (accessed December 2010). 9 The Ministry of Planning and Investment, Five Year Plan VII (2011‐2015) [Draft] 10 The World Bank. 2010b. Lao Economic Monitor, May 2010. 11 The World Bank. 2008. Lao PDR Economic Monitor 2008.
11
tourism).12 To reach an incremental capital‐output ratio (ICOR)13 of 4, Lao PDR needs to attract total investment of over USD$10 billion until 2015. According to the Ministry of Planning and Investment (MPI), about half of the investment will come from foreign direct investment (FDI) and about half will come from domestic investment (both public and private) and official development assistance (ODA). Investment therefore is likely to remain a key element of Lao PDR’s growth strategies and is likely to continue to focus on exploitation of the country’s natural resources over the coming years.
Given the important role of investment in Lao PDR’s growth strategy, and in order to promote sustainable economic growth and poverty reduction, Lao PDR needs highly efficient and balanced investment promotion and management strategies and processes. As many investors will attest to, the application process in Lao PDR for anyone wishing to do business poses a challenge. Though the investment climate is slowly improving, Lao PDR does not rate very highly in indices of transparency and ease of doing business, particularly in areas outside of the capital, Vientiane. For the year 2010, Lao PDR rated 154 out of 178 countries in Transparency International’s “Corruption Perception Index”14 and in 2010, ranked 167 out of 183 countries in the World Bank Group’s “Ease of Doing Business Index”.15 Lao PDR needs not only a highly effective investment promotion strategy, but also an investment management system that ensures that investments contribute to sustainable development. Because the country’s natural resources will likely be the target of much of the investment and because the country’s large rural population is reliant on these resources, the social and environmental impacts of investments will be closely linked. It is therefore important that investment projects minimize possible negative social and environmental impacts. As stated in the 2009 Law on Investment Promotion of Lao PDR (LIP 2009), investment is to serve the “continuous and sustainable economic growth of the country”.
This study on the economic, social and environmental costs and benefits of investments in Saravan Province is one component of a project to develop investment strategies and improve investment management systems nationally and in key provinces in Lao PDR, implemented under the Poverty‐Environment Initiative (PEI) PEI, a joint program of the United Nations Development Program (UNDP) and the United Nations Environment Programme (UNEP), was 12 Voladet, Saykham. 2009. The Plantation Industry in Laos: An Examination of the Role of the Ministry of Planning and Investment. National Economic Research Institute (NERI), International Institute for Sustainable Development (IISD), and International Union for Conservation of Nature (IUCN). 13 ICOR assesses the marginal amount of investment capital necessary for an entity to generate the next unit of production. Overall, a higher ICOR value is not preferred because it indicates that the entity's production is inefficient. The measure is used predominantly in determining a country's level of production efficiency (http://www.investopedia.com/terms/i/icor.asp; accessed December 2010) 14 Transparency International, Corruptions Perceptions Index 2010, http://www.transparency.org/policy_research/surveys_indices/cpi/2010/results (accessed December 2010) 15 World Bank Group. 2010c. Doing Business 2010 Report, http://www.doingbusiness.org/economyrankings/ (accessed December 2010)

12
launched in Lao PDR in 2009. PEI in Lao PDR focuses on strengthening the capacities of central and provincial authorities to integrate poverty‐environment issues into development plans and to optimize investments. PEI is working at the national level, as well as in four target provinces: Savannakhet, Saravan, Phongsaly and Oudomxay. The purpose of this study is to review the current status of investments, concessions, natural resources and socio‐economic development indicators in Saravan Province, as well as the capacity of the provincial investment management system to approve and regulate investments. This study also attempts to examine the economic, social and environmental impacts of investments in Saravan Province, both through an examination of provincial‐level trends and two case studies. A similar process and report has been produced for Savannakhet Province. The objectives and methodology of the study are outlined further below. The information and analysis provided in this study will further support the work of PEI in Saravan, including the development of a provincial investment strategy and capacity building for its investment management agencies. It also provides useful guidance for decision‐makers in government, the private sector and civil society who are interested in the impacts of investments to date and the formulation of strategies to ensure that they contribute to sustainable development.
1.2. Research objectives
The results from this study are intended to contribute to the development of an investment promotion strategy for Saravan Province and improvement of the province’s investment management system. More specifically, this study aims:
To assess the capacity of the investment management system in Saravan Province on the provincial level (as opposed to individual districts). The study assesses the capacities of agencies engaged in investment management, especially the Provincial Department for Planning and Investment (PDPI), the Water Resources and Environmental Office (WREO), the Land Management Office (PLMO), the Agriculture and Forestry Office (PAFO), and the Department of Industry and Commerce (PDIC). The organizational structure, human resources and financial capacity of each department and agency were assessed.
To review the status of investments and concessions in Saravan Province to date, including the value, source and target sectors of investment flows in the province.
To review the status of natural resources in Saravan Province, including land and land‐use planning, forest cover, and water resources.
To review the status of agricultural production in Saravan Province, including the role of agriculture, production modes, main products, production areas, productivity, and key actors and financial institutes supporting agricultural production in the province.

13
To review the status of socio‐economic development indicators, particularly change over time, including changes in provincial gross domestic product (GDP). Per capita income, poverty rates, health and education indicators and other socio‐economic trends in Saravan Province.
To assess the overall economic, social and environmental impacts of investment in Saravan Province, with a focus on impacts experienced at the local level in two case study areas.
More information on the research methods used during the study and on the case studies selected for the province is provided below.
1.3. Research methodologies
To achieve the research objectives outlined above, as well as to promote local involvement and inter‐agency cooperation in the project, a research team was formed in Saravan Province, comprising researchers from NERI and representatives from the key provincial departments and agencies involved in investment promotion and management, including PDPI, PAFO, WREO, PLMO, PDIC, and so on. While the research conducted in the province was lead by NERI, the team worked together to gather all the necessary data from various sectors in the province, as well as to carry out the case studies. The research methods included both desk‐based research and participatory assessment approach, as outlined below:
Literature review: The research team collected documents including previous research publications related to investment, social and environmental issues in Saravan Province, as well as monthly, quarterly and yearly development reports and data from several government departments. The research team also collected information on relevant laws and regulations. The literature review is the main source of secondary data and information for this study.
Focus group discussions: The research team organized focus group discussions with several provincial government departments related directly to investment management such as PDPI, WREO, PLMO, and PDIC. The Deputy Director Generals, Directors and main technical officers at each of these provincial departments participated in the discussions.
Key informant interviews: In addition, to get more detailed information, the research team conducted individual interviews with key informants, including representatives of the Saravan PDPI, WREO, PLMO, PAFO, representatives of civil society organizations (such as the Youth Union, Women’s Union, and Labor Union), representatives of relevant non‐government and international organization (NGOs), such as World Concern and the World Food Program, and representatives of several key investment companies (including Dak Lak Wood Processing,

14
Vanda Wood Processing Factory, Temesangthong Wood Processing Company, Viengthong Inthasid Wood Processing Factory and Phonexay Hotel).
Case studies: In order to better understand the impacts of investments in the province, the research team conducted case studies focusing on the economic, social and environmental impacts of the Caosu Dak Lak Rubber Company’s rubber plantations in Laongam District and several wood processing plants in two districts. Based on the nature of each investment project, the research team conducted the studies in different styles but each study the business in question, its activities and its impacts on surrounding villages were addressed. The findings are summarized in Section 5, and in the full case study reports provided in the Annexes to this study.
Consultation workshops. During the course of the study, three consultation workshops were organized in order to seek the comments and advice of stakeholders to the project. An introductory and planning workshop was held at the beginning of the project; a second workshop was organized after the field survey and the preparation of the draft report; and the third workshop was held to discuss the revised report and results of the study in Saravan in October 2010.
2. Geography, natural resources and socio‐economic development in Saravan Province
2.1 Geography of Saravan Province
Geographical location: Saravan Province is located in southern Lao PDR, about 550 km south of Vientiane Capital. It shares a border with Savannakhet Province to the north, with Sekong Province to the southeast, with Champassak Province to the southwest, with Quang Tri and Thua Thien Hue provinces of Vietnam also to the east, and with Ubon Ratchatani Province of Thailand to the west (please see Map 1 below).

15
Map 1: Geographical location of Saravan Province
Source: Provided by NERI
Landscape: Saravan Province has a total land area of 10,691 km2. About 44% of the land area is flatland, with an elevation of 140‐300m above sea level. This land area includes Saravan, Khongsedone, Lakhonpeng, Vapy and Toumlan districts. These flat areas are used for subsistence agriculture, industrial agricultural production, raising livestock, manufacturing and tourism. About 19% of the land area is higher flat land (or plateau), with an elevation of 300‐700m above sea level. This land area includes Laongam District and some of Saravan, Kongsedone and Vapy districts.

16
Map 2: Landscape types in Saravan Province
Source: Provided by the National Agriculture and Forestry Research Institute (NAFRI), MAF.
This area is commonly used for subsistence agriculture, industrial agriculture, growing beans, raising livestock, manufacturing and tourism. About 37% of the provincial land area is mountainous, with an elevation of 700‐1200m above sea level. This land area includes Taoy and Samoy districts, and is used for subsistence agriculture, raising livestock, growing cassava and ecotourism.16 Saravan Province is rich in natural resources, including fertile agricultural land, forests (including both protection forest and production forest areas), rivers, minerals and metal deposits and biodiversity. These natural resources represent potential for socio‐economic development. Of a total land area of 1,069,100 hectares, about 224,000 ha of the province is considered agricultural land, representing 21% of the total land area. Saravan’s agricultural lands are fertile and are used to support food security in both Saravan and other provinces such as Sekong and Attapeu. The five flatland districts include 73% of the total agricultural land area, while the two mountainous districts have only 17% and Laongam District on the plateau includes the remaining 10% of the province’s agricultural lands. Map 2 above shows land use types in the province.
Climate: Saravan has a relatively temperate climate compared to other parts of Lao PDR; the average temperature is estimated to be 27 in the flatland areas, 26 in the plateau areas, and 24 in the mountainous areas. The province has about 150 rainy days per year with about 2,500 mm of rainfall per year, which is about 725mm more than the national average. The average amount of sunshine is estimated to be 1,500‐2,500 hours per year, which is close to the national average of 2,032 hours. The average wind speed in Saravan is about 20‐30 m/s; the highest wind speeds are in April and May (about 100‐120 m/s). Overall, the province’s climate
16 Land information provided in Provincial Agriculture and Forestry Office. 2009. Yearly Report 2008‐2009.

17
is similar to that of the rest of the country. With substantial rain, sun and fertile soil, the province is suited to growing food crops and industrial plantations.17 Although there are limitations to the availability of country‐specific data and projections on the potential impacts of climate change, there is potential for climate change to reduce agricultural production in Lao PDR in the future. Average daily temperatures across Southeast Asia have already increased 0.5 to 1.5ºC between 1951 and 2000, and mean temperatures across the Mekong River Basin will most likely increase by another 0.79ºC over the next 20 years.18 The Mekong River Commission (MRC) notes that climate change is expected to modify temperatures, rainfall and wind in the Lower Mekong Basin, affecting natural ecosystems as well as agriculture and food production, of serious concern in countries that rely strongly on natural resources. In Lao PDR agricultural and infrastructure losses due to increased storm intensity and frequency, land degradation and soil erosion from increased precipitation and a higher prevalence of infectious diseases are predicted.19
2.2 Natural Resources in Saravan Province
Forest cover: In 2005, the province had a total forest area of about 707,400 hectares, representing about 66% of the total provincial land area. By 2010, forest cover had been reduced to 625,177 hectares or about 58% of the total provincial land area.20 This forest cover area is composed of national conservation forest (22% of total provincial land area), production forest (21%) and protection, rehabilitated and plantation forest area (16%). The remaining 42% of total provincial land areas is field, agriculture, community, water area, degraded forest, village forest, and so on. Forest cover in Saravan Province has decreased by 8 % over the last five years (2005‐2010).21 This suggests that forestland is being logged as well as converted to other uses, such as agriculture, plantations, and dams. Further, the province’s plans to increase plantations suggest that its forest cover will continue to decline. According to Saravan PAFO, shifting cultivation only has a very minor impact on deforestation since it only affects an area of about 2,480 ha or 0.23% of the total forest area.22 Table 1 and Maps 3 and 4 below provide more detail on forest cover and land types in Saravan Province in 2010.
17 Climate information provided in Saravan WREO. 2009. Yearly Report 2008‐2009. 18 IPCC, 2007, and Eastham, 2008, cited in WWF. October 2009. The Greater Mekong and Climate Change: Biodiversity, Ecosystem Services and Development At Risk. 19 MRC. September 2009. “Adaptation to Climate Change in the Countries of the Lower Mekong Basin”. MRC Management Information Booklet Series, No.1. 20 Saravan PAFO. Five Year Plan for 2011‐2015 [Draft]. 21 Saravan PDPI. Five Year Plan for 2011‐2015 [Draft]. 22 Saravan WREO. 2008‐2009 Annual Report; and WREO. Five Year Plan for 2011‐2015 [Draft]

18
Table 1: Forest categories in Saravan Province, 2010.
Forest category Area (ha) Share of forest (%) National Biodiversity Conservation Area (NBCA) 240,163 38.4 Protection forest 222,305 35.6 Production forest 162,709 26.0 Total 625,177 100.0
Source: Saravan PAFO.
Map 3: Forest and land types, Saravan Province, 2010
Biodiversity: Saravan’s forests and other natural areas play an important role in hosting diverse biological resources, which are often essential in supporting local livelihoods. Wildlife and non‐timber forest products, as in other parts of Lao PDR, are consumed by households as well as sold for extra cash income, forming an important part of livelihoods and safety net for rural people in times of food insecurity. On average, a rural family consumes the equivalent of US$280 per year in non‐timber forest products (NTFPs), which is significant given that the per capita GDP of Lao PDR was about US$880 in 200923 (and average income may be lower in rural and remote areas). A 2001 study on consumption of forest foods in Saravan Province showed that
Food security was a concern for most families in the study area;
All families in the three villages studied collect forest foods on a daily basis;
23 IUCN Lao PDR. 2010. “Biodiversity and Livelihoods: Background issues paper for CoP 10” [Draft]. Figure for current Gross national Income (GNI) per capita is from the World Bank, 2010a.

19
Villagers consume a great variety of forest foods; and
These forest foods are the most important source of food besides rice
The amount of forest foods gathered by each family each week in the three Saravan villages ranged from 3 kg in the dry season to 7 kg in the wet season. The main NTFPs and wildlife gathered were bamboo shoots, frogs, fish, insects, mushrooms and green leaves.24 More than 500 plant species have been recorded in Savannakhet and Saravan Provinces, including a number of threatened dipterocarp (tree) species, and a 2007‐2008 study in five districts of the two Provinces found a range of 40‐90 plant species across the districts25. Table 2 shows the range of vertebrate species found in the two provinces as well:
Table 2: Vertebrate species found in Saravan and Savannakhet provinces
Category Total Globally threatened
Freshwater fish 142 3 Amphibians 34 ‐‐ Reptiles 58 5 Birds 384 6 Mammals 95 27
Source: IUCN Lao PDR, 2008.
Though surveys of wildlife in Saravan Province are limited, from those that have been carried out, we know that the following animals are found in Xe Bang‐Nouan, Xe Sap and Phou Xiang Thong National Biodiversity Conservation Areas (all of which are partially located in Saravan) and have been identified by IUCN as of global conservation concern: Pangolin, Pig‐tailed macaque, Long‐tailed macaque, Rhesus macaque, Silvered langur, Douc langur, White‐cheeked cheeked crested gibbon, Bear, , and Large loris.26 The recently classified new species of gibbon, Northern buff‐cheeked gibbons (Nomascus annamensis) are also found in Saravan Province. A type of crested gibbon, it is important to note that all crested gibbons are either endangered or critically endangered. Though the exact status of this new species of gibbon has yet to be determined, it is important to note that all crested gibbons are either endangered or critically endangered. 27
24 Clendon, 2001, cited in Foppes, Joost, and Sounthone Ketphanh. 2004. “NTFP use and household security in Lao PDR”. Draft paper for NAFRI/FAO Symposium “Biodiversity for Food Security”, Vientiane, 14 September 2004. 25 IUCN Lao PDR. 2008. A Rapid Participatory Biodiversity Assessment:Stora Enso Eucalyptus Plantation in Southern Lao PDR. 26 IUCN. 1999. Wildlife in Laos PDR: 1999 Status Report. Samsaen Printing, Bankok. These animals have been identified as of global conservation concern because they are either globally threatened, globally near‐threatened or data deficient. 27 Primatology.net. 22 September 2010. “New Gibbon Species Discovered”, http://primatology.net/2010/09/22/new‐gibbon‐species‐discovered/ (accessed December 2010); and Van Ngoc Think et al. 2010. “A new species of crested gibbon from the central Anamite mountain range”. Vietnamese Journal of Primatology, 2010 (4):1‐12.

20
More detailed surveys are required, but it can be inferred that the loss of forest cover in Saravan has had negative impacts on the biodiversity of the province. Similarly, habitat loss and disturbance in the province’s wetlands, streams and rivers through conversion to agriculture land, pollution, damming and so on, can also be expected to negatively affect biodiversity. It is useful to take a broader view of biodiversity in Lao PDR, beyond protected forests, as being supported by a mosaic of landscapes: home gardens, forest gardens, cultivation plots, fallow land, regenerating forest, primary forest, forest plantations, wetlands, and so on. Areas of low biodiversity value may in fact have high livelihood value, particularly where local communities are very dependent on a limited number of species – access to those species then becomes vital. Conversion of low biodiversity areas, if linked to livelihoods, may also result in increased pressure on high biodiversity areas, as people look for new sources of biological resources.28
Water resources: Saravan Province is rich in water resources. There are more than 30 rivers flowing across the province, supplying its drinking water and irrigation water to, as well as forming numerous waterfalls. Many of the rivers begin in the Bolaven Plateau and the mountains, and then connect to the Sedone and Mekong rivers. The most important river in the province is the Sedone, which flows through Saravan Province for about 192 km and supports many people who live along its banks. About 90 km of the Mekong River also passes through the province. Other key rivers include the Se Bangnuan, Sepone and Seset. Saravan Province hosts a number of hydropower projects, which produce much of the province’s electricity (the province’s major hydropower projects are outlined in the table below). The province has more than 130 reservoirs and as yet unpolluted ground water. These water resources are used for irrigation systems, reservoirs, hydroelectric dams, fishing, tourism and transport.29
Table 3: Major hydropower projects in Saravan Province, 2010
Project name Investors Size Status
Xelanong 2 JRC Service Co. Ltd (Japan) 75%; GoL 25%
60 Project Development Agreement signed in
2007
Xeset 2 EdL (Laos) 76 Operational (since 2009)
Xeset 1 EdL (Laos) 20%; China Exim Bank 80%
45 Operational (since 1990)
Source: International Rivers. March 2010. “Lao Hydropower Database”. http://www.internationalrivers.org/files/LaoHydroMar2010.pdf
28 IUCN Lao PDR, 2008. 29 Saravan WREO. Five Year Plan, 2011‐2015 [Draft].

21
Villagers who participated in the case studies on a rubber plantation and several wood processing companies conducted as part of this research in Saravan Province claimed that investment projects in their local areas are having a negative impact on water resources – these impacts were mainly identified as water sources becoming less or even drying up. However, the relationship between forests or plantations and water flow and quality is a complex one, dependent on numerous factors, such as the species involved, local rainfall, access to irrigation, soils, and so on. According to a UNDP environmental and social impact assessment for a eucalyptus plantation in China, forests and plantations can usually reduce dry season flow in low rainfall areas, like South Africa and Australia.30 Certain biofuel crops can also be water‐hungry, of particular concern for areas relying on irrigation.31 The implications of increased investments in the natural resource sector in Saravan Province on water supplies and water quality will require careful management; in particular, the potential impacts of hydropower and irrigation projects are interwoven with the impacts of plantations development and the negative effects of continued forest loss and degradation.
Mining: There is currently no formal mining sector in Saravan Province. However, clay, coal, limestone, iron, black quartz crystal, and natural gas deposits have been found. Salamander Energy, a British oil and gas company is currently undertaking exploration in Savannakhet and Saravan provinces.32 If mineral deposits can be exploited to a level to support processing in the future, then the mining sector will attract domestic and foreign investments, and potentially encourage investment in other industries that use the materials or support the sector. The mining sector is one of the biggest contributors to national revenue in Lao PDR and plays a key role in the GoL’s economic development strategies. According to the World Bank, the mining and quarrying sectors together contributed about 2.5 percentage points to the overall growth rate, and FDI in the mining sector accounted for about 18% of total FDI, in 2009.33 Lao PDR’s Minerals Law states that it aims to ensure the efficiency of the exploration, mining and processing of minerals in conjunction with environmental protection and socio‐economic development.34 However, although mining projects add to government revenue, provide jobs and contribute to rural development, potential negative social and environmental consequences for local communities need to be managed carefully. These include spills of pollutants damaging waterways and fish stocks, loss of land, forest resources and biodiversity, and increased migration into mining areas.
30 UNDP. 2006. Environmental and Social Impact Analysis: Stora Enso Plantation Project in Guangxi, China. 31 IWMI. 2008. “Water Implications of Biofuel Crops: Understanding Trade‐offs and Identifying Options”. Water Policy Brief, Issue 30. 32 Salamander Energy, official website. “Acerage Directory”. http://www.salamander‐energy.com/media‐centre/press‐pack.aspx accessed: December 2010 33 The World Bank. 2010b. 34 Lao PDR National Assembly. 2010. Minerals Law. [Working draft and unofficial translation, March 2010].

22
2.3. Socio‐economic development in Saravan Province
2.3.1. Macro‐economic development
Over the last few years, Saravan Province has worked to develop its economic and social infrastructure so as to promote domestic and foreign investment and thus attract more capital inflow to the province. During these last five years, the province has experienced enough economic growth for the provincial GDP per capita to increase from USD 388 per person in fiscal year 2004‐2005 to USD 710 per person in 2009‐2010, almost a doubling.35 Though, the province has clearly made considerable progress, its GDP per capita remains below the national average of USD 880 per person in 2009.36 Provincial GDP on average reached LAK 2,178.1 billion in 2009‐2010. This province has experienced an average economic growth of 10% a year for 5 years. The economic growth rate increased from 8% in fiscal year 2005‐2006 to 14% in fiscal year 2009‐2010, a growth rate similar to that of Savannakhet Province and higher than the national average growth rate of 7.5%37. Figures 1 and 2 below show the growth of GDP per capita in Saravan Province over the past five years.
Figure 1: Increasing economic growth of Saravan Province 2006‐2010 (percent)
35 MPI. Five Year Plan 2011‐2015 [Draft] 36 The World Bank, 2010a. 37 National MPI, 2011‐2015 Draft Plan

23
Figure 2: Increasing GDP per capita in Saravan province, 2001‐2010 (USD)
Source for Fig. 1 & 2: Saravan PDPI. Five‐Year Plan, 2011‐2015 [Draft].
According to the province’s report on the last Five Year Plan38, its 10% economic growth between 2005 and 2010 is primarily due to the growth of industrial agriculture as well as the manufacturing and service sectors39, replacing subsistence agriculture (which was likely not accounted for within the formal economy previously) and forestry. The share of the economy of Saravan Province, the agriculture and forestry sector, the industrial sector and the service sector has changed from 62:16:22 in 2005‐06 to 54:19:27 in 2009‐10 . Table 2 and figure 3 present more detail.
38 Saravan PDPI. 2010. Report on Five‐Year Plan, 2006‐2010. 39 Import and export trade, taxes and tourism are included in this category.

24
Figure 3: Changing economic structure in Saravan Province, 2001‐2010
Source: Saravan PDPI. 2010. Report on Five‐Year Plan, 2006‐2010.
This changing economic structure indicates that the economy of Saravan Province is becoming more industrialized. The role of traditional subsistence agriculture is decreasing in its contribution to the economy, although it is still vital to the livelihoods of the bulk of the province’s population. However, although traditional agricultural production is shrinking, industrial and commercial agriculture, particularly plantations, are expanding. Still, though industrial agriculture is growing, it is not growing as quickly as the services and industry sectors, especially tourism, the processing industry and trade. Currently, there are four hotels, 30 guesthouses and 45 tourism sites established in Saravan province. The key industrial sector experiencing rapid growth during the last decade is wood processing. Saravan Province has a total of around 50 wood processing factories, which employ more than 1,600 local people. Table 4 below shows the changing structure of sectoral contributions to provincial GDP.
Table 4: Changing GDP structure in Saravan Province, 2006‐2010
List Indicators Unit 2005‐2006 2006‐2007 2007‐2008 2008‐2009 2009‐2010
GDP Billion LKP
1,446 1,570 1,718 1,917 2,178
Agriculture‐forestry Billion LKP 867 911 975 1,063 1,178
Industrial Billion LKP 242 283 324 367 421
1
Service Billion LKP 337 377 419 487 579
2 Population Person 332,037 340,000 347,456 355,462 363,246

25
Source: Saravan PDPI. 2010. Report on Five‐Year Plan, 2006‐2010.
2.3.2 Poverty reduction
Despite this economic growth, Saravan Province still has three poor districts (Toumlan, Taoy and Samoy districts), in which an average of 30% of the villages are classified as poor, and an average of 26% of households are classified as poor (see Table 3 below for more detail). These three districts are among the forty‐five poorest in the country. Overall, as of 2009, Saravan Province had 48 poor villages and 4,742 poor households. This means that 8.1% of all households in Saravan province are considered poor, a contrast to the country as a whole where about 26% of households are poor.40 Figure 5 also provides more detail on poverty rates in the province.41 Based on statistical data, the poverty rate in Saravan Province has decreased substantially in the last ten years, from 38% in 2000 to 23% in 2005 and further to 8.1% in 2010. On average, the province’s poverty rate has decreased by about 3% a year, which is a much higher rate of reduction compared to the whole Lao PDR (i.e. about 1 % a year).
However, in 2010, over 28,790 people in Saravan Province, corresponding to about 8.1% of its total population, are still living below the poverty line. Most are living in the eastern part of the province, where road infrastructure is underdeveloped and access to markets and other
40 The WHO defines the poverty line based on calorie consumption. According to the Organization, there are two kinds of poverty lines, i.e. food poverty and general poverty line. The food poverty line means consumption of less than 2,100 calories per person per day and the general poverty line means food poverty plus 20% of the local price of 2,100 calories. Based on that, the GoL developed a Lao national poverty line. The food poverty line in Lao PDR is understood as consuming of less than 16 kilogram rice per person per month and the general poverty is understood as food poverty line plus 20%of local price of 16 kg rice. That means households consuming and spending less than the line are identified as poor household. In general poverty in Lao PDR is understood as inability to satisfy basic needs including food consumption, clothing and housing. 41 Saravan PDPI. 2010. Report on Five‐Year Plan, 2006‐2010 ; and Five Year Plan, 2011‐2015 [Draft].
3 Average GDP per capita LKP 4,354,396 4,618,682 4,945,314 5,392,616 5,996,211
4 Average GDP per capita US$ 433 482 510 635 710
GDP Growth in a year Percent 8 9 9 12 14
Agriculture‐forestry Percent 4 5 7 9 11
Industrial Percent 16 17 15 13 15
5
Service Percent 11 12 11 16 19
Economic structure 100 100 100 100 100
Agriculture‐forestry Percent 60 58 57 55 54
Industrial Percent 17 18 19 19 19
6
Service Percent 13 24 24 25 27
7 Exchange rate in year LKP/US$ 10,060 9,586 9,696 8,495 8,446

26
services is difficult (i.e. Taoy, Samoy and Toumlan districts). The tables and map below show the incidence of poverty in Saravan Province.
Map 4: Poverty concentration in Saravan Province, 2005
Figure 4: Percentage of poverty in Saravan Province, by district
Source: Saravan PDPI: 7th Five year plan, 2011‐2015, 2010.
Source: Socio‐economic Atlas of the Lao PDR, 2005

27
Table 5: Poverty incidence in Saravan Province in 2009
Source: Saravan PDPI. 2010. Report on Five‐Year Plan, 2006‐2010; and 7th Five Year Plan, 2011‐2015 [Draft].
Saravan Province is currently focusing its poverty alleviation efforts on the development of village development clusters (known in Lao as “Khum Ban Phatthana” or more simply “khum ban”) of which there are already 57 in the province. All khum bans are expected to address poverty and to increase the movements of officers who are tasked with teaching local people about new agriculture and irrigation techniques and how to set up schools, for example. Expanding educational opportunities has been one of the key goals of khum bans in Saravan Province. To date, 20 khum bans have primary schools and 12 have lower secondary schools. The third phase of these efforts is expected to begin soon and will involve expanding to include an additional 20 khum bans.42
2.3.3 Population and labor force
According to the Saravan PDPI, in 2009‐2010, the province had a total population of 363,246 people, representing about 6% of population of all of Lao PDR. The population density is about 33 persons/km2. Approximately 51% of the population is female and the population growth rate is 2.4% per year, higher than the average population growth rate for the entire country.
42 Saravan PDPI. Report on Five Year Plan, 2006‐2010; and Five Year Plan for 2011‐2015 [Draft].
List
District
Total o
f pop
ulation
female
Male
Num
ber of village
Num
ber of poo
r village
Percen
t of poo
r village
Num
ber of hou
seho
ld
Num
ber of poo
r ho
useh
old
Percen
t of poo
r ho
useh
old
Evalua
tion
of p
overty district
1 Saravan 94,918 48,166 46,752 134 2 1.49 14,894 738 4.96 1 2 Taoy 23,173 11,422 11,751 56 18 32.14 3,638 1,376 37.82 2
3 Toumlan 24,387 12,374 12,013 37 13 35.14 4,053 680 16.78 2
4 Lakhonpheng 41,332 20,695 20,637 80 ‐ ‐ 7,841 86 1.10 1 5 Vapy 34,212 17,462 16,750 56 1 1.79 5,664 68 1.20 1 6 Khongsedone 57,513 29,412 28,101 92 ‐ ‐ 9,656 307 3.18 1 7 Laongam 66,111 33,446 32,665 103 1 0.97 10,656 986 9.25 1 8 Samoy 13,816 7,096 6,720 54 13 24.07 2,141 501 23.40 2
Total 355,462 180,073 175,389 612 48 7.84 58,543 4,742 8.10
Percent 50.66 49.34 3 poor district : Taoy, Toumlan and Samoy

28
More than 50% of population is of working age (between 14 and 60 years old). The age structure of the population thus provides a good condition for economic and social development in the province, and for attracting investment.
In terms of its ethnic groups, cultures, traditions and livelihoods, Saravan Province is relatively more diverse than the other provinces of Lao PDR. According to the Population Census of 2005, the majority of the population of Saravan is Lao Loum (60.5% of the population). This is followed by Katang (12.8%), Suoy (7.6%), Taoy (5.2 percent), Pako (4.9%), and Yru (3.3%), to name a few. Other groups each representing 1% or less of the provincial population include Phu Tai, Ka Lieng, Oy, Ka Tu, Ye, A Lak and Sa Dang.43
The majority of people in Saravan Province still practice traditional livelihoods, including a limited amount of shifting cultivation, as noted above. The GoL aims to eradicate shifting cultivation country‐wide by the year 2015. However, as discussed, the provincial authorities note that shifting cultivation covers a small area in Saravan Province, affecting only 2.3% of its forest. It will still be very difficult for Saravan government to change traditional shifting cultivation practices by 2015, but to aid this process, the province aims to provide more job opportunities at the local level, as well as resettle certain villages and follow the national poverty reduction policy. If these goals are not met, it is likely that most people in Saravan Province will have to change from traditional livelihood patterns to more commercial and industrialized agricultural production and join the labor force to support large‐scale domestic and foreign investment in the province. As a compromise to help meet the national policy of ending shifting cultivation, Saravan Province will encourage some of its population that currently practices shifting cultivation to alter their practices so that they rotate their fields in a cyclic manner and replant each section of land every 8‐10 years.44
As noted above, agriculture remains the main economic activity for people in Saravan Province. There is little information available, but migration also occurs, as people travel to seek better economic opportunities. For example, one study shows that in Toumlan District, 1.43% of population moved in and 1.14% moved out in a period of 12 months.45 Further, between 2001 and 2007, 73% of the 1056 repatriated persons from Thailand to Lao PDR were from the southern provinces of Khammouan, Savannakhet, Saravan and Champassak.46
43 Saravan Province Population Census report, Vientiane, 2007. 44 Provincial Land Management Office (PLMO). Report on Five Year Plan, 2006‐2010; and PLMO Five Year Plan, 2010‐2015 [Draft] 45 Vilon Vipongxay. 2006. “Community‐based monitoring system in Lao PDR: The survey in Sepon and Toomlan districts”. Paper presented at the 5th PEO network Meeting, Addis Adaba, 16‐22 June 2006. 46United Nations Inter‐Agency Project Against Human Trafficking. 2008. “Siren Human Trafficking Data Sheet, Lao PDR, March 2008”. UNIAP, Phase III.

29
2.3.4 Infrastructure development and regional integration
Saravan Province has eight districts and about 259 roads with a total of length of 2,143.63 km. The road density is estimated to be 0.2 km/km2, which is a little higher than the road density of the country (0.14 Km/Km2). The road length per capita is estimated to be 6.5 km per 1,000 people, which is also higher than road per capita density of the country (5.4km/1,000 people).47 Between 2005 and 2010, the total length of tarred road in the province increased from 141.5 km to 163 km. Routes No. 13 and No. 20 are the main roads in Saravan Province, connecting Saravan with several key trade and economic centers in Lao PDR, such as Vientiane Capital to the north and Pakse to the south. The province is currently building roads No. 15A, 15B and 1G which will connect the province to Vietnam and Thailand. This will help to facilitate the movement of goods and people within the country and with its neighbours, making the province a more attractive place to invest. Roads in rural areas also help farmers and other rural entrepreneurs access markets. Road construction is particularly important in Saravan Province because the province does not yet have a very comprehensive or high quality road system, and many are still dirt roads, making it hard to travel between certain parts of the province. Road construction will be increasingly important as the province seeks to speed up investment and its overall socioeconomic development. Table 7 and Map 5 provide more information on the road network in Saravan Province.48
Table 6: Road infrastructure in Saravan Province
Unit: km
List Item Tarred Gravel/earth Total1 National road 163 269 4322 Provincial road 2 188 1903 District road 0 216 2164 City road 15.59 27.41 435 Rural road 0 1,229.63 1,229.636 Special road 13 20 33 Total 193.59 1,950.04 2,143.63
Source: Provided by Saravan PDPI. 2009. Report on Implementing Socio‐Economic Plan, 2008‐2009.
47 Provincial Department of Transportation and Public works. 2009. Annual Report. 48 Provincial Department of Transportation and Public Works. 2009. Annual Report.

30
Map 5: Map of the Road infrastructure in Saravan Province
Source: National Ministry of Transportation and Public works, Transportation Department
Although only 55% of the provincial population has access to roads today, this is an improvement from 2005 when only 45% of the population had road access. The number of villages that cannot be accessed during the wet season is still over 40% at present, indicating the province still has a lot of work to do to expand its road infrastructure. Bridges are also an important part of transportation infrastructure in Saravan Province, since there are so many rivers. There are about 181 bridges in the province with a combined length of 3,710.78 meters.
Saravan Province has relatively developed communications infrastructure. Mobile telephone networks cover all districts in the flatland and plateau areas, as well as the cities and towns of the province. According to Saravan PDPI, about 1,685 land line numbers (likely equivalent to the number of households with land lines), about 1,663 wireless numbers49 and about 17,200
49 This refers to phones used in rural areas where land lines and reliable cell phone service are not available. Through radio and satellite signals and other technologies, villagers can use phones that look like a regular landline

31
cell phone numbers. In comparison with 2005, there is now about five times the number of telephone numbers in use. The provincial authorities have also built a 100‐watt radio network in Kongsedon, Taoy and Samoy districts.50
2.3.5 Access to health services
Saravan Province has a relatively well developed healthcare system which covers the whole province, including rural areas. The percentage of women giving birth in the hospital or receiving assistance from a trained volunteer or nurse has increased from 9% in 2005 to 22% in 2008. About 38% of the total number of families in province practiced family planning in 201051. Women’s clinics (that assist with childbirth) have also been built in villages where certain ethnic groups traditionally give birth at home, far from medical care. The province’s health indicators have also seen improvement, with the death rate from tuberculosis decreasing from 92/100,000 in 2006 to 70/100,000 in 2008, the death rate of malaria decreasing from 5.93/1,000 in 2006 to 2/1,000 in 2008, and the access to clean water rate increasing to 81.43% of the population in 2008. Community health stations have increased from 28 stations in 2005 to 43 stations in 2010. Table 8 below presents more details on heath indicators in Saravan province52.
Table 7: Some important heath indicators in Saravan province
Heath indicators Saravan Province (2008) Lao PDR
Average life expectancy (years) 61 63.5Mortality rate of children under 1 102/1,000 70/1,000 (2005)Mortality rate of children under 5 167/1,000 98/1,000 (2005)Death rate of mother in childbirth 330/100,000 450/100,000 (2005)Death rate of malaria 2/1,000 3,118Death rate of tuberculosis 70/100,000 ‐Clean water used rate 81.43 ‐Household using toilet rate 29.32 ‐Source: the Ministry of Planning and Investment (MPI): Yearly Report, 2005 and Saravan Provincial Department for
Planning and Investment: Mid‐term Report on Implementing 6th Five Year Plan (2006‐2010), 2008
2.3.6 Access to education
Saravan Province has improved its education system but its overall educational indicators remain below average compared to the rest of Lao PDR. Saravan Province has 612 schools in
telephone (but without the landline) to place phone calls. Instead of signing up for monthly phone service, villagers can pay as they go by buying “top up cards” similar to those used to add credit to cell phones. 50 Provincial Department of Transportation and Public Works. 2009. Annual Report. 51 Saravan PDPI. 2010. Five Year Plan, 2011‐2015 (Draft). 52 Saravan PDPI. 2008. Mid‐term Report on Implementing 6th Five Year Plan (2006‐2010).

32
2010, a huge increase from 81 schools in 2004‐05. This includes 570 primary schools (up from 71 in 2004‐2005), and 42 secondary school (up from 10). The total enrolment of students in primary and secondary school (including lower and upper) is 67,024 people (of which 29,725 are female). The net enrolment rate is 86.2% for primary school, 35.9% for lower secondary school, and 19.7% for upper secondary school. About 14,265 students attend secondary school, including 5,826 girls (meaning girls account for about 40% of the student body). According the Saravan Department of Education, at present, the province has 47 Kindergartens which a total of 2,184 children attend (including 1,083 females). This is large increase from 2005 when there were only 26 kindergartens.53
Table 8: Some education indicators in Saravan Province, 2010
Item Saravan Province (%) Lao PDR (%)
Literacy rate of people 15 years old and older ‐ 83*
Kindergarten attendance rate 16.8 16*
Net enrolment rate at primary school 86.2 91.6 Net enrolment rate at lower secondary school 35.9 63*
Net enrolment rate at upper secondary school 19.7 28*
In Lao PDR there remains an imbalance in school attendance between males and females, particularly for females in rural areas and from ethnic minority groups. Nationally, at the primary school level, the gap is relatively small, (2% in 2009/2010). The gender gap increases at higher levels of education, and girls make up a larger proportion of the people who have never been to school: 17% of girls compared to 11% of boys.54 The gender imbalance in Saravan (where approximately 45% of primary school students and only 40% of secondary school students are female) mirrors that of the country as a whole. Education, training and work experience of the population is considered an important condition for the encouragement of socio‐economic development and investment in particular.
2.3.7 Tourism development
According to the Saravan Provincial Tourism Office, the province has strong potential for the development of its tourism sector in the future. The province has been attempting to boost the development of its tourism services, upgrading tourism sites, building and renovating guesthouses and restaurants. To date, the province has 4 hotels, about 30 guesthouses and resorts, and 45 tourism sites. According to the statistical report on tourism in Saravan province 53 Provincial Department of Education. 2009‐2010 Annual Report; and Provincial Department of Education. 2010. Report on Five‐Year Plan, 2006‐2010. 54 The World Bank. 2010d. Lao PDR Country Policy and Institutional Assessment 2010.
Source: the Ministry of Planning and Investment: NGPES, 2004; the Saravan Provincial Department for Planning and Investment: 7th Five Year Plan 2011‐2015 (Draft)

33
2010, the number of tourists arrival in Saravan has been increasing constantly from 8,450 in 2004 to 28,142 in 2009, and further to 32,36355 in 2010.56 This means the number of tourists who visit Saravan has increased four‐fold in the last six years. This demonstrates that the sector has developed rapidly and suggests that tourism has potential to provide further economic opportunities for people in Saravan Province.
3. Investment management system in Saravan Province
In this section, the research team analyzes four main aspects of investment in Saravan Province, including: (1) laws and regulations related to investment and concession approval and management; (2) investment and concession approval procedures; (3) the capacity of relevant agencies, especially those taking the main responsibility for investment approval and management (including the PDPI, WREO, PAFO, PLMO, PDIC); and (4) statistical data on investments and concessions in Saravan Province.
3.1. Laws and regulations related to investments and concessions
The GoL aims to implement sustainable development policies, which simultaneously promote economic, social and environmental development. Lao PDR has a relatively comprehensive regulatory framework designed to achieve those goals. The following section will outline the key laws and regulation related to managing investments and concessions, which have been promulgated at the national level.
Law on Investment Promotion (2009): The Law on Investment Promotion (LIP 2009) is used to regulate investment activities within the Lao PDR, combining both foreign and domestic investment regulations within the one document. It aims to streamline the investment process by removing the previous requirement of the investor having to go to four different ministries to obtain the Investment License, Company Seal, Tax Registration Certificate and Enterprise Registration Certificate; both the Enterprise Registration Certificate and the Concession license now comprise all four documents in one, and may be issued in one place, by the Ministry of Industry and Commerce (MoIC) and the Ministry of Planning and Investment (MPI) respectively. The new LIP 2009 has officially been enacted and has ‘technical’ applicability. However, because the Decree on the Implementation of LIP 2009 (Draft Decree 2009) is not yet finalized, there are complications in applying this law to govern an investment. However, for the
55 Saravan Provincial Office of Torism: Estimated number given in Statistical Report on Tourism, 2009 56 Saravan Provincial Office for Tourism: Statistical Report on Tourism, 2009

34
purposes of this report, the procedures for investing in the Lao PDR will be set out below according to the LIP 2009 and the Draft Decree 2009.57
Key features of the LIP 2009 include:
One Stop Service (OSS): The new LIP 2009 has mandated the creation of a “one‐stop service” in order to promote investment and to assist investors by alleviating some of the difficulties associated with the application process.58 According to the LIP 200959, the OSS exists at two levels, central and provincial, and it has offices established at the Planning and Investment sector (P&I), the Industry and Commerce sector (I&C), and at Special Economic Zones and Specific Economic Zones. The OSS is based on the principle that investors can submit an application and receive a reply at the same place. All decisions relating to the investment shall be made through the meeting of the office of the OSS and it shall perform all services in a timely and efficient manner the Law requires investors to have received a response within 15 days). Transparency shall be upheld, with all information pertaining to fees and charges and all relevant information and solutions to various problems disclosed.60
Investment Committees: The LIP 2009 has also attempted to set out more clearly the roles and responsibilities of the central and provincial levels of the GoL. More responsibility has been assigned to the local level, with Article 84 of the LIP 2009 stating that the local level’s main task is to issue licenses and manage investments. The central level is also charged with issuing licenses but their role extends to the management of investment activities of a more technical or ‘strategic’ nature.61 The responsibilities of the central level also include macro‐management, in ‘encouraging and monitoring the implementation of the local level’.62 Both the central and provincial levels shall be responsible for the management, follow‐up, inspection and evaluation of all investments for which they have specifically issued the license. While membership of the Investment Committees has not yet been outlined in the Draft Decree, MoIC have indicated in recent discussions with MPI that membership will be based on the Committee for Promotion and Management of Investment (CPMI) referred to in the 2004 Laws on the Promotion of Foreign Investment and Domestic Investment and the existing Investment Decree (2005). The CPMI is extant at two levels, the central and provincial levels. As an example, the I&C sector committee at the provincial level will most
57 It is important to be aware that the Draft Decree 2009 referred to in this report is still subject to change, meaning that some of the information regarding the roles and responsibilities of the committees may not be relevant in the future. 58 Article 12, Draft Decree on the Implementation of the Promotion of Investment Law 2009. 59 Reiterated by Article 12 of the Draft Decree on the Implementation of the Law on Investment Promotion 2009. 60 Articles 45(1)‐(6), Law on Investment Promotion (2009). 61 Article 84, Law on Investment Promotion (2009). 62 Article 83, Law on Investment Promotion (2009).

35
likely comprise the provincial Governor or capital city Mayor, plus vice‐governors or vice‐mayors.
Investment types: Article 4 of the LIP 2009 holds that the State promotes both foreign and domestic investments ‘in all sectors, activities and all regions in the whole country, except those zones and activities which are detrimental to the national security and peace, have harmful impacts to the environment at present time and in the long term, to the public health and to the fine culture of the country’. According to Article 13, the types of investment activities categorized as follows:
General activities (e.g. restaurant, bars, retail)63
Concession activities
General Activities in Special Economic zone (SEZ) and Specific Economic Zone (SpEZ)
The procedures for submission and consideration of investment applications, with a focus on the provinces, will be discussed in greater detail below. Annex 1 provides a flow chart detailing the investment application process.
Enterprise Law (2005): The Enterprise Law (2005) has relevance to investment procedures, defining enterprise registration, stating that any person intending to conduct business shall file a notification for enterprise registration with the concerned State agencies, and outlining the procedures and timeframe for registration. The ‘concerned State agencies’ differ depending on the type of investment, as stipulated in the LIP 2009. For investments categorized as Concession Activities, applications shall be submitted to the OSS of the P&I sector, at either the central or provincial level.64 For General Investments, the concerned State agency shall be the OSS of the I&C Sector, at either the central or provincial level65. SEZ investments shall be submitted to the OSS of the Zone Authority at the SEZ site66.
Environmental Protection Law (1999): The Environmental Protection Law sets out basic principles of environmental protection at Article 5, stating that all persons and organizations residing in the Lao PDR have an obligation to protect the environment. Regarding investment approval, it states that development projects and operations that have or will have the potential to affect the environment shall submit an Environmental Impact Assessment (EIA) report in accordance with the regulations of what is now WREA67, who are responsible for
63 Article 14 of the LIP 2009 defines general activities as investment activities within the general business sector, including those which are on the list of controlled business types but excluding concession activities. Since the Draft Decree on the LIP 2009 has not yet executed such a list, the examples given above are drawn from the 2005 ‘Decree of the Prime Minister regarding the Implementation of the Law on the Promotion of Foreign Investment’. 64 Article 21, Law on Investment Promotion (2009). 65 Article 17, Law on Investment Promotion (2009). 66 Article 43, Law on Investment Promotion (2009). 67 Article 36, Environmental Protection Law (1999).

36
environmental management and monitoring, and the issuance of an Environmental Compliance Certificate (ECC) before starting the project.
ESIA Regulation (2010) (now combining Environmental Assessment Regulation (STEA, 2002): The Decree on Environmental and Social Impact Assessment was only recently enacted in February 2010. It incorporates consideration of both environmental and social impacts caused by investment projects, and it designed to ensure that prevention and mitigation measures are taken. Chapters one to five in particular refer to the ESIA process, which is outlined in the flowcharts at Annex 2. In short, before signing any Concession agreement or Mining Exploration and Production Agreement (MEPA), before starting any construction work or before any operating permit can be issued, an investor undertaking a project likely to have adverse environmental and social impacts needs to obtain an ECC or a report on ESIA, an EMMP and a Social Management and Monitoring Plan (SMMP)68. All applications are sent to the WREA for consideration and approval. The level of WREA required to review the application is determined by the type/category of project, which is associated with its anticipated impacts (see Annex 3 for a copy of the list of project categories that supports the ESIA Decree). The incorporation of an EMMP into the ESIA is necessary for a range of projects.
Land Law (2003): As specified in Article 10 of the Land Law, the Land Management Authorities are responsible for, among other things, coordinating with concerned sectors and local administrations to plan the use of land, to protect and develop the land, and to define land areas for certain uses. The Law states that the National Land Management Authority (NLMA) can allocate land use rights to lease or grant concessions, and to withdraw the right to land use. Article 13 sets out the right of Lao citizens to ‘lease land from the State for a period not exceeding thirty years’, though this period may be extended depending on each case. The actual determination of the lease period shall be made on the basis of the characteristics and size of the operations requiring use of the land. Article 64 concerns the right of foreign individuals and their organizations conducting lawful activities to lease or receive concessions of land from the State. The period of land lease or concession to foreign individuals who invest in the Lao PDR shall also be based on the characteristics of the intended project but shall not exceed fifty years, with the exception of SEZ developments, which may be used for a period seventy‐five years. The Law also obliges individuals and organizations to ‘protect the land to ensure that it is in a good condition’ and states that land use shall not have a negative impact in the natural or social environment.
Decree on Land Concessions (2009): The Decree on Land Concessions categorized land lease or concessions into short lease periods for living and commercial use of less than five years, medium lease periods for construction, service, tourism or sports use of over five years, and, long lease periods for investments in infrastructure, industry, forestry, mining and other areas 68 Article 13, ESIA Decree (2010).

37
of use for more than 15 yrs. An investor must submit an economic and technical feasibility study, an ESIA report and the business license to the NLMA at either the central or provincial level. The Authority shall exercise their rights to either issue or refuse the concession. If one government authority wants a concession for use of land that is currently under the control of another authority, the NLMA has reported that the authority wanting the concession must send a proposal to the NLMA. After reviewing the proposal, the NLMA will hold mediation between the proposer and the current holder of the concession. They will try to reach an agreement which, if agreed, will most likely result in the proposing authority having to pay some fee for the concession.
Law on Minerals (2008) and Law on Mining (1997): According to Article 31 of the Law on Minerals, an application for investment in the mining sector shall be submitted in accordance with the Law on Enterprise. The Law categorizes investments as either small, medium or large‐scale, and an investor wishing to invest in a large‐scale activity must seek approval from the Committee for the Investigation and Supervision of Large‐scale Investments (appointed by the GoL and comprising the Minister of Energy and Mines, the Vice Provincial Governor and the representatives of the concerned sectors).69 According to MEM, the Committee shall not be formed nor authorized to give their approval or oversee the investment until the documents are passed through and approved by MEM, MPI and finally, the National Assembly. Article 35 states that the investor is required to be technically experienced in the field of minerals, must have the concession to explore and mine the area, and an ESIA report. After receiving approval, the investor is obliged to adhere to the ESIA report. The Law also imposes upon the investor the responsibility to create an environmental protection and restoration plan and adhere to this, so as to avoid any negative impacts. The investor shall be wholly responsible for any damage he or she does cause. The investor is also obliged to contribute to the fund for environmental protection. With regards to exploration, Article 23 of the Law states that persons or organizations intending to conduct mining operations shall apply for licenses to conduct mineral prospecting and data gathering. When information is sufficient, exploration shall be authorized by the GoL. If there is an intention to conduct exploitation, feasibility studies and an EIA must be undertaken simultaneously for grant of a Concession. Regarding operations, the feasibility study for obtaining a license to conduct mining operations shall include the plans and processes for mineral exploitation and the socio‐economic effectiveness of mineral exploitation.
Agriculture Law (1998): The Law on Agriculture states that all individuals and organizations intending to use land for agricultural production must seek approval from the State in accordance with Chapter 2 of the Land Law, who may also grant a lease or concession of land for such use. Article 46 of the Agriculture Law refers to investment in agricultural activities such
69 Article 48, Law on Minerals (2008).

38
as ‘investment in cultivation, animal husbandry and fishery to undertake agricultural production or agricultural business’. The law states that the Ministry of Agriculture and Forestry (MAF) shall be responsible for agricultural investment activities and ‘cooperate with foreign parties in agricultural development’70, determining the scale of production and business in coordination with the CPMI71. Regarding environmental protection, Article 6 imposes the obligation upon individuals and organizations undertaking agricultural production to protect the environment.
The Management of Fertilizers Regulation (1503/MAF 2000): There is little under this regulation regarding investment approval processes; however it does refer to requirement of all persons engaged in the production, sale, import and export of fertilizers to apply for registration of the fertilizer. In particular, Article 12 states that the applicant for registration of fertilizer must provide information, including but not limited to the ingredients, nutrients contained, place of production, analysis method, report of analysis, guidelines for use and a sample of the product. Anyone wishing to produce, sell, import or export fertilizers must also have a license.72 This person must be the owner of the business, have an office or residence in Lao PDR and a place for production or sale. Anyone possessing such license shall display it publicly and ensure that each time the fertilizer is produced that it will be subject to analysis before public distribution.73 According to Article 6 of the Regulation, persons shall be prohibited from the sale, possession, import or export of fertilizers that are counterfeit, unregistered or suspended, do not meet regulation standards and are considered to be a toxic combination.
Regulation on the Use of Insecticides (1578/MAF 2000): This regulation states that anyone wishing to invest in the insecticide industry must submit an application for investment in accordance with the Law on Enterprise. According to Article 6, any person wishing to import, export or sell the pesticide must inform the relevant plantation sector three days prior to the import or export and twenty days prior to the sale of the pesticide. Pesticides for the purpose of import, export, sale and production must also be registered. Those who sell insecticides are also responsible for ensuring that safety measures are upheld and any risks to humans, animals and the environment are reduced.74 The seller shall be held responsible if he or she fails to do so.75 Please see Annex 4 for lists of allowed and prohibited fertilizers and pesticides in Lao PDR.
Law on Forestry (2007): This law defines various ‘Forest Categories’, within which only certain activities may be conducted. In relation to the utilization of forest or forest products for
70 Article 70, Law on Agriculture (1998). 71 As this is inconsistent with the committees referred to in the LIP 2009, we can assume that MAF shall collaborate with either the Committees of the P&I or the I&T sectors, whether at the central or provincial level. 72 Article 23, Management of Fertilizers Regulation. 73 Article 29, Management of Fertilizers Regulation (1503/MAF 2000). 74 Article 9, Regulation on the Use of Insecticides (1578/MAF 2000). 75 Article 9, Regulation on the Use of Insecticides (1578/MAF 2000).

39
business operations, Article 43 defines distinct uses, including the use of forest for tourism, recreational sites, and logging and harvesting forest or forest products for commercial purposes, and specifies which ‘Forest Category’ each ‘use’ may be conducted within. According to Article 45, an investor wishing to engage in ‘business operations in the forest’ must seek approval from the Forest sector and register the enterprise in accordance with the Law on Enterprise. As per Article 39, all persons or organizations utilizing forests for business purposes ‘shall avoid causing any negative impacts to forest and forest production areas, nature, the environment and society’. Chapter Four on the Law of Forestry also considers the utilization of forestland for business operations in relation to degraded forestland where forests cannot be naturally generated and barren forestland which are so designated.76
Water and Water Resources Law (1996): The GoL is responsible for the prevention of adverse impacts from water and all acts that cause the depletion of water.77 Water and water resources must be managed and used according to centralized, comprehensive and integrated management principles and according to the ‘allocation plan’78, which gives individuals, legal entities and organizations the right to use water and water resources.79 The Law states that there are three levels of right to water use, ‘small‐scale’, ‘medium‐scale use’ and ‘large‐scale use’, but only medium and large‐scale use of water requires approval, registration and/or a contract80. The Law does not specifically state where and from whom the investor must seek approval and registration; however according to WREA, they are currently in the process of drafting new legislation which will address this issue. If a contract is required, the investor must enter into contract with the sector to which the investment relates. For example, if one wishes to invest in a large‐scale water usage investment such as building a dam, the investor must first contact the MPI and submit their application for investment. The MPI will then contact the Department of Electricity (of the Ministry of Energy and Mines, MEM) for consideration and approval and finally, to the WREA for their recommendation. Large‐scale use must also be accompanied by a feasibility study, an ESIA, and detailed measures to deal with the impacts. Article 22 goes on to say that water source development activities must comply with ‘socioeconomic and environmental development plans, the master plan, periodic development plans of each sector, and the construction plan for each approved project’. It
76 Article 69, Law on Forestry (2007). 77 Article 5, Environmental Protection Law (1999). 78 Article 6, Environmental Protection Law (1999). 79 Article 18, Environmental Protection Law (1999). 80 Large scale water use is defined at Article 17 as the use of water and water resources for the purposes of ‘ (a) constructing medium and large‐scale reservoirs for the purpose of irrigation, consumption and use, and to produce electrical power; (b) constructing buildings or installing plants, factories, equipment or large scale machinery, within the water source area, or close to or surrounding the water source area; and (c) the use of water and water resources in large volumes in the field of industrial plant production’.

40
must also ensure the preservation of water and the environment and must prevent adverse impact to the environment.
National Policy on Environmental and Social Sustainability of the Hydropower Sector (2006): This Policy acknowledges that hydropower development must be sustainable, if its development has potential to deliver lasting benefits to Lao PDR. The regulations set out a number of obligations upon investors. All large hydropower projects (with an installed capacity of over 50MW or inundating more than 10,000 hectares of land) must produce a full EIA report and EMMP in accordance with Lao laws and regulations. The EIA will include a comprehensive risk analysis over the entire life‐span of the project, an analysis of alternatives for project structure and location, including the no‐project alternative, lessons learned from previous projects and a sub‐basin cumulative impact analysis. The EMMP will include a strategy for avoiding or mitigating impacts and risks, as well as cost estimates, sources of funding and an implementation schedule. This strategy, according to the MEM, shall be overseen by WREA. All reports will be subject to public disclosure.
3.2 Key actors in investment approval and management system at provincial level
This section focuses on examining the capacities of agencies related directly to investments, including the Saravan PDPI, WREO, PLMA and other provincial departments engaged in investment approval and management.
Provincial Department of Planning and Investment (PDPI): is one of the key departments involved in investment approval and management. Based on its role and function, the department is divided into seven divisions, including divisions for administration, investment management, planning, evaluation, statistics, international cooperation, and inspection. The department has a coordination network extending down to the district level and a total of 53 staff, 11 of whom are women. Three of them have master’s degrees, four have completed up to a bachelor’s degree; 15 of them have completed high school; and the remaining 31 have completed vocational school. Of the staff, 27 work at the provincial level while the remaining 26 are engaged in the eight districts of the province. In addition, there are 29 temporary staff (including eight women). 17 of these temporary employees work at the provincial level and the remaining 12 work at the district level. They are mostly hired through funding for specific projects that DPI works on with donor organizations.
The majority of PDPI staff has an educational background in economic planning, economics, administration, management, finance, banking, social sciences, law, and English. With regard to its personnel resources and capacity, the PDPI seems to have a variety of skills which are necessary for social‐economic planning development. However, according to focus group discussions, the department still lacks personnel resources both quantitatively and

41
qualitatively. The participants stated that the department needs at least one more full‐time staff members, and he the quality of the personnel needs to be improved, especially their IT skills, English skills, and their knowledge of statistics, planning, and management. In addition, the department also needs more of the equipment necessary to do their work. The focus group explained that the PDPI does not have sufficient computers, printers, vehicles, office supplies, etc. The most important issue is the current lack of budget for monitoring and evaluating the approved projects.
Provincial Water Resources and Environment Office (WREO): the Saravan WREO was established in 2007 when the environment section of the Science Technology and Environment Agency separated from the rest of the agency. The environment section was turned into WREO and the meteorology division of the Saravan PAFO was included in this office. The provincial WREO plays an important role in investment approval and management processes, especially in regards to managing social and environmental impacts. Beyond having a representative in the investment committee at the provincial level, WREO is also obligated to conduct initial environmental examinations (IEEs) and to issue environmental compliance certificates (ECCs). For smaller scale projects, WREO may also conduct Environmental and Social Impacts Assessments (ESIAs). Without an environmental certificate issued by WREA (central or provincial), no investment project can be legally approved. Therefore, WREA takes a deciding position in the investment approval and management process.
However, this provincial office is still a new office and has limitations in its personnel recourses and capacity. Currently, the office is only able to conduct initial environmental examinations (IEE), which are used for assessing small scale investment projects, which do not have high social and environmental risks. The WREA at central level still takes responsibly for conducting and/or reviewing all ESIAs and issuing the ECC for large‐scale investment projects, which have higher social and environmental risks.
Currently, the Saravan WREO has a total of only 19 staff; 14 are permanent staff, including four women. Only one of them has completed a master’s degree; two have completed up to their bachelor’s degree; one of them has education background at high school level and the remaining 10 of them have completed vocational school. Most of these officers have an education background in areas such meteorology, transportation, forestry, English, literature, etc, which may be only tangentially related to environmental management. None have completed a comprehensive environmental study. This office includes four sectors, namely, administration, environment, water resources and meteorology. The office is limited by its personal resource, coordination network including the Office has no vertical coordination network at district level and horizontal coordination network at its partner departments including PIPD, the Provincial Department for Industry and Commerce, PAFO, etc. The Office has also no sufficient equipments and lack of budget, especially the lack of budget for

42
monitoring, observing and controlling social and environmental impacts of approved investment projects. In terms of equipment, one of their biggest limitations is their lack of materials for assessing impacts. At present, only the central level WREO has laboratory equipment for checking water quality and potential contamination. The Saravan WREO also does not have enough funding to cover the travel costs associated with monitoring projects throughout the province. In addition, they are not currently coordinating their work with the PLMA nor DPI which is problematic since their work is so interconnected.
According to focus group discussions during this study, Saravan WREO has never received any budget for assessment of social and environment impacts. They only perform this task in very serious cases and often respond by simply deferring to the central WREA. The current WREO operations emphasize disseminating the environmental laws in order to motivate and create awareness about environmental responsibility. However, the office still contributes to biodiversity conservation, waste management and environmental management, including working with factories. For example, they will work with individual factories to help them find ways to better manage their waste. However, WREO will not methodically monitor the operations of all factories in the province. Although PAFO is the lead agency in this area, WREO also takes part in workshops hosted by other offices on biodiversity conservation and helps to allocate provincial protected areas and biodiversity areas. However, they do not have the resources to carry out a biodiversity assessment, for example, in the field.
Provincial Land Management Office (PLMO): is an important agency in investment approval and management, which was established in 2007, as part of the Provincial Department of Finance. The PLMO has the same status as a provincial department and represents the provincial authority in land allocation, collecting revenue from land concessions, and issuing land certificates as part of a land titling project (which is sponsored by the World Bank). Saravan PLMO has five divisions, including: (1) the management office; (2) land control and registration office; (3) arbitration office; (4) information service office; and (5) land planning development office. In cooperation with other departments, the authority is responsible mainly for land use planning and allocation (agriculture land, mining zone, industrial zone, residential areas, etc.) Under the structure set out by NLMA at the central level, the concerned departments allocate land in accordance with their mandate. For example, PAFO is obligated to allocate agriculture land and forestry areas; the PDIC allocates industrial zones, border trade areas, and so on.
Currently, the PLMO has a total of 191 staffs, including staff at the village level and khum ban level (at these levels, staff are not paid through the government budget, but rather PLMO is responsible for covering their salaries). In comparison with other departments, the PLMA has very large number of staffs because it has to send its staffs to collect land fees for government at the village and community level. Of the 191 staff, 41 are women; only one has completed a

43
master’s degree; eight of them have completed up to a bachelor’s degree; 36 have completed their schooling through 4 years of college; 144 have completed up to vocational school level; and the two remaining have finished neither high school nor vocational school. Of the 191 staff, 57 of them work at the provincial level (including 14 women and 23 government officers)81 and 135 work at the district level (including 27 women and 24 government officers). A large share of the staff have studied finance, mathematics, forestry, irrigation, agriculture, transportation, teaching and other areas, which may be able to support working in this area. However, this office still lacks personnel resources, as the most of the staff are young without sufficient experiences in land allocation and management. For example, some of the skills required that are currently missing include mapping skills, knowledge of GIS and GPS, and IT skills. Moreover, the office has a limited budget and lacks necessary equipment, such as GPS units, computers, and mapping software. In the past, the central government (the old LMA based in the Prime Minister’s Office) did land allocation and managed concessions for the whole country. Now, the provincial offices are supposed to take over these tasks, but they don’t have the money, equipment or human resources to do so.
Due to its recent establishment and the capacity constraints mentioned above, land allocation in Saravan province is just starting and is making slow progress. In this instance, land allocation refers to a process where PLMO allocates land to each sector (such as PAFO and PDIC), which in turn allocate the land they are responsible for in a more detailed and concrete fashion. For example, PAFO would then carry out a land‐forest allocation. Currently, the PLMO has just completed land allocation in Taoy District as a pilot project. The remaining area of the province has not yet been allocated.
Provincial Agriculture and Forestry Office (PAFO): The Saravan PAFO consists of seven sectors, two units, one center and eight district offices. PAFO has a total of 359 staffs, of which 59 are women. Of the 152 staffs who work at the provincial level, 32 are women. In terms of educational attainment: five of them have completed master’s degrees; 19 have completed bachelor’s degrees; 90 have completed four year college degrees ; 200 have completed three years at vocational/technical schools ; and 35 did 1‐2 years of technical school. In addition, there are temporary staff who are contracted through projects and employed at the district level.
According to the focus group discussion with PAFO, although the Department has many staff, it still needs additional personnel resources, both quantitatively and qualitatively. The focus group mentioned that PAFO will need at least 170 more staff members in the next five years to achieve agriculture development goals. The additional staff should be qualified and have experience in technical areas including irrigation, agriculture and livestock production and industrial crop plantation, as well as in research, monitoring and development areas. 81 Meaning those staff paid through the government budget and thus called “government officers”.

44
Other relevant departments: Other departments are involved in the investment approval and management process, depending on the investment project concerned. For example, PAFO is a key actor in approving and managing investment projects in the agriculture and forestry sector. The PDIC is a key actor in approving and managing investment projects in the industry and commerce sector. The Provincial Department for Electricity and Mining (PDEM) plays key role in approving and managing investment projects in electricity and mining sector, and the Provincial Tourism Office is the main actor in approving and managing investment projects related to tourism.
Based on findings from focus group discussions during the study, the Saravan provincial departments all share similar capacity limitations and constraints, including (1) in personnel resources, especially a lack of highly qualified staff with relevant experience; (2) in necessary equipment and (3) most importantly, a lack of budget, particularly for monitoring, controlling and evaluating activities.
3.3. Investment approval and management procedure
The central government and local authorities (provincial authorities) share responsibility for investment approval and management, depending on the size and scope of the investments in question. The following section sets out the procedures for the submission of investment proposals, their consideration, and their approval or rejection. This will focus on the implementation of procedures at the provincial level, and Saravan in particular.
The exact conditions determining whether an application is to be submitted to the central or provincial level is still yet to be set out by the Draft Decree 2009. However, these determinations will most likely be similar to those of the Investment Decree 2005. This specifies that the local/provincial level shall be responsible for approving investment activities that are82:
Undertaken in the Capital City, Savannakhet, Champassak or Luang Prabang provinces, falling within the list of what is called the ‘first category’ (meaning activities open to foreign investment and contained within the promotion list which
82 In addition to the Investment Decree 2005, the Agreement Number 0509/MPI on Role and Function of IPD, dated on June 11, 2008, states that the central IPD is responsible to process and approve investment projects having investment capital exceeding USD 10 million. However, Saravan IIPD confirms that Savannakhet Province is allowed to process and approve investment projects having investment capital equal to or less than USD 5 million. This contradiction between the documents is confusing and further impairs cooperation between central and provincial IPDs.

45
are prescribed to accept investment)83 and having an investment value less than US$5,000,000; or
Undertaken outside of these four provinces aforementioned, also falling within the first category, but with an investment value of less than US$3,000,000.
Concessions that seek to use more than 100 ha of land but less than 1000 ha of land
The central level shall be responsible for decisions regarding the approval of investment projects that are:
Of the first, second or third categories84 that have an investment value no more than USD20,000,000).
Applications for activities above this threshold (and that fall within the third category) must be submitted to the GoL for approval85. Both the Draft Decree 2009 and the LIP 2009 state that for the foreign investor investing in general activities, the registered capital of the investment project must not exceed one billion kip.86
The central and provincial authorities have the same mechanism and procedures for considering and approving investment projects. At the central level, the Committee for Promoting and Managing Investment (CPMI) is the main investment body, coordinated by MPI at the central level. A version of this committee is also formed at the provincial level. The PDIC is coordinator of the provincial CPMI (hereafter PCPMI) the Vice‐Governor, who is responsible for economic development, is the chairman and all provincial departments delegate members to the committee.87
Investors, domestic or foreign, wanting to invest in Lao PDR are required to fill out an “investment permit form” and submit it to CPMI or PCPMI, depending on the size and sector of the proposed project. The application is purchased at the MPI in Vientiane and in PDPIs. After the investor has submitted an application to MPI or to PDPI, the ministry or department
83 Article 23, Decree for the Implementation of the Law on the Promotion of Foreign Investment (2005). In addition to the first category, there are also second and third categories of ‘Activities Open to Investment’. The second category is defined at Article 24 as those investment activities which the GoL is open to accept but subject to conditions based on the consideration of investment approval and the special characteristics, regulations and laws of the concerned sector. The third category is defined at Article 25 as those activities requiring a grant of concession rights from the GoL, whether for general, mineral resource or energy resource activities. 84 For example, projects that involve investment in the electricity, mining and telecommunication sectors, which are considered strategic sectors and reserved for public investment 85 The Decree does not state which department or office of the GoL can provide this approval. 86 Article 17, Law on Investment Promotion (2009), reiterated at Article 32 of the Draft Decree on the Law on Investment Promotion (2009). 87 There is no CPMI at the district level. Districts are not mandated to approve and manage investment projects; they only manage small scale household investments which do not need complicated committee approval processes.

46
disseminates the application to all ministries or provincial departments that are members of CPMI or PCPMI88 for their consideration.
Normally, the CPMI or PCPMI organizes weekly consultation meetings to discuss and decide whether or not to support the proposed project. If necessary, the CPMI or PCPMI can also organize irregular meetings. All members of CPMI or PCPMI are invited to the meeting. The committee coordinator, MPI or PDPI, summarizes the outcome of the meeting for reporting and in order to seek approval from GoL or the provincial government in the event that CPMI or PCPMI supports the proposed project. In the event that CPMI or PCPMI do not agree with the project, MPI or PDPI will return the application and meeting notes to the investor, should they wish to improve their project proposal for further consideration.
The investment approval process usually has two different phases. The first phase is approval for investigation and more detailed project design, while the second phase is approval for project implementation. According to focus group discussions in Savannakhet Province, the atmosphere in each phase is very different. For approval of investigation and approval to begin detailed project design, the consideration in the meeting is not very serious. The PCPMI do not require the project owner to submit a detailed investment plan or a formal environmental certificate issued by WREO at this stage. However, in the second phase of approval for project implementation, the meeting atmosphere is more serious. The project developer is required to submit a detailed investment plan, including a formal ECC.89 (Annex 2 shows procedures for obtaining an ECC step‐by‐step).
The LIP 2009 also provides a general timeline for the consideration of applications. Article 18 states that the procedures and timeframe for considering enterprise registration relating to General Activities (that are not listed as controlled businesses, i.e. on the negative list), the business license shall be issued within ten working days. In the case of controlled businesses, the enterprise registration certificate shall be issued within thirteen working days, as defined in the Enterprise Law. If an investor wishes to expand an existing business, consideration is expected to take less time than for a new investment.
A number of procedures also apply to applications for concessions. ‘Concession’ refers to when the State allows use of the land and/or resource use rights and other rights of the State for the purpose of undertaking business operations. Land use rights may also be afforded to foreign (non‐concession) investments above USD500,000 for the duration of the investment activity, as an investment incentive90. All Concession Activities in Lao PDR require a Concession License, which includes the Business Registration Certificate, the Investment Authorization, the
88 The PCPMI has same structure as CPMI at central level. All provincial departments have their representative in the committee, including PDPI, PDIC, WREO, PAFO, PLMO, etc. 89 Focus group discussions. 90 Article 58, Law on Investment Promotion (2009).

47
Promotion Policy, the Tax Registration Certificate and the authorization to undertake the activities from the concerned sector.
According to Article 16 of the Draft Investment Decree, the Committee Planning and Investment for assessing concessions comprises of representatives from the Planning and Investment sector, Energy and Mining Sector, Finance Sector, Industry and Commerce Sector, Water, Resources and Environment sector, the Land sector, Agriculture and Forestry sector, Education sector and other sectors in which investors may wish to invest. The Chairman at the central level shall be the Minster of the MPI, and the Chairman of the Provincial Committee will be appointed by the central Chairman (i.e. the Minister of the MPI). Generally, the Chairman of the Provincial Committee shall be the Governor.
For Concession Activities, an investor shall prepare the documents and submit the application to the OSS of MPI at the correct level, for screening by the committee, before being submitted to the central government or to the provincial government for consideration.91 According to the LIP 2009 and the Draft Decree, an application must also be accompanied by an economic and technical feasibility report, an ESIA, and a list of vehicles, equipment and raw materials used in production.92 However, it should be noted that the MoU between an investor and IPD also allows the investor to carry out the feasibility study and ESIA, which are then reviewed and renegotiated before actual implementation of the investment. As is the situation for general business activities, the Draft Decree 2009 is still silent as to which level applications for concession investments are to be filed at and thus considered. However, these will most likely be similar those specified in the Decree 2005 (100‐1,000 ha at the provincial level; 1,000‐10,000 ha at the national level; more than 10,000 ha requires scrutiny by the National Assembly).
Applications for concession investments are decided upon on ‘a case‐by‐case basis by using different methods, such as comparison, bidding or evaluation’.93 The Investment Committee of the P&I sector will first look to whether or not the concession activity is on the list of promoted and non‐promoted concession activities (which is still to be finalized within the Draft Decree 2009). If the application meets all requirements and the Committee decides in the affirmative, they shall begin negotiating and drafting the initial Agreement or Memorandum of Understanding (MoU), in conjunction with other line ministries. The outcomes of the negotiation shall be taken to the weekly meeting of the P&I sector, which is organized by the department’s OSS, for further consideration, followed by the submission of the proposal to the central government or provincial government, which will make the ultimate decision as to the
91 Article 21, Law on Investment Promotion (2009). 92 Article 23, Law on Investment Promotion (2009), reiterated in Article 34, Draft Decree on the Law on Investment Promotion (2009). 93 Article 22, Law on Investment Promotion (2009).

48
issuance of the Concession license. When the investment committee cannot reach a consensus, they will seek further comment from the concerned sector.
At the time of submitting the proposals to the Government or to the provincial administrative organization for a decision, the investor is to deposit a project guaranty fund in accordance with the regulation and based on the type and size of the investment. This guaranty fund shall be deposited to the account of the National Treasury and shall be refunded after the project has commenced operation.94 After the approval from the GoL, an official notice must be sent to the investor within two working days from the approval requesting that the investor also sign the MoU. The investor must respond within ten working days from the date of receiving the request and failing to do so shall result in the concession being terminated. The same will occur if the investor does respond but fails to finalize the negotiation or sign the MoU within thirty working days.95 Upon receiving the Concession License, the investor must transfer the registered capital into a commercial bank registered in Lao PDR and obtain the bank transfer as proof of the deposit.96 The investor may then begin undertaking the proposed business activities within ninety days of having received the license.97 Failing to do so shall result in the issuance of a written notification of warning by the P&I sector. If the investor has still not commenced the proposed activities within six days of having received the warning, the concession license shall be withdrawn and the guaranty fund shall become property of the State.98
As shown above, Lao PDR has a relatively comprehensive investment management framework, involving numerous, interacting laws and regulations as well as government departments and agencies. During this study and a concurrent assessment of the capacity of the Investment Promotion Department at the central level, several key issues regarding the function of the investment management system were evident:
There are still a number of gaps in the regulatory framework that should provide the basis for MPI and other departments at the central and local levels to successfully promote and manage investments. The findings from case studies in Savannakhet and Saravan provinces indicate that the laws and regulations still have some gaps and weak points, which are liable to be misused. For example, clearing “primary” and “secondary” forest for agriculture production purposes is forbidden, especially for plantations. However, the lack of a concrete definition what exactly “secondary “or “degraded”
94 Article 23, Law on Investment Promotion (2009). 95 Article 37, Draft Decree on the Law on Investment Promotion (2009). 96 Article 38, Draft Decree on the Law on Investment Promotion (2009). 97 Article 25, Law on Investment Promotion (2009), reiterated in Article 39 of the Draft Decree on the Law on Investment Promotion (2009). 98 Article 25, Law on Investment Promotion (2009).

49
forests are allows clearing of forest to continue99. Furthermore, during the focus group discussions in IPD and PDPI, the team observed that many IPD staff do not understand the regulations and laws very well, and confusion remains regarding the division of labour between the central and provincial levels.
Coordination between the many agencies that play a formal part in investment approval and management at both the central and local levels is difficult. This is partly due to the fact that all the departments who participated in this study have insufficient capacity, in terms of staff and budget, to carry out their mandated tasks. In addition, the short timeframes indicated under the new law are aimed at easing the requirements for setting up new businesses in Lao PDR, but also place a new onus on Investment Committees, Investment and Planning officials, and the other departments who must comment on investment proposals.
As noted above, all the departments consulted during this study have shortfalls in capacity. As well as insufficient staff numbers, the staff they have often have insufficient experience of expertise, particularly in technical areas such as the assessment of social and environment impacts. The departments charged with monitoring and evaluation of investment projects also lack the budget and equipment necessary to meet this obligation.
Based on the findings outlined above, the Saravan Province investment management system, particularly its coordination between different levels, agencies and local communities, needs to be improved in order to effectively approve, manage and monitor investments so as to limit negative social and environmental impacts and ensure sustainable development.
3.4 Data on Investments and Concessions in Saravan Province
3.4.1 Overview of investment
Due to its geographical location and favorable climate, Saravan Province has proven attractive for domestic and foreign investments in agriculture, forestry and tree plantations in particular. According to Saravan PDPI100, there were 411 projects in the province worth LAK 1,174.27 billion between 2006 and 2010. A selection of key investments are detailed in Annex 5. Of that, LAK 664.47 billion were public investments, representing about 56.59% of total investment; LAK 509.8 billion were private investment, including both domestic and overseas investors (and
99 Focus group discussion during the case studies in Savannakhet and Saravan provinces indicated that the gaps in the Forestry Law allow it to be misused. Large forest areas (including primary and secondary forest) have been converted into sugarcane and rubber plantations. 100 Saravan PDPI. 2010. Report on implementing 6th Five Year Plan, 2006‐2010 (Draft). This figure is the cumulative number of projects in this period.

50
joint ventures between domestic and oversea private investors), representing 43.41%. More detail is provided in Figure 5.
Figure 5: Proportion of investment in Saravan Province, 2006‐2009.
Public Investment 43.79%
Private domestic, joint venture and
FDI, 23.70%
Household investment, 19.71%
Investment of SOE, 12.80%
Public expenditure refers to investments coming from the government budget, including internal and international capital, and overseas development assistance (ODA) in various sectors, which adds up to LAK 512.2 billion, representing 43.79% of total investment in the province. LAK 150.27 billion is invested through state enterprise, representing about 12.8% of total investment. The private investments detailed above include domestic and overseas investment, joint ventures and household investments. The private domestic, joint venture and foreign investment accounts LAK 278.35 billion, presenting about 23.7% of total investment in Saravan province during the period from 2006‐09 while household investments account for about LAK 231.45 billion, representing about 19.71% of total investment during the same period.101
In general, the provincial authorities pay close attention to all private national and international investments and the joint venture investments, in order to facilitate and provide a high quality service to investors to in turn increase investment in the province. There is less domestic than overseas private investment, and large land concessions tend to go to overseas investors. However, it is important to note that household investors, who normally attract little attention, in fact account for a significant share of investment in the province. Figure 7 shows the split between domestic and overseas investments and figure 8 tracks the change in total amounts of FDI and joint venture investments over time. Clearly, the amounts of FDI and joint venture 101 Saravan PDPI. 2010. Report on Five Year Plan, 2006‐2010. This report defines “household investment” as investment from local people in Saravan province excluding domestic investors, businessmen, public investment and foreign direct investment.
Source: Saravan PDPI. 2010. Report on implementing 6th Five Year Plan, 2006‐2010 (Draft).

51
investments in Saravan varies greatly year‐to‐year. A similar phenomena can be seen in the statistics on total investment in neighboring Savannakhet Province. Although this has not been analyzed in detail, it is potentially due to a number of factors: for example, the impacts of the global financial crisis, and large investment projects been approved in certain years. Due to constraints in the province’s monitoring systems, the actual amounts flowing from private domestic investment, especially small‐scale investment by private households, are not available. The above share of investment attributed to households is an estimate.102
Figure 6: Private domestic and overseas investment in Saravan Province, 1999‐2010 (%)
It is estimated that domestic investment (referring to private domestic investment) in Saravan Province since 1999‐2010 accounts for only 24% of all private investment and foreign investment (including joint ventures) contributes to 76% of total private investment.103
More than half (52%) of the domestic and foreign investments in the province are in the agriculture and forestry sector. Although in terms of the proportion of its contribution to provincial GDP, the agriculture and forestry sector is declining, this is simply because it is not growing as quickly as the industry and service sectors. However, when looking at the share of investment projects in this sector, it is clear that agriculture and forestry is the most popular area for investment in Saravan Province. More detail is provided in Figure 7. (It is also important to note that because government agencies collect data on agriculture and forestry as a combined sector, it is very difficult to understand trends in forestry as distinct from agriculture).
102 Estimate provided by Saravan PDPI in 7th Five Year Plan (2011‐2015) [Draft]. 103 Saravan PDPI. 2010. Report on Five Year Plan, 2006‐2010.
Source: Saravan PDPI. 2010. Investment data sheets.

52
Figure 7: Private Domestic and foreign investment in Saravan Province, by sector, 1999‐2010
Figure 8: FDI and Joint venture investment in Saravan Province, 2004‐2010
Source: Saravan PDPI. 2010. Investment data sheets.

53
3.4.2. Foreign direct investment (FDI)
The total FDI in Saravan Province from 1999‐2010 was LAK 632,728.29 billion (USD 75.24 million), corresponding to only 1% of the total FDI approved in all of Lao PDR during the same period. This shows that to date, the infrastructure and investment opportunities in Saravan Province have not been attractive enough to domestic and foreign investors to bring in large amounts of investment compared to other provinces and locations. As the figure above shows, 52% percent of private investment (which is dominated by FDI) is concentrated in the agriculture and forestry sector; about 43.8% is in the industrial sector and only 0.2% of investment is in the service sector. The small amount of investment in the service sector may be as a result of the lack of tourism, trade, and transportation infrastructure.
Despite the fact that Investment in Saravan only accounts for a small percentage of investment in Lao PDR as a whole, for the province, it has experienced a substantial increase in investment over the last decade. The biggest share of the investment comes from China which invests in industrial plantations, a concrete factory, the pharmacy industry, and setting up a telecommunications network. From 1999‐2010, the total investment flow from China was LAK 231.2 billion, representing about 38% of total FDI in Saravan Province, followed by the Vietnamese investment of LAK 192.84 billion (31 %). Investment from Thailand and Japan contribute 21% and 9% to total FDI flows into Saravan Province during 1999‐2010 respectively (please see more detail in Figure 8.
Figure 9: Share of FDI in Saravan Province, by source country, 1999‐2010
China, 38%
Vietnam, 31%
Japan, 9%
Thailand, 21%
Other, 1%
Investments in the agriculture and forestry sector include wood processing factories, industrial tree plantations (e.g. rubber and eucalyptus), other plantations (such as jatropha) and some processing facilities. In the last 2‐3 years, two agriculture processing projects have started
Source: Saravan PDPI. 2010. Investment data sheets.
54
namely a cassava powder factory (Vietnamese invested) in Laongam District and a dried wheat factory also in Laongam District (Lao‐Thai invested).104
There is little information available regarding the impacts of these investments beyond the total amounts, sources, destination sectors and the macro‐economic data provided above. This is partly due to limitations in the monitoring system for investments, as well as the lack of publicly available information on individual investment projects. It is therefore difficult to form an accurate picture of the direct and quantitative impacts associated with investments in the province, such as the number of jobs created, the demand for natural resources, or biodiversity loss. However, to summarize the information above, the substantial increase in investment flows into the province has occurred at the same time as a period of rapid economic growth, some improvement of socio‐economic development indicators, increased migration, losses in forest cover and quality, a shift away from traditional subsistence agriculture, and growing concerns in communities about declining natural resources.
4. Agricultural production in Saravan Province
4.1 Overview
The agriculture and forestry sector, although not growing as fast as other sectors in the province, remains its most important sector for employment, income generation and livelihoods. Moreover, as mentioned above, agriculture in Saravan also helps to support food security in the nearby provinces of Sekong and Attapeu. In fiscal year 2009‐10, the sector contributed to about 54% of Saravan province’s GDP. The following section will describe the three main production modes in the agriculture and forestry sector in Saravan Province.
4.1.1 Subsistence agriculture and small‐scale commercial production
Subsistence agriculture and small‐scale commercial production covers a large area of Saravan Province and is still the main economic activity and source of livelihood for most of its people. This production mode is concentrated in the flatlands and plateau of Saravan Province and consists of producing diverse crops to both meet food requirements and to meet household needs and sell for extra income. Small farmers use some machines, have limited labor (normally 1‐2 people), and make use of chemical fertilizers and pesticides to increase production.
According to the Saravan PDPI,105 the province has a total rice production area of 78,034 ha, including wet rice, irrigated rice and upland rain‐fed rice production, amounting to 271,667.48 tons (in 2008‐2009) which accounted for 99% of total rice production in the province that year. Wet rice production area makes up 84% of this figure, while the missing 1% is produced
104 Saravan DPI. 2010. Report on Five Year Plan, 2006‐2010 105 Saravan DPI. 2010. Report on Five Year Plan, 2006‐2010.

55
through shifting cultivation. In addition, the province also produces other crops using a small‐scale production mode, such as cassava, corn, coffee, and fruit. Table 10 below shows rice and other crop production areas and productivity in Saravan Province.
Table 9: Area and productivity of rice, industrial crops and tree plantation in Saravan province and Lao PDR as a whole, 2008‐2009
Area (ha) Productivity (t/ha) Total production (t) Description Saravan Province
Whole country
Saravan Province
Whole country
Saravan Province
Whole country
Area of rice fields 78,034 750,780 3.52 3.9 274,916 2,920,800
Area of wet rice fields 65,425 656,471 3.54 3.8 231,492.48 2,468,750
Area of irrigated rice fields
7,100 94,309 4.48 4.8 31,818 452,050
Area of upland rice fields 3,343 Na 2.5 Na 8,357 Na
Area of Industrial plant 33,755.62 65,905 5.13 13.6 173,060.16 894,167
Coffee 18,738 46,758 0.59 0.8 10,991.68 37,252
Cinnamon 1,393 Na 0.2 Na 278.5 Na
Banana 4,588.16 Na 12.5 Na 57,352 Na
Sugarcane 196 19,147 24 44.8 4,704 856,915
Cassava 4,598 Na 18 Na 82,764 Na
Area of Crops 4,242.5 245,490 4.0 5.0 16,970 1,233,540
Peanut 65 19,577 2.73 1.8 177.6 35,163
Water melon 64 Na 16.44 Na 1,052 Na
Yellow beans 75 10,278 3.6 1.6 270 15,989
Cotton 25 2,522 1 0.8 25 2,036
Wheat 639 207,600 4.5 5.5 2,875.5 1,134,386
Tobacco 86 5,513 1.5 8.3 126 45,966
Chili + eggplant 577.46 Na 4.06 Na 2,344.49 Na
Long beans 465 Na 5.13 Na 2,385.45 Na
Cucumber + pumpkin 394 Na 5.48 Na 2,159.12 Na
Sweet potato 47 Na 4.45 Na 209 Na
Other 1,805 Na 2.96 Na 5,342.8 Na
Source: Saravan PAF. 2009. Report on Implementation, 2008‐2009 and Statistical yearbook, 2009.

56
4.1.1 Shifting cultivation
Shifting, or slash and burn, cultivation is the traditional mode of agricultural production and is still practiced in remote areas. It is subsistence agriculture, practiced without modern equipment or techniques, and dependent on natural conditions. It has low productivity, producing an average 1.5 ton/ha of rice in comparison with wet rice production (3.54 ton/ha). Therefore, most people practicing shifting cultivation are still living under the poverty line. Although accounting for a small portion of agriculture in Saravan Province, shifting cultivation still shows an increasing trend. According to Saravan PAFO, shifting cultivation areas have increased from 1,900 ha in 2008 to 2,480 ha in 2009.106 The table below provides more details on shifting cultivation areas, harvests and productivity.
Table 10: Upland rice production in fiscal year 2008‐2009
Item Numbers Total area of shifting cultivation (ha) 2,480 Harvest area (ha) 2,166 Rice produced (ton) 3,249 Productivities (ton/ha) 1.5
Source: Saravan PAFO. 2009. Report on Implementation, 2008‐2009.
4.1.2 Industrialized agricultural production
The agriculture and forestry sector is the main economic sector in Saravan province. To promote the commercialization of the agriculture and forestry sector, the central and provincial governments have put in place policies and regulations to attract domestic and foreign investment, country wide as well as in Saravan Province; these include tax holidays in the early stages of production, export and import facilitation, facilitated land access, etc. The tax holiday may be up to 10 years long if the investment project is located in a rural area.107 During the last decade, Saravan Province has approved many industrial plant plantation projects (e.g. rubber, cassava, wheat and jatropha). Some of the projects are also seeking to establish processing facilities in the province, including:
A second rubber processing factory of (Caosu Dak Lak Rubber Company);
A cassava powder production factory (Hufuco, a Vietnamese company) in Laongam District;
A dried wheat factory (Vansanaxay Company, Lao‐Thai) in Laongam District.
106 Saravan PAFO. 2009. Report on Implementation, 2008‐2009. 107 Law on Investment Promotion (2009).

57
According to the PDPI108, to date, there are 25 industrial plantation projects in Saravan Province; 15 are foreign invested projects and 10 are domestic investments. The major investment companies involving in these projects are: (1) Caosu Dak Lak Rubber Company of Vietnam, with a concession of 7,000 ha; (2) Lao‐Thai Hua Rubber Plantation Company with a 1,000 ha concession; and (3) Golden One, a Chinese company with a 50,000 ha concession for eucalyptus. The total investment capital in plantation sector accounts for about LAK 420.49 billion109, representing 35.76% of total investment in Saravan Province in the period from 2006‐2009.
To date, the total concession area in Saravan province covers 93,410 ha; the biggest share (81%) of the land was conceded by GoL, while 19% of the land was conceded by Saravan provincial authority. However, until recently the national and provincial authorities have only surveyed a total of 75,368 ha, of which 12,102 ha, representing about 13% of conceded area, were successfully surveyed and given to investment companies. Of this successfully surveyed land, companies processed and planted ony 5,626 ha, corresponding to about 6% of the total land conceded.
The data on land concessions indicates that land surveying will be a long process in Saravan Province. Based on concession area, the GoL and Saravan provincial authority need to find and provide land of over 81,308 ha110 (about 87% of total land promised, to investors). The table below provides more detail.
Table 11: Concession areas and productivity
Description
Unit
Concession
area
prom
ised
(ha)
Concession
length
(years)
Surveyed
(ha)
Successfully Surveyed
(ha)
Growing area
(ha)
Prod
uctivity (t/ha)
Rubber ha 25,310 10‐50 20,784 9,050 4,463 NA
Cassava ha 3,000 15‐30 2,781 1,200 530 18
Eucalyptus and acacia ha 63,100 15‐45 49,487 652 471
108 Saravan PDPI: Investment data sheets, 2010. 109 Saravan Provincial Department for Planning and Investment: Investment data sheet, 2010 110 Estimated by total concession land (the land that GOL and Saravan provincial authority promised to give to investors) minus the land that they already surveyed successfully and provided to investors.

58
Jatropha ha 1000 30 1,000 200 NA NA
Medicinal plants ha 1000 30 1,316 1,000 162 NA
Total ha 93,410 75,368 12,102 5,626
Source: Prepared by NERI based on 2009‐2010 land conceded, Saravan PDPI: investment data sheets, 2010.
4.2 Agricultural land and forestry allocation
According to discussions with the related agencies (including PAFO, PDIC, WREO, PLMO and other sectors) in Saravan Province, it is evident that the province does not yet have either proper land use planning in place or an effective system to manage land. However, the Saravan PLMO has allocated land for the two largest types of land use: conservation areas (e.g. NBCAs, Protection, Wetlands) and land use areas (e.g. agriculture, production forest, community land). Map 5 (next page) presents the basic land allocation conducted in Saravan Province so far.
Land use planning in Lao PDR is promoted by the GoL in order to achieve several objectives: encourage permanent commercial agriculture and stabilize shifting cultivation; provide incentives for good land management; and attract investment.111 After the introduction of the new economic mechanisms, the GoL embarked on land‐use planning, allocation and titling programs, often using external support. In the rural areas of the country, land and forest allocation (LFA) was started in 1994 to allocate forestlands to communities and agricultural land to families and individuals, until 2006.112 Badenoch113 notes that LFA generally followed these steps:
First, an agreement is reached between the villagers and the government formally delineating the village lands, as farming land, degraded land, or forest cover. Degraded land is for rehabilitation through plantations and tree crops. Forest is allocated based on the need to protect water resources and provide for non‐timber forest products and other traditional uses. Villagers are required to set aside 5‐10% of their land to accommodate future population growth.
The second step is a forest inventory carried out jointly by the district officials and villagers.
111 Badenoch, Nathan. 1999. Watershed Management and Upland Development in Lao PDR: A Synthesis of Issues and Opportunities. World Resources Institute. 112 Mahaphonh et al. 2007. “Study on Land Conflicts and Conflict Resolution in Lao PDR”. Land Policy Study No. 9, LLTP II. 113 Badenoch, 1999.

59
Key:
: communities : wetland areas : Protection Forests
: National Conservation Forests : Production Forest areas : field/grasslands
: long‐term plantations : mid‐term plantations : short‐term crops
Fruit plantation
Farmers are then issued probationary 3‐year certificates that are confirmed if the land is managed in accordance with the prescribed land use plans.
Map 5: Basic land allocation in Saravan Province
Source: Saravan PLMO
Recently, a land use planning survey in Taoy District was completed, but it is not yet available in map form. This survey was conducted by the central level of NLMA and is considered a pilot project for Saravan provincial land used planning. However, this project has not been repeated in other districts. In other districts, it remains difficult to find suitable land for the large investors requesting concessions while also meeting the needs of local communities. Large

60
investment projects in Saravan Province, such as those examined in the case studies for this report, have shown that in this situation local communities can lose their farmlands as well as access to natural resources, like village forests. The significant role played by the province’s land resources in both attracting investment and supporting the livelihoods of its people indicates that participatory land use planning is advisable to avoid future conflicts.
5. Economic, social and environmental impacts of investment in Saravan Province: summary of case studies
This section will add to the analysis of the economic, social and environmental impacts of investment in Saravan Province presented so far, based on findings from two case studies carried out by the research team in collaboration with provincial departments in the second‐half of 2010. The two case studies were selected by representatives of the provincial departments and are:
Caosu Dak Lak Rubber Company plantations in Laongam District, an investment of $ 9.3
Million with a 7,000 ha concession in Saravan Province; the case study focuses on three villages in the plantation area, Songhong Noi, Songhong Nyai and Vangkhanan villages.
Wood processing factories in Laongam and Saravan districts, focusing on three selected wood processing factories (Vanda, Viengthong Inthasid and Temesangthong factories) and three villages in the surrounding areas: Kasakyai, Khantalad Temesangthong villages.
This section will summarize and analyze the main findings of these case studies. Full reports for each case study are provided at Annex 6 and 7.
5.1. Economic impacts
The two case studies selected for this project, Caosu Dak Lak Rubber Company plantations and three wood processing facilities, have had both positive and negative impacts on the economic situation of people living the case study areas, as well as for the province more broadly. The following section will summarize the economic impacts of the investments before comparing the costs and benefits for the case study areas.
Job creation and other economic opportunities: The investment projects selected for the two case studies provide a direct economic benefit in the form of job creation. The Caosu Dak Lak Rubber Company employs 338 people from the case study area in the plantations: however, only 1.7% of these employees are permanent, full‐time staff, so the majority work as day laborers. The wood industry as a whole in Saravan province employs more than 1600 people, accounting for about 3.5% of non‐agricultural employment in the province. The three factories studied employ between 210‐310 local people, depending on the work available. According to

61
the surveys, 23 people, corresponding to about 1.3% of the total labor force in the case study area, are employed permanently in the wood processing industry. However, most employment in the plantations and in the wood factories remains uneven across villages and uncertain; it is relatively low‐paid, unskilled labour, and is mainly seasonal. It provides a source of additional income but is not reliable enough to form their main economic activity. Thus there has been a gradual and small shift from independent farming to more dependent employment in commercial operations for both case study areas; although still small, the shift represents a new phenomena in the case study areas.
Another positive economic impact from the investment projects is stimulation of investment and employment in associated industries, such as locally‐owned restaurants, shops and food production. The Caosu Dak Lak Rubber Company plantations have not made much contribution in stimulating this kind of associated investment, but the wood processing factories have stimulated investment in related sectors including restaurants, bars, and trade shops, and provided opportunities for farming families, who produce and provide food to the factories. According to the surveys, there are around 20 such small‐scale, household businesses that have been established around the three factories. The total investment value of these supporting business activities is estimated to be around LAK 255 million (or around USD 30,000) and they employ more than 30 people.
Community development: In addition to employment benefits such as those described above, the Caosu Dak Lak Rubber Company has also invested substantially in developing local infrastructure and services in the case study area. In the case study area, around Farm No. 2, the company has built roads, an electricity network, schools and a health care center, worth more than LAK 1.2 billion. However, the wood processing factories were found to have made little to no contribution to community development in this respect.
Contribution to government revenue: Investment projects also contribute to government budgets through concession fees, taxes and, in some cases, dividends paid to the GoL as a shareholder. For the two case studies selected in Saravan Province, the contribution to government revenues remains unclear. Both Caosu Dak Lak Rubber Company and the wood processing companies did not provide information on taxes/fees paid to government. In addition, the wood companies were unable to provide details of their annual earnings or taxes paid.
Loss of income from NTFPs and livestock production: The investment projects studied have also had a number of negative economic impacts, particularly at the local level. These center on the loss and degradation of natural resources, which in the Lao context, negatively affects local communities who depend on such resources for their livelihoods. For both case studies, villagers reported a loss of income from NTFP collection, timber cutting and/or livestock farming attributed to the impacts of the investment projects. In the case of the rubber
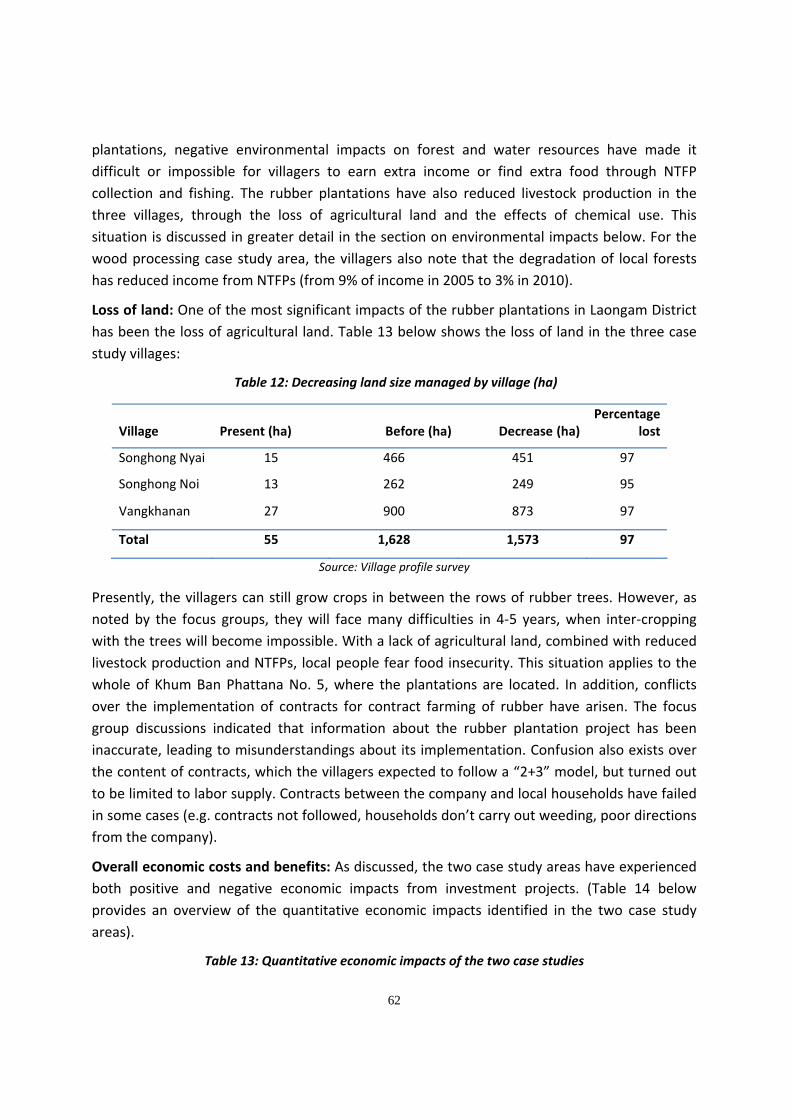
62
plantations, negative environmental impacts on forest and water resources have made it difficult or impossible for villagers to earn extra income or find extra food through NTFP collection and fishing. The rubber plantations have also reduced livestock production in the three villages, through the loss of agricultural land and the effects of chemical use. This situation is discussed in greater detail in the section on environmental impacts below. For the wood processing case study area, the villagers also note that the degradation of local forests has reduced income from NTFPs (from 9% of income in 2005 to 3% in 2010).
Loss of land: One of the most significant impacts of the rubber plantations in Laongam District has been the loss of agricultural land. Table 13 below shows the loss of land in the three case study villages:
Table 12: Decreasing land size managed by village (ha)
Village Present (ha) Before (ha) Decrease (ha) Percentage
lost
Songhong Nyai 15 466 451 97
Songhong Noi 13 262 249 95
Vangkhanan 27 900 873 97
Total 55 1,628 1,573 97
Source: Village profile survey
Presently, the villagers can still grow crops in between the rows of rubber trees. However, as noted by the focus groups, they will face many difficulties in 4‐5 years, when inter‐cropping with the trees will become impossible. With a lack of agricultural land, combined with reduced livestock production and NTFPs, local people fear food insecurity. This situation applies to the whole of Khum Ban Phattana No. 5, where the plantations are located. In addition, conflicts over the implementation of contracts for contract farming of rubber have arisen. The focus group discussions indicated that information about the rubber plantation project has been inaccurate, leading to misunderstandings about its implementation. Confusion also exists over the content of contracts, which the villagers expected to follow a “2+3” model, but turned out to be limited to labor supply. Contracts between the company and local households have failed in some cases (e.g. contracts not followed, households don’t carry out weeding, poor directions from the company).
Overall economic costs and benefits: As discussed, the two case study areas have experienced both positive and negative economic impacts from investment projects. (Table 14 below provides an overview of the quantitative economic impacts identified in the two case study areas).
Table 13: Quantitative economic impacts of the two case studies

63
Item Caosu Dak Lak Rubber Wood processing factories
Contribution to government revenues in taxes and fees (USD)
NA NA
Lao permanent/ full time employment (persons)
6 23
Lao seasonal/ part‐time employment (persons)
332 210‐310
Contracts with local households 10 NA
Associated Investment capital in related sectors (stimulated by original investment) (USD)
NA 30,000
Contribution to community development activities/infrastructure (USD)
147,470 NA
There has been a clear impact on household economic structure and local livelihoods in the case study areas. Income previously earned from traditional activities, such as NTFP collection and livestock production, has almost disappeared, while wage labor and trade are increasingly contributing to incomes. The findings from the focus group discussions held in the two case study areas indicate that the plantations and the wood processing factories have helped to improve the socio‐economic development status of households in the areas in recent years. The investments provide a source of secondary and seasonal income previously not available. However, the results from the case studies do not lead to the conclusion that the positive economic impacts outweigh the negative: it is also necessary to examine the social and environmental impacts of the investments.
5.2. Social impacts
The findings from the case studies show that the investment projects have had a number of social impacts. These are often interlinked with their environmental and economic impacts.
Changes in livelihoods: As discussed above, the case study investment projects have resulted in changes to traditional livelihood patterns. In the past, after farming, local people would collect NTFPs or work as woodcutters to earn extra income. These activities are now difficult to impossible, as many forest areas have been logged or converted to plantations, or contaminated with chemicals. Local people are now working in the plantations or wood factories after the harvest, or engaging in trade. Livelihoods in the case study areas are thus shifting from being natural‐resource based to being based in employment in a commercial, modern industry.

64
Health impacts: Impacts on health care were evident in both case study areas. In the case of the rubber plantations, although the company has provided a health care center, the application and dumping of chemical herbicides in the plantations has caused illnesses and fear of contamination of local water and food sources. The wood processing factories studied also face workplace health and safety challenges. Workers interviewed during the case study stated that work‐related health problems and injuries were frequent, including injuries from loading wood and using machinery without adequate protection and respiratory illnesses. In both case studies, the companies do not provide adequate information or protective gear to employees or people in the local areas.
Labor requirements and child labor: The two case studies have differing impacts in terms of labor requirement and child labor issues. In its early stages, the Caosu Dak Lak rubber plantation required more labour for planting, weeding and tending the young rubber trees. However, human labor will be increasingly substituted with machines as the trees grow. Then, in approximately two years, the rubber plantations will require a huge number of laborers for tapping the rubber (about 1.5 persons per hectare, amounting to about 3,500 extra people, according to the farm management team). This may require importing labour, increasing migration into the local area. In the case of the wood processing factories, child labour is evident. According to the participatory assessment carried out in the three villages, many families encourage their children to drop out of school for employment in the wood processing industry, due to poverty and/or labour shortages. Some of them are under 14 years of age, having a negative impact on education.
Conflicts over land: The establishment of the Caosu Dak Lak rubber plantations has led to conflict over land, of which there are several cases still unresolved. Although most cases were solved through negotiation, the villagers are often at a disadvantage, particularly when seeking compensation for lost land or crops. For example, the company only pays compensation to villagers for the value of crops that are cleared, not for the land itself, as this is considered a land concession granted by the GoL as land‐owner.
The matrix below provides an overview of the social and health impacts identified in the two case study areas.
Table 14: Matrix of social impacts identified in the two case studies
Item Caosu Dak Lak Rubber Wood processing factories
Shift from traditional livelihoods to industrial livelihoods
X X
Increased wage labor X X
Increased household expenditure on food, water, etc
X

65
Increased conflicts over land X
Child labour/negative impacts on education X
Increased desire for material goods X
Occupational health problems/injuries X X
Chemical contamination problems X X
Health care service improvement X
5.3. Environment impacts
The negative effects of the investments on forests, biodiversity and water resources are among their most serious impacts, although there are differences between the directness of linkages to the projects the two case studies.
Impacts on forest and water resources: According to the findings in the three villages in the rubber plantation areas, production forest, agricultural land and gardens in all the sampling villages were converted to rubber plantations (as shown in Table 13 above). This is a significant finding, as the conversion of forest to plantations is technically illegal under Lao law. In addition, despite being told that the rubber plantations will be kept a distance from the main road and from their villages, the research team noted that rubber is in fact now growing close to the road and all around the villages. In the case of the wood processing factories, the case study area has also experienced a loss of forest cover. This is attributed to increased logging and the expansion of investments in the area more broadly, rather than being directly linked to the three factories. According to focus group discussions, substantial areas of the forests of Saravan Province, especially in Saravan, Laongam, Vapi, Taoy and Samoy districts have been cut to supply raw materials for the wood processing industry. In the three case study villages, the forest cover has decreased from 47% (about 1,175 ha) in 2005 to about 40% (about 1,000 ha) in 2010.114 As in the rubber case study area, the focus groups also claim that the quantity of water in local rivers, ponds, swamps, etc, had decreased and several are now completely dry in the dry season.
Chemicals and pollution: The rubber plantations, which use chemical herbicides, are associated with a negative environmental impact on the local area through chemical contamination. The villagers in the case study area believe that increased chemical use is responsible for the death of livestock, illnesses in humans, and the disappearance of shrimp, snails, crabs, fishes, and other aquatic species. In addition, the villagers no longer consume water from the river or collect NTFPs due to fears of chemical contamination. As a result, the daily expenditure of villagers is increasing, as they must purchase more food and have to
114 Based on information gathered from all three villages in the village profile surveys.

66
pay for the electricity and wells to access underground water. The matrix below summarizes the environmental impacts associated with investments in the two case study areas.
Table 15: Matrix of environmental impacts identified in the two case studies
Item Caosu Dak Lak Rubber Wood processing factories
Loss of forest cover X X
Loss of NTFPs X X
Loss of aquatic species X
Chemical contamination of land/water X
Impacts on local water sources X X
6. Conclusions
Saravan Province is located in between Savannakhet and Champassak provinces, two provinces that are experiencing high rates of economic growth. Saravan Province has abundant natural resources such as agriculture land, forest, river, and mineral resources, as well as a young population and a strategic location. However, while its economy is growing and investment flows are increasing, the province still suffers from underdeveloped infrastructure and relatively high rates of poverty. Despite increases, investment in Saravan Province remains lower than in its neighboring provinces, partly due to its lack of infrastructure. According to the Saravan PDPI, there were 411 projects in the province worth LAK 1,174.27 billion between 2006 and 2009. Of that investment, more than 56% is still sourced from the public sector; just over 43% is from private investment, including both domestic and overseas investors. 115 Between 1999 and 2010, the total in‐flow of foreign investment accounted for only 0.5 percent of total FDI in the Lao PDR in the same period. China is largest investor in Saravan Province, following by Vietnam and Thailand.116 As in other provinces in Lao PDR, investment in Saravan is focused on the natural resource sectors, such as agriculture, forestry, hydropower and mining.
The Saravan provincial government, like the GoL, aims to attract more investments in order to stimulate for the economic development and in turn help poverty reduction. This study indicates that investment has indeed contributed to Saravan’s socio‐economic development in terms of increasing the province’s GDP and decreasing its poverty rate. However, based on the findings of this assessment, including the results of the two local‐level case studies, investments in the Province are associated with a range of both positive and negative economic, social and environmental impacts. These include contributions to community and 115 Saravan PDPI: Investment data sheets, 2010. 116 Saravan PDPI: Investment data sheets, 2010.

67
infrastructure development, as well as job creation. However, the lack of transparency concerning profits, taxes and fees, and how these are in fact recycled to the local level makes it difficult to accurately judge their actual impact on local level socio‐economic development. Investments can also have indirect economic benefits, stimulating growth in local economies in investment areas and helping to attract even more investment. As Saravan’s road infrastructure is still limited, GoL investment into Saravan infrastructure would likely spur further investment in the province. However, this study also indicates that despite the benefits for the province as a whole, individual investment project do not inevitably contribute to the development of the local communities that are immediately impacted by the investment project. For example, despite the fact that local people have been working on the Dak Lak rubber plantation since it opened in 2005, today, the poverty incidence of the three case study villages is substantially higher than that of the province as a whole (15% versus 8.1%).
In addition, this study has also shown that investments in the province are associated with the degradation of natural resources, loss of agricultural and forest lands, and increased conflicts over land. In addition, investment projects are prompting a shift in traditional livelihoods but not necessarily providing a reliable alternative. Though in both case studies local people increased their household income as a result of employment with the investment company, the investment also caused household expenditures to grow. In both case studies, local people had to begin buying more food as a result of forest degradation causing loss of NTFPs that had previously been a major food source for local people. In the case of Dak Lak rubber plantation, loss of NTFPs coupled with loss of agricultural land means that local people’s food security may be seriously threatened in the future. For the time being, villagers can intercrop their food crops with rubber trees, however, this will no longer be possible in a few years when the trees are older. It seems unlikely that the low wages from working on the rubber plantation will be able to cover the cost of buying all the food needed to feed a family. This case study in particular highlights that investment projects that result in taking away families’ agricultural lands without paying fair or adequate wages may put local people in a position of increased vulnerability.
The limited capacity and uneven implementation of the province’s investment approval and management system has been unable to prevent or control these negative effects identified by both local officials and local communities: decreased forest cover and quality, conflicts over land, declining water supplies and quality, decreased livestock production, loss of biodiversity and NTFPs, health problems, and declining school attendance. Recommendations from the people involved in the two case studies to the companies and the Government included, among other points, that: the companies pay better wages and offer better job security; that they contribute more to community development and

68
environmental protection; that they address concerns about food security and access to land; and that chemical use in the plantations is investigated and controlled.
Ultimately, this study shows that, because of the environmental and social problems associated with certain investments in the province, the positive and negative impacts of investments may cancel each other out. As a consequence, local people are unsure as to whether they truly benefit from the investments in their area or suffer more from their ill effects. In some cases, the costs of managing the negative impacts may in fact be higher than the economic gains. In particular, the costs and benefits of investment appear to be unevenly shared between the communities and people of the province: while one group may disproportionately share in the gains brought by investment, other groups are bearing a greater burden of the costs.

69
Document references
Badenoch, Nathan. 1999. Watershed Management and Upland Development in Lao PDR: A Synthesis of Issues and Opportunities. World Resources Institute.
Foppes, Joost, and Sounthone Ketphanh. 2004. “NTFP use and household security in Lao PDR”. Draft paper for NAFRI/FAO Symposium “Biodiversity for Food Security”, Vientiane, 14 September 2004.
Government of Lao PDR. 1997. Law on Mining (1997).
Government of Lao PDR. 1998. Law on Agriculture (1998).
Government of Lao PDR. 1999, Environmental Protection Law (1999).
Government of Lao PDR. 2003. Land Law (2003).
Government of Lao PDR. 2005. Enterprise Law (2005).
Government of Lao PDR. 2006. National Policy on Environmental and Social Sustainability of the Hydropower Sector (2006)
Government of Lao PDR. 2007. Law on Forestry (2007).
Government of Lao PDR. 2009. Law on Investment Promotion.
Government of Lao PDR. 2010. Minerals Law. [Working draft and unofficial translation, March 2010].
Governor’s Office, Saravan Province. Agreement on improvement acception of wood product industry and furniture. Number 193/governor.SRV, dated 13/6/2007.
International Rivers. March 2010. “Lao Hydropower Database”. http://www.internationalrivers.org/files/LaoHydroMar2010.pdf (accessed December 2010).
International Water Management Institute (IWMI). 2008. “Water Implications of Biofuel Crops: Understanding Trade‐offs and Identifying Options”. Water Policy Brief, Issue 30.
IUCN Lao PDR. 2008. A Rapid Participatory Biodiversity Assessment: Stora Enso Eucalyptus Plantation in Southern Lao PDR.
IUCN Lao PDR. 2010. “Biodiversity and Livelihoods: Background issues paper for CoP 10” [Draft].
IUCN. 1999. Wildlife in Laos PDR: 1999 Status Report. Samsaen Printing, Bangkok.
Mahaphonh et al. 2007. “Study on Land Conflicts and Conflict Resolution in Lao PDR”. Land Policy Study No. 9, LLTP II.
The Mekong River Commission (MRC). September 2009. “Adaptation to Climate Change in the Countries of the Lower Mekong Basin”. MRC Management Information Booklet Series, No.1.
Ministry of Agriculture and Forestry. 2000. Regulation on the Use of Insecticides (1578/MAF 2000).
Ministry of Agriculture and Forestry. 2000. Management of Fertilizers Regulation (1503/MAF 2000).
Ministry of Agriculture and Forestry. Ministerial Agreement on Establishment and Responsibility of Provincial Agriculture and Forestry Division. Number 1064/MOAF, date 23/10/2007.
Ministry of Agriculture and Forestry. Ministerial Agreement on Establishment and Responsibility of Provincial Agriculture and Forestry Division,. Number 1757/MOAF, date 7/9/2009.

70
Ministry of Agriculture and Forestry. Ministerial Agreement on Establishment and Responsibility of Provincial Agriculture and Forestry Division, Number 1064/MAF, dated 23/10/2007.
Ministry of Agriculture and Forestry. Name list of the Saravan Provincial Agriculture and Forestry Division officers in the second quarter of 2010, Number 0451/Saravan PAFO, dated 31/3/2010.
Ministry of Energy and Mining. Ministerial Agreement on Establishment and Responsibility of Saravan Province Energy and Mining Division,. Number 372/MOEM, dated 14/9/2006.
Ministry of Planning and Investment.2010. 7th Five Year Plan VII (2011‐2015) [Draft]
Ministry of Planning and Investment. 2005. Decree for the Implementation of the Law on the Promotion of Foreign Investment (2004).
Ministry of Planning and Investment. 2008. Agreement Number 0509/MPI on Role and Function of IPD, dated on June 11, 2008.
Ministry of Planning and Investment. 2010. Draft Decree on the Implementation of the Law on Investment Promotion 2009.
National Agriculture and Forestry Extension Service (NAFES). 2008. Knowledge Capitalization. Agriculture and Forestry Development at “Khum Ban” Village Cluster Level in Lao PDR, Vientiane, July 2008.
National Statistics Center, Committee for Planning and Investment. 2007. Population Census and Address Locations of Saravan Province in 2005. Vientiane Capital, 3/2007.
National Statistics Center, State Planning Committee. 1997. Population Census of Saravan Province in 1995. Vientiane Capital, 5/1997.
National Statistics Center, State Planning Committee. 2000. Agriculture Product Statistics Census of Saravan Province in 1998/99. Vientiane Capital, 2000.
Primatology.net. 22 September 2010. “New Gibbon Species Discovered”, http://primatology.net/2010/09/22/new‐gibbon‐species‐discovered/ (accessed December 2010)
Salamander Energy, official website. “Acerage Directory”. http://www.salamander‐energy.com/media‐centre/press‐pack.aspx (accessed: December 2010)
Saravan Province, Governor’s Agreement on Improvement Acceptance of Wood Product Industry and Furniture. Number 193/Governor/SRV, dated 13/6/2007.
Saravan Province Agriculture and Forestry Office. 2010. Summary on implementation of organization and management of employee in fiscal year 2009‐2010 and the plan 2010‐2011. Number 01085/SRV Agriculture and Forestry, dated 8/6/2010.
Saravan Provincial Agriculture and Forestry Office. 2010. “Name list and qualification of contract staff of PAFO in second quarter in fiscal year 2009‐2010”, Number 01098/SRV Agriculture and Forestry, dated 8/6/2010.
Saravan Provincial Agriculture and Forestry Office. 2010. The 7th Strategy for Agriculture and Forestry Development, 2011‐2015, Number 01049/ SRV Agriculture and Forestry, dated 3/6/2010.
Saravan Provincial Agriculture and Forestry Office. 2010. “Summary on implementation of organization and management of employee in fiscal year 2009‐2010 and plan for 2010‐2011”, Number 01085/SRV Agriculture and Forestry, dated 8/6/2010.

71
Saravan Provincial Agriculture and Forestry Office, Planning Division. 2009. “Summary on implementation of agriculture and forestry production plan in 9 months in fiscal year 2008‐09 and the next 3 three months plan”, dated. 28/7/2009.
Saravan Provincial Agriculture and Forestry Office. 2000. 25 years of Statistic of Agriculture and Forestry Development. (1976‐2000), dated 27/6/2000.
Saravan Province Land Management Office. 2010. Report on Five Year Plan, 2006‐2010 and Five Year Plan, 2011‐2015 [Draft].
Saravan Province Land Management Office. 2010. Summary of Implementation of Land Management in First 6 Months and Plan for Next 6 Months in fiscal year 2009‐2010, Number 172/LMA.SRV, dated 5/4/2010.
Saravan Province Land Management Office. 2009. Summary of implementation of land Management in fiscal year 2008‐2009 and Plan for fiscal year 2009‐2010. Number 125/LMA.SRV, dated 25/10/2009.
Saravan Province Department of Education. 2010. Report on Five‐Year Plan, 2006‐2010.
Saravan Province Department of Education. 2010. Annual Report, 2009‐2010.
Saravan Provincial Department for Energy and Mining. 2007. “Summary of Implementation of Energy and Mining in fiscal year 2001‐2005 and Guideline for next Five Year Plan, 2006‐2010”. Number 214/DEM.SVR, dated 20/7/2007.
Saravan Provincial Department for Energy and Mining. 2010. “Summary of Implementation of Energy and Mining in First 6 Months and Plan for Next 6 months in fiscal year 2009‐2010, and the Yearly Plan for fiscal year 2010‐2011”, Number 93/ DEM.SVR, dated 17/5/2010.
Saravan Provincial Department for Industry and Trade. 2010. “Summary of Implementation of 6th Five Year Industry Development and Trade Plan and Guideline for 7th Five Year Plan, 2011‐2015”, Number 246/DIT.SVR, dated 11/5/2010.
Saravan Provincial Department for Industry and Trade. 2010. “Name list and qualification of staff in fiscal year 2009‐2010”.
Saravan Province Labor Federation. 2010. The 5th Conference of Provincial Labor Federation Commission.
Saravan Province Land Management Office, Land Planning and Development Office. 2010. “Summary List of Land for Rent and Concession”, dated 31/3/2010.
Saravan Province Land Management Office. 2008. Summary of Implementation of Land Management in fiscal year 2007‐2008 and Guideline for 2008‐2009 Plan.
Saravan Province Land Management Office. 2008. Summary of Implementation of Land Management in fiscal year 2006‐2007 and Guideline for 2007‐2008 Plan, Number 296/LMA.SRV, dated 28/1/2008.
Saravan Province Department for Planning and Investment. 2010. Report on Implementation of the 6th Five Year Plan, 2006‐2010, 2010 (draft).
Saravan Province Department for Planning and Investment. Investment data sheets, 2010.

72
Saravan Province Department for Planning and Investment. 2010. “Name and qualification of staff in Saravan Provincial Department for Planning and Investment, fiscal year 2009‐2010”, dated 4/6/2010.
Saravan Province Department for Planning and Investment. 2008. “Summary on domestic and foreign investment in to date in fiscal year 2007‐2008”.
Saravan Province Department for Planning and Investment. 2006. Report on Implementation of the 5th Five Year Plan (2001‐2005) socio‐economic plan and Guideline of 6th Five Year Plan (2006‐2010), dated 18/12/2006.
Saravan Province Department of Transportation and Public Works. 2009. Annual Report.
Saravan Province Water Resources and Environment Office. 2009. Summary of Implementation of Water Resource and Environment in fiscal year 2008‐2009 and Guideline for 2009‐2010 Plan, Number 25/WREO.SRV, dated 04/11/2009.
Saravan Province Water Resources and Environment Office. 2009. “Name list of WREO staff in 2009”, dates 02/7/2009.
Saravan Province Water Resources and Environment Office. 2008. Environment Strategy 2020 and Environment Action Plan in 2006‐2010, dated 07/2008.
Saravan Province Women’s Union. Draft of Report for 4th Provincial Women’s Union Meeting [Draft], dated 26‐27/5/2010.
Socio‐economic Atlas of the Lao PDR, 2005. http://www.laoatlas.net/ (accessed December 2010).
The United Nations Development Program. 2006. Environmental and Social Impact Analysis: Stora Enso Plantation Project in Guangxi, China.
The United Nations Development Program. United Nations Human Development Indicators, 2010. “Lao PDR”. http://hdrstats.undp.org/en/countries/profiles/LAO.html (accessed December 2010).
The World Bank. 2008. Lao PDR Economic Monitor 2008.
The World Bank. 2010a.http://data.worldbank.org/indicator/NY.GNP.PCAP.CD (accessed December 2010).
The World Bank. 2010b. Lao Economic Monitor, May 2010.
The World Bank. 2010c. Doing Business 2010 Report, http://www.doingbusiness.org/economyrankings/ (accessed December 2010)
The World Bank. 2010d. Lao PDR Country Policy and Institutional Assessment 2010.
Transparency International, Corruptions Perceptions Index 2010, http://www.transparency.org/policy_research/surveys_indices/cpi/2010/results (accessed December 2010)
Van Ngoc Think et al. 2010. “A new species of crested gibbon from the central Annamite mountain range”. Vietnamese Journal of Primatology, 2010 (4):1‐12.
Voladet, Saykham. 2009. The Plantation Industry in Laos: An Examination of the Role of the Ministry of Planning and Investment. National Economic Research Institute (NERI), International Institute for Sustainable Development (IISD), and International Union for Conservation of Nature (IUCN).

73
Water Resources and Environment Administration. 2010. Ministerial Agreement for List and Inception of Projects to use EIA. Number 679/PMO.WREOA, dated 12/3/2010.
Water Resources and Environment Administration. 2010. Decree on Environmental and Social Impact Assessments (2010).
Worldwide Fund for Nature (WWF). October 2009. The Greater Mekong and Climate Change: Biodiversity, Ecosystem Services and Development At Risk.

74
Annexes

75
Annex 1: Flowchart of investment approval processes

76
Annex 2: Flowchart of procedures to obtain IEE/ESIA/ECC
A. IEE to ECC

77
B. ESIA to ECC

78
Annex 3: List of Projects requiring IEES/ESIAs117
117Unofficial translation provided by Ministry of Planning and Information.

79

80
Annex 4: Lists of Prohibited and Allowed Insecticides within Lao PDR
A. List of Allowed Chemical Fertilizers in Lao PDR
1. Ammonium sulphate, containing nitrogen in term of Ammonium not less than 20 percent and moisture not over 3 percent of total weight.
5. Urea, containing nitrogen not less than 44 percent, Biuret not over 1 percent and moisture not over 3 percent of total weigh.
6. Super phosphate, containing Phosphorus in term of Available P (P2O5) not less than 20 percent, Arsenic not over 0.5 percent and moisture not over 3 percent of total weigh.
7. Double super phosphate, containing phosphate in term of P2O5 not less than 40 percent, Arsenic not over 0.5 percent and moisture not over 3 percent of total weigh.
8. Triple super phosphate, containing phosphate in term of P2O5 not less than 45 percent, Arsenic not over 0.5 percent and water not over 3 percent of total weigh.
9. Potassium chloride, containing Potassium in term of K2O not less than 60 percent and moisture not less than 3 percent of total weigh.
10. Potassium sulphate, containing Potassium in term of K2O not less than 48 percent and moisture not over 3 percent.
B: List of Prohibited Insecticides within Lao PDR
No Name No Name 1 2,4,5 T 14 TEPP
2 DDT 15 Sodium chlorate
3 Aldrin 16 EDB
4 Endrin 17 Captafol 5 Dieldrin 18 Fluoroacetamide 6 Chlordimeform 19 Sodium fluoasetade 7 Heptachlor 20 Cyhexatine 8 Toxaphene 21 Daminocide 9 Ethyl Parathion 22 Binapaccryl 10 Leptophos 23 Dinoseb 11 BHC 24 Methyl bromide 12 Sodium Arsenite 25 Methyl parathion 13 MEMC 26 Monocrotophos
Source: the Ministry of Agriculture

81
C: List of Allowed Insecticide within Lao PDR
No Common name Trade name Poisonous grade
1 Acephate Orthin 75 Sp 3B 2 Carbaryl Servin, Dicarbam,Vatavaryl 2B 3 Carbofuran Furadan, Curaterr 2B 4 Carbosulfan Poss, camang, Marsell 2B 5 Cartap Padan 2B 6 Cyfluthrin Baythroid, Solfac, Tampo, Responsor 2B 7 Cyhalothrin Grenade, Karate 2B 8 Cypermethrin Ripcord, Ambush, Barricade, Sherpa 2B 9 Deltamethrin Decis, Kothrin, Bustoss, Cislin, Crakdown 2B 10 Diazinon Bazudin, bassa 2B 11 Dimethoate Cygon, Fostion, M.M, Rogor, Roxion,
Perfekthion 2B
12 Ethrofenprox Ethrofenprox 2B 13 Endosulfan Thiodan, Thionex, Endocel 3B 14 Fenitrothion Sumothion, Tronifan 2B 15 Fenvalerate Sumi 35, Sumicidin, Sunrold 2B 16 Isoprocarb Mipc, Carbacor, Mipcin, Micap, Ethrofolan 2B 17 Malathion Malathan, Malaphos, Malaphate 2B 18 Methamidaphos Sonnata, Monthana, Natharin, Monitor,
Tamaron 3B
19 Methomyl Miller, methavin, newdrin, lennate 1B 20 Coumatetralyl Racumin 1B 21 Warfarin Warfarin, Coumafene, Zoocoumarin,
Coumarins 1B
22 Zinc phosphide Celphos, Phostoxin, Quickphos 1B 23 Niclosamide Bayllusside 2B 24 Copper Sulphate Bordeaux mixture 2B 25 Metaldehyde Halizan, Metason, MifaSlug 3B 26 Benomyl Benlate 3B 27 Carbendazim Bavistin, Delsin 3B 28 Caboxin Culator 3B 29 Captan Captec, Merpan, Phytocape 3B 30 Copper oxychloride Coppicide 3B 31 Edifenphos Hinosan 1B 32 Zineb Lanocob NA 33 Mancozeb Dithane M 45 NA 34 Maneb Dithane M 22, Mazin NA 35 Sulphur Herovit NA 36 Alachlor lasso, Lazo, Alanex, Pillazzo 3B

82
37 Atrazine Atrex, Atratal, Gesaprim, Vectal NA 38 Butachlor Machete, Lambast, Butanex NA 39 2.4D Hedonal, Weeder 2B 40 Diuron Craminon, Arelon, lp 50, Tolkan NA 41 Glyphosate Round up NA 42 Oxadiazon Ronstar NA 43 Propanil Sucopur, stam‐F.34 3B 44 Simazine Gesatop, primatol, Aquazine NA 45 Ebufos Rugby 1A 46 Ethoprophos Macap 1A
Source: the Ministry of Agriculture and Forestry
Remarks: 1A = extremely hazardous, the substance has Oral LD50, mg/kg less than 5
or LD for man less than 60 mg
1B= highly hazardous, the substance has Oral LD 50, mg/kg between 5 and
50 or LD for man between 1 and 5 g
2B= moderately hazardous, the substance has Oral LD50, mg/kg between 50
and 5000 or LD for man between 5 and 50g
3B= slightly hazardous. the substance has Oral LD 50 over 5000 or LD or
man over 50g

83
Annex 5: Key investment projects in Saravan Province118
SECTOR INVESTMENT/ PROJECT
INVESTOR/ COMPANY
NATION‐ALITY?
LOCATION (town/ district)
SIZE OF INVESTMENT (usd)
SIZE OF CONCESSION/ Dam
DATE STARTED STATUS
NO. PEOPLE EMPLOYED
Salamander Energy Oil & Gas exploration
Salamander Energy (in SVK partners are: Origin Energy (30%) PetroVietnam E&P (25%) IFC (10%) NCD/LIBC (5%))
UK ‐ Vietnam
Savannakhet, Champassak & Saravan
PSC area is 19,520 square kilometers
2007
Exploration ongoing; MoU signed Jan. 2008.
200 (globally)
Stora Enso Eucalyptus Plantation
Stora Enso Finland‐Sweden
Ta Oy District, Saravan
More than $59 million (over two provinces ‐ Savannakhet and Saravan)
35,000ha over two provinces, 50 year land concession
ESIA granted 2009
Sections in operation
Stora Enso has 40,000 employees worldwide. Employees in Lao PDR unknown
Plantat‐ions & process‐ing
Caosu Dak Lak Rubber Plantation
Dak‐Lak Rubber Co (Dakruco)
Vietnam Laongam District
>US$30 million (over four provinces ‐ Saravan, Champassak, Attapeu & Xekong)
10,000 ha over four provinces, 50 years
July 2004
Concession Agreement signed 20 Jul 2004; in operation
c. 340 Lao employees
118 This table provides only an overview of certain key investments in the main sectors attracting investment in Saravan’s economy. These were selected based on size, profile, availability of information and involvement of FDI.
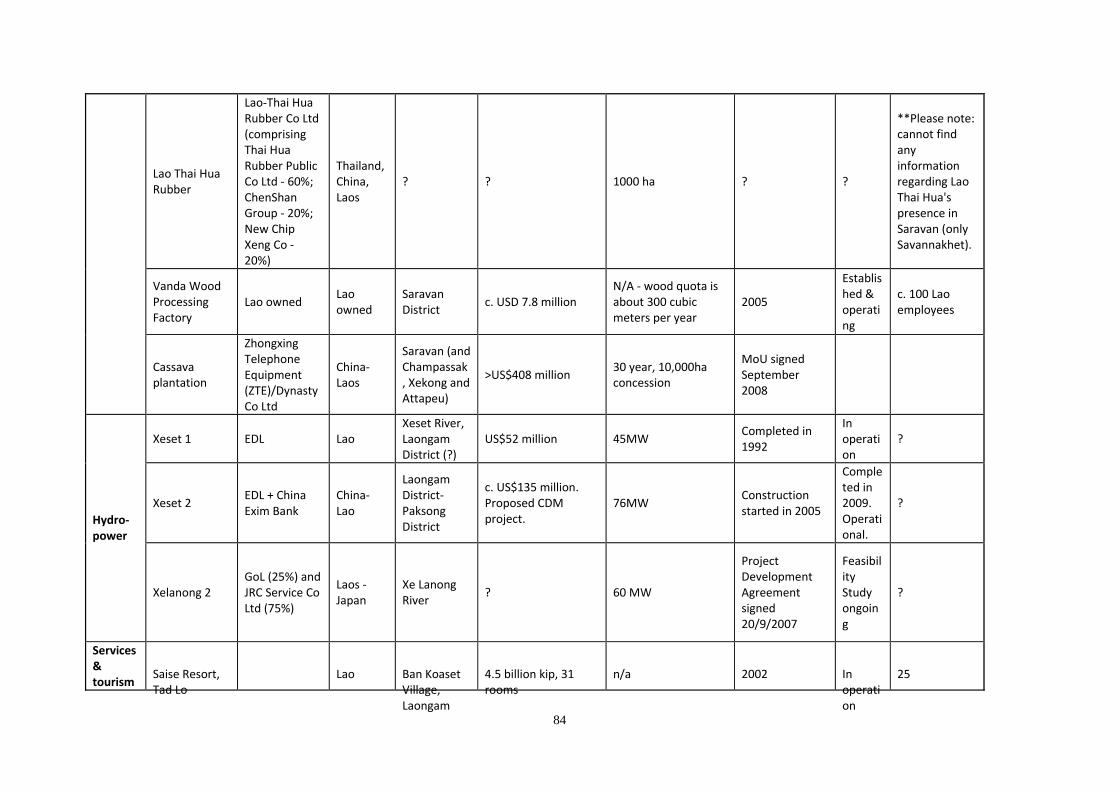
84
Lao Thai Hua Rubber
Lao‐Thai Hua Rubber Co Ltd (comprising Thai Hua Rubber Public Co Ltd ‐ 60%; ChenShan Group ‐ 20%; New Chip Xeng Co ‐ 20%)
Thailand, China, Laos
? ? 1000 ha ? ?
**Please note: cannot find any information regarding Lao Thai Hua's presence in Saravan (only Savannakhet).
Vanda Wood Processing Factory
Lao owned Lao owned
Saravan District
c. USD 7.8 million N/A ‐ wood quota is about 300 cubic meters per year
2005
Established & operating
c. 100 Lao employees
Cassava plantation
Zhongxing Telephone Equipment (ZTE)/Dynasty Co Ltd
China‐Laos
Saravan (and Champassak, Xekong and Attapeu)
>US$408 million 30 year, 10,000ha concession
MoU signed September 2008
Xeset 1 EDL Lao Xeset River, Laongam District (?)
US$52 million 45MW Completed in 1992
In operation
?
Xeset 2 EDL + China Exim Bank
China‐Lao
Laongam District‐Paksong District
c. US$135 million. Proposed CDM project.
76MW Construction started in 2005
Completed in 2009. Operational.
? Hydro‐power
Xelanong 2 GoL (25%) and JRC Service Co Ltd (75%)
Laos ‐ Japan
Xe Lanong River
? 60 MW
Project Development Agreement signed 20/9/2007
Feasibility Study ongoing
?
Services & tourism
Saise Resort, Tad Lo
Lao Ban Koaset Village, Laongam
4.5 billion kip, 31 rooms
n/a 2002 In operation
25

85
District
Tad Lo Lodge Lao
Ban Senevang Village, Saravan District
US$ 40,000 , expand construction US$ 300,000
n/a 1990 In operation
25
Cassava factory
Huphuco SLV Co
Vietnam ?
US$2.2 million registered capital; total investment of $100 million
30 year, 500 ha land concession (?) May have increased since
Project Development Agreement 24/10/2005
Established in 2007
?
Coal mining
* Chakeui Mine (Chinese?); *Saravan Coal Mine (Phonesack Co.?)
Chinese and/or Lao
? ? ? ? ? ?
Industry & manuf‐acturing
Jungya (Zhongya) Isi Cement Lao Co.
Zhongyayici Company
China Saravan District
US$50 million 35 year, 50 ha land concession
?
Expected to start in late 2010
?

86
Annex 6: Full Case Study Report on Caosu Dak Lak Rubber Plantations

87
Annex 7: Full Case Study Report on Wood Processing Industry