Embed Size (px)
Citation preview

PhD Dissertations and Master's Theses
Spring 4-2021
Assessment of Evacuation Network Performance under Different Assessment of Evacuation Network Performance under Different
Evacuation Scenarios: The Florida Keys Evacuation Scenarios: The Florida Keys
Erika Shellenberger [email protected]
Follow this and additional works at: https://commons.erau.edu/edt
Part of the Civil and Environmental Engineering Commons, and the Environmental Studies Commons
Scholarly Commons Citation Scholarly Commons Citation Shellenberger, Erika, "Assessment of Evacuation Network Performance under Different Evacuation Scenarios: The Florida Keys" (2021). PhD Dissertations and Master's Theses. 577. https://commons.erau.edu/edt/577
This Thesis - Open Access is brought to you for free and open access by Scholarly Commons. It has been accepted for inclusion in PhD Dissertations and Master's Theses by an authorized administrator of Scholarly Commons. For more information, please contact [email protected].

ASSESSMENT OF EVACUATION NETWORK PERFORMANCE UNDER DIFFERENT
EVACUATION SCENARIOS: THE FLORIDA KEYS
By:
Erika Shellenberger, E.I.
A Thesis Submitted to the College of Engineering, Department of Civil Engineering
in Partial Fulfillment of the Requirements for the Degree of Master of Science
in Civil Engineering – Transportation Engineering Track
Embry-Riddle Aeronautical University
Daytona Beach, FL
April 2021
2
ASSESSMENT OF EVACUATION NETWORK PERFORMANCE UNDER DIFFERENT
EVACUATION SCENARIOS: THE FLORIDA KEYS
By:
Erika Shellenberger, E.I.
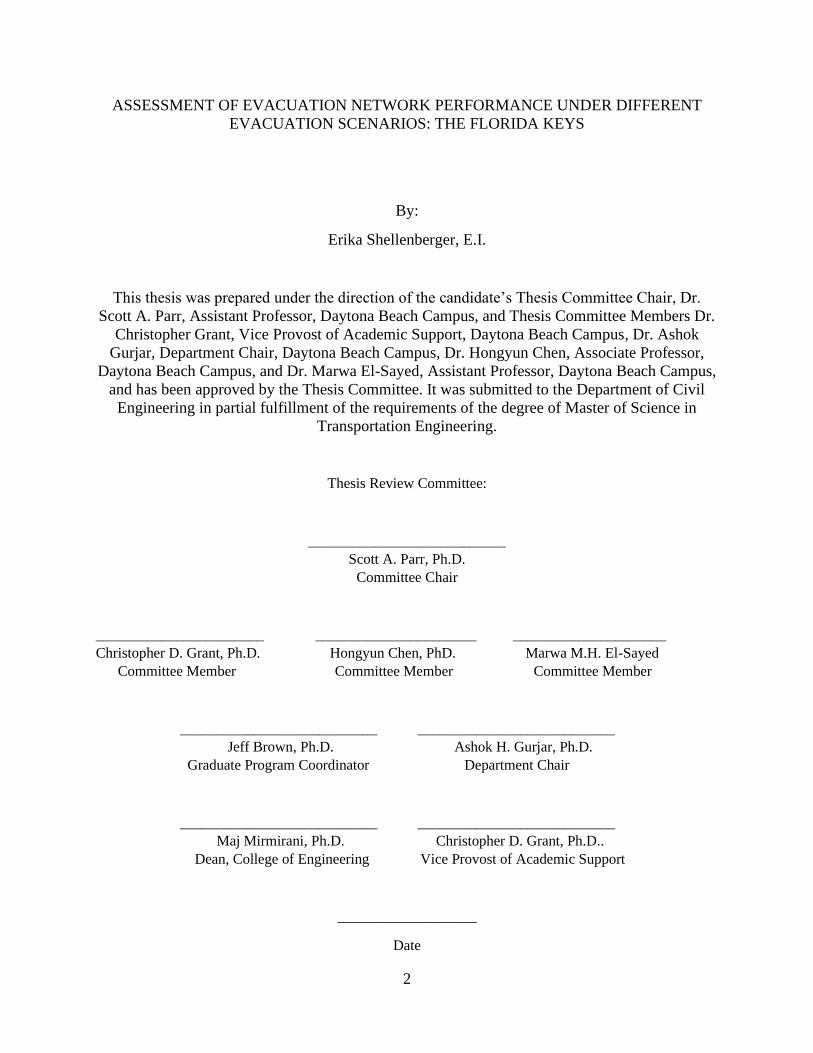
This thesis was prepared under the direction of the candidate’s Thesis Committee Chair, Dr.
Scott A. Parr, Assistant Professor, Daytona Beach Campus, and Thesis Committee Members Dr.
Christopher Grant, Vice Provost of Academic Support, Daytona Beach Campus, Dr. Ashok
Gurjar, Department Chair, Daytona Beach Campus, Dr. Hongyun Chen, Associate Professor,
Daytona Beach Campus, and Dr. Marwa El-Sayed, Assistant Professor, Daytona Beach Campus,
and has been approved by the Thesis Committee. It was submitted to the Department of Civil
Engineering in partial fulfillment of the requirements of the degree of Master of Science in
Transportation Engineering.
Thesis Review Committee:
___________________________
Scott A. Parr, Ph.D.
Committee Chair
_______________________ ______________________ _____________________
Christopher D. Grant, Ph.D. Hongyun Chen, PhD. Marwa M.H. El-Sayed
Committee Member Committee Member Committee Member
___________________________ ___________________________
Jeff Brown, Ph.D. Ashok H. Gurjar, Ph.D.
Graduate Program Coordinator Department Chair
___________________________ ___________________________
Maj Mirmirani, Ph.D. Christopher D. Grant, Ph.D..
Dean, College of Engineering Vice Provost of Academic Support
___________________
Date

3
ACKNOWLEDGEMENTS
Thank you for the Marine Transportation Research and Education Center for providing funding
for this project. In addition, thank you to Brian Wolshon, Louisiana State University, and the
Gulf Coast Center for Evacuation and Transportation Resiliency Center for their support. In
addition, thank you to the Embry-Riddle Aeronautical University Office of Undergraduate
research for their support and funding throughout this journey.
I would like to thank Dr. Scott Parr. Assistant Professor of Civil Engineering at Embry-Riddle
Aeronautical University, for trusting me with this project and helping me understand the many
variables that effect a hurricane evacuation. Dr. Parr, thank you for believing in me when I am
unsure of myself.
I would also like to thank my committee members, Dr. Christopher Grant, Dr. Hongyun Chen,
and Dr. Marwa El-Sayed. Thank you to the entire Civil Engineering department for guiding me
throughout both my undergraduate and master’s degree. I grew so much as a person during my
time in the department and will always remember these times fondly.
Fanny Kristiansson, you are the best classmate and partner-in-crime I could ask for. I appreciate
all your help with this project and all the other projects we have worked together on. You have
made this process enjoyable, so thank you!
To my family, thank you so much for your support and encouragement. I am blessed to have the
opportunity to pursue a higher education and that would not be possible without your support
and guidance throughout my life.

4
To my golf coach, Coach Maria Lopez, and teammates, thank you for always supporting me and
trusting that I can handle any situation. I have gained so much applicable life experience from
playing golf and am forever grateful for the opportunity to wear the blue and gold.
I would not be where I am without all of you – so thank you!
5
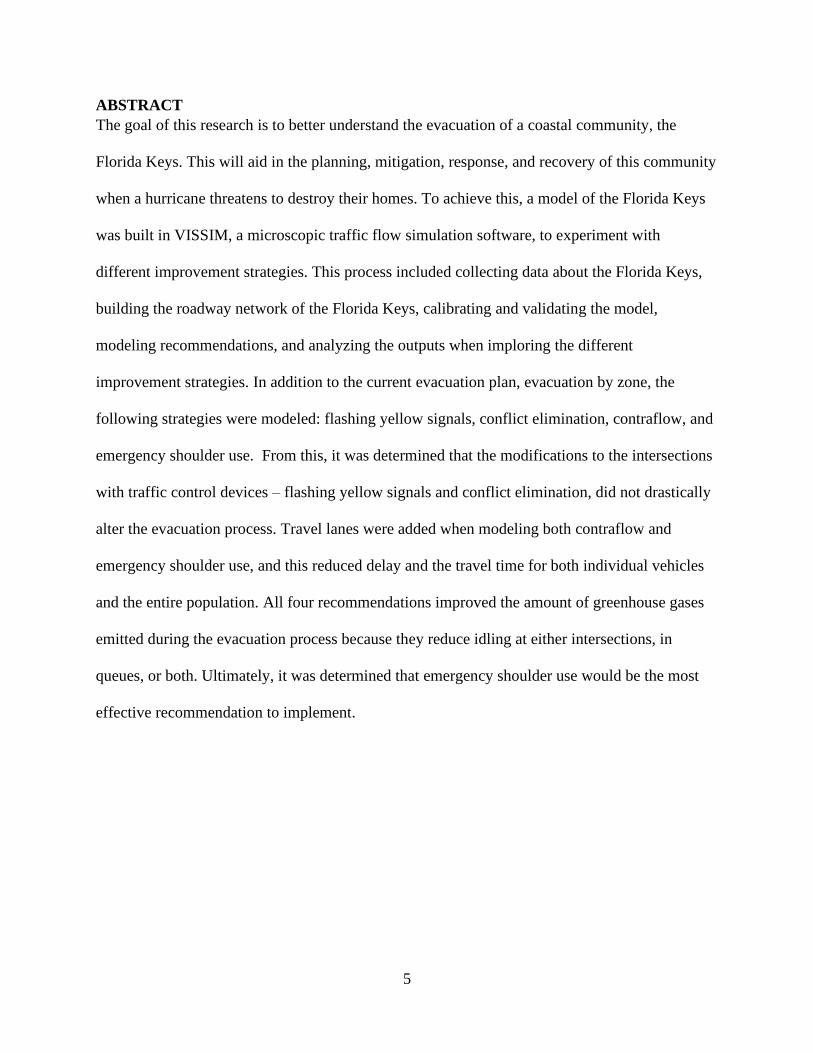
ABSTRACT
The goal of this research is to better understand the evacuation of a coastal community, the
Florida Keys. This will aid in the planning, mitigation, response, and recovery of this community
when a hurricane threatens to destroy their homes. To achieve this, a model of the Florida Keys
was built in VISSIM, a microscopic traffic flow simulation software, to experiment with
different improvement strategies. This process included collecting data about the Florida Keys,
building the roadway network of the Florida Keys, calibrating and validating the model,
modeling recommendations, and analyzing the outputs when imploring the different
improvement strategies. In addition to the current evacuation plan, evacuation by zone, the
following strategies were modeled: flashing yellow signals, conflict elimination, contraflow, and
emergency shoulder use. From this, it was determined that the modifications to the intersections
with traffic control devices – flashing yellow signals and conflict elimination, did not drastically
alter the evacuation process. Travel lanes were added when modeling both contraflow and
emergency shoulder use, and this reduced delay and the travel time for both individual vehicles
and the entire population. All four recommendations improved the amount of greenhouse gases
emitted during the evacuation process because they reduce idling at either intersections, in
queues, or both. Ultimately, it was determined that emergency shoulder use would be the most
effective recommendation to implement.
6
Table of Contents
ACKNOWLEDGEMENTS ............................................................................................................ 3
ABSTRACT .................................................................................................................................... 5
1.0 INTRODUCTION .................................................................................................................. 10
2.0 LITERATURE REVIEW ....................................................................................................... 15
2.1 Basics of Evacuations.......................................................................................................... 15
2.2 Evacuation Modeling and Decision Analysis ..................................................................... 20
2.3 Explanation of Assumptions and Process ........................................................................... 26
2.4 Possible Improvements ....................................................................................................... 28
2.5 Hurricane Evacuation and the Environment ....................................................................... 34
2.6 Conclusion ........................................................................................................................... 35
3. METHODOLOGY ................................................................................................................... 36
3.1 Data Collection and Analysis of the Project Study Area .................................................... 37
3.2 Build Network Model ......................................................................................................... 44
3.3 Calibration ........................................................................................................................... 49
3.4 Validation ............................................................................................................................ 58
3.5 Model Recommendations .................................................................................................... 59
3.5.1 Evacuation by Zone ...................................................................................................... 60
3.5.2 Contraflow .................................................................................................................... 61
3.5.3 Emergency Shoulder Use ............................................................................................. 61
3.5.4 Conflict Elimination ..................................................................................................... 62
3.5.5 Flashing Yellow Signals ............................................................................................... 62
3.5.6 Modeling Improvement Strategies ............................................................................... 64
3.6 Analysis of Model Outputs ................................................................................................. 66
4.0 RESULTS ............................................................................................................................... 71
4.1 Total Vehicle Miles ............................................................................................................. 71
4.2 Total Travel Time................................................................................................................ 72
4.3 Vehicle Travel Time............................................................................................................ 74
4.4 Average Delay ..................................................................................................................... 75
4.5 Clearance Time ................................................................................................................... 77
4.6 Peak Hour of the Evacuation ............................................................................................... 78

7
4.7 Emissions ............................................................................................................................ 82
4.8 Summary of Analysis .......................................................................................................... 83
5.0 CONCLUSION ....................................................................................................................... 88
5.1 Limitations .......................................................................................................................... 89
5.2 Future Work ........................................................................................................................ 90
6.0 REFERENCES ....................................................................................................................... 93
8
Table of Figures
Figure 1: Flow Chart of Methodology .......................................................................................... 38
Figure 2: Map of Signals in Study Area ....................................................................................... 40
Figure 3: Census Tract and Data Collection Point Locations ....................................................... 43
Figure 4: Current Florida Keys Evacuation Plan (Monroe County, 2020) ................................... 44
Figure 5: Signal Timing Parameters ............................................................................................. 47
Figure 6: Portion of VISSIM Model Near Key West ................................................................... 48
Figure 7: Hourly Comparison of Real and Simulated Evacuees at Data Collection Point 1 ........ 55
Figure 8: Hourly Comparison or Real and Simulated Background Traffic at Data Collection
Point 1 ........................................................................................................................................... 55
Figure 9:Hourly Comparison of Real and Simulated Evacuees at Data Collection Point 2 ......... 57
Figure 10: Hourly Comparison of Real and Simulated Background Traffic at Data Collection
Point 2 ........................................................................................................................................... 57
Figure 11: Hourly Comparison of Real and Simulated Evacuees at Data Collection Point 3 ...... 59
Figure 12: Hourly Comparison of Real and Simulated Background Vehicles at Data Collection
Point 3 ........................................................................................................................................... 59
Figure 13: Total Vehicle Miles ..................................................................................................... 72
Figure 14: Vehicle Hours for Each Simulation ............................................................................. 72
Figure 15: Percent Difference for Total Travel Time ................................................................... 74
Figure 16: Travel Time from Key West to Homestead ................................................................ 74
Figure 17: Percent Difference in Travel Time .............................................................................. 75
Figure 18: Hourly Average Delay................................................................................................. 76
Figure 19: Clearance Time............................................................................................................ 78
Figure 20: Travel Time for Evacuation by Zone .......................................................................... 80
Figure 21: Travel Time for Flashing Yellow Signals ................................................................... 80
Figure 22: Travel Time for Conflict Elimination ......................................................................... 80
Figure 23: Travel Time for Contraflow ........................................................................................ 81
Figure 24: Travel Time for Emergency Shoulder Use.................................................................. 81
9
Table of Tables
Table 1: Traffic Signals in Project Study Area ............................................................................. 39
Table 2: Population for Each Census Tract in the Project Study Area ......................................... 41
Table 3: Calculations for Proportion of Total Vehicles from Each Entry Point ........................... 52
Table 4: New Lane Widths with Emergency Shoulder Use ......................................................... 64
Table 5: Summary of Emissions Analysis .................................................................................... 82
Table 6: Analysis Summary Table ................................................................................................ 84
Table 7: FDOT Emergency Shoulder Use During Evacuation ..................................................... 86
10
1.0 INTRODUCTION
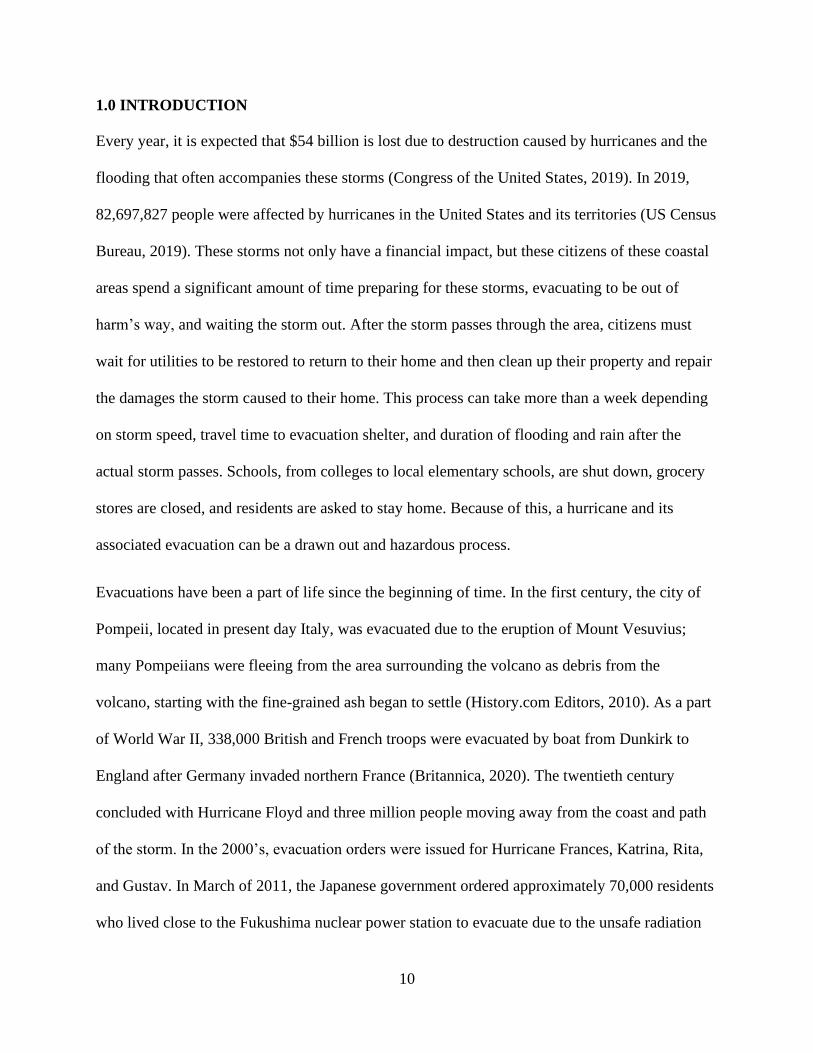
Every year, it is expected that $54 billion is lost due to destruction caused by hurricanes and the
flooding that often accompanies these storms (Congress of the United States, 2019). In 2019,
82,697,827 people were affected by hurricanes in the United States and its territories (US Census
Bureau, 2019). These storms not only have a financial impact, but these citizens of these coastal
areas spend a significant amount of time preparing for these storms, evacuating to be out of
harm’s way, and waiting the storm out. After the storm passes through the area, citizens must
wait for utilities to be restored to return to their home and then clean up their property and repair
the damages the storm caused to their home. This process can take more than a week depending
on storm speed, travel time to evacuation shelter, and duration of flooding and rain after the
actual storm passes. Schools, from colleges to local elementary schools, are shut down, grocery
stores are closed, and residents are asked to stay home. Because of this, a hurricane and its
associated evacuation can be a drawn out and hazardous process.
Evacuations have been a part of life since the beginning of time. In the first century, the city of
Pompeii, located in present day Italy, was evacuated due to the eruption of Mount Vesuvius;
many Pompeiians were fleeing from the area surrounding the volcano as debris from the
volcano, starting with the fine-grained ash began to settle (History.com Editors, 2010). As a part
of World War II, 338,000 British and French troops were evacuated by boat from Dunkirk to
England after Germany invaded northern France (Britannica, 2020). The twentieth century
concluded with Hurricane Floyd and three million people moving away from the coast and path
of the storm. In the 2000’s, evacuation orders were issued for Hurricane Frances, Katrina, Rita,
and Gustav. In March of 2011, the Japanese government ordered approximately 70,000 residents
who lived close to the Fukushima nuclear power station to evacuate due to the unsafe radiation
11
levels (McCurry, 2011). Most recently, people have been evacuating from wildfires in the
western United States and Canada. Although evacuations are nothing new, little progress has
been made in improving their efficiency.
One major concern during an evacuation that could be improved to help efficiency is traffic
congestion. When Hurricane Katrina hit the city of New Orleans, about 100,000 people, a
majority who could not evacuate on their own, were stuck inside the city during and after the
storm hit. The city had a plan to evacuate these people, but the congestion that still existed on the
highways exiting the cities hindered this plan (Sullivan, 2005). Hurricane Irma is one of the most
powerful Atlantic Ocean hurricanes in recorded history. It caused almost 7 million people in
Florida, Georgia, and South Carolina to evacuate from their home (Florida Association of
Counties, 2017). Obviously, this caused very large traffic jams on the main north-south highways
in the southern part of the United States. Miami International Airport saw a 30 percent increase
in the number of flights the Thursday before the storm hit (Florida Association of Counties,
2017). The evacuation process overloads the transportation system, leaving very little option
other than sitting and waiting for the vehicles further north to move and letting the queue
dissipate.
In more recent years, it seems the number of intense and destructive storms is on the rise.
Worldwide, the tropical catastrophes, like hurricanes, are becoming more frequent and impactful.
This includes the recent hurricanes of Harvey, Irma, Maria, Florence, Michael, and Dorian.
(Associated Press, 2020). According to the Center for Climate and Energy Solutions, scientists
do not know for certain the impact climate change will have on the number of hurricanes, but the
experts have more confidence that warmer oceans and sea level rise, symptoms of climate
change, would increase the intensity and devastation caused by these storms (Hurricanes and
12
Climate Change, 2020). Climate change can be attributed to human expansion and specifically
the greenhouse effect. The increased concentrations of greenhouse gases have been caused by
burning fossil fuels, like coal and oil (The causes of climate change, 2010). From this, activities
like driving automobiles and clearing land for human activity increase the concentrations of
greenhouse gases (The causes of climate change, 2010). This is important to note because every
time a large, strong, intense storm comes, residents are evacuating in their cars, creating
additional greenhouse gases. Not only are resident making a long trip when evacuating, but they
are also often sitting in congestions. According to Barth and Boriboonsomsin, when traffic queue
and congestion increases, fuel consumption as well as CO2 emissions increase as well (2009).
This cycle could rapidly become an issue as storms becomes stronger and more residents
evacuate for each of these storm events.
The Florida Keys is an archipelago consisting of many, small islands off the southeast coast of
Florida. As of the 2010 Census, the population of this area is approximately 73,043 (United
States Census Bureau, 2011). The evacuation process is critical in coastal, densely populated
areas because nearly every member of the community is required to evacuate and use the same
transportation facilities. These facilities were not designed to handle the entire area’s population.
This problem is magnified even further in the Florida Keys because there is only one road, US-1,
that connects all the islands and provides access to mainland Florida. This creates a significant
problem because all 73,043 residents plus a significant tourist population must use the same road
and exit point. In addition to this, when US-1 returns to mainland Florida, the outlet is in Miami-
Dade County, which is another densely populated area that has evacuation struggles of its own.
Residents of the Florida Keys must be especially cautious when creating their evacuation
timeline to make sure they are not still stuck in traffic when the hurricane hits.
13
The Fall 2017 evacuation due to Hurricane Irma is often referenced as the largest evacuation in
the history of the United States. About one-third of Florida’s residents were placed under
mandatory or voluntary evacuation orders (Marshall, 2019). People took these orders and
Hurricane Irma seriously for various reasons. First, Hurricane Irma had already destroyed many
island communities including known deaths from the storm crashing into the U.S. Virgin Islands,
Puerto Rico, and other various Caribbean islands (Savransky, 2017). In addition, this hurricane
was the fifth strongest storm ever recorded in the Atlantic Ocean. So many residents of Florida
had to evacuate because the “cone-of-uncertainty” was inclusive of most of the state of Florida.
The storm’s path predicted destructive storm surge to nearly all of Florida’s coastal areas – the
home to a majority of Florida’s residents.
As mentioned above, one of the reasons so many Florida residents evacuated was due to the
large cone of uncertainty. The National Hurricane Center predicted, 67 hours before landfall, that
Hurricane Irma would be Category 4 storm when it strikes southeast Florida and then continue
up the eastern coast. The predicted path 46 hours before landfall shifted to make initial landfall
in the Florida Keys and then continue moving up the west coast of Florida (United States
NOAA, 2017). Because of this uncertainty of the storm’s path, it is thought that residents on both
coasts of the state evacuated, creating one of the largest evacuations ever in the United States.
Hurricane Irma made landfall in the Florida Keys – near Cudjoe Key – on September 10, 2017 at
approximately 9am as a Category 4 hurricane. Landfall on the mainland occurred later that
afternoon, right before 4 pm, just south of Naples, FL as a Category 3 hurricane (Jansen, 2017).
Hurricane Irma left 65% of homes – 6.7 million homes – in the state of Florida without power
(O’Conner, 2017). 75 Floridians died from this storm and cost residents approximately $49
14
billion (Wile, 2017). The lower Florida Keys were closed for 3 weeks following Hurricane
Irma’s initial landfall in their community (Associated Press, 2017).
Because of the unique geographical situation of the Florida Keys and the devastation that can
occur in the Florida Keys, additional research needs to be completed to provide
recommendations to the local emergency response teams for improvement in the evacuation
process. The overall goal is to better understand the evacuation process in the Florida Keys, FL.
This is achieved by building a model of the Florida Keys and modeling various improvements.
Network performance measures, clearance time, and vehicle emissions are analyzed. The results
of this analysis are then used to determine feasible, effective recommendations for the local
governments in the Florida Keys.
This research contributes to the body of knowledge in two different ways: model calibration and
emission estimates. The model calibration in this research uses traffic counts and population
census tract data to determine trip generation, trip distribution, and vehicle occupancy in one
step. This process is further discussed in the methodology portion of this thesis. In addition, this
research analyzes the greenhouse gas emissions produced by idling vehicles during the hurricane
evacuation. This is also analyzed for the recommendations that are also modeled to determine
which methods help reduce vehicle emissions. The results from this analysis can be found in the
results portion of this thesis.
15
2.0 LITERATURE REVIEW
Prior research provides an exploration of many different aspects and parts of an evacuation and
the analysis completed to understand this process. The research included varies by source and
date of publication to ensure a variation of information and ideal is included. The following
topics are presented throughout this literature review: Basics of Evacuations, Evacuation
Modeling and Decision Analysis, Explanation of Assumptions and Methodology,
Recommendations for Network Improvement, and Hurricane Evacuations and the Environment.
2.1 Basics of Evacuations
Hurricane evacuations are a repeatedly studied topic, so significant amounts of research has been
conducted. This section provides a discussion on critical points for analysis during emergency
scenarios, the operations of roadways during evacuations, and the roadway conditions that affect
the evacuation. These are all important topics to discuss and consider when conducting research
on hurricane evacuations and help readers better understand these traffic phenomena.
Coastal communities face many different threats including sea-level rise, severe weather, and
climate change. To overcome these events, communities hope to become resilient, which is
defined as “a community’s ability to prepare and plan for, absorb, recover from and adapt to
stressors from acute and longer-term adverse events” (Evacuation Behavior and its Mobility
Impacts in Coastal Communities from Across the Nation). Orderly evacuations help these
communities overcome the negatives of these unpredictable events. Evacuations help to reduce
damage to property and reduce both injury and death (Evacuation Behavior and its Mobility
Impacts in Coastal Communities from Across the Nation). The relationship for evacuees between
time and space provide an understanding of the movement of people and their vehicle’s during
an evacuation. This project focuses on the travel flow principles that govern the evacuation
process and the impact this has on the community. From this information, better plans can be
16
made, and resources can be used to provide a safe and efficient movement of the community’s
people and goods. The goal of this thesis is to provide recommendations to the improve the
evacuation procedure in the Florida Keys, which is similar to the goal of the research already
conducted.
Researchers from University of South Florida are using big data to look closely at the operations
during Hurricane Irma and the Woolset Fire in California to study the patterns of vehicles in
terms of both time and space to determine the overall performance of the transportation network
(Menon et al., 2020). The goal of their research is to establish a baseline of evacuation traffic
patterns including major roads with heavy gridlock, locations of bottlenecks and places of low
travel speed and the associated high travel time. This helps emergency managers by providing
them with the necessary traffic information prior to deciding to issue an emergency evacuation.
This study is very timely due to the California wildfires and the intensification of hurricane
season that is predicted due to environmental changes in the coming years for Florida. This
increased intensity and frequency of Florida is one of the reasons the study of the Florida Keys is
crucial. In this thesis, a baseline is determined, and recommendations provided.
The bottlenecks and slow speed make the evacuations take a long period of time for vehicles to
be running and burning fuel. Because of this, most evacuees attempt to fill their car with gas
prior to leaving, causing gas stations to have run out of gas and a fuel shortage. This is
compounded with the need for gasoline to get goods and supplies into the disaster area. The
Center for Advanced Transportation Mobility is managing a project that’s goal is to create a
predictive model of these fuel shortages during a hurricane and its associated evacuation. This
model used epidemic spread models and applied the principles to fuel shortages at the city and
state level, traffic counts from past hurricanes, and a Monte Carlo fuel consumption model to
17
achieve this goal. This model and existing policy was analyzed to as well. (Multiscale Model for
Hurricane Evacuation and Fuel Shortage). Ultimately, the policy that is created aids in getting
evacuees the gas they need which provides a safe and efficient evacuation. Fuel plays a critical
role in the evacuation process and is especially important in an area like the Florida Keys
because there are a limited number of gas stations and no way for additional gasoline to arrive
during the evacuation process due to the lack of route choice between the islands.
In addition to the fuel shortage, which can leave motorists stranded, there are other events that
can occur that also keep evacuations from running smoothly. One of these is traffic incidents.
The goal of this study is to assess the impact of traffic incidents in hurricane evacuations. This
was achieved using a predictive layout of approximately 40 traffic incidents with different
characteristics. These conditions, like the severity, duration of delay, and location, were
determined from estimated of total vehicle miles traveled on the roadway segment and historical
values from peak period travel (Robinson et al., 2018). The findings of this study show that
traffic accidents extend the travel time for individual vehicles but does not extend the overall
time needed to clear the evacuation area. This is important to note because the model of the
Florida Keys in this thesis does not include traffic accidents, but that is not the focus of this
study.
These traffic incidents often cause bottlenecks which limit the network capacity and increase the
travel time for evacuees. If the potential bottleneck areas are identified, the efficiency of the
evacuation can be improved by reducing or even removing the bottlenecks. To identify the
network bottlenecks, the following steps were followed: use a kinematic wave model to
determine traffic flow state spread and updating, predict the demand of the evacuation using a
hurricane evacuation response curve, and finally determine the links that are bottlenecking the
18
network as evidences by the mean and variance of the degree of congestion (Lu et al., 2017).
This allows the travel time distribution for areas with a bottleneck to be analyzed. From this,
recommendations can be made to improve the evacuation. In the model of the Florida Keys,
location of bottlenecks are identified, and recommendations chosen that help eliminate these
bottlenecks.
Because of these bottlenecks and traffic accidents, the route evacuees choose to take can
drastically change the travel time for an evacuee. Most evacuees often stay on primary roads and
arterials but using the secondary and other low volume roads could provide an advantage. After
the Hurricane Katrina evacuation, which had its challenges, Louisiana state transportation and
law enforcement officials created a plan to best use the evacuation routes in the state to their
highest capacity (Wolshon & McArdle, 2011). Wolshon and McArdle performed a similar
analysis as the state officials on the secondary and low volume roadways to determine how
traffic was dispersed, how long impacts lasted, and the areas most highly affected. The results
from this analysis found that numerous evacuees during the Hurricane Katrina evacuation used
smaller roads, not the main evacuation routes, as their main path to leave the area than originally
predicted (Wolshon & McArdle, 2011). These secondary roads were often used by evacuees that
were traveling to destinations not easily accessible by the highway network. This is valuable
information when modeling an area that has many routes to the destination. Evacuees from the
Florida Keys only have one route option, which simplifies the model.
During a hurricane evacuation, not only do drivers pick non-regularly driven routes, but they
drive in non-normal ways. The Highway Capacity Manual provides methods to determine the
level of service and other measures of traffic flow under non-emergency conditions. But
traveling during a hurricane evacuation is not a normal condition. This was proven using existing
19
traffic information form Hurricanes Ivan, Katrina, and Gustav to anlyze the similarities and
differences in traffic characteristics between emergency evacuation operations and routine, daily
travel (Dixit & Wolshon, 2014). It was found that there is a significant difference in traffic flow
and vehicle relations when operating in evacuation conditions in comparison to non-emergency
operations (Dixit & Wolshon, 2014). Therefore, values that indicate the level of operation need
to be measured in different ways. Wolshon and Dixit introduce two quantities: maximum
evacuation flow rates (MEFR) and maximum sustainable evacuation flow rates (MSEFR).
MEFR represents the true capacity of the road during a hurricane evacuation. This is important to
note because a modeling software outputting a level of service (LOS) based on the Highway
Capacity Manual standards does not represent conditions accurately. It does still provide a
quantitative value to rank different segments, but LOS A on a road under normal conditions is
not the same as LOS A under emergency conditions. In both situations, LOS B on respective
conditions is worse.
In addition, because the traffic dynamics are different, it is expected that driving behavior is
altered during these emergency situations as well. Prior research has exemplified that driving
behavior when evacuating is different than daily, commuting driving behavior (Yuan et al.,
2014). The problem with this is that there is a transition period, between normal conditions and
traffic flowing under emergency conditions, that has not really been studied. This phase is
complicated because the drivers obtain instructions and information at different times, from
different communication modes, and at different level, which may cause different drivers to be
switching from daily driving behavior to emergency driving behavior at different times (Yuan et
al., 2014). This research uses a new open-source microscopic simulation platform where driver
characteristics and behavior can be specified and is influenced by the traffic management
20
strategies used. From various simulations of this model, it was found that a short transition
period improves the network performance which indicates that management strategies and
various traffic control plans can impact evacuating drivers’ behaviors, to ultimately improve the
efficiency of the evacuation (Yuan et al., 2014). This indicates that most modeling software does
not represent this transition period effectively. For the Florida Keys model in this project, this is
not a huge problem because the only comparisons that are made are between simulations of the
same model. Problems arise when comparing a model to the real-life conditions.
Prior conducted research provides information about the basics of evacuations, the fundamentals
of analysis of these events, operational characteristics, the routes drivers chose to use, and the
conditions that can impact these evacuations. This information does not highly affect this project
that analyzes evacuations in the Florida Keys, but it provides insight and background to better
understand the process that is occurring. In addition, the research completed on the Florida Keys
provides new research because of the unique geographical qualities of the project study area.
2.2 Evacuation Modeling and Decision Analysis
Every family unit decides whether they evacuate based on many different criteria. Once the
decision is made to evacuate, how, when, and where to they evacuate must also be decided. Prior
research, that is discussed below, provides insight into how and why people make the decisions
they do, the variables they take into consideration, and how this affects the evacuation process.
Each hurricane and evacuation event provides an opportunity to grow the knowledge base of
evacuee decision making and the factors that influence the choices affected individuals make.
Emergency planners can learn a lot from studies of this information.
After Hurricane Irma, which made landfall in Florida in 2017, researchers from University of
California Berkeley conducted an online survey across the state of Florida, targeting areas
21
heavily impacted by Hurricane Irma. The goal of this survey was to determine behavior of
evacuating individuals and the outside circumstances the affect the choices these people make
before, during, and after a natural disaster (Wong et al., 2017). Wong et al. analyzed the survey
data using descriptive statistics and discrete choice models. It was found that 31% of people who
were in a mandatory evacuation zone did not evacuate. 46% of people who were not required to
evacuate did ultimately evacuate. 42% of evacuees leave three or more days before landfall with
an even spread of evacuation departure times (Wong et al., 2017). This information provides a
good overview for emergency planners. The Florida Keys is often under a mandatory evacuation,
so it would be expected that approximately 69% of people are evacuating. This provides an
indication of the number of people that are evacuating and should be included in the model.
Yang et al. (2016), explored the relationship between various contributing factors and the
decisions made regarding the evacuation (2016). This study was unique because it used structural
equation modeling to determine the interrelationship between response behaviors. Data from a
survey conducted in New Jersey used Bayesian estimation approaches and concluded that the
reason for evacuating, whether it was the person’s choice or an order to leave the impacted area,
did not change the location a person would move to (Yang et al., 2016). This is important to note
because whether a mandatory or voluntary evacuation occurs, the destination of the evacuees is
the same. This does not majorly affect the Florida Keys because the model likely does not
include the final destination.
In 2017, Maghelal et al. investigated the qualities that impact a family or household’s choice to
evacuate in multiple or one vehicle. This information would help emergency planners and local
government predict how many vehicles are on the roadway and create policy that aid in efficient
and timely evacuations. Using a typical least square regression analysis, indicated that number of
22
registered vehicles and number of licensed drivers were each significantly and positive related to
evacuating in more than one vehicle (Maghelal et al., 2017). The major deterrent of evacuating in
multiple cars was the risk of the entire party not safely reaching the destination. When a family
decided to evacuate and the time the family actually left did not influence a family’s decision to
evacuate in multiple vehicles (Maghelal et al., 2017). This is interesting to note because the
initial model of the Florida Keys in this project was performed as if each citizen drove a vehicle
out of the evacuation. During the calibration and validation process, this is scaled back to
appropriately match the number of vehicles traveling. From this research, no matter when the
decision to evacuate is made or the timing of the evacuation do not affect the number of vehicles
a family uses.
As the storm’s intensity varies or the path changes, many of the variables discussed above also
vary. One of the main variables affected is roadway accessibility. In 2020, a study was conducted
that considers both dynamic evacuation demand and the variance of this in relation to the
characteristics of a hurricane. Every six hours, the demand in number of vehicles per household
in each sub-county is considered with the hurricane’s radius and track. A model was then run
with the new data which produced the potential crowdedness index (PCI). This then provides
road accessibility in each area (Zhu et al., 2020). This method was applied to the entire state of
Florida during Hurricane Irma in 2017. Results indicate that in Florida significant congestion
occurs on I-75 and I-95 during a hurricane evacuation. Sub-counties around northbound I-95 face
the worst road accessibility in the study area (Zhu et al., 2020). This is expected because both
roadways are large intersections that flow in the north south direction. It is expected that
evacuees from the Florida Keys would take I-95 further north. This is not a part of this project’s
study area, but still important to note.
23
Gehlot et al. analyze a similar topic – the relationship between evacuation departure time and
travel time. They created a model to estimate both travel times and their related departure time
during a hurricane evacuation. Results indicate the importance of the relationships between the
evacuating vehicles and the different levels of these relationships (Gehlot et al., 2019). In
addition, social networks play a significant role on travel times and evacuation departure time
during a hurricane. This is important to the Florida Keys evacuation model because it confirms
what the model indicates: travel times vary depending on when an evacuee leaves.
To take this a step further, Lindell et al. studied household evacuation time estimates (ETEs) for
hurricanes. The study compared data from various surveys analyzing times for various tasks
including expected task completion times, actual completion times, and departure delays. From
these surveys and analysis, it was found that demographic variables poorly predict preparation
times, but rather storm characteristics and personal impacts affect household evacuation
preparation times significantly (Lindell et al., 2020). This is important to note because the model
that represents the Florida Keys does not need to be shifted to accommodate different
demographic areas. If the storm characteristics were to change, this could change the flow of
vehicles, but it would shift the entire model – not just one census tract or city limits.
Many of the studies above collected data via survey and used that information to build models or
understand the relationship between variables that affect how and when people evacuate. In
2019, Roy and Hasan followed a similar process, but used geo-tagged tweets to gather this
information. More specifically, “The authors develop an input output hidden Markov model (IO-
HMM) to infer evacuation decisions from user tweets during a hurricane. To infer the underlying
context from tweet texts, the authors estimate a wod2vec model from a corpus of more than 100
million tweets collected over four major hurricanes” (Roy & Hasan, 2019). This information was
24
validated by analyzing tweets from Hurricane Irma and comparing it with the outcomes of
studies with more traditional data collection methods. From the analysis of Twitter data,
information about decisions made, and when and where people evacuate to can be concluded.
This method is significantly cheaper and can be performed as the natural disaster occurs,
changing the process of analyzing evacuee decision making data forever.
Another factor often analyzed when analyzing when, why, and how citizens evacuate is if and
when an evacuation order or notice is issued. As in some of completed studies above, models are
used to analyze how and when people make decisions. In 2017, Gudishala and Wilmot created a
model to predict the actions of an emergency manager including if and when the manager would
put forth an evacuation order to the local communities in relation to the storm threat. A discrete
choice model was created and used decisions made in the past by evacuation managers to
determine the variables that affect the decisions these people make. Five variables - storm surge,
clearance time, time to landfall, hurricane category, and time of day – influence if and when an
evacuation manager would issue a mandatory evacuation. This model provides a resource –
almost a guide – to emergency managers as to the decision other managers would make. Every
area is different, and each manager knows their area, but it would provide guidance and another
data point to consider in a high stress situation. This information is beneficial to other researchers
because it provides additional insight into the evacuation process and evacuee behavior.
As discussed above, emergency managers have a difficult task of knowing when and how to best
issue an evacuation order. Research was conducted to improve the process of issuing an
evacuation order when considering the evolution of the storm and the complex reaction to the
everchanging storm (Yi et al., 2017). This was achieved in a case study of eastern North Carolina
via progressive hedging and bi-level programming. The outcomes of this analysis found how
25
important it is to make decisions based on the rapidly changing qualities of the storm rather than
static policy. In addition, the relationship between “behavioral models for evacuation decision-
making with dynamic traffic assignment-based network flow models in a hurricane context”
provides valuable insights (Yi et al., 2017). This information ultimately helps evacuation
mangers make better decisions and ultimately create safer evacuation for the masses.
All the information discussed in this section analyzed data from events in the past to better
understand the evacuation process. A group of researchers wanted to predict evacuation rates for
future events. To achieve this, survey data from 2011 and 2012 in North Carolina was used to
create the prediction model. The model predicts at the individual household level using cross
validation and data from previous hurricanes – Irene, Isabel, and Floyd – at the aggregated level
(Xu et al., 2016). Overall, the model correctly predicts a household’s evacuation behavior about
70% of the time. This can be useful to predict the need for additional infrastructure and could be
used by researchers when building models to predict future evacuations.
Significant research has been conducted on hurricane evacuation modeling and the decisions
evacuees make. This research provides the needed background information to better understand
the evacuation process before masses of people enter the roadways. Every evacuation event takes
provides data that can be analyzed. Evacuation managers can learn from this and use models
built to help predict if and when evacuation orders should be issues. This research on the Florida
Keys builds on the existing information in this field by providing an analysis of the peak
evacuation hour as well as analyzing when delay and other network performance e measures are
maximized.
26
2.3 Explanation of Assumptions and Process
As read about above, building a model and simulating an evacuation is not uncommon or new.
These models provide valuable information for events that occur irregularly. Models are often
used to analyze the traffic movements and decision making in a small area. More recently,
studies have been performed using the same modeling techniques on a large, regional scale. The
outcomes of these models provide different information and points of analysis. The Florida Keys
is a large area, and a microscopic model of the network is being conducted, so information on
this process is discussed below.
In 2015, Zhang and Wolshon wanted to analyze an evacuation event than spanned multiple
cities, during several days. The goal of this research, Megaregion Evacuation Traffic Simulation
Modeling and Analysis, was to analyze the traffic operations and route assignments for the
region and even provide recommendations to improve the network’s performance. In order to
achieve those goals, they created a mega region in a micro-level traffic simulator (Zhang &
Wolshon, 2015). After building the model and simulating the evacuation, Zhang and Wolshon
concluded that operational qualities shown in the model capture the main elements of the
roadway network and provide both useful and logical results. In addition to this, the microscopic
model of the megaregion was able to exemplify the positives of traffic management strategies
that are proactive (Zhang & Wolshon, 2015). This finding indicates that the model that is built
and analyzed for the Florida Keys is going to produce reliable results. The paper concludes with
the idea that information and process from the research can be adapted for other locations with
many different qualities like road network, population, hazards and resources (Zhang &
Wolshon, 2015). This microscopic model of the Florida Keys, a megaregion, should do exactly
that.
27
Parr joined Zhang and Wolshon to further analyze the concept of micro-level analyses being
performed for a megaregion hurricane evacuation. The outputs of micro-level models are very
specific and provide significant amounts of data for every critical point in the megaregion.
Because of this, the goal of this paper by Parr et al., was to numerically explain and describe the
network productivity during an evacuation and the operational conditions the create these
scenarios (2017). Maximum production, which is directly related to trip completion, is achieved
when the modeled network reaches the largest number of vehicle-miles traveled in a set time
interval. From analysis performed, it was found that “productivity exhibited a peaking
characteristic” which suggests that it can be maximized on a large scale as a function of demand
(Parr et al., 2017). Therefore, if demand is maximized, the network is performing at its maximum
production. Because of this, emergency managers can encourage and plan for use of the roadway
network at its demand level throughout the evacuation (Parr et al., 2017). When the optimal
demand is exceeded, delays and traffic congestion occur, increasing the needed travel time to
evacuate. If the network is operating below optimal levels, productivity is decreased, and fewer
trips completed for a given time interval. The goal of modeling the Florida Keys in this paper is
to find evacuation management strategies and optimize the network model and find maximum
production.
Once the model is built, it must be calibrated to reflect the traffic conditions of the actual
roadways. Montz and Zhang, provide a structure and guidelines for the calibration and validation
of regional-scale evacuation models. The model built for this project is a regional-scale model,
so the calibration and validation techniques discussed are applicable to this thesis. The main
aspects of the of model are calibration of traffic assignment and validating the flow of vehicles in
the network using observed evacuation data (Montz & Zhang, 2015). Calibrations should attempt
28
to “determine parameter values that would result in the most realistic traffic assignment by
comparing assignment results with real-world traffic flows” (Montz & Zhang, 2015). Because of
the unique geographical characteristics of the Florida Keys, there is only one option where
vehicles can decide which route to take. This simplifies the calibration techniques needed for this
model. Validation of the model shows the need for background traffic in the model (Montz &
Zhang, 2015). Background traffic will be accounted for in the validation process using observed
traffic counts during an evacuation, just as recommended by Montz and Zhang.
Using a microscopic model to analyze a megaregion is an accepted practice. The maximum
production of the model can be determined by finding the optimal demand, which ultimately
provides guidance to local agencies on conducting the most efficient evacuation. These models
must be calibrated and validated to ensure they provide results that mirror the existing traffic
conditions during a hurricane evacuation. Very little completed research uses real-world traffic
counts to calibrate the model. This is one of the advancements this paper makes to the body of
knowledge. Ultimately, the information from the conducted research provides guidance and
confirms that the modeling decisions used in this project are sound and produce reliable results.
2.4 Possible Improvements
After building a model of the Florida Keys and verifying it using real world data, the model is
altered in hopes of improving congestion and reducing the impact the evacuation has on the
environment. The ultimate goal of this research is to provide the local agencies managing the
evacuation with ways to improve travel time, reduce bumper to bumper traffic, and improve the
safety of this process. To do this, the calibrated model is altered to determine if a method is
efficient given the unique qualities of a coastal, island chain community. Research has been
29
conducted about various methods from improving vehicle flow during an evacuation and is
discussed below.
Intelligent Transportation Systems (ITSs) are becoming very popular in the transportation
industry right now. These systems are based on the newest technologies including signs that
change display and modifying signal timings when different roadway conditions occur. These
changes in condition could be caused by the time of day, the weather, locations of accidents or
construction, and special events that could cause increase of roadway users. ITS takes the road
from being a stagnant entity to being a living and changing user experience. Incorporating an
intelligent transportation system into an emergency evacuation plan creates the chance to
improve both the efficiency and therefore the effectiveness of the evacuation instantaneously
(Real-Time Recommendations for Traffic Control in an Intelligent Transportation System during
an Emergency Evacuation – Part 2). If an IT system were implemented in the Florida Keys, after
the first hurricane evacuation using the system, the data could be collected and could be put
through machine learning algorithms to be combined with optimizations models to create more
efficient traffic control plans (Real-Time Recommendations for Traffic Control in an Intelligent
Transportation System during an Emergency Evacuation – Part 2). Incorporating intelligent
transportation systems on a roadway provides real-time condition mitigation and improvement
and produces data to be analyzed for similar situation occurring in the future. Adding this type of
system to US-1 from Homestead to Key West could provide long and short-term benefit in the
many evacuations the Florida Keys face each hurricane season.
Contraflow is the concept of using a traffic lane for traffic to flow in the opposite direction of
surrounding traffic lanes. In an emergency evacuation where almost all road users are traveling
in one direction (away from the coast or location of danger), using contraflow lanes increases the
30
capacity of the road by providing more space for vehicles. Not many citizens are traveling
toward the point of danger, it is not a huge sacrifice to give up travel lanes going in this direction
and it makes sense to use them for travel in the opposing direction. Fries, et al. evaluate different
contraflow strategies during hurricane evacuations and their findings encourage the use of
contraflow during every evacuation (2011). The goal of this study was to determine the best
strategy or combination of strategies for evacuating along I-26 in Charleston, South Carolina. A
PARAMICS microscopic traffic simulator was used to determine the impact each combination of
strategies had on evacuee travel time and duration. The different combinations were various
levels of duration of evacuating (long, medium, and rapid) and number of lanes used in
contraflow (0, 1, 2, or 3). Using any amount of contraflow was found to significantly improve
the evacuation duration with the most success being found when using 2 or 3 lanes (Fries et al.,
2011). This is important to note when considering turning the southwest bound lane into a
contraflow lane in the Florida Keys because there is only one additional lane for a significant
part of the evacuation route. If operating only one lane of contraflow operations is not effective,
this may not be a realistic recommendation to make. In addition, essentially closing US-1 to
southwest bound traffic may be problematic if emergency vehicles are needed further south in
the Keys.
A similar option to contraflow lanes that is often employed in an evacuation where the number of
vehicles leaving the area is significantly more than the capacity of the road is the use of the
emergency shoulder. This makes logical sense because the road, as designed, cannot handle all
the cars trying to use it. So, local authorities allow the shoulder to be used as another lane which
increases the capacity of the road. This was used in September of 2017 in Florida to help move
Floridians during the Hurricane Irma evacuation. Emergency shoulder use was used for
31
approximately 39 hours of I-75 northbound and 6 hours on eastbound I-4 (Sharma et al., 2020).
Sharma et al. studied of the use of the emergency shoulder in this situation and then compared
with its operation with other alternatives. This study found that emergency should use could be
an effective alternative to contraflow (2020). One-way operation, also known as contraflow, is
problematic because it cannot be used at night, requires significant number of resources (cones,
police officers, electric signs), and limits the movement of first responders driving into the path
of the storm (Sharma et al., 2020). Left-hand emergency shoulder use is easy to implement and
provides little interference with existing operations. One of the main problems and points of
concern for citizens and evacuation managers is safety. So, using the left-hand shoulder as a
traffic lane needs to be safe and not increase the number of accidents on this roadway. This study
conducted a crash analysis and found that “the observed number of crashes on an urban I-75
segment during ESU operation is commensurate with normal operation with saturated traffic
conditions” Sharma et al., 2020). Overall, using an emergency shoulder is a reasonable way to
increase the capacity of the road without creating an unsafe environment for roadway users.
Using the model, the benefit of using the emergency shoulder could be seen, but additional
analysis of the as-built plans and a field review would be needed to verify that using the shoulder
as a travel lane is feasible.
Another possible improvement strategy that could be used on US-1 to improve the evacuation
process from the Florida Keys is a gate control strategy. This method is optimal for use when
people in a small, localized area, also known as Protective Action Zones (PAZs), must be
evacuated quickly and with short notice. Vehicles at nodes on PAZ boundaries are where gates
will be implemented are given a higher priority than vehicles at non-gate nodes (Wang & Bu,
2015). In this research conducted by Wang and Bu, an optimization process was used to
32
minimize total travel cost. The results from this show that the number of conflicts in both routes
and movement could help improve the network’s performance in an evacuation scenari (Wang &
Bu, 2015). This process was then used in a Case Study in the Mississippi Gulf Coast region and
it was found that “the gate control strategy could achieve an effective evacuation operation and
improve the performance of the evacuation by reducing average travel time in trip routes and
conflicting traffic movements compared with a non-gate situation where evacuation trips are
conducted based on “shortest paths” without a gate control strategy” (Wang & Bu, 2015).
Because of the success Wang and Bu found with the gate control strategy in this case study, in an
environment similar to the Florida Keys, it may be beneficial to implement this strategy in the
model of the Florida Keys and compare the effectiveness with other techniques.
Variable speed limit control (VSL) is an adaptive method to improve traffic conditions which
reduces safety risks and vehicular emissions. This method imposes changing and different speed
limits to each traffic lane based on events happening further ahead in the lane. For example, if an
accident occurred in the right hand lane ahead creating a bottleneck, the speed limit on the clear
lanes would reduce allowing the cars in the right lane to merge into flowing traffic without
having to reduce their speed significantly. This study conducted by Wu et al. uses a deep
reinforcement learning model to determine speed limits continuously for a large number of
points along a corridor (2020). Different variables including total travel time, bottleneck speed,
emergency braking, and vehicular emissions are analyzed when different speed limits were
enforced for different parts and lanes of the segment. From this model, this facet of an intelligent
transportation system knows the most efficient way to handle various situations that could occur
on the freeway and would change the speed limit signs on a freeway segment as needed to
improve operation. Ultimately, the results show that deep reinforcement learning based
33
differential variable speed limit control can increase the efficiency, number of crashes, and
impacts on the environment of a freeway segment (Wu et al., 2020). All these benefits would
make a significant difference on traffic flow operations in an emergency evacuation. In addition,
reducing speed on the roadway could be beneficial because slowing road speeds allows for
vehicles entering the roadway to need less space to accelerate and become part of the traffic
stream. Variable speed limit control could help keep traffic moving and reduce travel time during
an emergency evacuation.
Signalized intersections create a challenge in an emergency evacuation because a signal stops a
flow of traffic and provides access to the right-of-way to another group of vehicles. In normal
operations, this is effective because every stream of traffic has reasonably high demand. In an
evacuation, most vehicles are traveling in one direction and the other vehicles want to join this
high demand traffic stream. When not operating a signal as it was designed, the three most
common methods to use are “manual traffic control (MTC), flashing yellow signals, and crossing
elimination” (Parr et al., 2016). MTC occurs when a police officer sits at the intersection and
changes the light based on the current situation and demand. Flashing yellow signals provide the
mainstream of traffic with a flashing yellow light, so they do not have to stop. The minor
approach has a flashing red light so vehicles must stop and wait for an opening in the approach
before merging with the major approach. Crossing elimination removes right-angle conflicts at
intersections and only allows merging and diverging conflicts (Parr et al., 2016). This study
found that “MTC was best suited for intersections immediately upstream of a bottleneck or for
closely spaced, uncoordinated signals. Flashing yellow signals appeared to work well for
intersections with high, unbalanced demand and low volumes on the minor approach. Crossing
elimination strategies worked best when demand from nonconflicting directions was high and all
34
other approach volumes were relatively low” (Parr et al., 2016). During a hurricane evacuation in
the Florida Keys, there is an unbalanced demand of flow and volume between the major and
minor approaches indicating that some of these signal improvements could improve the
evacuation patterns of the Florida Keys.
2.5 Hurricane Evacuation and the Environment
Surprisingly, little research has been conducted on the impact hurricane evacuations have on the
local air pollution due to the emissions from vehicles. There is research that indicates how
various traffic management strategies affect the air quality and ultimately public health. A study
conducted in Dublin, Ireland found through an emissions model and a health impact model that
by reducing speed limits city-wide, an increase of deaths due to high concentrations of NO2
would occur (Tang et al., 2020). In a hurricane evacuation, as stated earlier, the volume of
vehicles is increased from daily operation and this causes a decrease in operating speed. This
natural decrease in speed due to higher capacity would have a similar effect as a decrease in
speed due to a change in the speed regulation.
A current solution to the negative impact vehicles have on the environment is electric vehicles.
In a hurricane evacuation, where the travel time is unknown and the final destination could be
hundreds of miles away, having an electric vehicle is not optimal. One of the main problems
comes from the lack of power during these times. One study found that during a hurricane
evacuation, Florida would have serious problems with power supply if most residents were
evacuating in electric vehicles because six of nine power authorities in central Florida are short
on power in the current evacuation patterns. This reliance on electric power to run a vehicle,
instead of gasoline, could “induce a cascading failure” throughout the state of Florida (Feng et
al., 2020). Solutions to this problem include improving battery performance and public charging
35
strategies. In addition, the use of hybrid vehicles would provide more flexibility in terms of
range, power source, and route choice during an emergency evacuation.
This thesis analyzes the impact of the current evacuation plan of the Florida Keys on the air
pollution levels due to vehicular emissions in the local community. The various alternative
strategies that were modeled were also analyzed for environmental impact and reducing air
pollution. This is a consideration, along with other measures of functionality and safety to
determine the best alternatives and plan to recommend as part of the evacuation plan. This study
provides more understanding of the environmental impacts of an evacuation as there is little
research already conducted in this field.
2.6 Conclusion
Research is lacking in the sense that hurricane evacuation models are rarely calibrated and
validated with traffic data from past storms – something this thesis achieved. There are a limited
number of studies that have used a microscopic model of this size and scope, so this study
provides additional support toward a unified methodology. This literature review failed to find a
significant body of knowledge on the impact evacuations have on local emissions and the
environment. This thesis adds to the body of knowledge and compares the outcomes from
simulations for each of the recommendations in various categories including emissions. This
provides an indication of the environmental impact of these evacuations on the air quality in the
Florida Keys.
36
3. METHODOLOGY
To provide a basis of measurement and comparison, this research seeks to develop a microscopic
traffic simulation model of the Florida Keys to evaluate various evacuation strategies. More
importantly, the research illustrates methods to measure and quantify evacuations in an unbiased,
practical, and repeatable fashion that is both intuitive and beneficial to state officials. Traffic
volume counts collected during Hurricane Irma serves as a calibration and validation parameter
for model development. Based on these ideas, the objectives of the research seek to better
understand the evacuation process of vulnerable communities in the Florida Keys, FL to assist in
the planning, mitigation, response, recovery, and adaptation of these areas from disasters. It is
also expected that the findings from this research can be extracted and applied to evacuations of
any hazard type or locations with similar geographical properties of the Florida Keys.
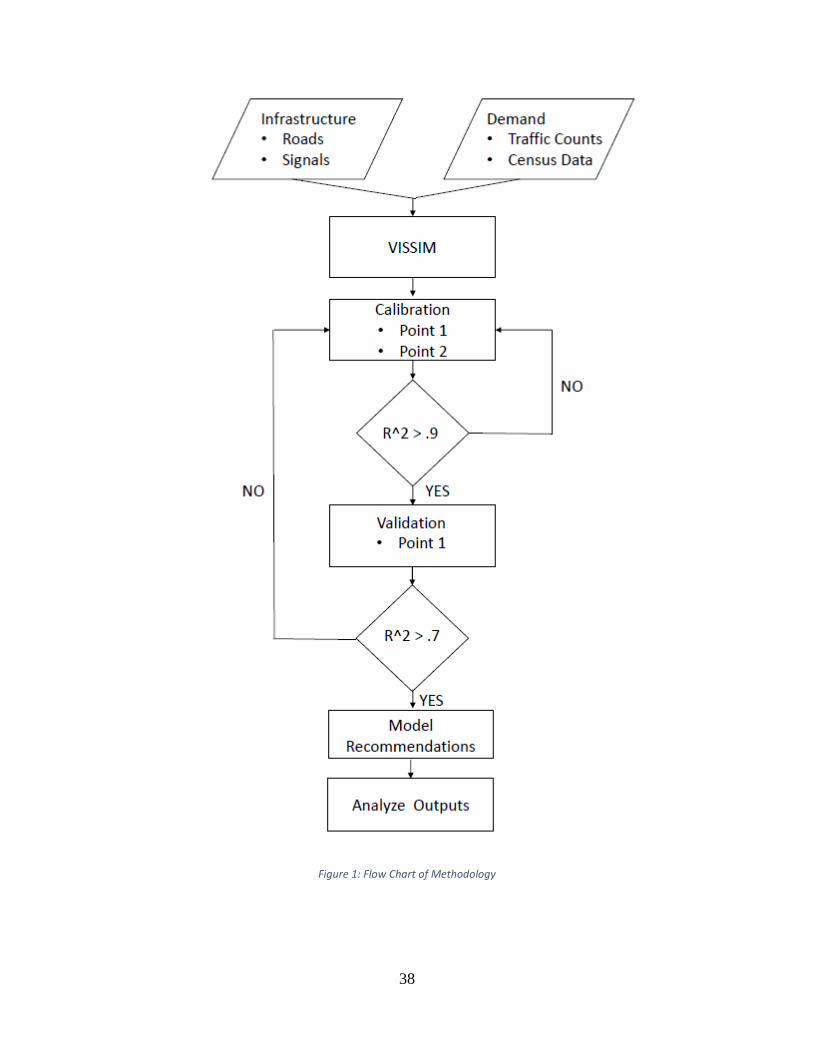
To achieve this, the following methodology is followed. Data collection and analysis of the
project study area occurs first. This research sets the basic parameters for building a microscopic
traffic simulation and the analysis that occurs. Then, the traffic simulation model is built using
VISSIM. This includes building the roadway network, addressing conflict areas, and including
proper signals and traffic control measures. Calibration uses population data and traffic counts to
accurately portray both the number of evacuees and their appropriate origins. The complete
model is then validated and compared to actual travel counts during an evacuation. This verifies
that the model is representative of the true physical, operational, and population-based
characteristics of the Florida Keys.
Once the model is calibrated, the model can be used for its intended purpose: modeling
recommendations for improvement of the evacuation process in the Florida Keys and estimating
emissions as part of a comparative analysis. The next step in this process is to research
37
improvements that could be modeled. This research and analysis determined which
improvements have the potential to be effective in the Florida Keys and ultimately which were
modeled. This process was conducted in the following steps: research, which was conducted in
the literature review, analyzing the feasibility of different improvements in the Florida Keys, and
determination of the improvements that were modeled in VISSIM. Once the improvements were
determined, they were each modeled in VISSIM. The existing condition model was then
modified to include these changes. Finally, each simulation of the improved evacuation of the
Florida Keys was analyzed in comparison to the existing conditions and other improvements.
The total time of the evacuation, the average travel time for a vehicle evacuating, and the
environmental impact of each improvement considered. The process outlined here can be seen in
Figure 1.
3.1 Data Collection and Analysis of the Project Study Area
To be able to build a model, calibrate the model, model improvements, and ultimately provide
recommendations for improving the evacuation process of the Florida Keys, data collection and
analysis of the existing conditions is needed. For this project, that takes many different forms.
This process is discussed below.
38
Figure 1: Flow Chart of Methodology
39
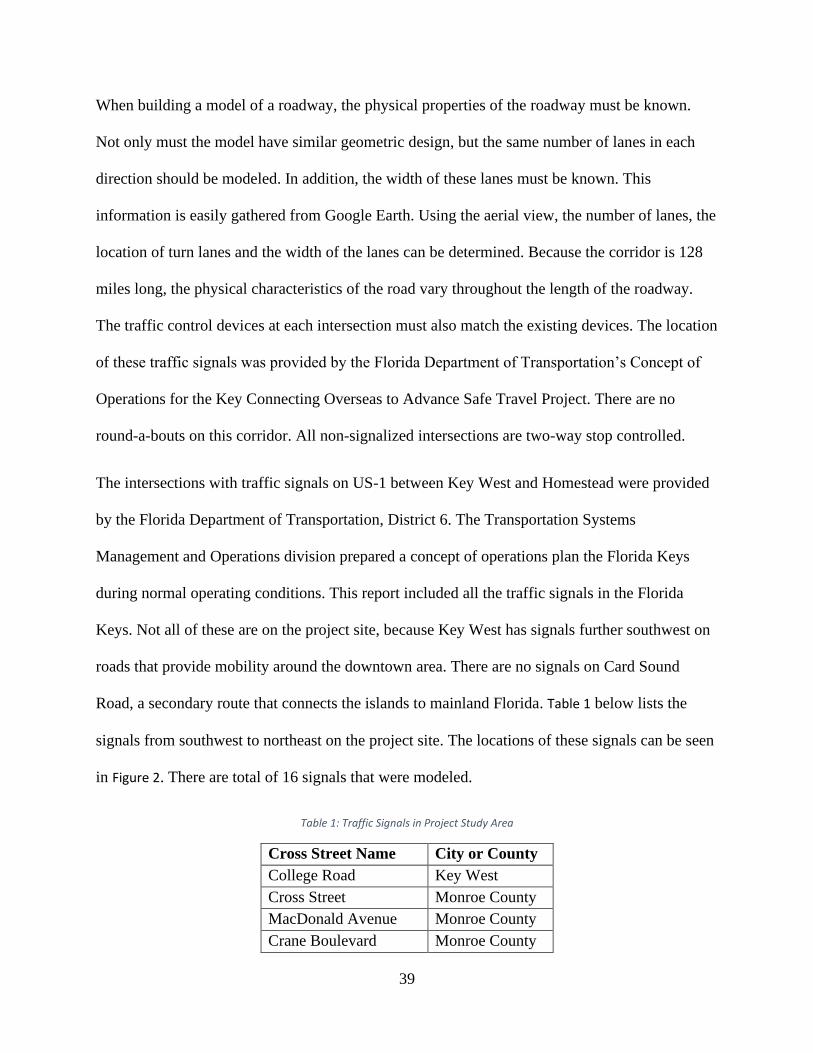
When building a model of a roadway, the physical properties of the roadway must be known.
Not only must the model have similar geometric design, but the same number of lanes in each
direction should be modeled. In addition, the width of these lanes must be known. This
information is easily gathered from Google Earth. Using the aerial view, the number of lanes, the
location of turn lanes and the width of the lanes can be determined. Because the corridor is 128
miles long, the physical characteristics of the road vary throughout the length of the roadway.
The traffic control devices at each intersection must also match the existing devices. The location
of these traffic signals was provided by the Florida Department of Transportation’s Concept of
Operations for the Key Connecting Overseas to Advance Safe Travel Project. There are no
round-a-bouts on this corridor. All non-signalized intersections are two-way stop controlled.
The intersections with traffic signals on US-1 between Key West and Homestead were provided
by the Florida Department of Transportation, District 6. The Transportation Systems
Management and Operations division prepared a concept of operations plan the Florida Keys
during normal operating conditions. This report included all the traffic signals in the Florida
Keys. Not all of these are on the project site, because Key West has signals further southwest on
roads that provide mobility around the downtown area. There are no signals on Card Sound
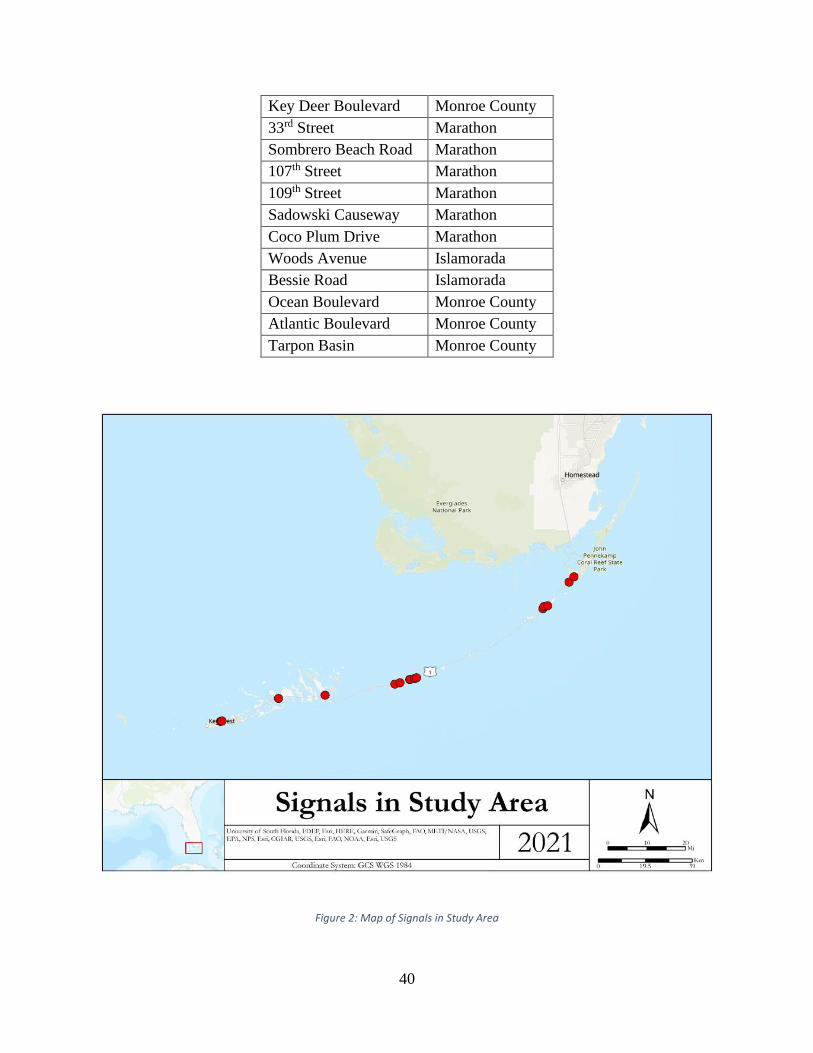
Road, a secondary route that connects the islands to mainland Florida. Table 1 below lists the
signals from southwest to northeast on the project site. The locations of these signals can be seen
in Figure 2. There are total of 16 signals that were modeled.
Table 1: Traffic Signals in Project Study Area
Cross Street Name City or County
College Road Key West
Cross Street Monroe County
MacDonald Avenue Monroe County
Crane Boulevard Monroe County
40
Key Deer Boulevard Monroe County
33rd Street Marathon
Sombrero Beach Road Marathon
107th Street Marathon
109th Street Marathon
Sadowski Causeway Marathon
Coco Plum Drive Marathon
Woods Avenue Islamorada
Bessie Road Islamorada
Ocean Boulevard Monroe County
Atlantic Boulevard Monroe County
Tarpon Basin Monroe County
Figure 2: Map of Signals in Study Area

41
Population data, along with traffic counts, are needed to know how many people are evacuating
from the Florida Keys. The number of users highly change the time it takes for the evacuation to
occur. The best way to determine the population is to analyze census data. This data is provided
for each census tracts. A census tract provides the data in small groups of homes that are used as
the origins for the evacuation model. Because of this, the boundaries of the census tract and the
population of that area must be collected for the project study area.
Population data was found on Florida Geographic Data Library Metadata Explorer and provided
by the U.S. Census Bureau. This downloadable data produces a shape file with population
information for every census tract in the state of Florida. There are 4,245 census tracts in the
state, but only 29 are included in the project study area. The information provided by this data
includes population, number, and percent of people in each age group, race information, gender
statistics, and number and size of households. The information extracted to create the model is
the population for each census tract. The population of each census tract can be seen in Table 2.
From this information, there is approximately 73,000 people who use US-1 as their evacuation
route.
Table 2: Population for Each Census Tract in the Project Study Area
Census Tract Number Population (as of 2010)
9702 1286
9703 2315
9704 3724
9705 2710
9706 1686
9707 2488
9708 3999
9709 1768
9710.01 1389
9710.02 1524
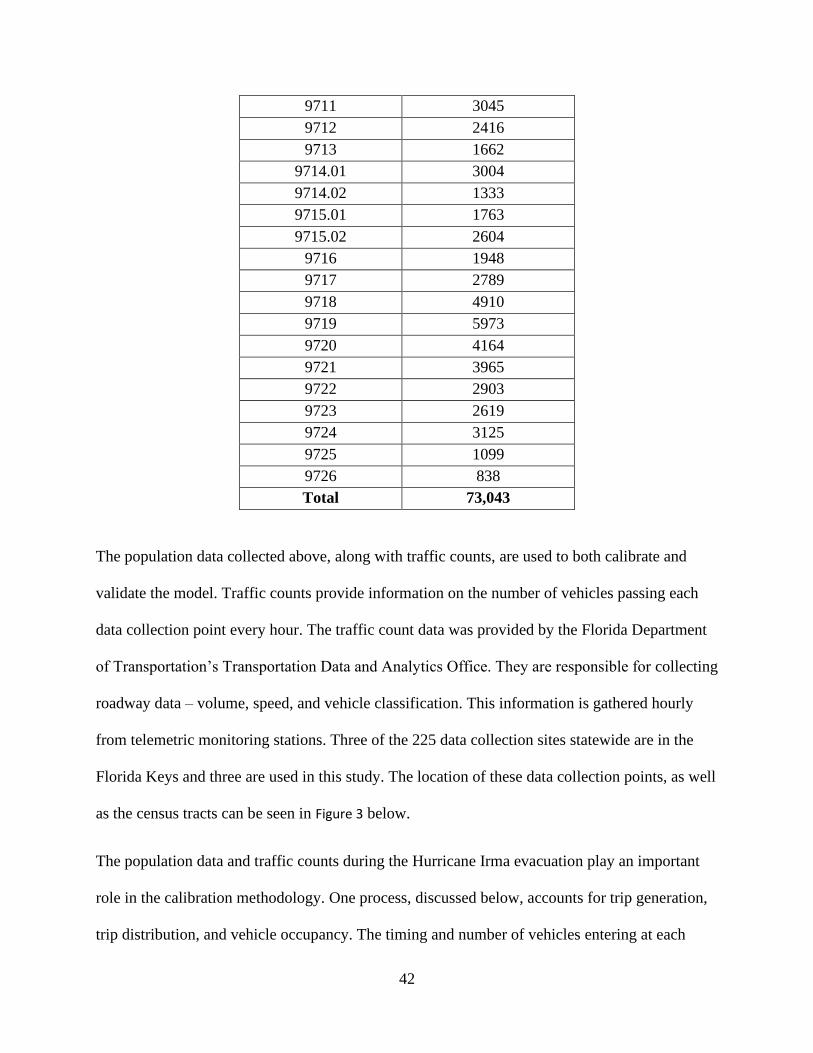
42
9711 3045
9712 2416
9713 1662
9714.01 3004
9714.02 1333
9715.01 1763
9715.02 2604
9716 1948
9717 2789
9718 4910
9719 5973
9720 4164
9721 3965
9722 2903
9723 2619
9724 3125
9725 1099
9726 838
Total 73,043
The population data collected above, along with traffic counts, are used to both calibrate and
validate the model. Traffic counts provide information on the number of vehicles passing each
data collection point every hour. The traffic count data was provided by the Florida Department
of Transportation’s Transportation Data and Analytics Office. They are responsible for collecting
roadway data – volume, speed, and vehicle classification. This information is gathered hourly
from telemetric monitoring stations. Three of the 225 data collection sites statewide are in the
Florida Keys and three are used in this study. The location of these data collection points, as well
as the census tracts can be seen in Figure 3 below.
The population data and traffic counts during the Hurricane Irma evacuation play an important
role in the calibration methodology. One process, discussed below, accounts for trip generation,
trip distribution, and vehicle occupancy. The timing and number of vehicles entering at each
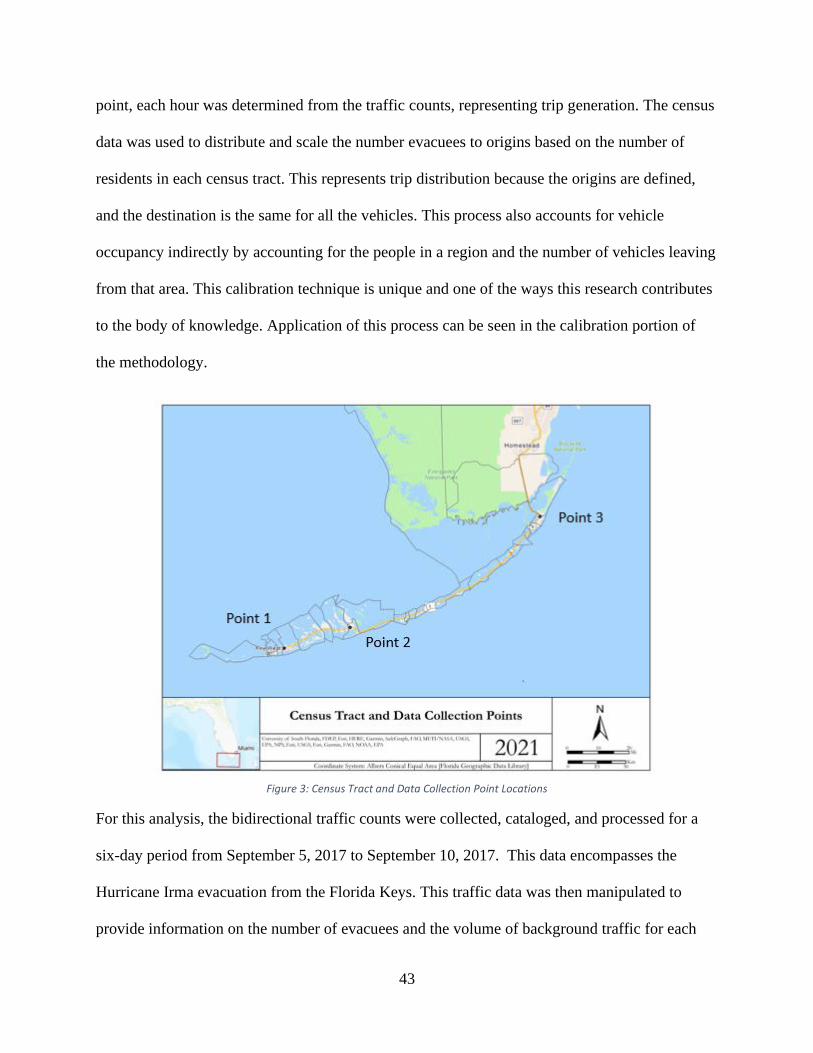
43
point, each hour was determined from the traffic counts, representing trip generation. The census
data was used to distribute and scale the number evacuees to origins based on the number of
residents in each census tract. This represents trip distribution because the origins are defined,
and the destination is the same for all the vehicles. This process also accounts for vehicle
occupancy indirectly by accounting for the people in a region and the number of vehicles leaving
from that area. This calibration technique is unique and one of the ways this research contributes
to the body of knowledge. Application of this process can be seen in the calibration portion of
the methodology.
Figure 3: Census Tract and Data Collection Point Locations
For this analysis, the bidirectional traffic counts were collected, cataloged, and processed for a
six-day period from September 5, 2017 to September 10, 2017. This data encompasses the
Hurricane Irma evacuation from the Florida Keys. This traffic data was then manipulated to
provide information on the number of evacuees and the volume of background traffic for each
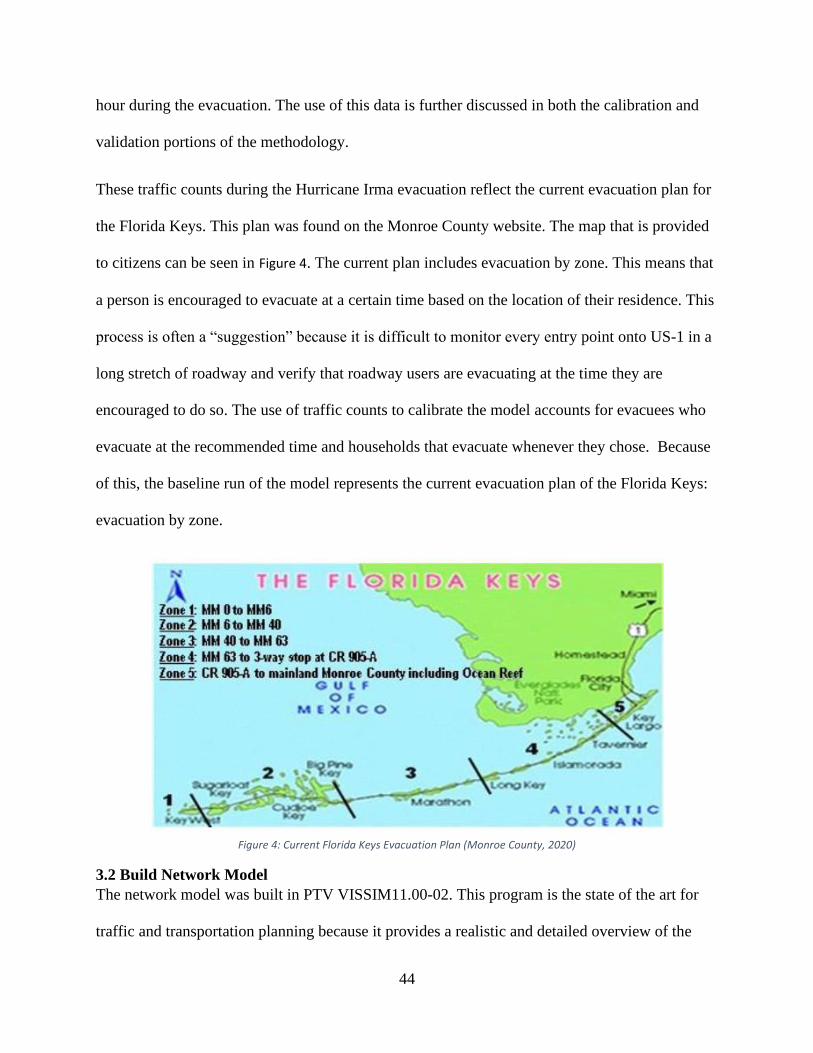
44
hour during the evacuation. The use of this data is further discussed in both the calibration and
validation portions of the methodology.
These traffic counts during the Hurricane Irma evacuation reflect the current evacuation plan for
the Florida Keys. This plan was found on the Monroe County website. The map that is provided
to citizens can be seen in Figure 4. The current plan includes evacuation by zone. This means that
a person is encouraged to evacuate at a certain time based on the location of their residence. This
process is often a “suggestion” because it is difficult to monitor every entry point onto US-1 in a
long stretch of roadway and verify that roadway users are evacuating at the time they are
encouraged to do so. The use of traffic counts to calibrate the model accounts for evacuees who
evacuate at the recommended time and households that evacuate whenever they chose. Because
of this, the baseline run of the model represents the current evacuation plan of the Florida Keys:
evacuation by zone.
Figure 4: Current Florida Keys Evacuation Plan (Monroe County, 2020)
3.2 Build Network Model
The network model was built in PTV VISSIM11.00-02. This program is the state of the art for
traffic and transportation planning because it provides a realistic and detailed overview of the
45
traffic flow and the impacts this would have on the community. In addition, what-if scenarios
can provide a reliable predicative simulation that accounts for driver behavior and decision
making in a transportation network. Modeling using VISSIM requires the roadways – both major
and minor approaches - to be modeled, defining priority in conflict zones, and adding the
appropriate traffic control devices. In addition, vehicle routing must be defined. This is discussed
further below.
VISSIM has a built-in feature that allows you to project a map into the network building area.
This allows the roadway network to mirror the exact geometry of the roadway. Because it is only
a map view, and not a satellite view, the physical characteristics data of the roadway that was
collected previously is used to supplement this map. The major road is 128 miles long, spanning
from the junction of Roosevelt Boulevard and US-1 in Key West to Homestead, where US-1
merges with Card Sound Road to become Dixie Highway. Card Sound Road, also known as
County Road 905, splits from US-1 in Key Largo and continues northeast, moving up the
archipelago. This road merges back with US-1 in Homestead. Card Sound Road is a two lane,
rural road so there are very few minor intersections. Card Sound Road needs to be modeled
along with US-1 because evacuees get to decide which route choice they are going to take.
Every intersection with the major road between Key West and Homestead on both routes is
included in the VISSIM model. There are 512 access points along the 128 mile stretch of road.
These minor road approaches are approximately 300 feet long to allow for a queue build up and
accurately depict the flow of vehicles during a hurricane evacuation that are attempting to merge
onto the only hurricane evacuation route. Vehicle inputs are located 300 feet from the
intersection of the minor approach and US-1. This is the point in the model where vehicles enter
the simulation. The number of vehicles entering from each minor intersection is an input
46
provided for each hour of the evacuation. This data, for both evacuees and background traffic,
was determined using population data and traffic counts. Additional information about this
process is included in the calibration portion of the methodology.
Connectors provide the connection between the minor road approaches and the major road.
These connectors indicate the path a vehicle makes while turning to join the traffic stream. When
putting in a connector, a conflict zone is created. A conflict zone is generated by the model as a
place where two vehicle paths could meet. The model needs to know which vehicle to give
priority. Assigning this priority defines the conflict zone. For this model, a vehicle on US-1 or
Card Sound Road always has priority over a vehicle joining from a minor approach. In addition,
the static vehicle route had to be defined. As this is a unidirectional model, with all traffic
traveling northeast, the vehicle routes mirror this traffic flow.
Stop bars are then added to each approach. This indicates that the vehicle on a minor approach
must stop, look both ways, and then enter onto the roadway. Stop bars are placed on the link,
before the connector, because vehicles must stop before beginning to make the turn. Stop signs
were placed on the minor approaches that are not controlled by traffic signals.
National Electrical Manufacturers Association ring barrier fully actuated signal heads were then
placed at signalized intersections in the model. Placing a signal head requires inputting signal
timing information and placing detectors and the actual signal head. The signal timing
information includes providing the minimum green time, the maximum green time, and the
yellow and red time. The signals are modeled after a standard fully actuated controller. Using a
fully-actuated control allows for the signal to receive information about the queue length for each
approach and control the signal timing within certain maximum and minimum cycle timings.
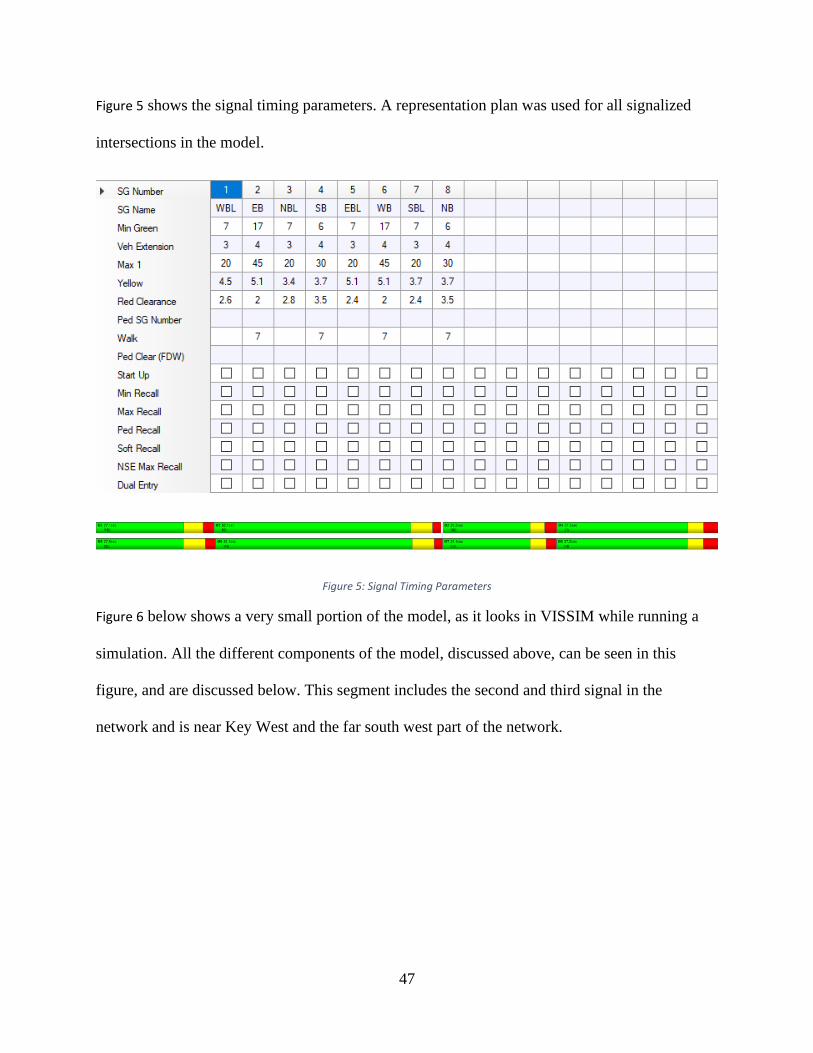
47
Figure 5 shows the signal timing parameters. A representation plan was used for all signalized
intersections in the model.
Figure 5: Signal Timing Parameters
Figure 6 below shows a very small portion of the model, as it looks in VISSIM while running a
simulation. All the different components of the model, discussed above, can be seen in this
figure, and are discussed below. This segment includes the second and third signal in the
network and is near Key West and the far south west part of the network.
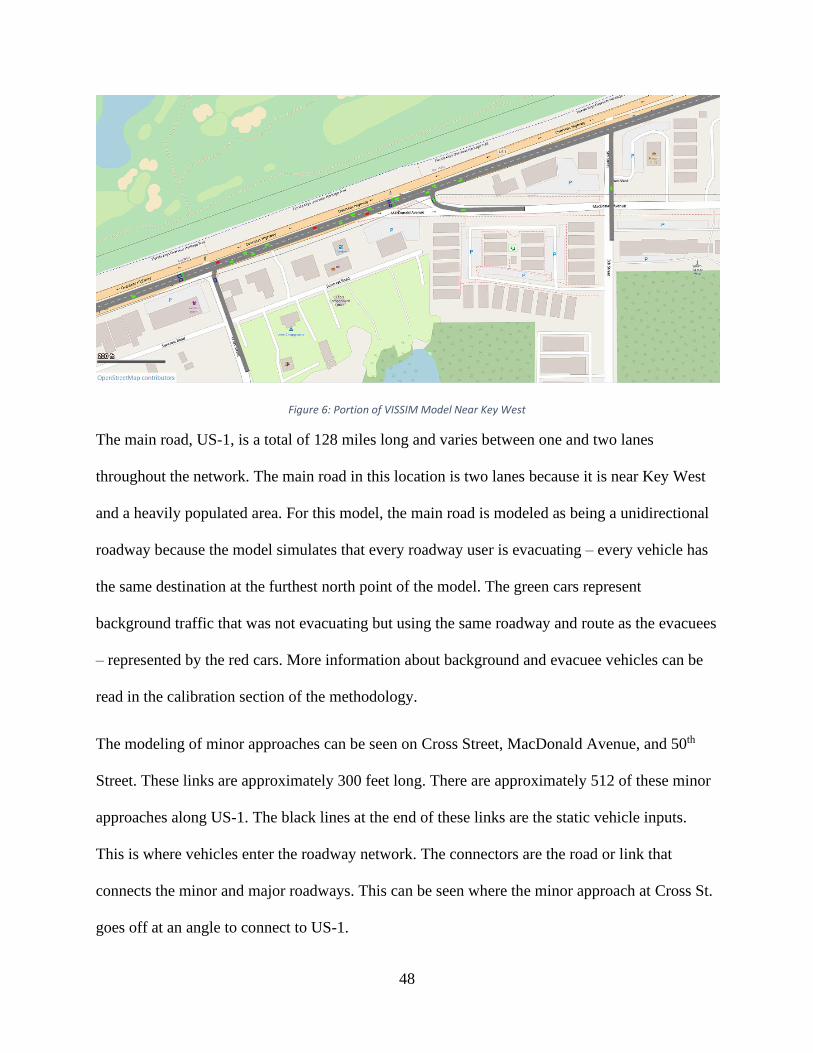
48
Figure 6: Portion of VISSIM Model Near Key West
The main road, US-1, is a total of 128 miles long and varies between one and two lanes
throughout the network. The main road in this location is two lanes because it is near Key West
and a heavily populated area. For this model, the main road is modeled as being a unidirectional
roadway because the model simulates that every roadway user is evacuating – every vehicle has
the same destination at the furthest north point of the model. The green cars represent
background traffic that was not evacuating but using the same roadway and route as the evacuees
– represented by the red cars. More information about background and evacuee vehicles can be
read in the calibration section of the methodology.
The modeling of minor approaches can be seen on Cross Street, MacDonald Avenue, and 50th
Street. These links are approximately 300 feet long. There are approximately 512 of these minor
approaches along US-1. The black lines at the end of these links are the static vehicle inputs.
This is where vehicles enter the roadway network. The connectors are the road or link that
connects the minor and major roadways. This can be seen where the minor approach at Cross St.
goes off at an angle to connect to US-1.
49
The intersection on the right, with 50th Street, is a stop-controlled intersection. There are 496
stop-controlled intersections on the roadway network. The stop sign is represented by the orange
line. Both intersections on the left are signal controlled. The red lines indicate the signal head
and where cars stop on US-1 to let cars from MacDonald Avenue turn onto the main road. The
blue boxes behind these red lines and on the minor approach are the detectors that tell the signal
if cars are present. The detectors are needed because the signals are actuated signals.
At each intersection, both signal and stop controlled, are conflict zones. These zones indicate
which vehicles priority is given to – the main road or vehicles turning onto it. Obviously, in this
network, vehicles on US-1 have priority and vehicles on the approaches must yield and turn
when there is ample space for them to merge into the traffic stream.
3.3 Calibration
Calibration of the model requires comparing the traffic count values provided by the simulation
with traffic counts from a real evacuation. As previously discussed, this project uses traffic
counts from the Hurricane Irma evacuation as the standard for comparison. The manipulation of
traffic counts during an evacuation is used to determine the number of vehicles in two different
classes – background and evacuees - entering the model each hour. This process is outlined in
detail below.
Traffic counts were provided hourly in both the north and south direction at the three applicable
sites in the Florida Keys from August 27, 2017 to October 1, 2017 which encompasses normal
traffic flow prior to the storm, the evacuation, landfall and storm, and the reentry. For this
analysis, traffic counts are analyzed from Tuesday, September 5, 2017 at 9am to when the storm
makes landfall on Sunday, September 10, 2017 at 10am. The beginning date of the evacuation
was determined by Parr, Acevedo, Murray-Tuite, and Wolshon in their paper “Methodology to
50
Quantify Statewide Evacuations” by analyzing bi-directional traffic counts to determine when
vehicles began leaving the archipelago and would not return until after the storm. This provides a
121-hour period when the evacuation occurs. This entire period is simulated by the model.
From the provided traffic counts, the number of each evacuees and background traffic passing
each data collection point is known. Any vehicle that exited the region during the 121-hour
evacuation period and did not return was considered an evacuee. All other vehicles were
modeled as background vehicles. Background vehicles are vehicles traveling on the roadway that
are not evacuating but rather making small, more local trips. The number of background vehicles
traveling in the northbound direction, same as the evacuees, is the number of vehicles that pass
the same point traveling in the southbound direction. These vehicles traveled northbound but
then returned to their original destination. Reasons for these trips could be commuting to work or
gathering supplies to prepare homes and property for the storm. Background vehicles provide
friction and represent the vehicles on the road that are not truly leaving the region, but congest
the roadway that evacuees are trying to use.
The number of evacuees that leave each hour is calculated by taking the northbound traffic and
subtracting out the background traffic. This means that the number of evacuees that leaves each
hour is the difference between the number of vehicles traveling northbound and southbound. For
the sake of calibration, if this is a negative, the number of evacuees reverts to 0. This would
occur in an hour when more people were traveling southbound than northbound. This does not
occur often during this time period, but there are few hours during the middle of the night where
the southbound traffic count is larger than the northbound count in this 121-hour evacuation
period. It is thought that this is caused by the transition from daily operations with am and pm
peaks to evacuation traffic. For additional information on how the evacuation period was

51
calculated or the number of background and evacuees, consult “Methodology to Quantify
Statewide Evacuations” by Parr, et. al.
The calibration for this model occurs with the two furthest south data collection points. These
points are located just north of Key West and south of Big Pine Key and can be seen in Figure 3.
Because of the large number of input points – 512 – in this roadway network, the calibration
needed to occur in steps. This allows the southern part of the model to reflect the true conditions
of the Hurricane Irma evacuation before adding additional vehicles further north in the model.
Because of this, the Key West data collection point data was used first to calibrate the model.
There are 10 locations where vehicles can join the model before passing over the Key West data
collection point. A weighted average, using population and number of entry points for each
census tract, is used to calculate the proportion of the total number of evacuees that come from
each entry point, each hour. This process proportionally converts the number of residents to
evacuating vehicles. The same proportion is used to determine the number of background
vehicles that enter the network at each entry point. The process used to calculate this proportion
is described below. Each of the census tracts to the south of the data collection point are
included.
1. Determine the total number of people who live in the area.
2. Calculate the proportion of people who live in each census tract
3. Divide the proportion by the number of entry points in that census tract. This provides the
proportion of both evacuees and background vehicles passing the data collection point
that comes from each entry point in that census tracts.
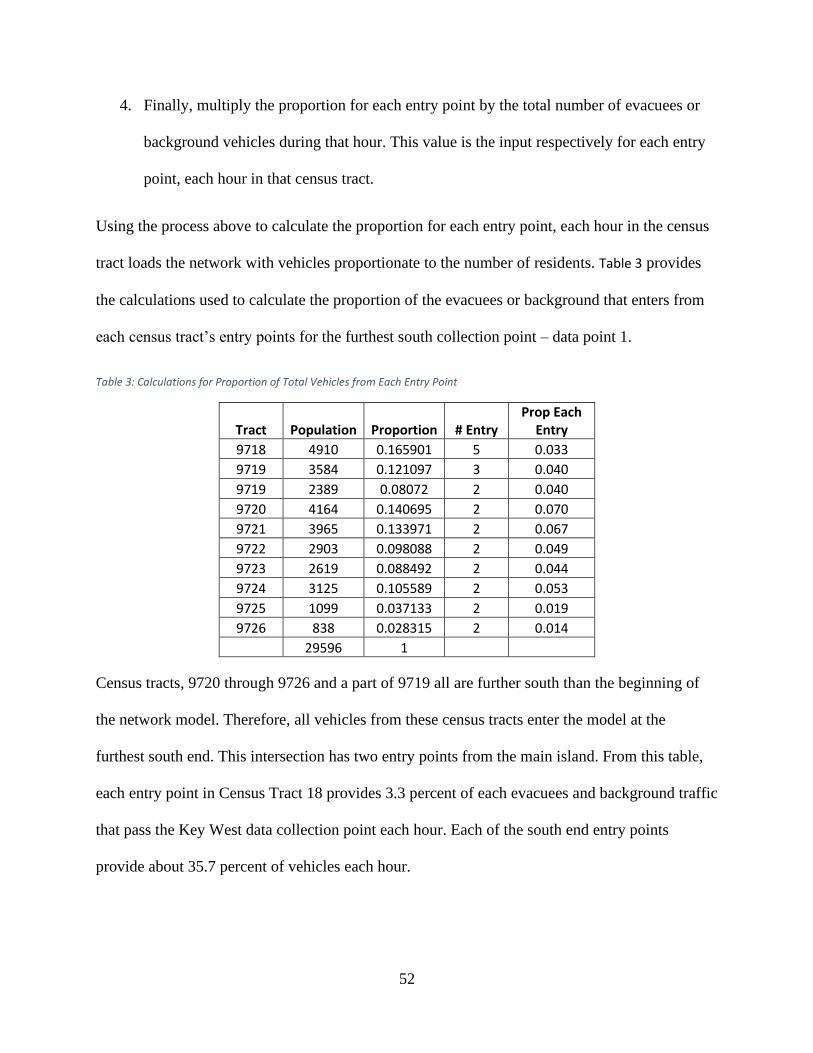
52
4. Finally, multiply the proportion for each entry point by the total number of evacuees or
background vehicles during that hour. This value is the input respectively for each entry
point, each hour in that census tract.
Using the process above to calculate the proportion for each entry point, each hour in the census
tract loads the network with vehicles proportionate to the number of residents. Table 3 provides
the calculations used to calculate the proportion of the evacuees or background that enters from
each census tract’s entry points for the furthest south collection point – data point 1.
Table 3: Calculations for Proportion of Total Vehicles from Each Entry Point
Tract Population Proportion # Entry Prop Each
Entry
9718 4910 0.165901 5 0.033
9719 3584 0.121097 3 0.040
9719 2389 0.08072 2 0.040
9720 4164 0.140695 2 0.070
9721 3965 0.133971 2 0.067
9722 2903 0.098088 2 0.049
9723 2619 0.088492 2 0.044
9724 3125 0.105589 2 0.053
9725 1099 0.037133 2 0.019
9726 838 0.028315 2 0.014
29596 1
Census tracts, 9720 through 9726 and a part of 9719 all are further south than the beginning of
the network model. Therefore, all vehicles from these census tracts enter the model at the
furthest south end. This intersection has two entry points from the main island. From this table,
each entry point in Census Tract 18 provides 3.3 percent of each evacuees and background traffic
that pass the Key West data collection point each hour. Each of the south end entry points
provide about 35.7 percent of vehicles each hour.
53
Because of difference in travel time from each entry point or census tract to data collection point,
inputting the exact number of cars as the true data shows does not provide the same result at the
data collection point in the simulation. In some locations, there is queue build up that hinders
traffic flow, causing a fewer number of vehicles to cross the data collection point in the
simulation than in the traffic counts. During an evacuation it is expected that there will be queues
forming at different parts along US-1, but the traffic counts should account for that, so the model
should mirror the traffic counts.
To overcome this excessive queueing and to be sure the correct number of vehicles pass over the
data collection points at the appropriate time, it was decided that an hourly weighted average
would help keep the same approximate number of vehicles entering the model and ultimately
passing over the data collection point in the simulation as are counted in the real evacuation. To
achieve this, various weights and rolling averages, were tested to determine the right relationship
between inputs and vehicles crossing the data collection points each hour. Examples includes
rolling average – 4, 6, and 8 hours into the futures as well as in the past. In addition, trials with
different combinations of weighted average on the previous hour, current hour, and future hour
were conducted. Ultimately, it was found that calculating the total number of evacuee and
background vehicle inputs for the hour using Equation 1 below was the most effective in getting
the number of vehicles passing the data collection point in the model to match the FDOT
provided traffic counts. In this equation, N is the true number of evacuees passing the point and
X is the weighted number of evacuees.
𝑋ℎ𝑟=3 = (𝑁ℎ𝑟=2 ∗ .05) + (𝑁ℎ𝑟=3 ∗ .9) + (𝑁ℎ𝑟=4 ∗ .05)
Equation 1: Number of Vehicles per Hour

54
This calculation accounts for the vehicles that left their origin point near the end of the previous
hour and did not arrive at the data collection point during the previous hour, the vehicles who
leave in the hour and arrive in the hour, and the vehicles who leave in the hour and arrive in the
next. The vehicles that leave during the hour and arrive at the data collection point in the same
hour is expected to be the largest group because of the relatively short distance between the entry
points and the data collection points.
VISSIM provides the number of vehicles that pass over the data collection point – which were
placed in same place as FDOT’s data collection site - for every hour and vehicle class – evacuee
and background. This data is then taken for the entire 121 hours simulation period for 5
simulations with different random seeds. Using Equation 2, it was determined that a sample size
of five is sufficient. Z is representative of the z-score, 1.96 corresponding to the selected
confidence level, 95%. σ is equal to the sample standard deviation, 169.13. E represents the
margin of error and is calculated by taking five percent of the population mean, or 439.74. This
indicates that the calculated sample size, in 95 out of 100 samples, produces a result within five
percent of the true mean. The result of the calculation is .568, significantly less than the sample
size of five used.
𝑛 = (𝑧 ∗ 𝜎
𝐸)
2
Equation 2: Sample Size Equation
The average of the outputs for each hour of each simulation run were calculated. The graphs
below, Figure 7 and Figure 8, show the real and average simulated number of evacuees and
background traffic, respectively.
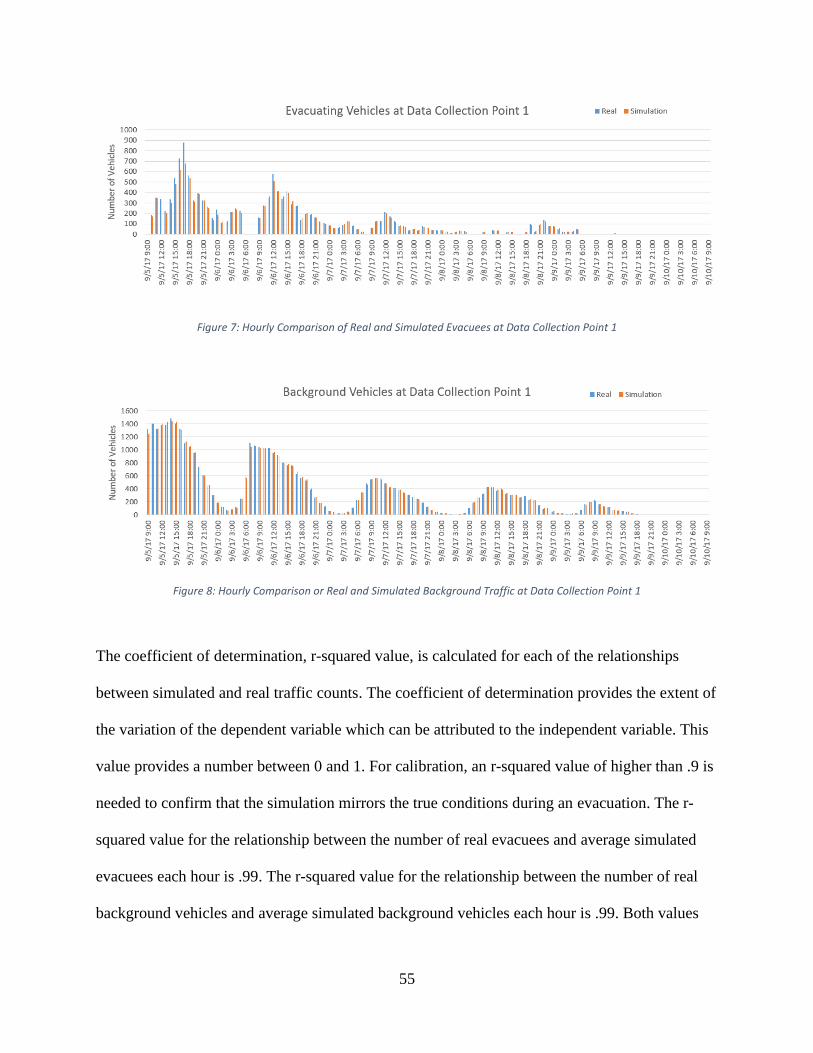
55
Figure 7: Hourly Comparison of Real and Simulated Evacuees at Data Collection Point 1
Figure 8: Hourly Comparison or Real and Simulated Background Traffic at Data Collection Point 1
The coefficient of determination, r-squared value, is calculated for each of the relationships
between simulated and real traffic counts. The coefficient of determination provides the extent of
the variation of the dependent variable which can be attributed to the independent variable. This
value provides a number between 0 and 1. For calibration, an r-squared value of higher than .9 is
needed to confirm that the simulation mirrors the true conditions during an evacuation. The r-
squared value for the relationship between the number of real evacuees and average simulated
evacuees each hour is .99. The r-squared value for the relationship between the number of real
background vehicles and average simulated background vehicles each hour is .99. Both values
56
are above the required .9 and indicate that the model reflects the number and timing of vehicles
on US-1 in Key West during a hurricane evacuation.
To calibrate the model from the first data collection site to the second, a similar process is
followed. An additional step is needed though to account for the evacuees and background traffic
passing the second data point that also passed through the first data collection point. The second
data collection point was placed before running the calibration for the first portion. From this, the
number of evacuees and background traffic passing this point is known. Because of this, the
number of evacuees and background drivers is subtracted out of their respective categories from
the counts at the Big Pine Key data collection point. This new number of evacuees and
background traffic is used to determine the number of vehicles entering the model at each entry
point in each census tract.
After analyzing the data, there are significantly more background vehicles passing through the
Key West data collection point than there were at the Big Pine Key point. This is expected as
citizens leave Key West for work or to gather supplies to prepare for the storm, but do not
actually evacuate. Because of this, some of the background vehicles need to be removed from the
model. Approximately 65% of background vehicles are routed off US-1 at one location right
after the Key West data collection point because their true destination is unknown. This leaves
the appropriate number of background vehicles to continue up through the Big Pine Key region
and provide the needed friction to keep evacuees on US-1 traveling at a speed that reflects true
conditions. Because of this, additional background vehicles do not need to be inputted for census
tracts between the first and second data collection point.
The only calculations that need to be made for this segment – from the Key West data collection
point to the Big Pine Key data collection point – is the number of evacuees who enter the model
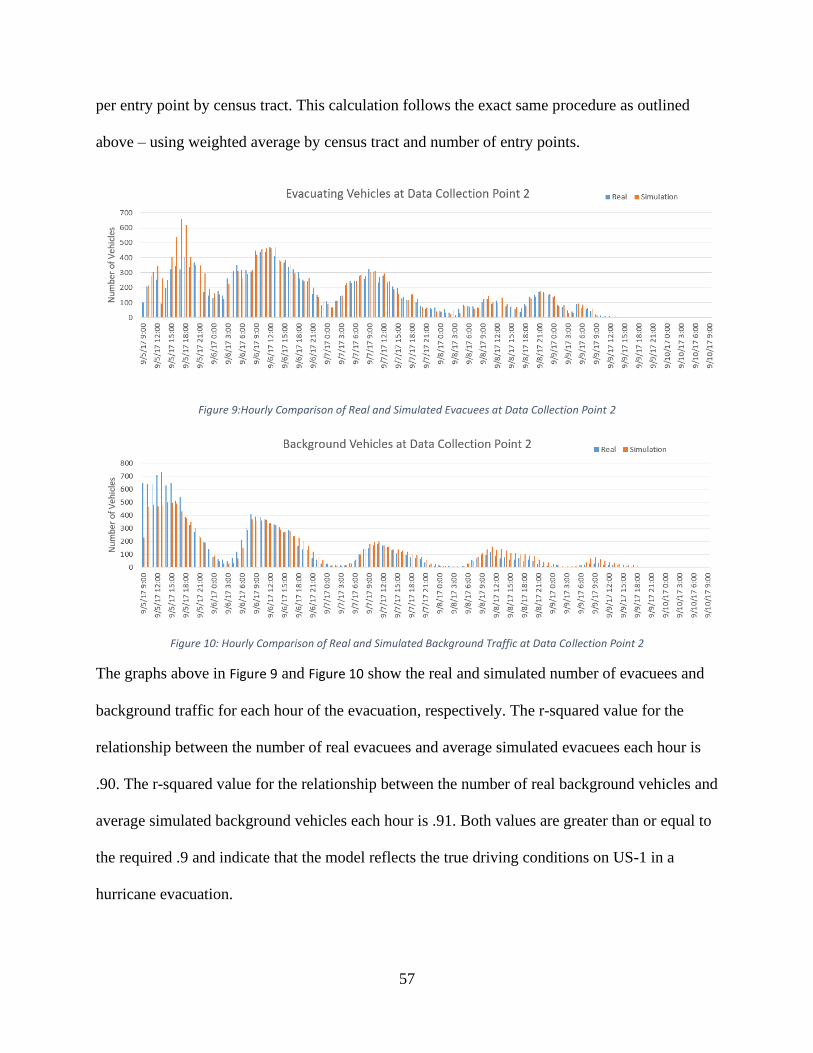
57
per entry point by census tract. This calculation follows the exact same procedure as outlined
above – using weighted average by census tract and number of entry points.
Figure 9:Hourly Comparison of Real and Simulated Evacuees at Data Collection Point 2
Figure 10: Hourly Comparison of Real and Simulated Background Traffic at Data Collection Point 2
The graphs above in Figure 9 and Figure 10 show the real and simulated number of evacuees and
background traffic for each hour of the evacuation, respectively. The r-squared value for the
relationship between the number of real evacuees and average simulated evacuees each hour is
.90. The r-squared value for the relationship between the number of real background vehicles and
average simulated background vehicles each hour is .91. Both values are greater than or equal to
the required .9 and indicate that the model reflects the true driving conditions on US-1 in a
hurricane evacuation.
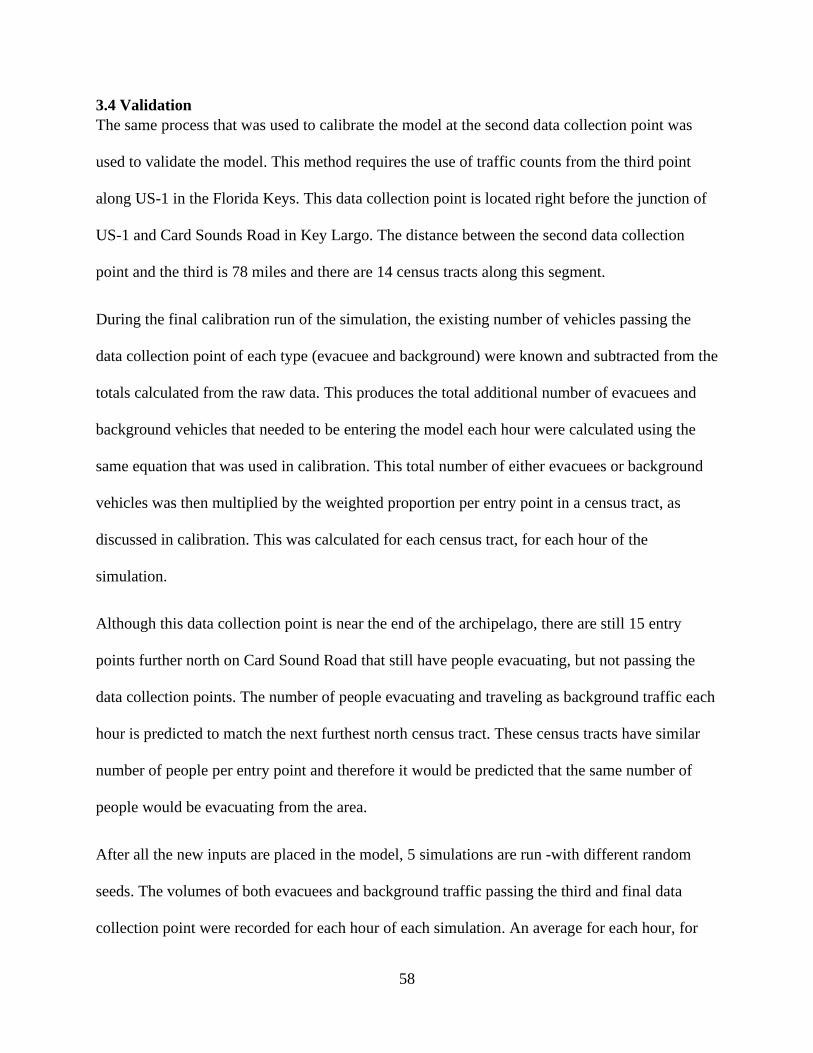
58
3.4 Validation
The same process that was used to calibrate the model at the second data collection point was
used to validate the model. This method requires the use of traffic counts from the third point
along US-1 in the Florida Keys. This data collection point is located right before the junction of
US-1 and Card Sounds Road in Key Largo. The distance between the second data collection
point and the third is 78 miles and there are 14 census tracts along this segment.
During the final calibration run of the simulation, the existing number of vehicles passing the
data collection point of each type (evacuee and background) were known and subtracted from the
totals calculated from the raw data. This produces the total additional number of evacuees and
background vehicles that needed to be entering the model each hour were calculated using the
same equation that was used in calibration. This total number of either evacuees or background
vehicles was then multiplied by the weighted proportion per entry point in a census tract, as
discussed in calibration. This was calculated for each census tract, for each hour of the
simulation.
Although this data collection point is near the end of the archipelago, there are still 15 entry
points further north on Card Sound Road that still have people evacuating, but not passing the
data collection points. The number of people evacuating and traveling as background traffic each
hour is predicted to match the next furthest north census tract. These census tracts have similar
number of people per entry point and therefore it would be predicted that the same number of
people would be evacuating from the area.
After all the new inputs are placed in the model, 5 simulations are run -with different random
seeds. The volumes of both evacuees and background traffic passing the third and final data
collection point were recorded for each hour of each simulation. An average for each hour, for
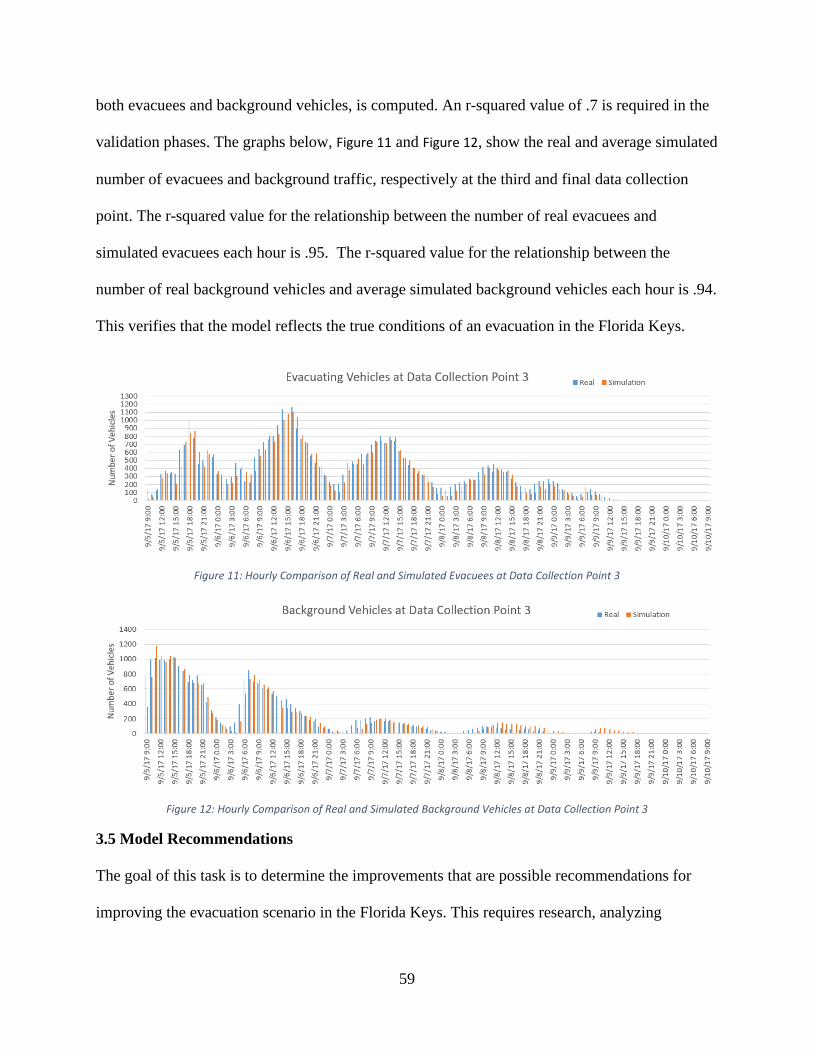
59
both evacuees and background vehicles, is computed. An r-squared value of .7 is required in the
validation phases. The graphs below, Figure 11 and Figure 12, show the real and average simulated
number of evacuees and background traffic, respectively at the third and final data collection
point. The r-squared value for the relationship between the number of real evacuees and
simulated evacuees each hour is .95. The r-squared value for the relationship between the
number of real background vehicles and average simulated background vehicles each hour is .94.
This verifies that the model reflects the true conditions of an evacuation in the Florida Keys.
Figure 11: Hourly Comparison of Real and Simulated Evacuees at Data Collection Point 3
Figure 12: Hourly Comparison of Real and Simulated Background Vehicles at Data Collection Point 3
3.5 Model Recommendations
The goal of this task is to determine the improvements that are possible recommendations for
improving the evacuation scenario in the Florida Keys. This requires research, analyzing
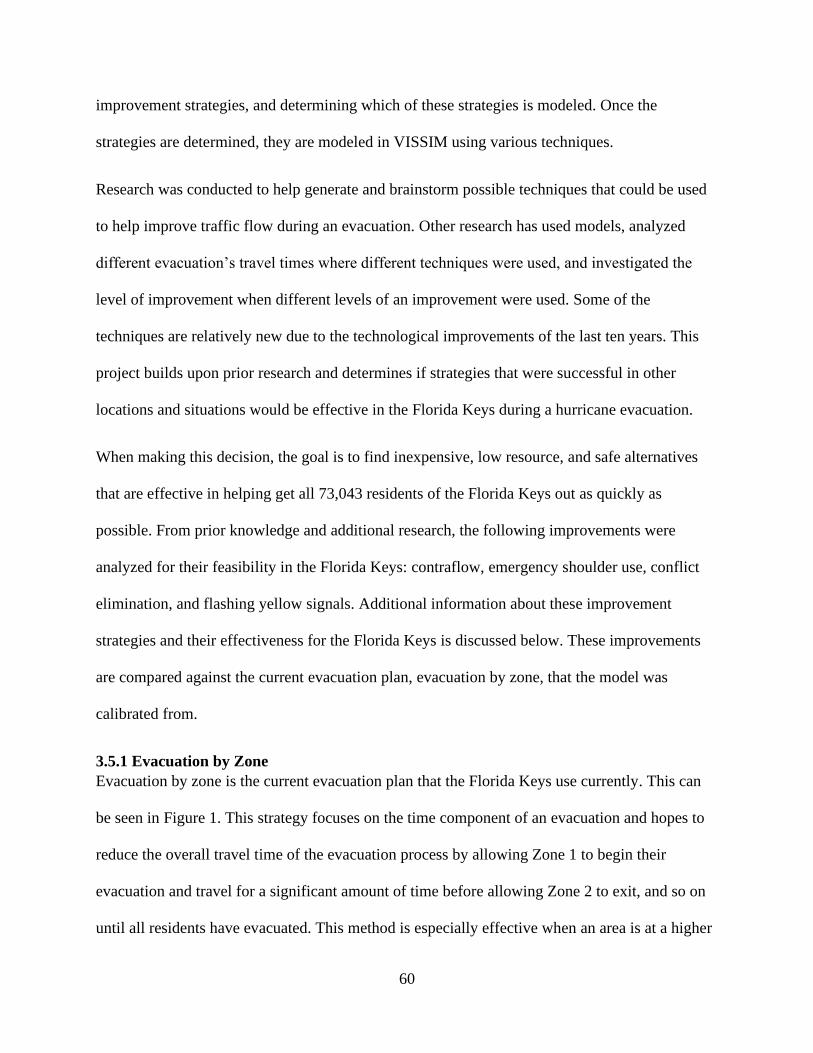
60
improvement strategies, and determining which of these strategies is modeled. Once the
strategies are determined, they are modeled in VISSIM using various techniques.
Research was conducted to help generate and brainstorm possible techniques that could be used
to help improve traffic flow during an evacuation. Other research has used models, analyzed
different evacuation’s travel times where different techniques were used, and investigated the
level of improvement when different levels of an improvement were used. Some of the
techniques are relatively new due to the technological improvements of the last ten years. This
project builds upon prior research and determines if strategies that were successful in other
locations and situations would be effective in the Florida Keys during a hurricane evacuation.
When making this decision, the goal is to find inexpensive, low resource, and safe alternatives
that are effective in helping get all 73,043 residents of the Florida Keys out as quickly as
possible. From prior knowledge and additional research, the following improvements were
analyzed for their feasibility in the Florida Keys: contraflow, emergency shoulder use, conflict
elimination, and flashing yellow signals. Additional information about these improvement
strategies and their effectiveness for the Florida Keys is discussed below. These improvements
are compared against the current evacuation plan, evacuation by zone, that the model was
calibrated from.
3.5.1 Evacuation by Zone
Evacuation by zone is the current evacuation plan that the Florida Keys use currently. This can
be seen in Figure 1. This strategy focuses on the time component of an evacuation and hopes to
reduce the overall travel time of the evacuation process by allowing Zone 1 to begin their
evacuation and travel for a significant amount of time before allowing Zone 2 to exit, and so on
until all residents have evacuated. This method is especially effective when an area is at a higher
61
risk and needs to evacuate more quickly than another area. In the Florida Keys, by having the
furthest south island, Key West, evacuate first, there is clear roadway until vehicles reach the
furthest north zones. Modeling this improvement, which is the current evacuation plan, provides
insight into the strength and weaknesses of the current evacuation plan and the improvements
provide insight on methods to improve this process even further.
3.5.2 Contraflow
Contraflow is the use of a traffic lane to carry vehicles in the opposite direction it was designed
to flow. During a hurricane or emergency evacuation, almost all roadway users are driving in the
same direction - away from the area of high risk. In the Florida Keys, the evacuation is often
deemed as “mandatory” by local governments because of the high risk this island chain faces as
the storm surge arrives and high winds occur. Because of this, it makes logical sense that using
the southwest bound lane of US-1 as a contraflow lane would be productive. The negatives of
contraflow are the safety risks it creates. If an accident or medical emergency occurs downstream
of the first responder’s location and both lanes are moving upstream, there is no way for help to
get to the citizen. This is especially true in the Florida Keys because there is only one road that
connects all the islands, so there is no alternative route for the responders to take. Using a
roadway as it was not designed has additional safety risks. In addition, it takes resources to
operate a contraflow road like law enforcement, additional signs, and barricades to block turn
lanes for directions that are not operating. US-1 in the Florida Keys is primarily a two-lane road,
so adding a contraflow lane could significantly improve the travel time during an emergency
evacuation even if it takes a significant amount of resource to operate.
3.5.3 Emergency Shoulder Use
The emergency shoulder of a roadway is the paved area on the side of the road which provides
additional width to the right-of-way and improves the driving experience for roadway users. In
62
an emergency evacuation, this space, if wide enough, could be used as an additional travel lane.
This method was used in September of 2017 during Hurricane Irma on I-75 in Florida. The
results of a study that found that crash rates were no higher in an urban setting using the shoulder
as a through lane than when operating the roadway at capacity (Sharma et al., 2020). This
indicates that using the shoulder in an emergency is not unsafe. Although adding a lane to the
traffic flow seems that it would allow the total time to be cut in half, this is not true. When
driving in a narrower lane or more closely to other vehicles, it is common for drivers to reduce
their speed and drive with more caution, causing a slower free flow speed. By modeling this
option, it is determined how much of an improvement operating an emergency shoulder lane
provides.
3.5.4 Conflict Elimination
Conflict elimination is a technique used at intersections to eliminate perpendicular intersections
and use merging and diverging to join and leave the traffic flow. This creates a situation like a
controlled interstate with on and off ramps. This method is most effective when the volume and
demand of the major road is very high, and the minor approach volume is low (Parr et al., 2016).
This is true in the Florida Keys during a hurricane evacuation because all users are hoping to
travel northeast on US-1 to return to the mainland and further north. This method is safe but
requires physical space and resources to create the acceleration lanes and merging areas. US-1 in
the Florida Keys provides the needed space because like contraflow, the opposing direction lane
could be used near intersections as the acceleration lane.
3.5.5 Flashing Yellow Signals
Another technique involving the traffic signals that could be used to reduce the total evacuation
time is flashing yellow signals. Flashing yellow signals provide the major roadway with
essentially a yield sign – they do not have to stop or slow down but should be aware that they are
63
passing through an intersection and should be cautious. The minor approach’s signal head would
show flashing red. This requires that these vehicles must stop, look both ways, find a place in the
traffic flow where they can safely join in with the traffic stream. A flashing yellow signal head
operates like a two-way stop-controlled intersection. This method works the best on intersections
with an unbalanced volume and demand between the major and minor approaches (Parr et al.,
2016). Similar to the optimal situation for conflict elimination, this obviously occurs during
hurricane evacuation in the Florida Keys. This method takes very little resource to implement
and is reasonably safe. The only negative is that the queue waiting to turn from the minor
approach onto the major approach could become very long. Modeling this improvement
indicates if this method is helpful given the number of citizens who would use the signalized
intersections to join onto US-1 and the unique traffic flow in the Florida Keys during hurricane
evacuation.
From the analysis discussed above, the following improvements were selected to be modeled:
contraflow, emergency shoulder use, flashing yellow signals, conflict elimination, and
evacuation by zone. The improvements could be implemented relatively easily in the Florida
Keys. The physical demands of each method are met by US-1 in the Florida Keys and should
improve the capacity in an efficient manner. Each method has a drawback, but that is expected
because evacuating from a hurricane is an emergency traffic pattern, and vehicles just need to
move toward the mainland as quick as possible. Because of this, these five methods were chosen
to be modeled in VISSIM and the outputs of the model analyzed to determine the best
recommendations.
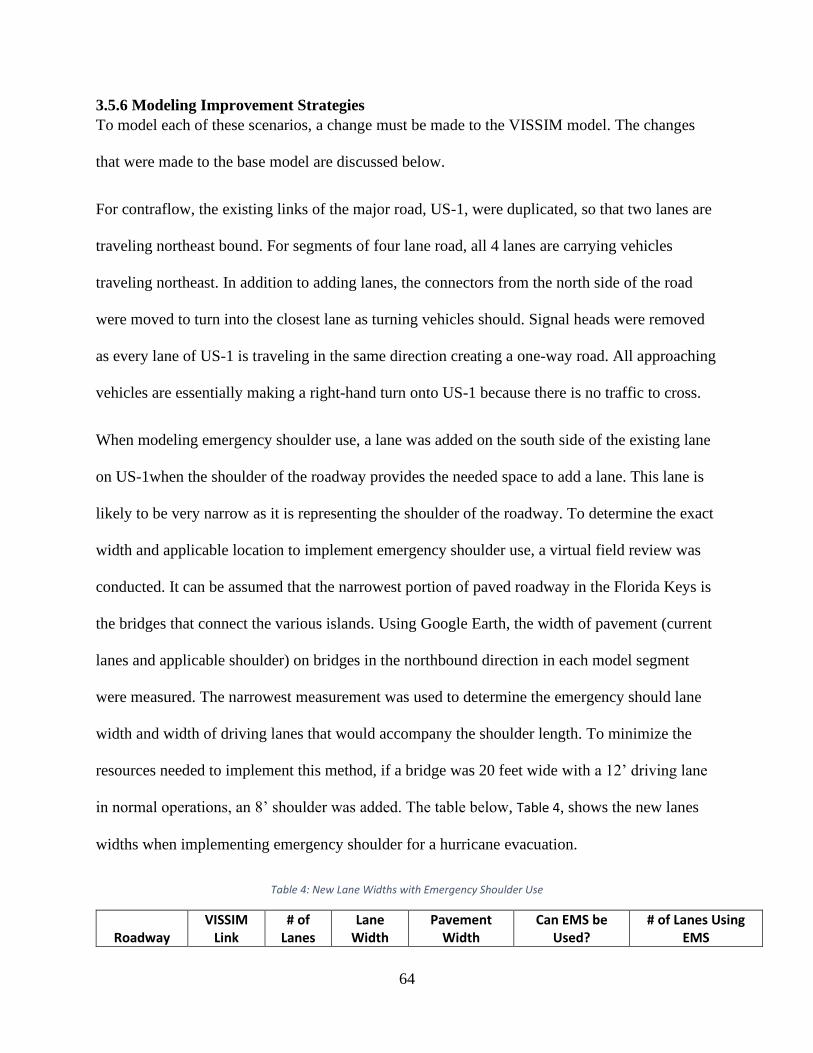
64
3.5.6 Modeling Improvement Strategies
To model each of these scenarios, a change must be made to the VISSIM model. The changes
that were made to the base model are discussed below.
For contraflow, the existing links of the major road, US-1, were duplicated, so that two lanes are
traveling northeast bound. For segments of four lane road, all 4 lanes are carrying vehicles
traveling northeast. In addition to adding lanes, the connectors from the north side of the road
were moved to turn into the closest lane as turning vehicles should. Signal heads were removed
as every lane of US-1 is traveling in the same direction creating a one-way road. All approaching
vehicles are essentially making a right-hand turn onto US-1 because there is no traffic to cross.
When modeling emergency shoulder use, a lane was added on the south side of the existing lane
on US-1when the shoulder of the roadway provides the needed space to add a lane. This lane is
likely to be very narrow as it is representing the shoulder of the roadway. To determine the exact
width and applicable location to implement emergency shoulder use, a virtual field review was
conducted. It can be assumed that the narrowest portion of paved roadway in the Florida Keys is
the bridges that connect the various islands. Using Google Earth, the width of pavement (current
lanes and applicable shoulder) on bridges in the northbound direction in each model segment
were measured. The narrowest measurement was used to determine the emergency should lane
width and width of driving lanes that would accompany the shoulder length. To minimize the
resources needed to implement this method, if a bridge was 20 feet wide with a 12’ driving lane
in normal operations, an 8’ shoulder was added. The table below, Table 4, shows the new lanes
widths when implementing emergency shoulder for a hurricane evacuation.
Table 4: New Lane Widths with Emergency Shoulder Use
Roadway VISSIM
Link # of
Lanes Lane
Width Pavement
Width Can EMS be
Used? # of Lanes Using
EMS
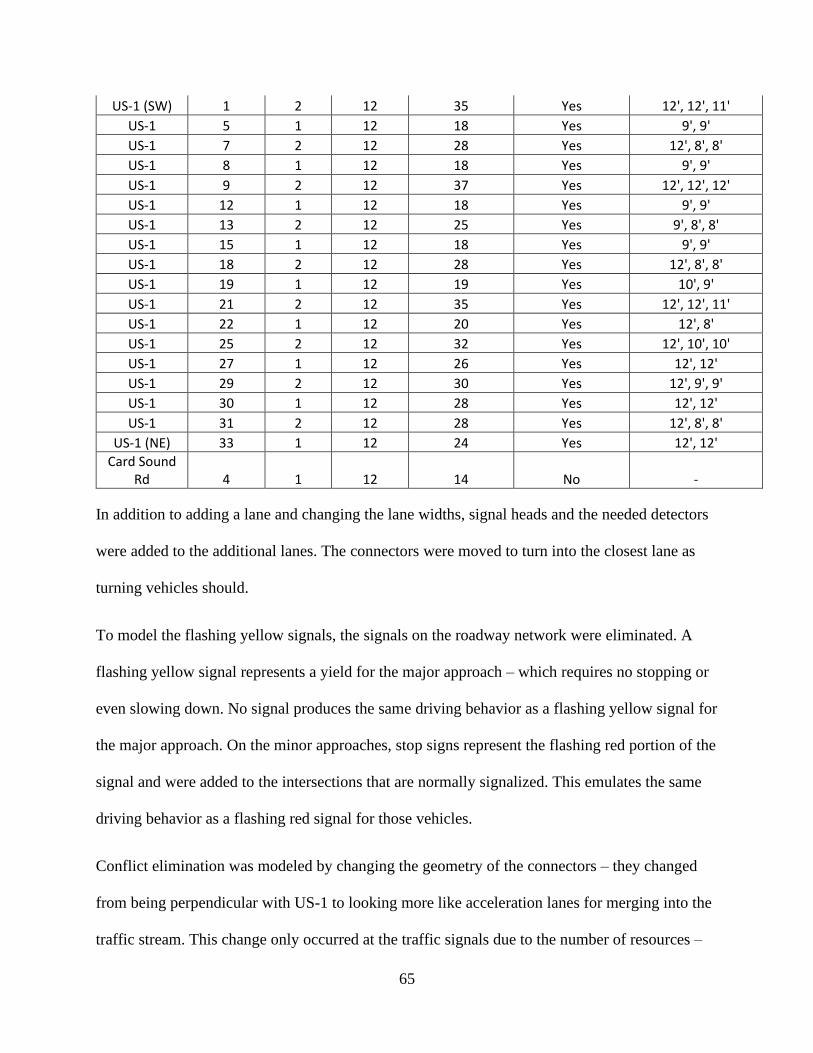
65
US-1 (SW) 1 2 12 35 Yes 12', 12', 11'
US-1 5 1 12 18 Yes 9', 9'
US-1 7 2 12 28 Yes 12', 8', 8'
US-1 8 1 12 18 Yes 9', 9'
US-1 9 2 12 37 Yes 12', 12', 12'
US-1 12 1 12 18 Yes 9', 9'
US-1 13 2 12 25 Yes 9', 8', 8'
US-1 15 1 12 18 Yes 9', 9'
US-1 18 2 12 28 Yes 12', 8', 8'
US-1 19 1 12 19 Yes 10', 9'
US-1 21 2 12 35 Yes 12', 12', 11'
US-1 22 1 12 20 Yes 12', 8'
US-1 25 2 12 32 Yes 12', 10', 10'
US-1 27 1 12 26 Yes 12', 12'
US-1 29 2 12 30 Yes 12', 9', 9'
US-1 30 1 12 28 Yes 12', 12'
US-1 31 2 12 28 Yes 12', 8', 8'
US-1 (NE) 33 1 12 24 Yes 12', 12'
Card Sound Rd 4 1 12 14 No -
In addition to adding a lane and changing the lane widths, signal heads and the needed detectors
were added to the additional lanes. The connectors were moved to turn into the closest lane as
turning vehicles should.
To model the flashing yellow signals, the signals on the roadway network were eliminated. A
flashing yellow signal represents a yield for the major approach – which requires no stopping or
even slowing down. No signal produces the same driving behavior as a flashing yellow signal for
the major approach. On the minor approaches, stop signs represent the flashing red portion of the
signal and were added to the intersections that are normally signalized. This emulates the same
driving behavior as a flashing red signal for those vehicles.
Conflict elimination was modeled by changing the geometry of the connectors – they changed
from being perpendicular with US-1 to looking more like acceleration lanes for merging into the
traffic stream. This change only occurred at the traffic signals due to the number of resources –
66
cones, barricades, police officers – this method requires. This decision was made because it is
expected that more cars use the minor approaches with signals than at the stop-controlled
intersections.
Each of these recommendations for improvement were modeled individually and the outputs
compared with the model of the current evacuation pattern and each other to determine which
improvement is the best for the Florida Keys region. The analysis of the outputs is discussed in
the final step of the methodology.
3.6 Analysis of Model Outputs
After each improvement has been modeled, a simulation of a hurricane evacuation would be
completed. This requires that 5 simulations, each with a different random seed, be completed for
each recommendation. VISSIM provides many different data collection options, but this project
focuses on 3 different points of output for evacuees: network performance (vehicle miles,
vehicles hours, and delay), clearance time, and travel time. Using these outputs, a calculation is
used to determine the impacts the evacuation recommendations have on the vehicle emissions.
The network performance evaluation results provide insight into the movements of vehicles in
the roadway network. This includes the vehicle miles traveled – the number of miles traveled by
evacuees’ during the evacuation. It is expected that each recommendation has a similar number
of vehicle miles traveled each hour of the evacuation. If this is not true, it would indicate the
queuing is occurring with that recommendation during that hour, but not happening with other
recommendations.
In addition, the number of hours evacuees spend driving throughout the entire evacuation was
recorded in vehicle hours. The simulation that takes the shortest amount of time for all evacuees
indicates an evacuation with reduced queuing and delay. This would appeal to local emergency
67
management because a lower total travel time indicates a more efficient evacuation. Total
vehicle hours are provided by VISSIM data collection’s total travel time.
Delay provides insight into how long vehicles are spending waiting to merge on to the main
roadway, sitting in queues on the main roadway, or time spent waiting behind a vehicle wanting
to change lanes. The average delay, the delay experienced by vehicles in the hours divided by the
number of vehicles in the network during that hour is recorded for each hour of the simulation.
The recommendations with the smallest amount of delay, which likely corresponds to the
shortest travel time is one of the factors that affects which recommendation is the best.
To collect the network performance evaluation results, the proper evaluation parameters must be
selected. Because of the importance of these results, VISSIM provides all this information very
clearly for each vehicle class (evacuee or background). The data provided is then averaged for
the 5 simulation runs and further analyzed in the results section below.
The next evaluation criteria, clearance time, provides information on when the vehicles leave the
roadway network – indicating that they have reached the end of their evacuation in this model.
As this model reflects a hurricane evacuation, the goal is to have as many evacuees leaving the
area as early in the evacuation period as possible to avoid vehicles being stranded on US-1
during the storm. Therefore, by evaluating clearance time, it can be determined which
recommendation moves the most vehicles out of the region the earliest.
To collect clearance time information, a data collection point was put at the very end of the
roadway network. This provides the number of evacuees that pass this final point in the model
each hour. From this, graphs can be created that show the proportion of evacuees who
successfully evacuated by reaching the mainland each hour. For safety reasons, local emergency
68
management agencies want to see many evacuees getting out as early as possible and the
clearance time graphs show us this for each recommendation. The data provided by the data
collection point is then averaged for the 5 simulation runs and further analyzed in the results
section below.
In addition to collecting network performance evaluation and clearance time data, information on
the travel time is collected. Travel time provides insight into the periods for each
recommendation when evacuating takes the longest and shortest amount of time. When the
evacuation takes the longest indicates the peak hour(s) of the evacuation. This is helpful to
emergency management staff because reducing the peak makes the evacuation safer and more
efficient for all affected parties.
Travel time data was collected using the vehicle travel time function in VISSIM. For this
analysis, the travel time was collected for evacuating vehicles from Key West in the south to the
end of the model when Card Sound Round merges with US-1 in Homestead. The data is
collected hourly and is reported based on the hour the vehicle entered the network.
Finally, the emissions produced by the evacuation are analyzed. For each recommendation, it is
expected that the total vehicle miles traveled by evacuees is similar for all the recommendations,
as discussed in the vehicle miles portion of the analysis. Because of this, the emissions produced
by idling vehicles, caused by stop delay, during the hurricane evacuation was determined for
each scenario. Greenhouse gas emissions, which include carbon dioxide, nitrous oxide and
methane. By analyzing the emissions, the effect each process has on the amount of vehicle
emissions can be seen. This is important to consider because the ever-changing environment and
its pollutants is a possible cause for climate change. In addition, the relationship between
69
evacuation techniques and the effect on the environment is not a well understood and published
topic.
To calculate the amount of emissions produced by vehicles idling, the total stop delay for all 121
hours of the evacuation was determined for each recommendation by averaging the result from
the five iterations. This number of seconds, provided by VISSIM, is then be converted to number
of hours. From there, it was determined by the Energy Systems Division of the Argonne National
Laboratory that a passenger car, with a load, spends .6 gallons of gas per hours of idling (2014).
Evacuees likely have their vehicles weighted down with their personal belongings and needed
supplies. According to an idling cost calculator produced by E3 Fleet, each gallon gas burned
idling produces 2131 grams of greenhouse gas emissions (2006). From these conversion factors,
the total number of greenhouse gas emissions created by the idling of vehicles each
recommendation is calculated and analyzed.
There are limitations when using this procedure to determine the number of greenhouse gases
produced by the evacuation process. First, this basic conversion factor assumes that all the
vehicles are sedans with full loads. In addition, the age of the vehicle determines how efficient
the fuel burning process is and therefore affects the number of grams produced for each vehicle
burned. Finally, this method does not account for the different effects that emissions have on the
environment in the daylight versus at night. The contrast in temperature causes the emissions to
react differently in the atmosphere and therefore have different environmental effects. These
limitations could be overcome by using a different procedure to determine the number of
emissions. This was not the sole focus of this research so a generalized procedure was used.
The improvement each modeled scenario creates for each of the criterium previously discussed is
summarized in tables and graphs. From this, a final recommendation is made to help the local

70
government and emergency operations organizations in the Florida Keys create a safe, more
efficient, and environmentally friendly evacuation process.
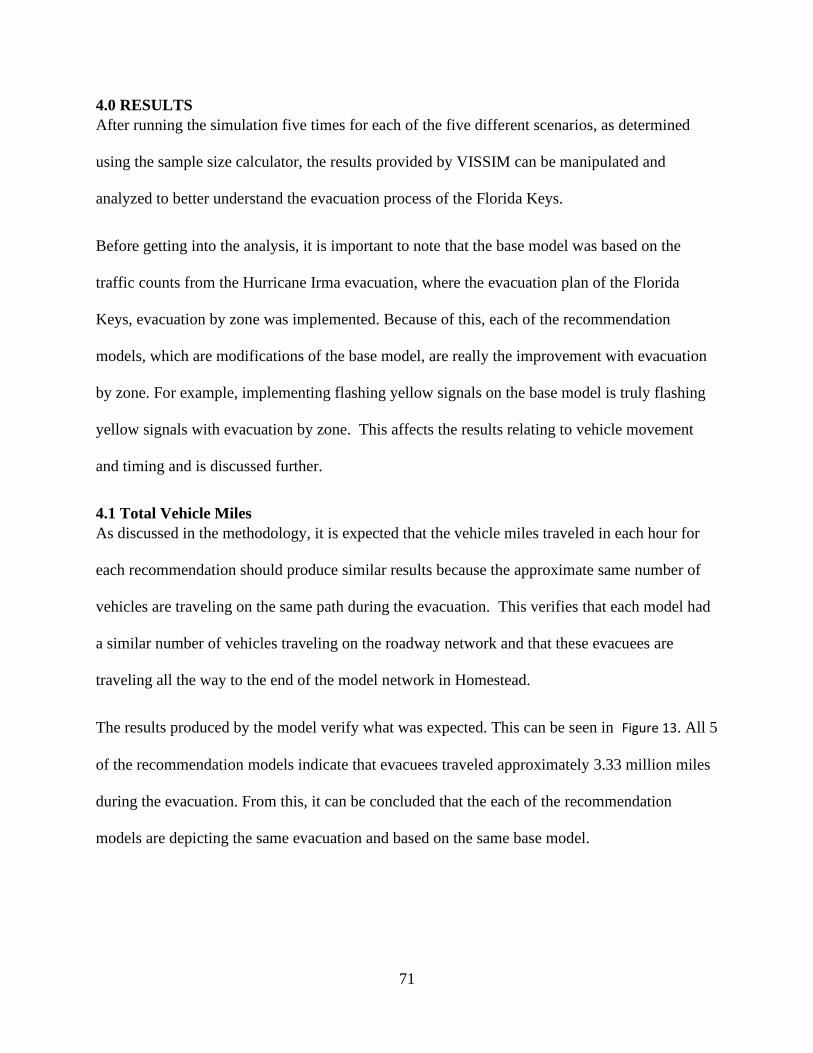
71
4.0 RESULTS
After running the simulation five times for each of the five different scenarios, as determined
using the sample size calculator, the results provided by VISSIM can be manipulated and
analyzed to better understand the evacuation process of the Florida Keys.
Before getting into the analysis, it is important to note that the base model was based on the
traffic counts from the Hurricane Irma evacuation, where the evacuation plan of the Florida
Keys, evacuation by zone was implemented. Because of this, each of the recommendation
models, which are modifications of the base model, are really the improvement with evacuation
by zone. For example, implementing flashing yellow signals on the base model is truly flashing
yellow signals with evacuation by zone. This affects the results relating to vehicle movement
and timing and is discussed further.
4.1 Total Vehicle Miles
As discussed in the methodology, it is expected that the vehicle miles traveled in each hour for
each recommendation should produce similar results because the approximate same number of
vehicles are traveling on the same path during the evacuation. This verifies that each model had
a similar number of vehicles traveling on the roadway network and that these evacuees are
traveling all the way to the end of the model network in Homestead.
The results produced by the model verify what was expected. This can be seen in Figure 13. All 5
of the recommendation models indicate that evacuees traveled approximately 3.33 million miles
during the evacuation. From this, it can be concluded that the each of the recommendation
models are depicting the same evacuation and based on the same base model.
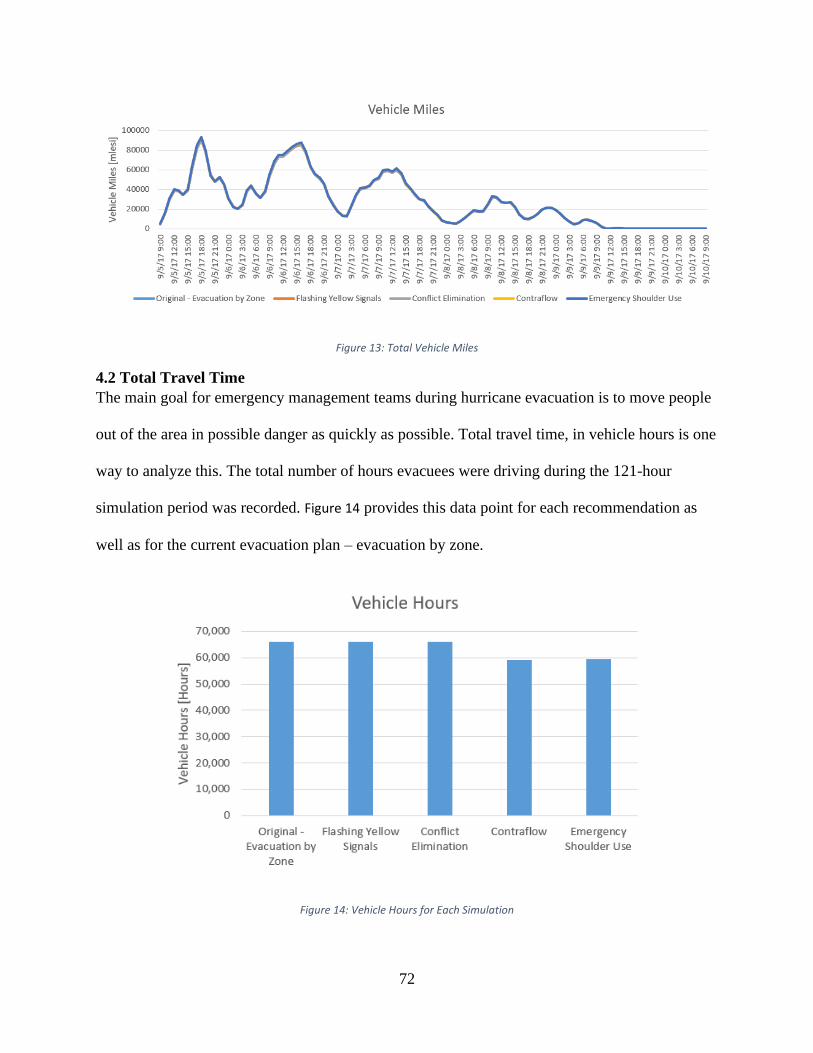
72
Figure 13: Total Vehicle Miles
4.2 Total Travel Time
The main goal for emergency management teams during hurricane evacuation is to move people
out of the area in possible danger as quickly as possible. Total travel time, in vehicle hours is one
way to analyze this. The total number of hours evacuees were driving during the 121-hour
simulation period was recorded. Figure 14 provides this data point for each recommendation as
well as for the current evacuation plan – evacuation by zone.
Figure 14: Vehicle Hours for Each Simulation
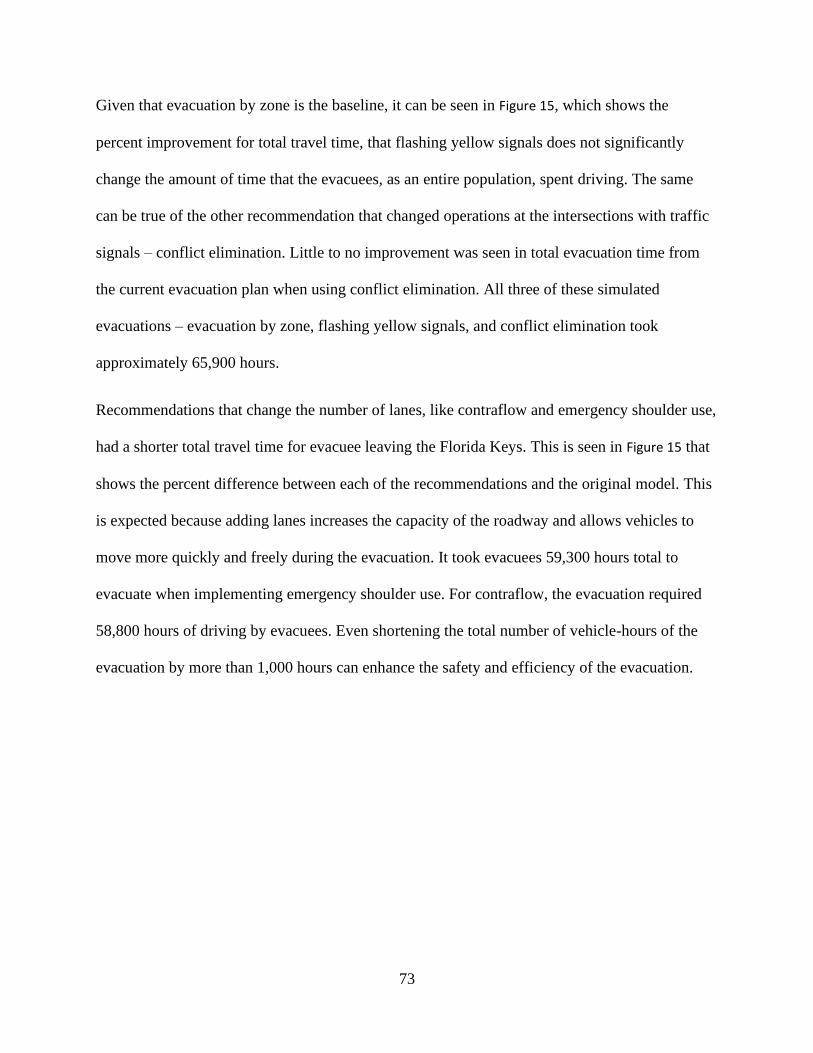
73
Given that evacuation by zone is the baseline, it can be seen in Figure 15, which shows the
percent improvement for total travel time, that flashing yellow signals does not significantly
change the amount of time that the evacuees, as an entire population, spent driving. The same
can be true of the other recommendation that changed operations at the intersections with traffic
signals – conflict elimination. Little to no improvement was seen in total evacuation time from
the current evacuation plan when using conflict elimination. All three of these simulated
evacuations – evacuation by zone, flashing yellow signals, and conflict elimination took
approximately 65,900 hours.
Recommendations that change the number of lanes, like contraflow and emergency shoulder use,
had a shorter total travel time for evacuee leaving the Florida Keys. This is seen in Figure 15 that
shows the percent difference between each of the recommendations and the original model. This
is expected because adding lanes increases the capacity of the roadway and allows vehicles to
move more quickly and freely during the evacuation. It took evacuees 59,300 hours total to
evacuate when implementing emergency shoulder use. For contraflow, the evacuation required
58,800 hours of driving by evacuees. Even shortening the total number of vehicle-hours of the
evacuation by more than 1,000 hours can enhance the safety and efficiency of the evacuation.
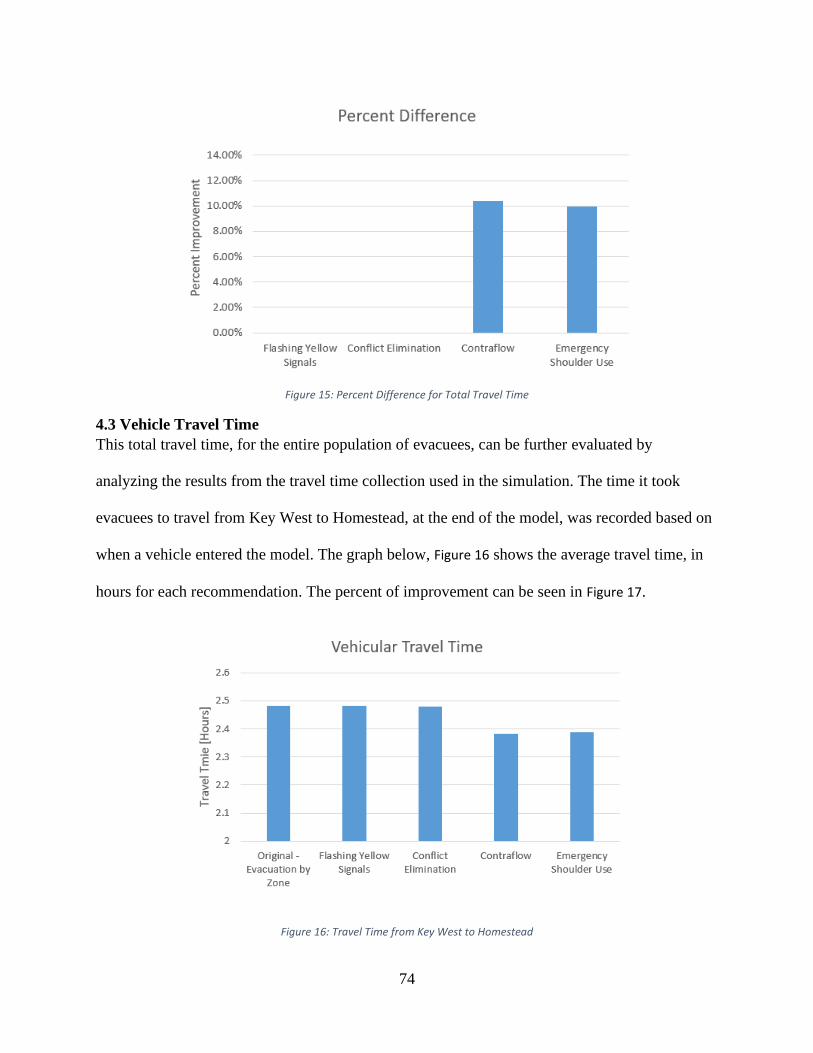
74
Figure 15: Percent Difference for Total Travel Time
4.3 Vehicle Travel Time
This total travel time, for the entire population of evacuees, can be further evaluated by
analyzing the results from the travel time collection used in the simulation. The time it took
evacuees to travel from Key West to Homestead, at the end of the model, was recorded based on
when a vehicle entered the model. The graph below, Figure 16 shows the average travel time, in
hours for each recommendation. The percent of improvement can be seen in Figure 17.
Figure 16: Travel Time from Key West to Homestead
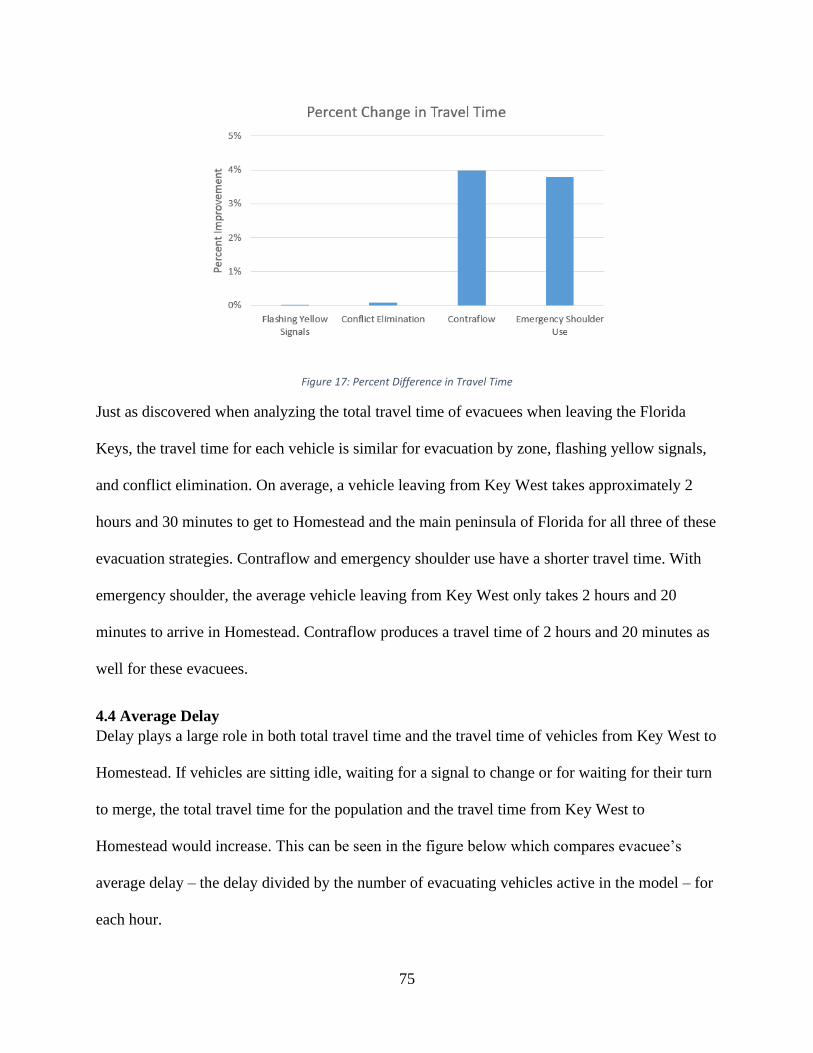
75
Figure 17: Percent Difference in Travel Time
Just as discovered when analyzing the total travel time of evacuees when leaving the Florida
Keys, the travel time for each vehicle is similar for evacuation by zone, flashing yellow signals,
and conflict elimination. On average, a vehicle leaving from Key West takes approximately 2
hours and 30 minutes to get to Homestead and the main peninsula of Florida for all three of these
evacuation strategies. Contraflow and emergency shoulder use have a shorter travel time. With
emergency shoulder, the average vehicle leaving from Key West only takes 2 hours and 20
minutes to arrive in Homestead. Contraflow produces a travel time of 2 hours and 20 minutes as
well for these evacuees.
4.4 Average Delay
Delay plays a large role in both total travel time and the travel time of vehicles from Key West to
Homestead. If vehicles are sitting idle, waiting for a signal to change or for waiting for their turn
to merge, the total travel time for the population and the travel time from Key West to
Homestead would increase. This can be seen in the figure below which compares evacuee’s
average delay – the delay divided by the number of evacuating vehicles active in the model – for
each hour.
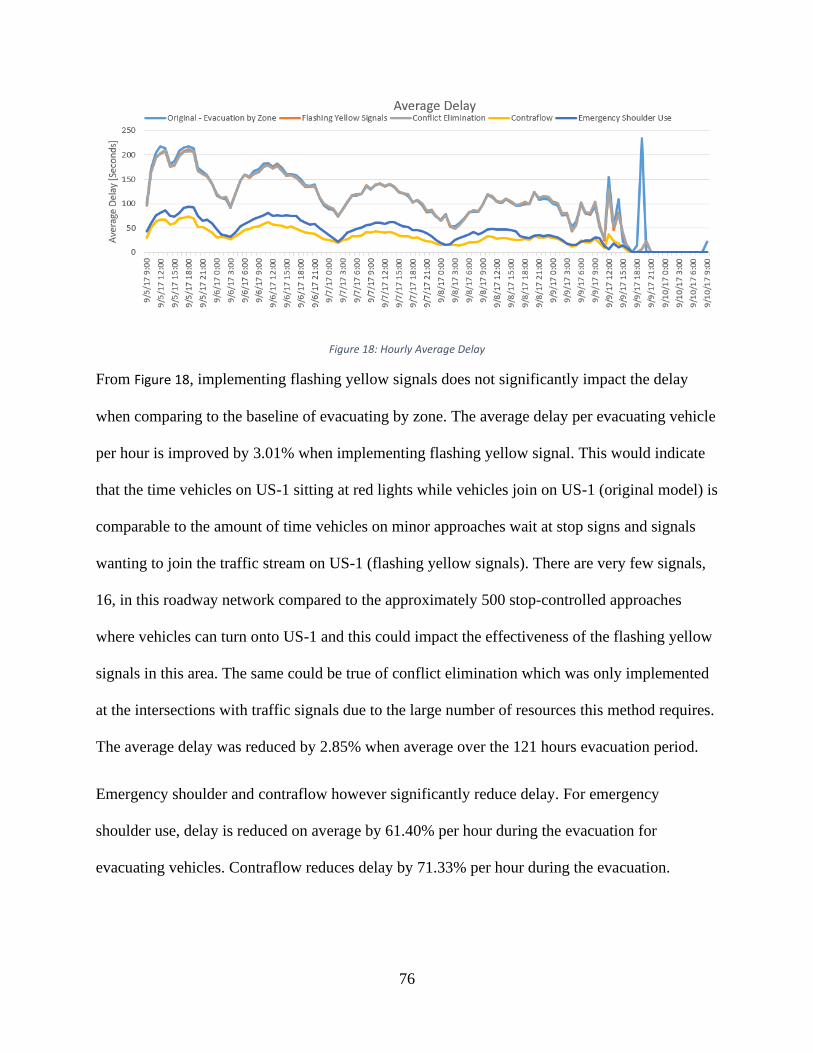
76
Figure 18: Hourly Average Delay
From Figure 18, implementing flashing yellow signals does not significantly impact the delay
when comparing to the baseline of evacuating by zone. The average delay per evacuating vehicle
per hour is improved by 3.01% when implementing flashing yellow signal. This would indicate
that the time vehicles on US-1 sitting at red lights while vehicles join on US-1 (original model) is
comparable to the amount of time vehicles on minor approaches wait at stop signs and signals
wanting to join the traffic stream on US-1 (flashing yellow signals). There are very few signals,
16, in this roadway network compared to the approximately 500 stop-controlled approaches
where vehicles can turn onto US-1 and this could impact the effectiveness of the flashing yellow
signals in this area. The same could be true of conflict elimination which was only implemented
at the intersections with traffic signals due to the large number of resources this method requires.
The average delay was reduced by 2.85% when average over the 121 hours evacuation period.
Emergency shoulder and contraflow however significantly reduce delay. For emergency
shoulder use, delay is reduced on average by 61.40% per hour during the evacuation for
evacuating vehicles. Contraflow reduces delay by 71.33% per hour during the evacuation.
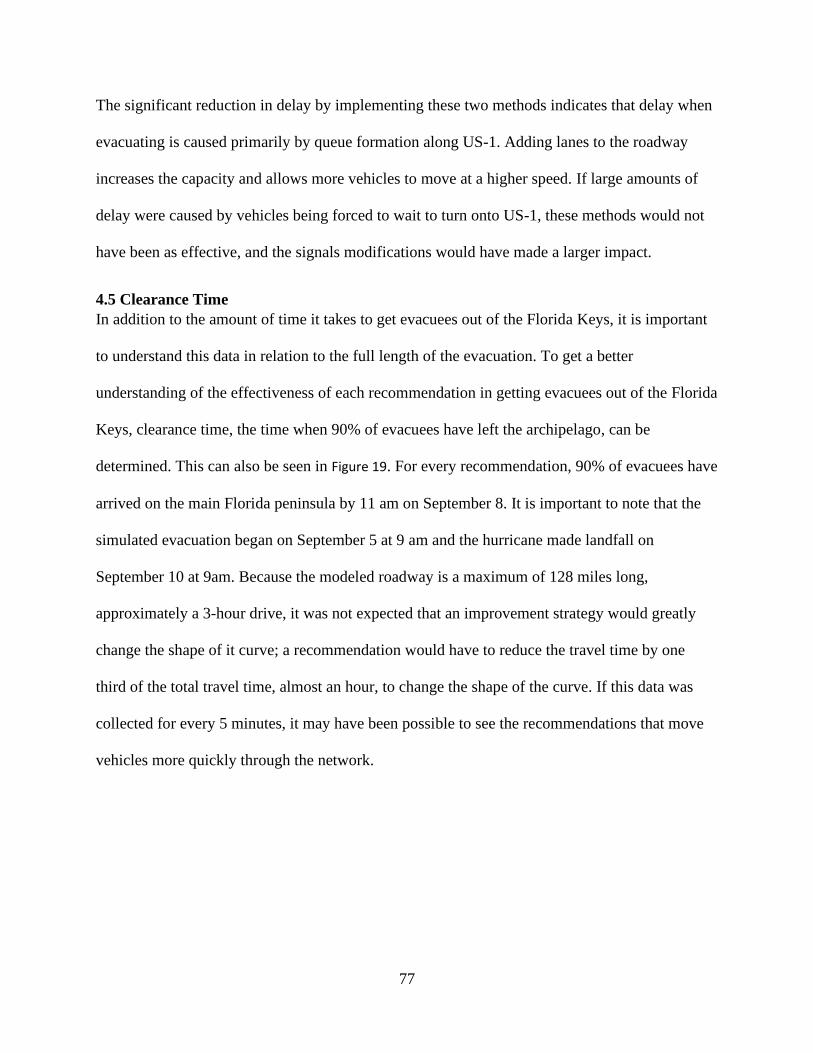
77
The significant reduction in delay by implementing these two methods indicates that delay when
evacuating is caused primarily by queue formation along US-1. Adding lanes to the roadway
increases the capacity and allows more vehicles to move at a higher speed. If large amounts of
delay were caused by vehicles being forced to wait to turn onto US-1, these methods would not
have been as effective, and the signals modifications would have made a larger impact.
4.5 Clearance Time
In addition to the amount of time it takes to get evacuees out of the Florida Keys, it is important
to understand this data in relation to the full length of the evacuation. To get a better
understanding of the effectiveness of each recommendation in getting evacuees out of the Florida
Keys, clearance time, the time when 90% of evacuees have left the archipelago, can be
determined. This can also be seen in Figure 19. For every recommendation, 90% of evacuees have
arrived on the main Florida peninsula by 11 am on September 8. It is important to note that the
simulated evacuation began on September 5 at 9 am and the hurricane made landfall on
September 10 at 9am. Because the modeled roadway is a maximum of 128 miles long,
approximately a 3-hour drive, it was not expected that an improvement strategy would greatly
change the shape of it curve; a recommendation would have to reduce the travel time by one
third of the total travel time, almost an hour, to change the shape of the curve. If this data was
collected for every 5 minutes, it may have been possible to see the recommendations that move
vehicles more quickly through the network.
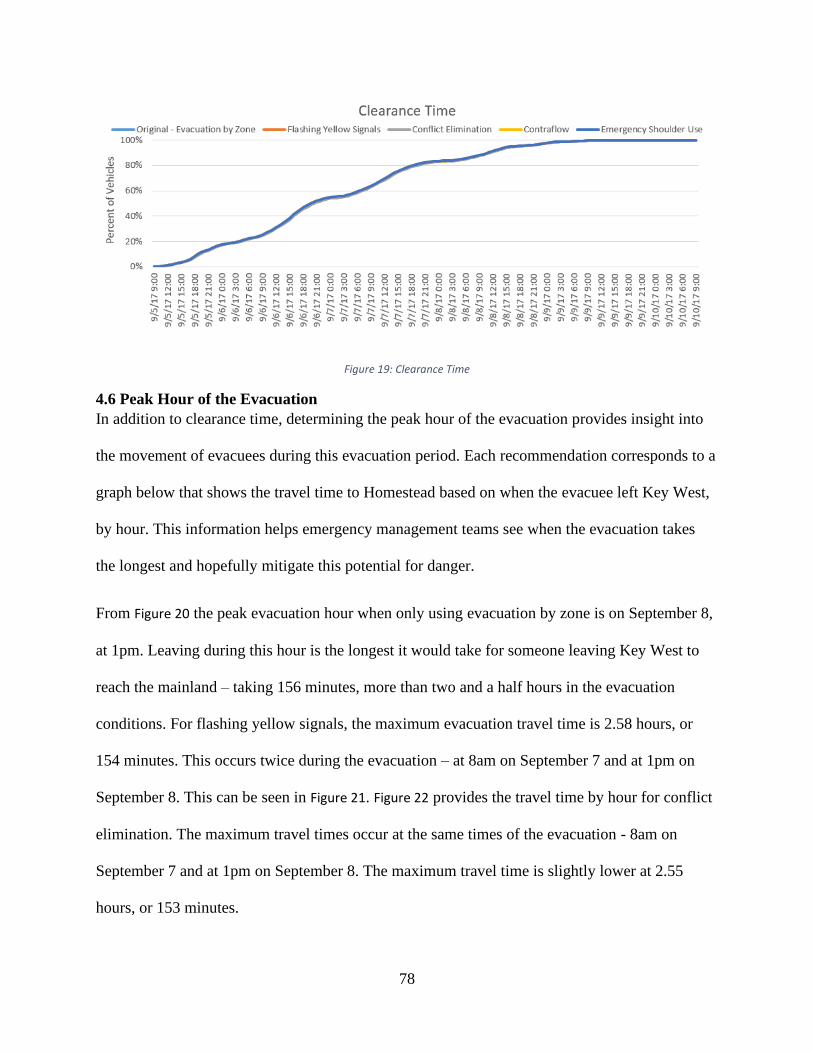
78
Figure 19: Clearance Time
4.6 Peak Hour of the Evacuation
In addition to clearance time, determining the peak hour of the evacuation provides insight into
the movement of evacuees during this evacuation period. Each recommendation corresponds to a
graph below that shows the travel time to Homestead based on when the evacuee left Key West,
by hour. This information helps emergency management teams see when the evacuation takes
the longest and hopefully mitigate this potential for danger.
From Figure 20 the peak evacuation hour when only using evacuation by zone is on September 8,
at 1pm. Leaving during this hour is the longest it would take for someone leaving Key West to
reach the mainland – taking 156 minutes, more than two and a half hours in the evacuation
conditions. For flashing yellow signals, the maximum evacuation travel time is 2.58 hours, or
154 minutes. This occurs twice during the evacuation – at 8am on September 7 and at 1pm on
September 8. This can be seen in Figure 21. Figure 22 provides the travel time by hour for conflict
elimination. The maximum travel times occur at the same times of the evacuation - 8am on
September 7 and at 1pm on September 8. The maximum travel time is slightly lower at 2.55
hours, or 153 minutes.
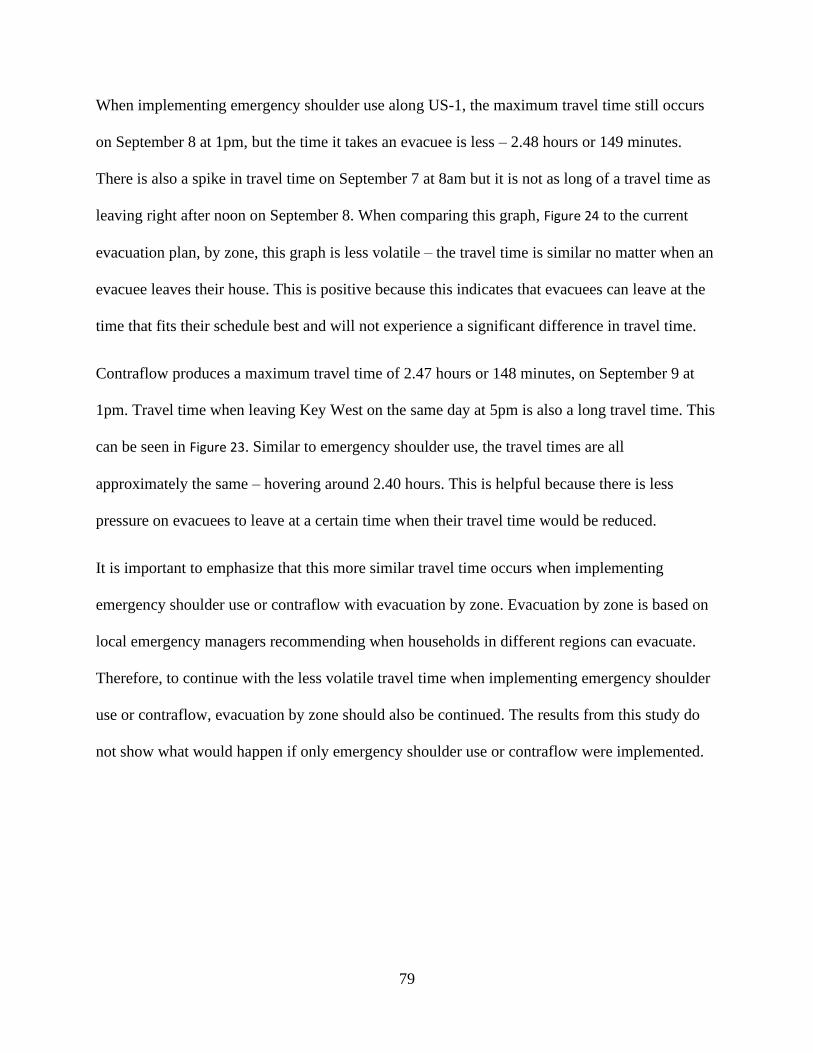
79
When implementing emergency shoulder use along US-1, the maximum travel time still occurs
on September 8 at 1pm, but the time it takes an evacuee is less – 2.48 hours or 149 minutes.
There is also a spike in travel time on September 7 at 8am but it is not as long of a travel time as
leaving right after noon on September 8. When comparing this graph, Figure 24 to the current
evacuation plan, by zone, this graph is less volatile – the travel time is similar no matter when an
evacuee leaves their house. This is positive because this indicates that evacuees can leave at the
time that fits their schedule best and will not experience a significant difference in travel time.
Contraflow produces a maximum travel time of 2.47 hours or 148 minutes, on September 9 at
1pm. Travel time when leaving Key West on the same day at 5pm is also a long travel time. This
can be seen in Figure 23. Similar to emergency shoulder use, the travel times are all
approximately the same – hovering around 2.40 hours. This is helpful because there is less
pressure on evacuees to leave at a certain time when their travel time would be reduced.
It is important to emphasize that this more similar travel time occurs when implementing
emergency shoulder use or contraflow with evacuation by zone. Evacuation by zone is based on
local emergency managers recommending when households in different regions can evacuate.
Therefore, to continue with the less volatile travel time when implementing emergency shoulder
use or contraflow, evacuation by zone should also be continued. The results from this study do
not show what would happen if only emergency shoulder use or contraflow were implemented.
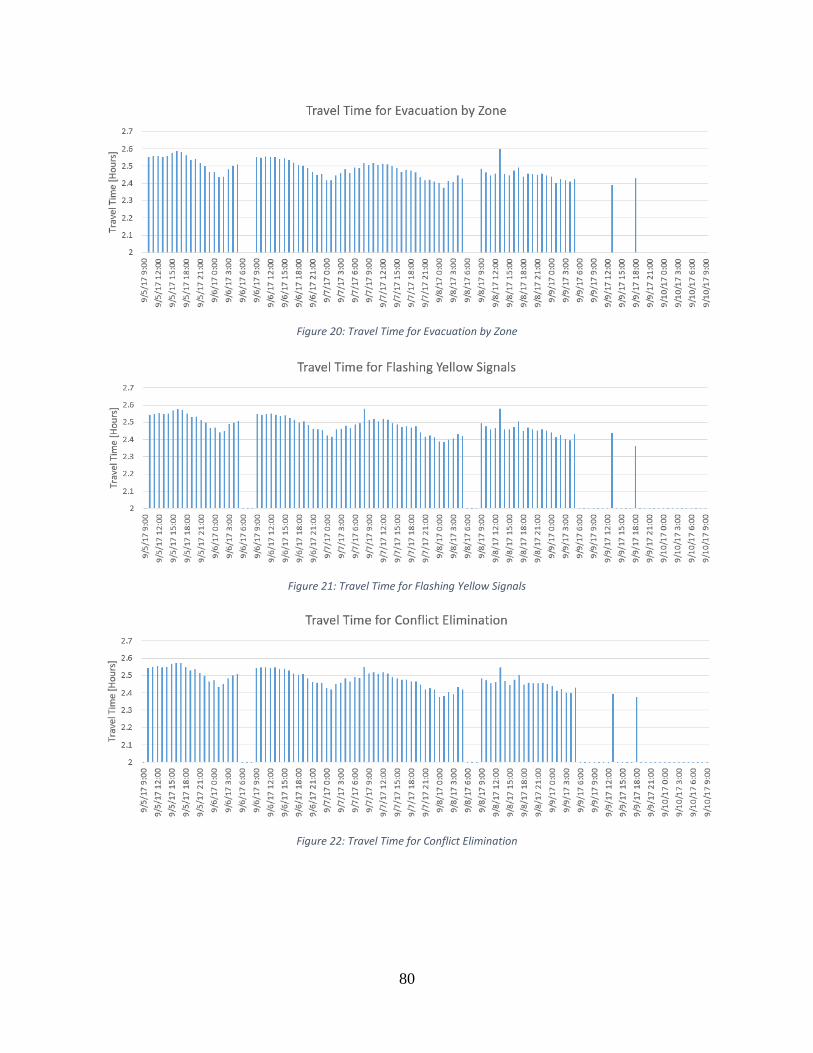
80
Figure 20: Travel Time for Evacuation by Zone
Figure 21: Travel Time for Flashing Yellow Signals
Figure 22: Travel Time for Conflict Elimination
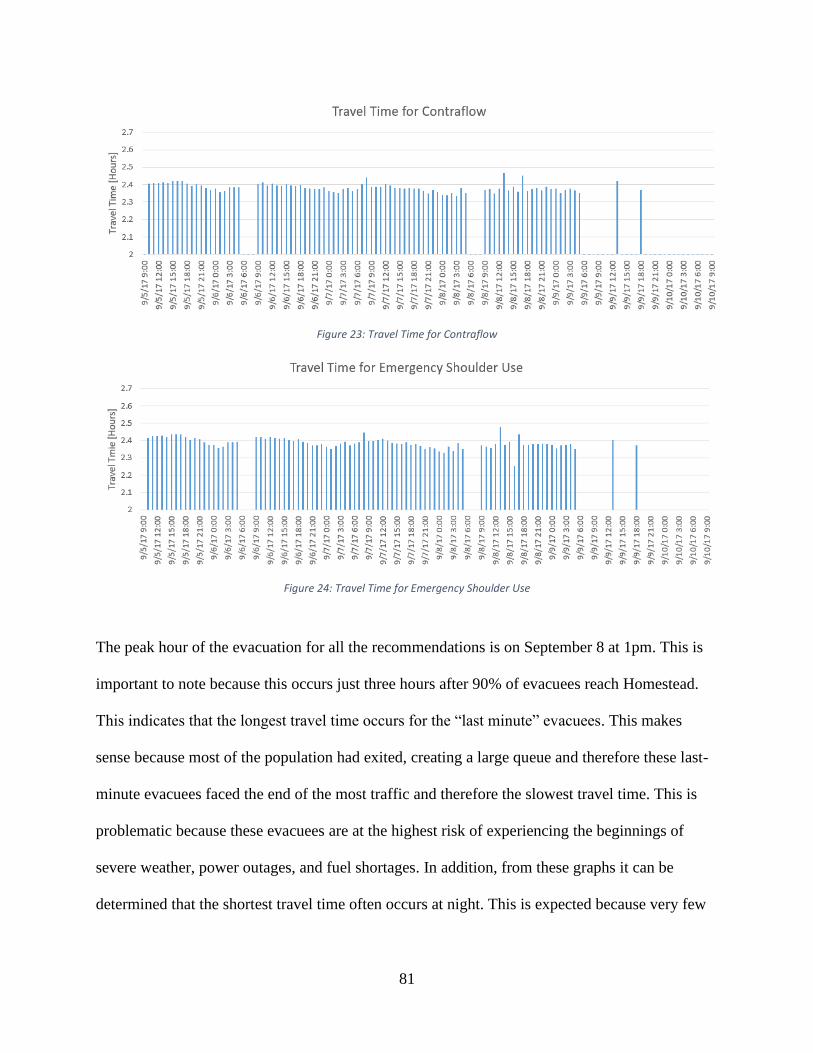
81
Figure 23: Travel Time for Contraflow
Figure 24: Travel Time for Emergency Shoulder Use
The peak hour of the evacuation for all the recommendations is on September 8 at 1pm. This is
important to note because this occurs just three hours after 90% of evacuees reach Homestead.
This indicates that the longest travel time occurs for the “last minute” evacuees. This makes
sense because most of the population had exited, creating a large queue and therefore these last-
minute evacuees faced the end of the most traffic and therefore the slowest travel time. This is
problematic because these evacuees are at the highest risk of experiencing the beginnings of
severe weather, power outages, and fuel shortages. In addition, from these graphs it can be
determined that the shortest travel time often occurs at night. This is expected because very few
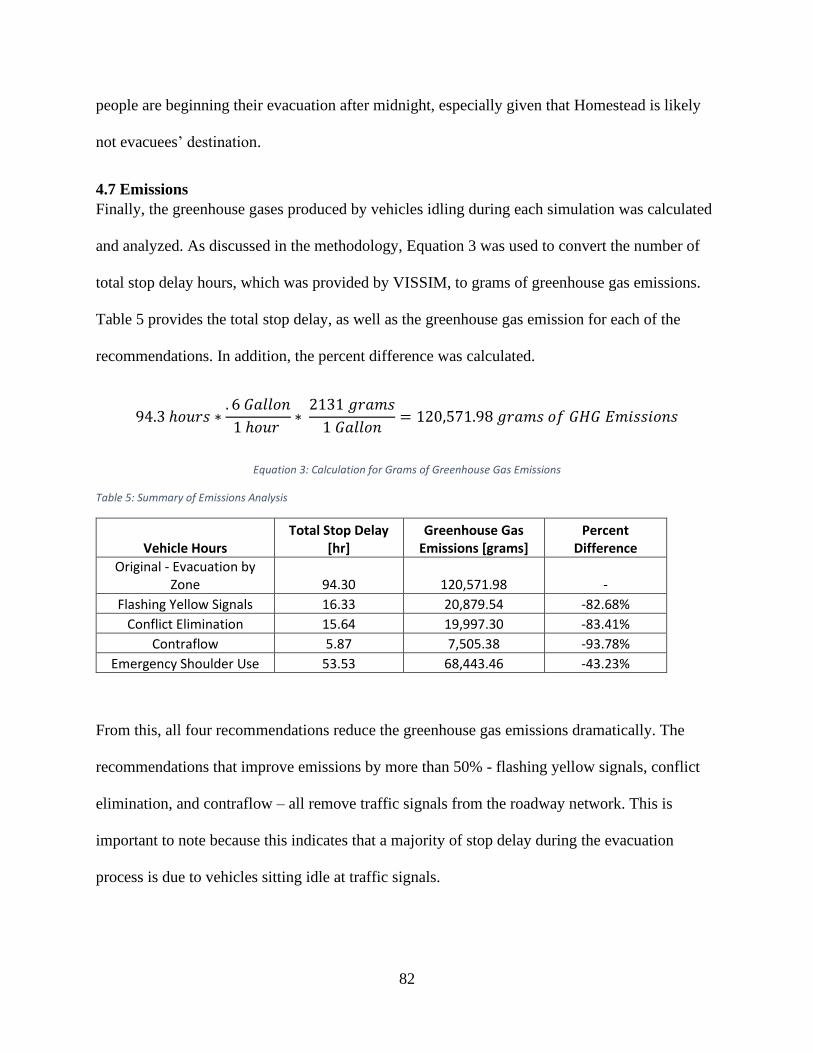
82
people are beginning their evacuation after midnight, especially given that Homestead is likely
not evacuees’ destination.
4.7 Emissions
Finally, the greenhouse gases produced by vehicles idling during each simulation was calculated
and analyzed. As discussed in the methodology, Equation 3 was used to convert the number of
total stop delay hours, which was provided by VISSIM, to grams of greenhouse gas emissions.
Table 5 provides the total stop delay, as well as the greenhouse gas emission for each of the
recommendations. In addition, the percent difference was calculated.
94.3 ℎ𝑜𝑢𝑟𝑠 ∗. 6 𝐺𝑎𝑙𝑙𝑜𝑛
1 ℎ𝑜𝑢𝑟 ∗
2131 𝑔𝑟𝑎𝑚𝑠
1 𝐺𝑎𝑙𝑙𝑜𝑛= 120,571.98 𝑔𝑟𝑎𝑚𝑠 𝑜𝑓 𝐺𝐻𝐺 𝐸𝑚𝑖𝑠𝑠𝑖𝑜𝑛𝑠
Equation 3: Calculation for Grams of Greenhouse Gas Emissions
Table 5: Summary of Emissions Analysis
Vehicle Hours Total Stop Delay
[hr] Greenhouse Gas
Emissions [grams] Percent
Difference
Original - Evacuation by Zone 94.30 120,571.98 -
Flashing Yellow Signals 16.33 20,879.54 -82.68%
Conflict Elimination 15.64 19,997.30 -83.41%
Contraflow 5.87 7,505.38 -93.78%
Emergency Shoulder Use 53.53 68,443.46 -43.23%
From this, all four recommendations reduce the greenhouse gas emissions dramatically. The
recommendations that improve emissions by more than 50% - flashing yellow signals, conflict
elimination, and contraflow – all remove traffic signals from the roadway network. This is
important to note because this indicates that a majority of stop delay during the evacuation
process is due to vehicles sitting idle at traffic signals.
83
Emergency shoulders use still uses traffic signals as the traffic control device, so the reduction in
stop delay and emissions may come from the reduction of idling in queues. This is further
supported by contraflow’s extremely low total stop delay and greenhouse gas emissions.
Contraflow does not have traffic control devices on US-1 and a doubled capacity, which should
reduce stop delay at traffic signals and in queues, producing such a low number of emissions
from idling.
4.8 Summary of Analysis
Table 6 provides a summary of the previous data discussed. These recommendations would need
to be implemented in addition with evacuation by zone for similar results to occur during an
evacuation. The results from this study do not indicate the outcome if only the recommendation
was implemented. The percent difference shows the improvement caused by the addition of the
recommendation to the current evacuation plan, evacuation by zone. Rank orders the
recommendations for each analysis category, with 1 being the best and 4 being the worst. The
final row provides the total score for each recommendation. Contraflow received a 1, as the best
in each category. Emergency shoulder use received a score of 10, as the second best in the three
categories relating to time and vehicle movement. Conflict elimination and flashing yellow
signals both received scores of 13, making them the least effective.
As evidenced by the numbers in the summary table, contraflow and emergency shoulder use
were the two recommendations that had the lowest total and therefore the largest positive impact
on the evacuation process in the Florida Keys. Further discussion on each of these methods is
provided below to aid in making a final recommendation for local emergency management
officials.

84
Table 6: Analysis Summary Table
TotalRank
TotalRank
Time at 90%Rank
AverageRank
TotalRank
Total
Flashing Yellow Signals65,897 (-0.02%)
312,283 (-3.01%)
39/8/17 at 11 am
-2.48 (-.01%)
420,880 (-82.68%)
313
Conflict Elimination65,889 (-0.01%)
412,303 (-2.85%)
49/8/17 at 11 am
-2.48 (-.08%)
319,997 (-83,41%)
213
Contraflow58,770 (-10.80%)
13,630 (-71.33%)
19/8/17 at 11 am
-2.38 (-3.98%)
16,904 (-93.78%)
14
Ememrgency Shoulder Use59,318 (-9.97%)
24,888 (-61.40%)
29/8/17 at 11 am
-2.39 (-3.80%)
268,443 (-43.23%)
410
Vehicle-Hours [hours]Avg Hourly Delay [secs]
Clearance TimeTravel Time [hours]
Emissions [grams]
85
Contraflow, although it reduced delay significantly, produced a very small amount of greenhouse
gases, and improved the efficiency of the evacuation, is an evacuation technique that requires
significant resources and may present safety challenges which must be addressed. If operating in
contraflow conditions on US-1 in the Florida Keys, it would be difficult for hurricane-essential
supplies, like gasoline, non-perishable food, and bottled water, to reach the southwest islands. In
addition, emergency vehicles and first responders would have difficulty in reaching homes and
people in danger. In other geographical locations, there are other routes that supply trucks, and
first responders could take to reach their destination, but this is not true in the Florida Keys.
There is only one road, US-1, that connect the islands. In addition, implementing contraflow on
US-1 would require significant amounts of resources – signs, police officers, and barricades that
would be needed. This creates additional challenge because prior to a hurricane, local resources
are focused on preparing the area for the disaster. There are also safety risks that could occur
when operating a roadway in a way that it was not designed to handle. Therefore, while
contraflow is likely to result in the most efficient movement of evacuees, it may not be a suitable
given the limited road network and practical challenges presented by its implementation.
Emergency shoulder use provided significantly improved results when compared to the current
evacuation plan, evacuation by zone, just as contraflow did, but comes with less risk. Emergency
vehicles, supply trucks, and non-evacuating citizens are still able to travel freely along US-1 in
the southbound direction, unlike with contraflow. In addition, operating emergency shoulder
does not require significant resources during the evacuation. Often, signs are used to indicate that
the shoulder is open for use in an emergency. This does not require a large number of law
enforcement officers or time to set up the roadway for use. One of the largest risks with
operating emergency shoulder is maintaining a safe driving experience. Emergency shoulder use
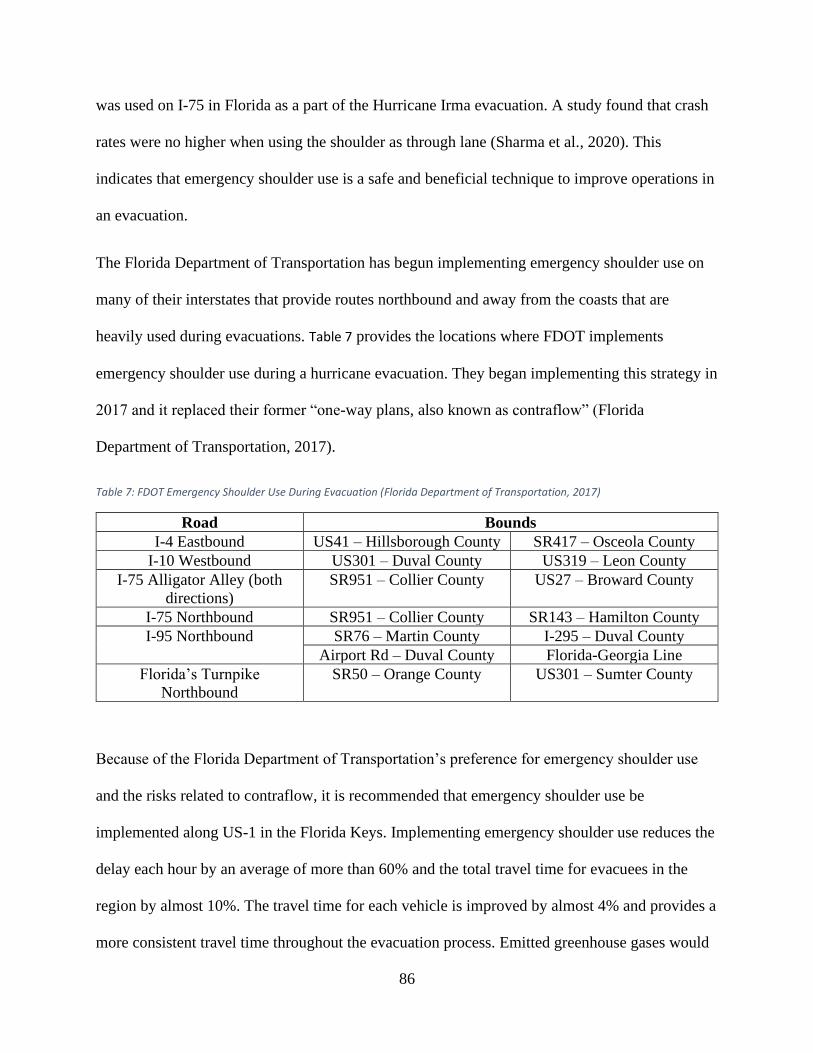
86
was used on I-75 in Florida as a part of the Hurricane Irma evacuation. A study found that crash
rates were no higher when using the shoulder as through lane (Sharma et al., 2020). This
indicates that emergency shoulder use is a safe and beneficial technique to improve operations in
an evacuation.
The Florida Department of Transportation has begun implementing emergency shoulder use on
many of their interstates that provide routes northbound and away from the coasts that are
heavily used during evacuations. Table 7 provides the locations where FDOT implements
emergency shoulder use during a hurricane evacuation. They began implementing this strategy in
2017 and it replaced their former “one-way plans, also known as contraflow” (Florida
Department of Transportation, 2017).
Table 7: FDOT Emergency Shoulder Use During Evacuation (Florida Department of Transportation, 2017)
Road Bounds
I-4 Eastbound US41 – Hillsborough County SR417 – Osceola County
I-10 Westbound US301 – Duval County US319 – Leon County
I-75 Alligator Alley (both
directions)
SR951 – Collier County US27 – Broward County
I-75 Northbound SR951 – Collier County SR143 – Hamilton County
I-95 Northbound SR76 – Martin County I-295 – Duval County
Airport Rd – Duval County Florida-Georgia Line
Florida’s Turnpike
Northbound
SR50 – Orange County US301 – Sumter County
Because of the Florida Department of Transportation’s preference for emergency shoulder use
and the risks related to contraflow, it is recommended that emergency shoulder use be
implemented along US-1 in the Florida Keys. Implementing emergency shoulder use reduces the
delay each hour by an average of more than 60% and the total travel time for evacuees in the
region by almost 10%. The travel time for each vehicle is improved by almost 4% and provides a
more consistent travel time throughout the evacuation process. Emitted greenhouse gases would
87
be reduced by an estimated 40% if emergency shoulder use were implemented. This indicates
that implementing emergency shoulder use may likely help move evacuees out of the Florida
Keys more quickly and safely. This decision and the results from this analysis ultimately helps
with the planning, mitigation, response, recovery, and adaptation of the Florida Keys from
hurricanes and other natural disasters.
88
5.0 CONCLUSION
The Florida Keys is a unique archipelago with one roadway connecting the islands and the main
peninsula of Florida. This creates different challenges for the region when facing a natural
disaster like a hurricane. Because of this, comparing evacuation techniques and standards of
other regions can provide a baseline but additional research and understanding is needed to best
advance the evacuation process.
The goal of this research was to provide recommendations to the local emergency response
teams and other stakeholders for improvement in the evacuation process in the Florida Keys. A
methodology, including data collection, building a model of the roadways in the region,
calibrating and validating the model, modeling recommendations, and analyzing the results, was
completed to achieve this. Relevant research was analyzed and discussed in the literature review
to gain a better understanding of the evacuation process, the difficulties surrounding evacuations,
and possible improvements that could be implemented.
Data collected included the number of lanes and their widths for each segment of US-1,
population by census tract, and the location of traffic control devices in the corridor. A
unidirectional model was built in PTV VISSIM, which included the 128 miles of roadway
between Key West and Homestead, 512 approaches where evacuees may be turning onto US-1,
the appropriate traffic control devices, and other modeling features. The vehicle inputs were then
calculated from traffic counts from the Hurricane Irma evacuation and inserted into the model in
the calibration phases. Adjustments were made to the inputs until the model reflected the real
traffic counts at two different data collection points. During validation, the traffic counts at the
final data collection location in real life were compared to the simulation, further verifying the
legitimacy of the model.
89
Changes were then made to the base model to reflect the different recommendations: flashing
yellow signals, conflict elimination, contraflow, and emergency shoulder use. This required
adding lanes, making changes to the traffic control devices at intersections, and modifying
connectors. These models were then run five times and the results averaged for analysis.
Network performance data, travel time, and clearance time were all analyzed to better understand
the evacuation process with each recommendation better.
Both flashing yellow signals and conflict elimination were not highly effective. It is predicted
that this was caused by the low proportion of signalized intersections where these techniques
could be implemented. The recommendations that change the capacity of the roadway,
contraflow and emergency shoulder use, were much more effective in improving the evacuation
for residents of the Florida Keys.
Ultimately, emergency shoulder use is the best recommendation to implement in the Florida
Keys. Emergency shoulder use reduces total travel time and the average delay a vehicle faces
while evacuating. Emergency shoulder differs from contraflow in the sense that it does not
require as many resources to operate and still allows vehicles to travel in the opposing direction.
The favoring of emergency shoulder use over contraflow can be seen in policy changes made in
recent years by the Florida Department of Transportation, as they implement emergency
shoulder use on the major evacuation routes in the state.
5.1 Limitations
There are some limitations to this study. Because of the unique calibration method – using traffic
counts from a hurricane evacuation – there is no way to remove the existing evacuation plan of
the Florida Keys from the base model. Obviously, the method used in this research still produces
a result that can be implemented and is valuable to the community, but it does complicate
90
recommending the same methods to other communities. This is an area where the research could
be expanded and is discussed further below.
In addition, the results provided by the clearance time analysis did not provide information that
differentiated the various recommendations from the base model. This was caused by not
collecting data on a frequent enough interval. Collecting data every minute would have been
most effective and aid in the ability to see the difference in each recommendation’s ability to get
vehicles to the end of the roadway network quickest. Collecting and manipulating data for every
minute of a 121-hour evacuation would be a challenge though. This limits the outcomes from the
analysis.
The process used to calculate greenhouse gas emissions also limits the analysis conducted in this
paper. A different emission calculation process could be used that takes into account the time of
the emission production in relationship to the weather, vehicle fuel and engine type, age, and
load, and meteorological effects on the emissions given the unique atmosphere that creates a
hurricane. This would ultimately provide insight into the environmental impact this process has.
5.2 Future Work
This research contributes to the body of knowledge in two distinct ways: model calibration and
by estimating the emissions created by the evacuation. For model calibration, this research uses a
combination of census data and traffic counts from a hurricane evacuation to determine when
and where vehicles were entering the network. The census population was scaled to match the
number of evacuating vehicles, which simultaneously accounts for trip generation, trip
distribution, and vehicle occupancy.
Estimating the emissions brings a different type of analysis to the discussion. This is evidenced
by the results of this study. The recommendations that were less successful at improving the
91
evacuation conditions, flashing yellow signals and conflict elimination, were rather effective at
reducing greenhouse gas emissions. Very little research has been conducted on the relationship
between hurricane evacuations and the environment and this research begins that discussion.
This research could expand in many different directions. As discussed previously, each of the
recommendations was modeled with inputs based on evacuation by zone. The other
recommendations did not hinder the evacuation and therefore could be used in combination with
emergency shoulder use. This would provide further insight into improving the evacuation
process while implementing emergency shoulder use. This would be beneficial because in some
of the analysis categories, like greenhouse gas emissions, idling at traffic signals or while waiting
to merge on US-1 was where emergency shoulder use was lacking. Changing the intersections to
be flashing yellow signals could possibly improve the evacuation process further.
In contrast to that, additional research could be completed to understand how using evacuation
by zone as part of the base model effects emergency shoulder use, as well as the other
recommendations. It would be interesting to determine if emergency shoulder use is as effective
without evacuation by zone. Completing similar research to this, but with a different calibration
method, would allow these results to be determined. It seems that the recommendations that
alter the intersections could possibly be more effective if longer queues were forming if all the
residents in an area chose to evacuate at the same time. This information would be a beneficial
resource for other island and coastal communities similar to the Florida Keys geographically, but
do not use evacuation by zone.
One aspect of an evacuation not really discussed in this research is safety. Additional research
could be conducted on the impact of crashes at different points along the roadway network have
on the evacuation. In addition to this, the recommendations could also be analyzed with these
92
crashes as a part of the simulation. It is possible that a different recommendation would be more
effective if the queuing and movement of vehicles is happening in a different pattern.
This research idea could be taken a step further by determining the safety implications of each of
these recommendations. As discussed in the literature review, there is little knowledge about the
safety of these recommendations, especially in the unique driving conditions that occur during an
evacuation. Because of this, additional work is needed to determine the crash modification factor
and safety implications these recommendations have.
The unique model calibration process used in this project adds to the body of knowledge but also
limits the potential to apply the findings from this research to other communities. Estimating the
emissions produced by the evacuation also adds to the body of knowledge on hurricane
evacuations. In the future, research can be conducted to further the understanding of these limits
and better acknowledge the evacuation process in a unique geographical location, like the Florida
Keys. There is still so much to learn about evacuations, the process in the Florida Keys, and
ways to improve this process. This research built a model of the Florida Keys, modified the
model to reflect various improvements, and analyzed the results. Ultimately, it was found that
emergency shoulder use in combination with evacuation by zone is the best recommendation to
use in the Florida Keys.
93
6.0 REFERENCES
Associated Press. “Curfew Lifted in Florida Keys 3 Weeks After Hurricane Irma.” U.S. News &
World Report, U.S. News & World Report, 2 Oct. 2017, www.usnews.com/news/best-
states/florida/articles/2017-10-02/curfew-lifted-in-florida-keys-3-weeks-after-hurricane-
irma.
Associated Press. (2020, August 27). Hurricanes have gotten more destructive. here's why.
Retrieved March 31, 2021, from
https://www.nbcnews.com/science/environment/hurricanes-gotten-destructive-rcna100
Barth, M., & Boriboonsomsin, K. (2009). Traffic Congestion and Greenhouse Gases. Access.
doi:https://www.accessmagazine.org/wp-
content/uploads/sites/7/2016/01/access35_Traffic_Congestion_and_Grenhouse_Gases.pdf
Britannica, T. Editors of Encyclopedia (2020, October 22). Dunkirk evacuation.
Encyclopedia Britannica. https://www.britannica.com/event/Dunkirk-evacuation
Congress of the United States. (2019). Expected Costs of Damage From Hurricane Winds and
Storm-Related Flooding. Retrieved 2020, from Congressional Budget Office
Dixit, Vinayak; Wolshon, Brian. Evacuation traffic dynamics. Transportation Research Part C:
Emerging Technologies, Volume 49, Issue 0, 2014, pp 114-125.
https://trid.trb.org/view/1333104
Energy Systems Division. (2014). Idling Reduction Savings Calculator [PDF]. Lemont: Argonne
National Laboratory.
Evacuation Behavior and its Mobility Impacts in Coastal Communities from Across the Nation.
[Project]. Office of the Assistant Secretary for Research and Technology. Start date: 1
Jul. 2020. https://trid.trb.org/view/1740687
Feng, Kairui; Lin, Ning; Xian, Siyuan; Chester, Mikhail V. Can we evacuate from hurricanes
with electric vehicles?. Transportation Research Part D: Transport and Environment,
Volume 86, Issue 0, 2020.https://trid.trb.org/view/1723465
Florida Association of Counties. (2017). Hurricane Evacuation Report. Retrieved November 10,
2020, from https://www.fl-counties.com/sites/default/files/2018-
02/Evacuations%20Report.pdf
Florida Department of Transportation. (2017). Emergency shoulder USE (ESU). Retrieved
March 18, 2021, from https://www.fdot.gov/emergencymanagement/esu/default.shtm
Fries, Ryan; Chowdhury, Mashrur; Ma, Yongchang; Stephen, Liz. Evaluation of different
94
contraflow strategies for hurricane evacuation in Charleston, South Carolina.
Transportation Planning and Technology, Volume 34, Issue 2, 2011, pp 139-154
https://trid.trb.org/view/1101639
Gehlot, Hemant; Sadri, Arif M; Ukkusuri, Satish V. Joint modeling of evacuation departure and
travel times in hurricanes. Transportation, Volume 46, Issue 6, 2019, pp 2419-2440
https://trid.trb.org/view/1667089
Gudishala, Ravindra; Wilmot, Chester. Modeling Emergency Managers’ Hurricane Evacuation
Decisions. Transportation Research Record: Journal of the Transportation Research
Board, Issue 2604, 2017, pp 82–87. https://trid.trb.org/view/1439580
History.com Editors. (2010, August 27). Pompeii. Retrieved March 31, 2021, from
https://www.history.com/topics/ancient-history/pompeii
Hurricanes and climate change. (2020, December 15). Retrieved March 31, 2021, from
https://www.c2es.org/content/hurricanes-and-climate-change/
Idling Cost Calculator [XLS]. (2006). Richmond: E3 Fleet.
Jansen, Bart. “Timeline: Hurricane Irma's Progress to Monster Storm.” USA Today, Gannett
Satellite Information Network, 10 Sept. 2017,
www.usatoday.com/story/news/2017/09/10/timeline-hurricane-irma-fluctuating-
strgrowing-stronger-weaker-crashed-into-caribbean-islands-florid/651421001/.
Lindell, Michael K; Sorensen, John H; Baker, Earl J; Lehman, William P. Community response
to hurricane threat: Estimates of household evacuation preparation time distributions.
Transportation Research Part D: Transport and Environment, Volume 85, Issue 0, 2020.
https://trid.trb.org/view/1719163
Lu, Weike; Wang, Feng; Liu, Lan; Hu, Guojing. Identifying Bottlenecks in Roadway Networks
in Hurricane Evacuation. Journal of Transportation Engineering, Part A: Systems,
Volume 144, Issue 9, 2017, 04018047. https://trid.trb.org/view/1517192
Maghelal, Praveen; Li, Xiangyu; Peacock, Walter Gillis. Highway congestion during evacuation:
examining the household’s choice of number of vehicles to evacuate. Natural Hazards,
Volume 87, Issue 3, 2017, pp 1399-1411. https://trid.trb.org/view/1559962
Marshall, A. (2019, May 22). 4 maps that show the GIGANTIC Hurricane Irma Evacuation.
Retrieved March 10, 2021.
McCurry, J. (2011, March 16). Radiation spike FORCES Evacuations at Fukushima nuclear
power station. Retrieved March 31, 2021, from
https://www.theguardian.com/world/2011/mar/16/fukushima-workers-evacuate-radiation-
spikes
95
Menon, Nikhil; Staes, Brian; Bertini, Robert L. Measuring Transportation Network Performance
During Emergency Evacuations: A Case Study of Hurricane Irma and Woolsey Fire.
University of South Florida, Tampa; Center for Transportation Equity, Decisions &
Dollars (CTEDD); Office of the Assistant Secretary for Research and Technology, 2020,
117p, https://trid.trb.org/view/1718423
Monroe County. (2020). Evacuation Information. Retrieved November 10, 2020, from
https://www.monroecounty-fl.gov/897/Evacuation-Information
Montz, Thomas; Zhang, Zhao. Modeling Regional Hurricane Evacuation Events: Calibration and
Validation. Natural Hazards Review, Volume 16, Issue 4, 2015, 04015007
https://trid.trb.org/view/1371886
Multiscale model for hurricane evacuation and fuel shortage. [Project]. Center for Advanced
Transportation Mobility, Office of the Assistant Secretary for Research and Technology.
Start date: 1 Feb. 2019. https://trid.trb.org/view/1631771
O'Connor, Amy. “Florida's Hurricane Irma Recovery: The Cost, The Challenges, The Lessons.”
Insurance Journal, 4 Dec. 2017.
Parr, S. A., Wolshon, B., & Murray-Tuite, P. (2016). Unconventional Intersection Control
Strategies for Urban Evacuation. Transportation Research Record, 2599(1), 52–62.
https://doi.org/10.3141/2599-07
Parr, Scott; Wolshon, Brian; Zhang, Zhao. Evaluating Coastal and River Valley Communities
Evacuation Network Performance Using Macroscopic Productivity. California State
University, Fullerton; Louisiana State University; Beihang University; Maritime
Transportation Research and Education Center (MarTREC); Office of the Assistant
Secretary for Research and Technology, 2017, 22p. https://trid.trb.org/view/1475243
Real-Time Recommendations for Traffic Control in an Intelligent Transportation System during
an Emergency Evacuation – Part 2. [Project]. Center for Advanced Transportation
Mobility, Office of the Assistant Secretary for Research and Technology. Start date: 1
Jun. 2020.https://trid.trb.org/view/1706836
Robinson, R. Michael; Collins, Andrew J; Jordan, Craig A; Foytik, Peter; Khattak, Asad J.
Modeling the impact of traffic incidents during hurricane evacuations using a large scale
microsimulation. International Journal of Disaster Risk Reduction, Volume 31, Issue 0,
2018, p 1159-1165. https://trid.trb.org/view/1553046
Roy, Kamol Chandra; Hasan, Samiul. Modeling the Dynamics of Hurricane Evacuation
Decisions from Real-time Twitter Data. Transportation Research Board 98th Annual
Meeting, Transportation Research Board, 2019, 8p. https://trid.trb.org/view/1573010
Savransky, R. (2017, September 05). Florida governor declares state of emergency over

96
Hurricane Irma. Retrieved March 10, 2021.
Sharma, Rakesh; Faruk, Md Omar; El-Urfali, Alan. Operational and Safety Impact Analysis of
Implementing Emergency Shoulder Use (ESU) for Hurricane Evacuation. Transportation
Research Record: Journal of the Transportation Research Board, 2020
https://trid.trb.org/view/1681903
Sullivan, L. (2005). How New Orleans' Evacuation Plan Fell Apart. Retrieved November 10,
2020, from https://www.npr.org/templates/story/story.php?storyId=4860776
Tang, Jiayi; McNabola, Aonghus; Misstear, Bruce. The potential impacts of different traffic
management strategies on air pollution and public health for a more sustainable city: A
modelling case study from Dublin, Ireland. Sustainable Cities and Society, Volume 60,
Issue 0, 2020. https://trid.trb.org/view/1709711
The causes of climate change. (2021, February 08). Retrieved March 31, 2021, from
https://climate.nasa.gov/causes/
United States, National Oceanic and Atmospheric Administration (NOAA), Nation Hurricane
Center. (2017). IRMA Graphics Archive: 5-day Forecast Track, Initial Wind Field and
Watch/Warning Graphic.
United States Census Bureau. (2011, March 17). 2010 U.S. Census Tracts in Florida [Shapefile].
Washington D.C.
United States Census Bureau. (2019). Hurricanes. Retrieved November 10, 2020, from
https://www.census.gov/topics/preparedness/events/hurricanes.2019.html
Wang, Feng; Bu, Lei. Development of a Large-Scale Traffic Simulation Model for Hurricane
Evacuation of Mississippi Coastal Region. Jackson State University; Maritime
Transportation Research and Education Center (MarTREC); Research and Innovative
Technology Administration, 2015, 34p. https://trid.trb.org/view/1370752
Wile, Rob. “Hurricane Irma, Harvey: AccuWeather's Economic Cost Estimate | Money.” Time,
Time, 11 Sept. 2017, time.com/money/4935684/hurricane-irma-harvey-economic-cost/.
Wolshon, Brian; McArdle, Ben. Traffic Impacts and Dispersal Patterns on Secondary Roadways
during Regional Evacuations. Natural Hazards Review, Volume 12, Issue 1, 2011, pp 19-
27 https://trid.trb.org/view/1090548
Wong, Stephen; Shaheen, Susan; Walker, Joan. Understanding Evacuee Behavior: A Case Study
of Hurricane Irma. University of California, Berkeley, 2018, 72p.
https://trid.trb.org/view/1575334

97
Wu, Yuankai; Tan, Huachun; Qin, Lingqiao; Ran, Bin. Differential variable speed limits control
for freeway recurrent bottlenecks via deep actor-critic algorithm. Transportation Research
Part C: Emerging Technologies, Volume 117, Issue 0, 2020, 102649.
https://trid.trb.org/view/1717206
Xu, Kecheng; Davidson, Rachel A; Nozick, Linda K; Wachtendorf, Tricia; DeYoung, Sarah E.
Hurricane evacuation demand models with a focus on use for prediction in future events.
Transportation Research Part A: Policy and Practice, Volume 87, 2016, pp 90-101
https://trid.trb.org/view/1403490
Yang, Hong; Morgul, Ender Faruk; Ozbay, Kaan; Xie, Kun. Modeling Evacuation Behavior
Under Hurricane Conditions. Transportation Research Record: Journal of the
Transportation Research Board, Issue 2599, 2016, pp 63–69.
https://trid.trb.org/view/1394252
Yi, Wenqi; Nozick, Linda; Davidson, Rachel; Blanton, Brian; Colle, Brian. Optimization of the
issuance of evacuation orders under evolving hurricane conditions. Transportation
Research Part B: Methodological, Volume 95, 2017, pp 285-304.
https://trid.trb.org/view/1440591
Yuan, Yunjie; Pel, A J; Hoogendoorn, S P. The Transition between Normal and Emergency
Driving Behaviour during Evacuation and its Implications for Traffic Flow Operations
and Traffic Management. 17th International IEEE Conference on Intelligent
Transportation Systems (ITSC14), Institute of Electrical and Electronics Engineers
(IEEE), 2014, pp 2700-2705. https://trid.trb.org/view/1349547
Zhang, Zhao; Wolshon, Brian. Gulf Coast Megaregion Evacuation Traffic Simulation Modeling
and Analysis. Louisiana State University, Baton Rouge; Southwest Region University
Transportation Center; Research and Innovative Technology Administration, 2015, 34p
https://trid.trb.org/view/1409650
Zhu, Yi-Jie; Hu, Yujie; Collins, Jennifer M. Estimating road network accessibility during a
hurricane evacuation: A case study of hurricane Irma in Florida. Transportation Research
Part D: Transport and Environment, Volume 83, Issue 0, 2020, 102334
https://trid.trb.org/view/1696912