Embed Size (px)
Citation preview
Assessment of Fair Housing Tool for Local Governments (LG2015)OMB Control Number: 2529-0054
i
Assessment of Fair Housing Tool
Table of Contents
I. Cover Sheet
II. Executive Summary
III. Community Participation Process
IV. Assessment of Past Goals and Actions
V. Fair Housing Analysis
A. Demographic Summary
B. General Issues
i. Segregation/Integration
ii. Racially or Ethnically Concentrated Areas of Poverty (R/ECAPs)
iii. Disparities in Access to Opportunity
iv. Disproportionate Housing Needs
C. Publicly Supported Housing Analysis
D. Disability and Access Analysis
E. Fair Housing Enforcement, Outreach Capacity, and Resources Analysis
VI. Fair Housing Goals and Priorities
VII. Appendices and Instructions
A. Instructions
B. Appendix A – HUD-Provided Maps
C. Appendix B – HUD-Provided Tables
D. Appendix C – Descriptions of Potential Contributing Factors

Assessment of Fair Housing Tool for Local Governments (LG2015)OMB Control Number: 2529-0054
ii
I. Cover Sheet
1. Submission date: October 4, 2017
2. Submitter name: Hidalgo County
3. Type of submission (e.g., single program participant, joint submission):
Joint Submission
4. Type of program participant(s) (e.g., consolidated plan participant, PHA):
Consolidated Plan Participant and PHA
5. For PHAs, Jurisdiction in which the program participant is located:
Hidalgo County
6. Submitter members (if applicable):
1. Hidalgo County Urban County Program
2. City of Edinburg
3. City of McAllen
4. City of Mission
5. City of Pharr
6. Housing Authority of the County of Hidalgo
7. Housing Authority of the City of Alamo
8. Housing Authority of the City of Donna
9. Housing Authority of the City of Edinburg
10. Housing Authority of the City of Edcouch
11. Housing Authority of the City of Elsa
Assessment of Fair Housing Tool for Local Governments (LG2015)OMB Control Number: 2529-0054
iii
12. Housing Authority of the City of Hidalgo
13. Housing Authority of the City of La Joya
14. Housing Authority of the City of McAllen
15. Housing Authority of the City of Mercedes
16. Housing Authority of the City of Mission
17. Housing Authority of the City of Pharr
18. Housing Authority of the City of San Juan
19. Housing Authority of the City of Weslaco
7. Sole or lead submitter contact information:
a. Name: Diana R. Serna
b. Title: Director
c. Department: Urban County Program
d. Street address: 427 E. Duranta
e. City: Alamo
f. State: Texas
g. Zip code: 78516
8. Period covered by this assessment:
Program Years 2018 – 2022
9. Initial, amended, or renewal AFH:
Initial
Assessment of Fair Housing Tool for Local Governments (LG2015)OMB Control Number: 2529-0054
iv
10. To the best of its knowledge and belief, the statements and information containedherein are true, accurate, and complete and the program participant has developed thisAFH in compliance with the requirements of 24 C.F.R. §§ 5.150-5.180 or comparablereplacement regulations of the Department of Housing and Urban Development;
Yes
11. The program participant will take meaningful actions to further the goals identified in itsAFH conducted in accordance with the requirements in §§ 5.150 through 5.180 and 24C.F.R. §§ 91.225(a)(1), 91.325(a)(1), 91.425(a)(1), 570.487(b)(1), 570.601, 903.7(o), and903.15(d), as applicable.
All Joint and Regional Participants are bound by the certification, except that some ofthe analysis, goals or priorities included in the AFH may only apply to an individualprogram participant as expressly stated in the AFH.
HIDALGO COUNTY
Ramon Garcia, County Judge
ATTEST
Arturo Guajardo, Jr., County Clerk
CITY OF EDINBURG
Richard M. Hinojosa, City Manager
ATTEST
Myra Ayala-Garza, City Secretary
Assessment of Fair Housing Tool for Local Governments (LG2015)OMB Control Number: 2529-0054
v
CITY OF MCALLEN
James E.Darling, Mayor
ATTEST
Perla Lara, TRMC/CMC, CPM
City Secretary
CITY OF MISSION
Martin Garza, Jr., City Manager
ATTEST
Anna Carrillo, City Secretary
CITY OF PHARR
ATTEST
Assessment of Fair Housing Tool for Local Governments (LG2015)OMB Control Number: 2529-0054
vi
CITY OF ALAMO HOUSING AUTHORITY
Mary Vela, Director
ATTEST
Lori Dimas, Executive Assistant
CITY OF DONNA HOUSING AUTHORITY
Bob Gonzalez, Director
ATTEST
CITY OF EDCOUCH HOUSING AUTHORITY
Jarrett Castillo, Chairman
ATTEST
Arturo Alvarez, Secretary
Assessment of Fair Housing Tool for Local Governments (LG2015)OMB Control Number: 2529-0054
vii
CITY OF ELSA HOUSING AUTHORITY
Rolando Garza, Chairman
ATTEST
CITY OF EDINBURG HOUSING AUTHORITY
Joe Rodriguez, Chairman
ATTEST
Rodolfo “Rudy” Ramirez, Executive Director
HOUSING AUTHORITY OF THE COUNTY OF HIDALGO
Mike Lopez, Executive Director
ATTEST
Dora Quintanilla, Executive Secretary
Assessment of Fair Housing Tool for Local Governments (LG2015)OMB Control Number: 2529-0054
viii
HOUSING AUTHORITY OF THE CITY OF HIDALGO
, Director
ATTEST
…
CITY OF LA JOYA HOUSING AUTHORITY
Frances Salinas De Leon, Director
ATTEST
Blanca Valdez, Clerk
CITY OF MCALLEN HOUSING AUTHORITY
Arnold Padilla, Executive Director
ATTEST
, Secretary
Assessment of Fair Housing Tool for Local Governments (LG2015)OMB Control Number: 2529-0054
ix
CITY OF MERCEDES HOUSING AUTHORITY
, Executive Director
ATTEST
, Director of Housing Operations
CITY OF MISSION HOUSING AUTHORITY
Joel A. Gonzalez, Executive Director
ATTEST
Jaime X. Ayala, Deputy Executive Director
CITY OF PHARR HOUSING AUTHORITY
Noel De Leon, Director
ATTEST
Lazaro Guerra, Finance/Human Resource Director
Assessment of Fair Housing Tool for Local Governments (LG2015)OMB Control Number: 2529-0054
x
CITY OF SAN JUAN HOUSING AUTHORITY
Ignacio Almaguer, Chairman
ATTEST
Ruben Zavala, Executive Director
CITY OF WESLACO HOUSING AUTHORITY
George Pina, Executive Director
ATTEST
Gloria Garza, Programs Director
Departmental acceptance or non-acceptance:
(Signature) (date)
Comments
Assessment of Fair Housing Tool for Local Governments (LG2015)OMB Control Number: 2529-0054
1
II. Executive Summary
1. Summarize the fair housing issues, significant contributing factors, and goals. Also includean overview of the process and analysis used to reach the goals.
The federal Fair Housing Act prohibits housing-related discrimination on the basis of race, color,religion, sex, familial status, national origin or disability. The U.S. Department of Housing andUrban Development (HUD) is charged with the implementation and enforcement of the FederalFair Housing Act. Recipients of HUD funding must adhere to the provisions within the Actincluding those outlined in the Affirmatively Furthering Fair Housing (AFFH) Final Rule (July2015). In order to comply with HUD requirements and the AFFH, the recipients of HUD fundsmust compose an Assessment of Fair Housing (AFH) in advance of the organization’s next Five-Year Plan.
In an effort to combine resources and strengthen partnerships, the entitlement communitiesand the Public Housing Authorities of Hidalgo County entered into a Collaborative InterlocalAgreement for the development and submission of a Regional AFH. The document hereinrefers to the nineteen (19) participants as “Collaborative Partners”. While the entitlementcommunities have co-developed three Consolidated Plan and Strategy documents over the lastthirteen (13) years, the AFH represents the first collaboration in which the local Public HousingAuthorities partnered with the Hidalgo County jurisdictions.
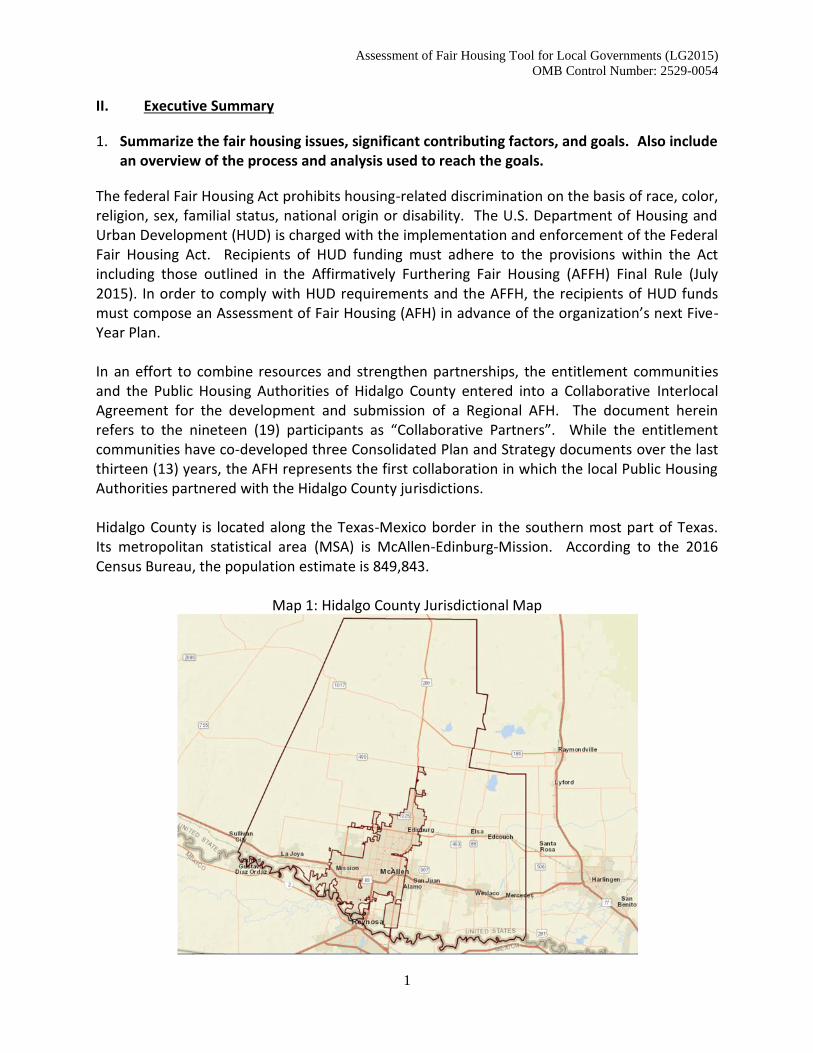
Hidalgo County is located along the Texas-Mexico border in the southern most part of Texas.Its metropolitan statistical area (MSA) is McAllen-Edinburg-Mission. According to the 2016Census Bureau, the population estimate is 849,843.
Map 1: Hidalgo County Jurisdictional Map
Assessment of Fair Housing Tool for Local Governments (LG2015)OMB Control Number: 2529-0054
2
HUD determined the AFH due date as 270 days prior to the program year for which a newconsolidated plan is due. For Hidalgo County – Urban County Program (UCP), submission of theAFH must occur on or before October 4, 2017. Due to their overarching jurisdictionalboundaries, varied HUD funding sources and having the earliest submittal date, UCP wasselected as the lead entity.
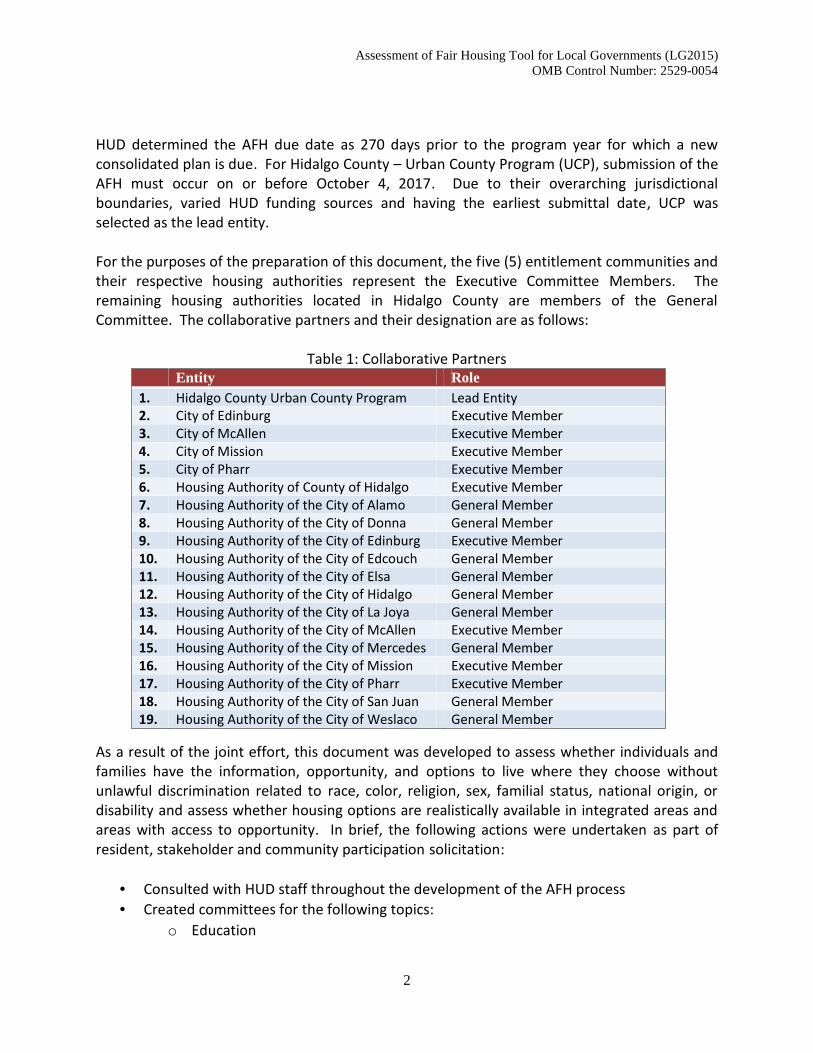
For the purposes of the preparation of this document, the five (5) entitlement communities andtheir respective housing authorities represent the Executive Committee Members. Theremaining housing authorities located in Hidalgo County are members of the GeneralCommittee. The collaborative partners and their designation are as follows:
Table 1: Collaborative PartnersEntity Role
1. Hidalgo County Urban County Program Lead Entity2. City of Edinburg Executive Member3. City of McAllen Executive Member4. City of Mission Executive Member5. City of Pharr Executive Member6. Housing Authority of County of Hidalgo Executive Member7. Housing Authority of the City of Alamo General Member8. Housing Authority of the City of Donna General Member9. Housing Authority of the City of Edinburg Executive Member10. Housing Authority of the City of Edcouch General Member11. Housing Authority of the City of Elsa General Member12. Housing Authority of the City of Hidalgo General Member13. Housing Authority of the City of La Joya General Member14. Housing Authority of the City of McAllen Executive Member15. Housing Authority of the City of Mercedes General Member16. Housing Authority of the City of Mission Executive Member17. Housing Authority of the City of Pharr Executive Member18. Housing Authority of the City of San Juan General Member19. Housing Authority of the City of Weslaco General Member
As a result of the joint effort, this document was developed to assess whether individuals andfamilies have the information, opportunity, and options to live where they choose withoutunlawful discrimination related to race, color, religion, sex, familial status, national origin, ordisability and assess whether housing options are realistically available in integrated areas andareas with access to opportunity. In brief, the following actions were undertaken as part ofresident, stakeholder and community participation solicitation:
Consulted with HUD staff throughout the development of the AFH process Created committees for the following topics:
o Education
Assessment of Fair Housing Tool for Local Governments (LG2015)OMB Control Number: 2529-0054
3
o Employmento Transportationo Povertyo Environmental Health and Issueso Disproportionate Housing Needso Publicly Supported Housingo Disability and Access
Conferred with the local University, University of Texas Rio Grande Valley (UTRGV), toassist in the development of a comprehensive survey
Created a bilingual (English and Spanish) Fair Housing Community Survey Regionally promoted the survey through various media outlets Allowed for a bilingual submission of survey responses through on-line or paper medium Conducted community, stakeholder and state/federal officials meetings throughout the
County Engaged local housing advocacy groups to provide outreach and obtain survey
responses in colonia and rural areas
Subsequent to the analysis of HUD provided maps and tables and the solicitation of local input,the document was developed to identify contributing factors which preclude a person’s abilityto access quality housing in choice neighborhoods. The list of factors that have been identifiedas contributing to these fair housing issues were then prioritized by the regional participants.Each contributing factor was prioritized as:
1. “High” - Factors that have a direct and substantial impact on fair housing choice2. “Medium” - Factors that have a less direct impact on fair housing choice, or that the
regional participants have a comparatively limited capacity to address3. “Low” - Factors that have a slight or largely indirect impact on fair housing choice, or
that the regional participants have little capacity to address
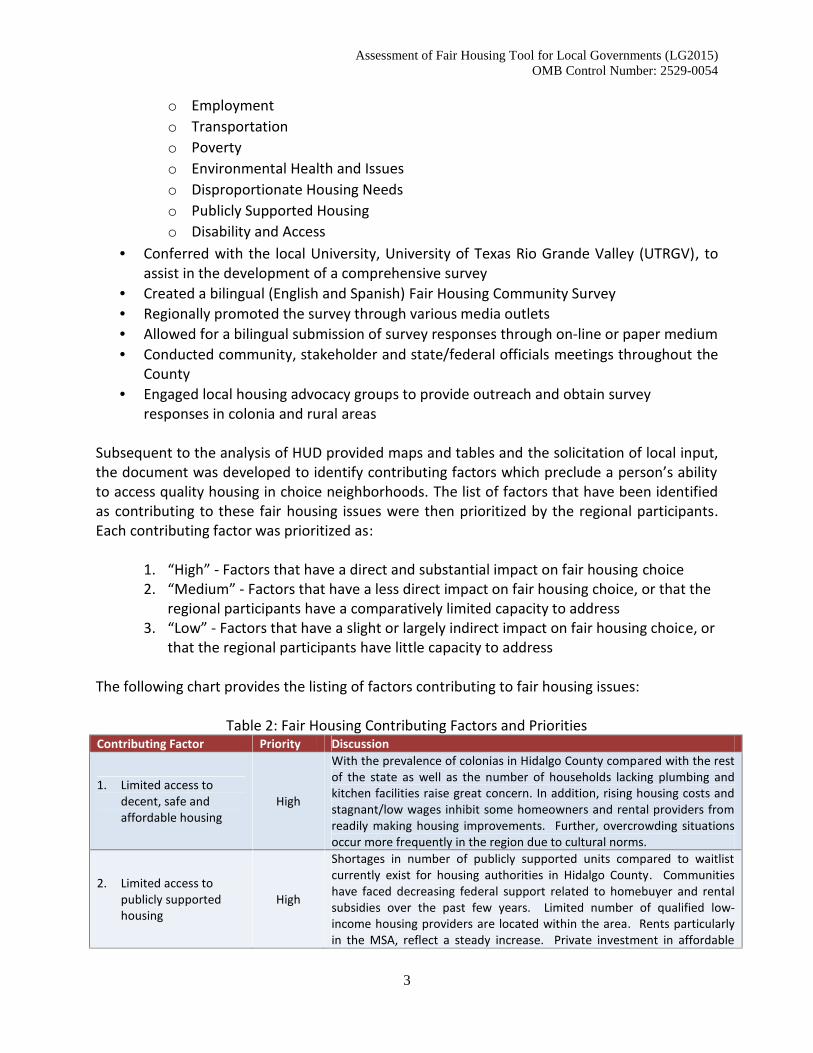
The following chart provides the listing of factors contributing to fair housing issues:
Table 2: Fair Housing Contributing Factors and PrioritiesContributing Factor Priority Discussion
1. Limited access todecent, safe andaffordable housing
High
With the prevalence of colonias in Hidalgo County compared with the restof the state as well as the number of households lacking plumbing andkitchen facilities raise great concern. In addition, rising housing costs andstagnant/low wages inhibit some homeowners and rental providers fromreadily making housing improvements. Further, overcrowding situationsoccur more frequently in the region due to cultural norms.
2. Limited access topublicly supportedhousing
High
Shortages in number of publicly supported units compared to waitlistcurrently exist for housing authorities in Hidalgo County. Communitieshave faced decreasing federal support related to homebuyer and rentalsubsidies over the past few years. Limited number of qualified low-income housing providers are located within the area. Rents particularlyin the MSA, reflect a steady increase. Private investment in affordable
Assessment of Fair Housing Tool for Local Governments (LG2015)OMB Control Number: 2529-0054
4
housing is limited or non-existent in some areas.
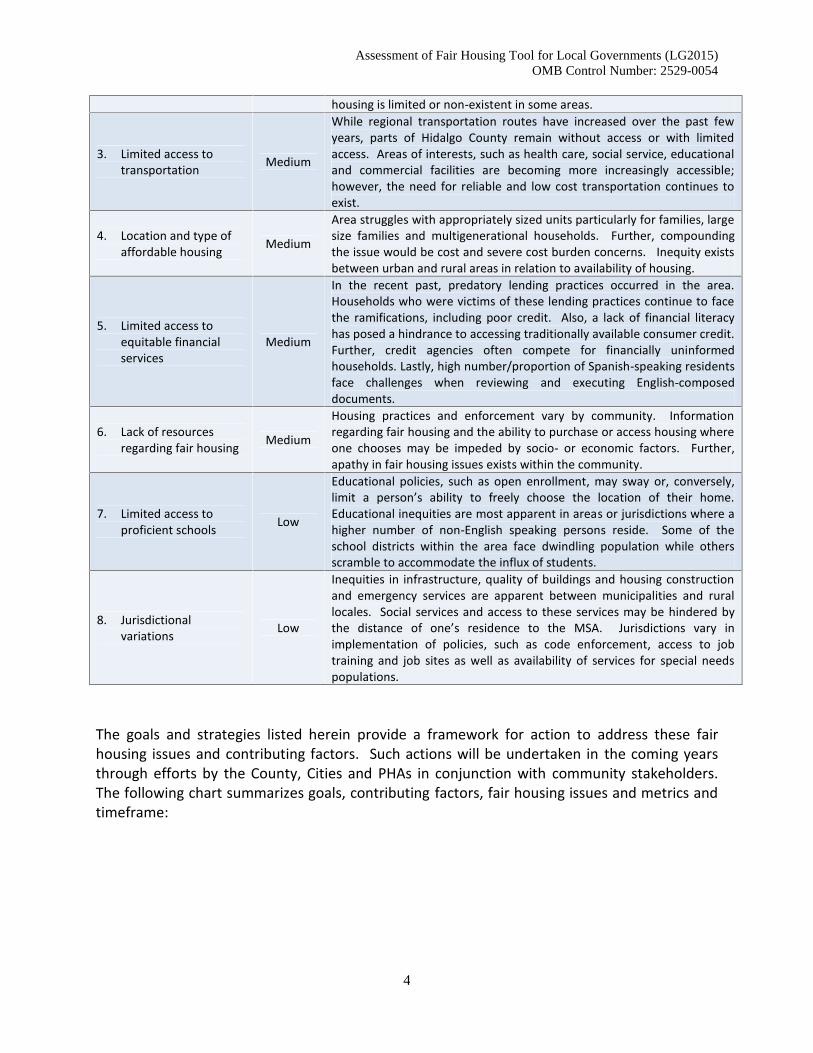
3. Limited access totransportation Medium
While regional transportation routes have increased over the past fewyears, parts of Hidalgo County remain without access or with limitedaccess. Areas of interests, such as health care, social service, educationaland commercial facilities are becoming more increasingly accessible;however, the need for reliable and low cost transportation continues toexist.
4. Location and type ofaffordable housing Medium
Area struggles with appropriately sized units particularly for families, largesize families and multigenerational households. Further, compoundingthe issue would be cost and severe cost burden concerns. Inequity existsbetween urban and rural areas in relation to availability of housing.
5. Limited access toequitable financialservices
Medium
In the recent past, predatory lending practices occurred in the area.Households who were victims of these lending practices continue to facethe ramifications, including poor credit. Also, a lack of financial literacyhas posed a hindrance to accessing traditionally available consumer credit.Further, credit agencies often compete for financially uninformedhouseholds. Lastly, high number/proportion of Spanish-speaking residentsface challenges when reviewing and executing English-composeddocuments.
6. Lack of resourcesregarding fair housing Medium
Housing practices and enforcement vary by community. Informationregarding fair housing and the ability to purchase or access housing whereone chooses may be impeded by socio- or economic factors. Further,apathy in fair housing issues exists within the community.
7. Limited access toproficient schools Low
Educational policies, such as open enrollment, may sway or, conversely,limit a person’s ability to freely choose the location of their home.Educational inequities are most apparent in areas or jurisdictions where ahigher number of non-English speaking persons reside. Some of theschool districts within the area face dwindling population while othersscramble to accommodate the influx of students.
8. Jurisdictionalvariations Low
Inequities in infrastructure, quality of buildings and housing constructionand emergency services are apparent between municipalities and rurallocales. Social services and access to these services may be hindered bythe distance of one’s residence to the MSA. Jurisdictions vary inimplementation of policies, such as code enforcement, access to jobtraining and job sites as well as availability of services for special needspopulations.
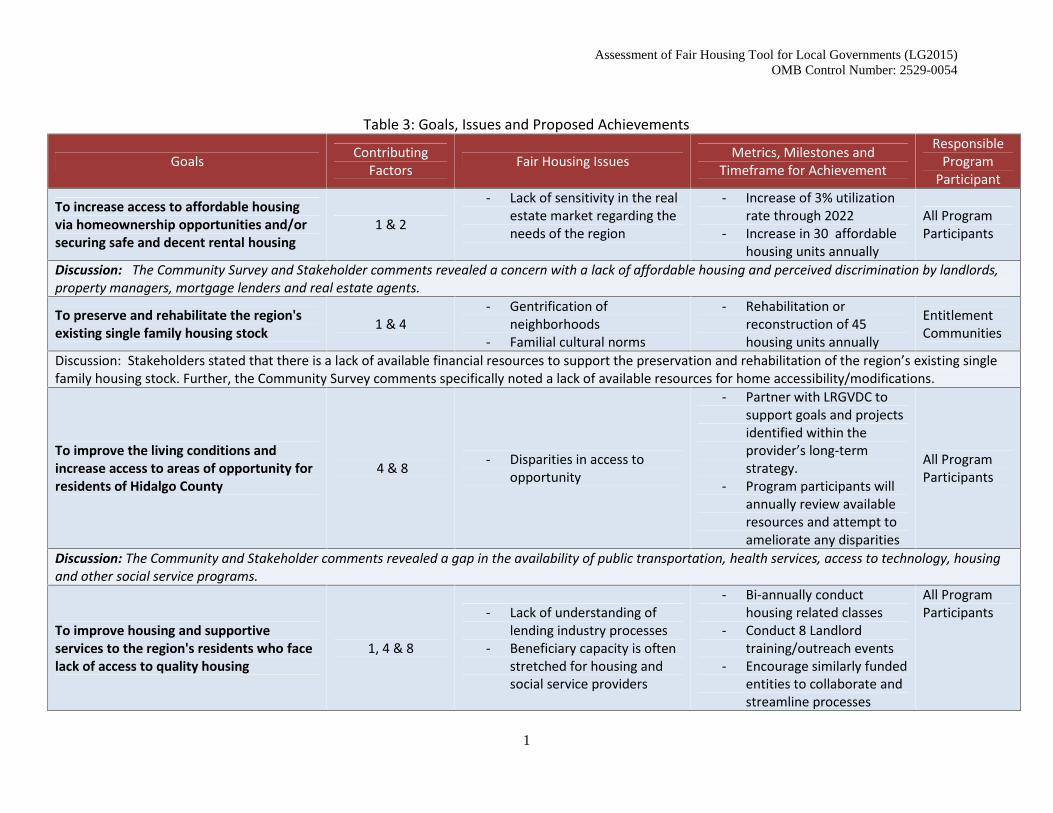
The goals and strategies listed herein provide a framework for action to address these fairhousing issues and contributing factors. Such actions will be undertaken in the coming yearsthrough efforts by the County, Cities and PHAs in conjunction with community stakeholders.The following chart summarizes goals, contributing factors, fair housing issues and metrics andtimeframe:
Assessment of Fair Housing Tool for Local Governments (LG2015)OMB Control Number: 2529-0054
1
Table 3: Goals, Issues and Proposed Achievements
Goals ContributingFactors Fair Housing Issues Metrics, Milestones and
Timeframe for Achievement
ResponsibleProgram
Participant
To increase access to affordable housingvia homeownership opportunities and/orsecuring safe and decent rental housing
1 & 2
- Lack of sensitivity in the realestate market regarding theneeds of the region
- Increase of 3% utilizationrate through 2022
- Increase in 30 affordablehousing units annually
All ProgramParticipants
Discussion: The Community Survey and Stakeholder comments revealed a concern with a lack of affordable housing and perceived discrimination by landlords,property managers, mortgage lenders and real estate agents.
To preserve and rehabilitate the region'sexisting single family housing stock 1 & 4
- Gentrification ofneighborhoods
- Familial cultural norms
- Rehabilitation orreconstruction of 45housing units annually
EntitlementCommunities
Discussion: Stakeholders stated that there is a lack of available financial resources to support the preservation and rehabilitation of the region’s existing singlefamily housing stock. Further, the Community Survey comments specifically noted a lack of available resources for home accessibility/modifications.
To improve the living conditions andincrease access to areas of opportunity forresidents of Hidalgo County
4 & 8 - Disparities in access toopportunity
- Partner with LRGVDC tosupport goals and projectsidentified within theprovider’s long-termstrategy.
- Program participants willannually review availableresources and attempt toameliorate any disparities
All ProgramParticipants
Discussion: The Community and Stakeholder comments revealed a gap in the availability of public transportation, health services, access to technology, housingand other social service programs.
To improve housing and supportiveservices to the region's residents who facelack of access to quality housing
1, 4 & 8
- Lack of understanding oflending industry processes
- Beneficiary capacity is oftenstretched for housing andsocial service providers
- Bi-annually conducthousing related classes
- Conduct 8 Landlordtraining/outreach events
- Encourage similarly fundedentities to collaborate andstreamline processes
All ProgramParticipants
Assessment of Fair Housing Tool for Local Governments (LG2015)OMB Control Number: 2529-0054
2
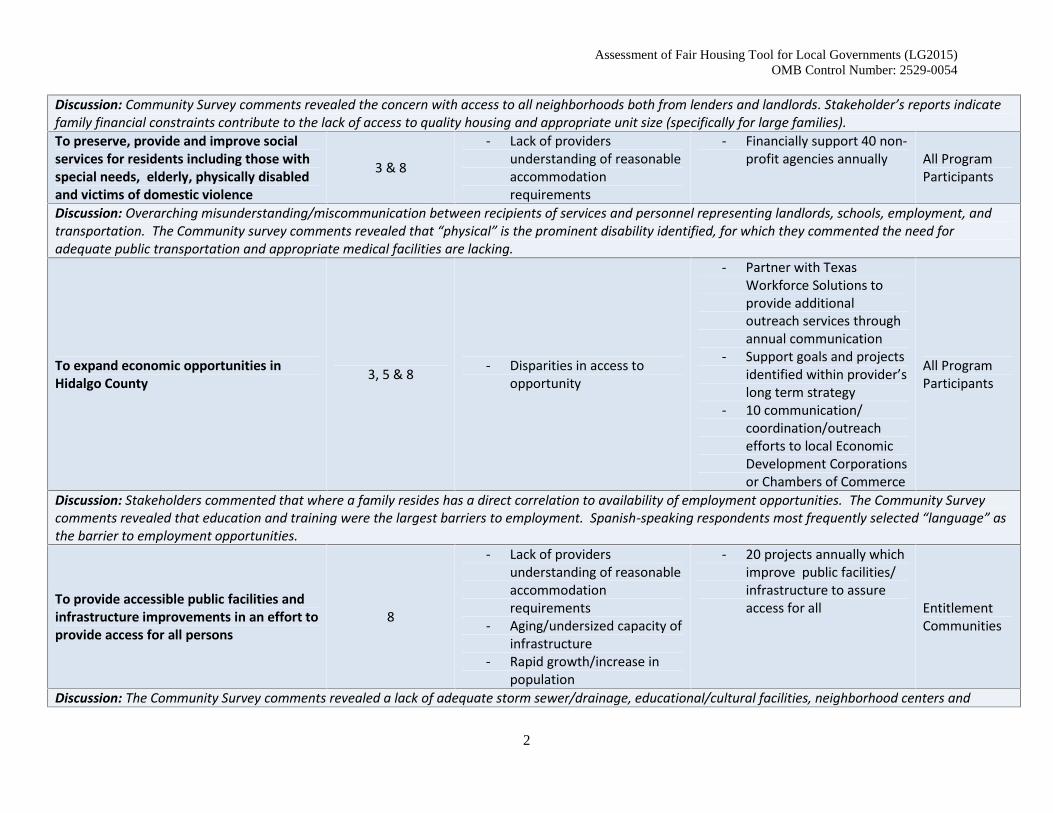
Discussion: Community Survey comments revealed the concern with access to all neighborhoods both from lenders and landlords. Stakeholder’s reports indicatefamily financial constraints contribute to the lack of access to quality housing and appropriate unit size (specifically for large families).To preserve, provide and improve socialservices for residents including those withspecial needs, elderly, physically disabledand victims of domestic violence
3 & 8
- Lack of providersunderstanding of reasonableaccommodationrequirements
- Financially support 40 non-profit agencies annually All Program
Participants
Discussion: Overarching misunderstanding/miscommunication between recipients of services and personnel representing landlords, schools, employment, andtransportation. The Community survey comments revealed that “physical” is the prominent disability identified, for which they commented the need foradequate public transportation and appropriate medical facilities are lacking.
To expand economic opportunities inHidalgo County 3, 5 & 8 - Disparities in access to
opportunity
- Partner with TexasWorkforce Solutions toprovide additionaloutreach services throughannual communication
- Support goals and projectsidentified within provider’slong term strategy
- 10 communication/coordination/outreachefforts to local EconomicDevelopment Corporationsor Chambers of Commerce
All ProgramParticipants
Discussion: Stakeholders commented that where a family resides has a direct correlation to availability of employment opportunities. The Community Surveycomments revealed that education and training were the largest barriers to employment. Spanish-speaking respondents most frequently selected “language” asthe barrier to employment opportunities.
To provide accessible public facilities andinfrastructure improvements in an effort toprovide access for all persons
8
- Lack of providersunderstanding of reasonableaccommodationrequirements
- Aging/undersized capacity ofinfrastructure
- Rapid growth/increase inpopulation
- 20 projects annually whichimprove public facilities/infrastructure to assureaccess for all Entitlement
Communities
Discussion: The Community Survey comments revealed a lack of adequate storm sewer/drainage, educational/cultural facilities, neighborhood centers and
Assessment of Fair Housing Tool for Local Governments (LG2015)OMB Control Number: 2529-0054
3
running/jogging trails.
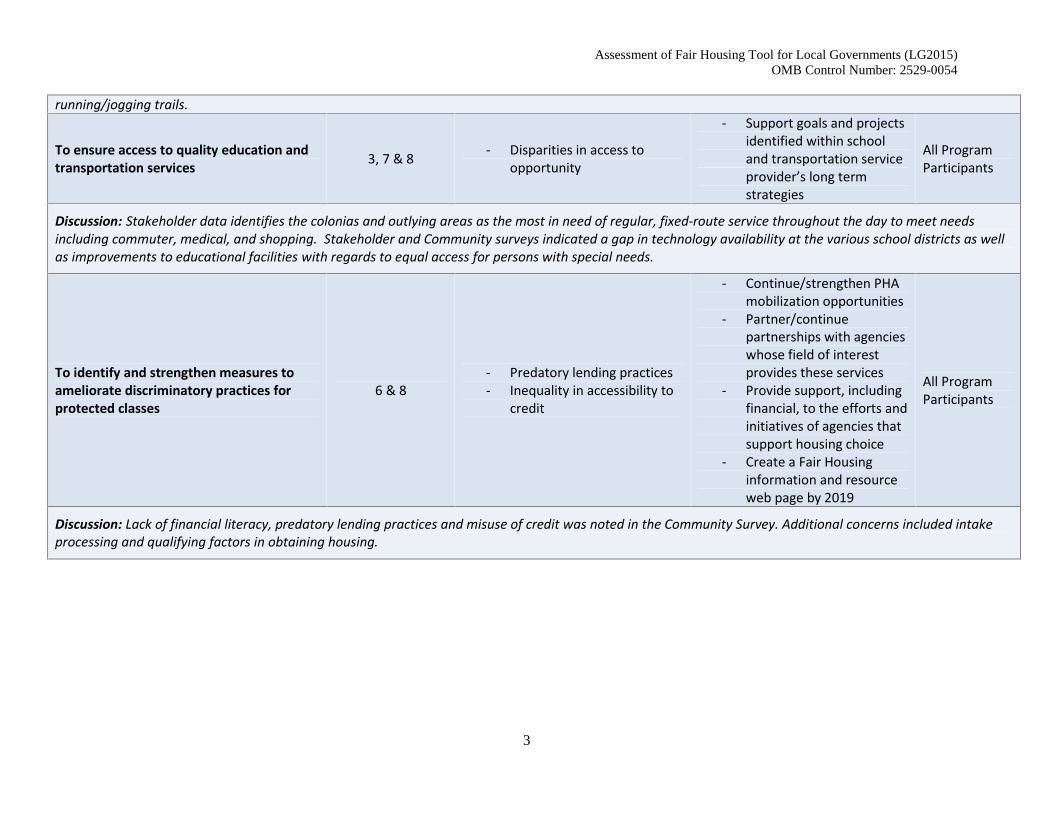
To ensure access to quality education andtransportation services 3, 7 & 8 - Disparities in access to
opportunity
- Support goals and projectsidentified within schooland transportation serviceprovider’s long termstrategies
All ProgramParticipants
Discussion: Stakeholder data identifies the colonias and outlying areas as the most in need of regular, fixed-route service throughout the day to meet needsincluding commuter, medical, and shopping. Stakeholder and Community surveys indicated a gap in technology availability at the various school districts as wellas improvements to educational facilities with regards to equal access for persons with special needs.
To identify and strengthen measures toameliorate discriminatory practices forprotected classes
6 & 8- Predatory lending practices- Inequality in accessibility to
credit
- Continue/strengthen PHAmobilization opportunities
- Partner/continuepartnerships with agencieswhose field of interestprovides these services
- Provide support, includingfinancial, to the efforts andinitiatives of agencies thatsupport housing choice
- Create a Fair Housinginformation and resourceweb page by 2019
All ProgramParticipants
Discussion: Lack of financial literacy, predatory lending practices and misuse of credit was noted in the Community Survey. Additional concerns included intakeprocessing and qualifying factors in obtaining housing.
Assessment of Fair Housing Tool for Local Governments (LG2015)OMB Control Number: 2529-0054
1
Achieving these goals will be a challenge in light of severe funding constraints. The regionalparticipants have experienced drastic reductions in federal funding over the past decade, andthe new AFH requirements are not accompanied by any additional funding. However, there is acommitment to creatively use limited funding to create opportunities and enhance areas ofaccess to opportunities.
The collaborative partners wish to inform the readers of the following notes:
1. Maps: Collaborative partners selected the variable of 1 dot per 100 population as thesource to evaluate conditions within the county
2. HUD Data Version: Upon discussion with HUD staff (conference call July 2017), HUDfunded recipients who have a submittal date prior to January 1, 2018, are required toutilize the Assessment of Fair Housing Tool for Local Governments (LG2015) whichincludes Maps and Tables version AFFHT0001.
3. Geographical Discrepancies: Collaborative partners noted slight movement of therelative dots in maps where national origin was one of the variables. Dots appeared toremain within in a few miles of their locale.
4. Minority concentration: For ease of readership, collaborative partners thought itprudent to provide two maps in an effort to fully assess Hispanic and Non-Hispanicpopulations as well as Mexico as a Country of Origin versus Non-Mexican populations.Because the area is primarily Hispanic/Mexico as a Country of Origin, overlaying thesevariables distort and/or underscore the other categories/variables/populations.
In addition, the final version will be/may be amended following the comments received duringthe mandatory thirty (30) day comment period, beginning August 19, 2017 – September 19,2017. Several public hearings will be held during the 30 day comment period.
III. Community Participation Process
1. Describe outreach activities undertaken to encourage and broaden meaningfulcommunity participation in the AFH process, including the types of outreachactivities and dates of public hearings or meetings. Identify media outlets used andinclude a description of efforts made to reach the public, including thoserepresenting populations that are typically underrepresented in the planning processsuch as persons who reside in areas identified as R/ECAPs, persons who are limitedEnglish proficient (LEP), and persons with disabilities. Briefly explain how thesecommunications were designed to reach the broadest audience possible. For PHAs,identify your meetings with the Resident Advisory Board.
In an effort to disseminate information about Affirmatively Furthering Fair Housing(AFFH), the regional collaborative partners implemented a wide-ranging communityparticipation strategy. This plan encouraged community participation throughout theentire county and included a community survey which was published/announced viaprint and social media avenues in both English and Spanish. While the collaborative
Assessment of Fair Housing Tool for Local Governments (LG2015)OMB Control Number: 2529-0054
2
partners held several meeting to engage residents and stakeholders’ views, the mostcomprehensive assessment of regional needs came from the use of the on-line surveytool.
The advertisement of the survey first occurred on June 26, 2017, in The Monitor, thenewspaper of largest general circulation within Hidalgo County. The weeklyreadership of The Monitor runs between 20,000 and 25,000. A notice of the surveywas published in Spanish in El Periodico, a Spanish language newspaper, on June 28,2017. Its readership is 55,778 and is published each Wednesday. A secondary noticewas published on July 3, 2017, in The Monitor. The advertisement indicated theCommunity Survey was set to expire on July 14, 2017. However, due to requestedinterest and time permitting, the survey remained available through July 31, 2017.
Televised Media began with an interview of delegates from the McAllen HousingAuthority and the County of Hidalgo–Urban County Program. The story which ran inMid-November 2016, served as an introduction to the AFH process and the firstcollaboration effort between the nineteen (19) entitlement communities and HousingAuthorities. This story ran on KGBT, local news channel 4, as well appeared on-line.KRGV, local news channel 5, ran a story which assisted in the outreach of thecommunity survey. Staff from the City of Edinburg was interviewed regarding theimportance of the information which was gathered, its applicability to future fundingand discriminatory practices. The on-line story included a link to the County’s websitewhere the community survey could be undertaken. KRGV also broadcast in SpanishAssisted Programming (SAP) for limited English proficient viewers; both broadcasts arefurther available with Closed Captioning.
In addition, a notice of survey availability was provided through additional mediaoutlets such as the County, Cities and Housing Authorities web pages and social mediaaccounts. Notices were also posted at city halls, precinct offices, public libraries andnumerous Hidalgo County collaboration participant offices. The regional participantsfurther encouraged participation in the survey by distributing flyers to public housingauthority and Housing Choice Voucher (HCV) (Section 8) residents, announcing thesurvey at the Resident Advisory Board meetings and utilized the Family Self-Sufficiencystaff to further encourage and provide assistance to PHA and HCV residents incompleting the on-line survey.
Moreover, a state-wide housing advocacy group known as the Texas Low IncomeHousing Information Service assisted in collecting Community Survey responses fromresidents in several colonias and areas with no Wi-Fi or internet access. Additionally,local non-profit agencies including Affordable Homes of South Texas, Inc. (AHSTI) andProyecto Azteca, two of the largest in volume providers of affordable housing formoderate and low-income individuals in Hidalgo County, advertised the CommunitySurvey and made the link available on their respective web pages. These entitieshighly encouraged individuals to complete the survey by allowing the use of their
Assessment of Fair Housing Tool for Local Governments (LG2015)OMB Control Number: 2529-0054
3
computers and assigning staff to assist the respondents when necessary. Theseactions served to assist in promoting the survey, particularly for low-income residentsas well as those individuals least likely to have access to home computers and internetservices. These respondents are highly likely to be Limited English Proficiency (LEP).
Racially and Ethnically Concentrated Areas of Poverty (R/ECAPs) are located along theboundaries of Hidalgo County. Because outreach included County-wide efforts, it canbe presumed that information and the community survey was equally available toresidents of these areas. As noted within this section, in order to engage outlyingareas of Hidalgo County, in-person community meetings were held on the eastern,western, and southernmost areas of the County. The final meeting was held in thenorthernmost area of the County for which a significant population exists.
Social media served as another means to encourage participation from all age groupsand income levels. Communities and public housing authorities posted on FaceBookand Twitter accounts primarily.
Our strategy also included engaging approximately 300 community partners andstakeholders that provide services for Hidalgo County residents. This portion of ouroutreach efforts entailed the creation of Stakeholder Surveys that would serve toencapsulate disparities and challenges identified by each agency. The process forgathering this information began with contacting Stakeholders by phone and/or emailand explaining the AFFH and partnership objectives. Each Stakeholder was thenprovided with a survey, tailored to the specific service provided by that agency, alongwith a request to provide their feedback and return the responses.
While the community survey was still available for completion, twelve (12) in-personmeetings were hosted including four (4) Community meetings, seven (7) Stakeholdermeetings, and a State/Federal Officials meeting. The advertisements for theCommunity and Stakeholder meetings were published in The Monitor on July 5, 2017,in English and Spanish. The advertisements for both meetings were also published in ElPeriodico, on July 5, 2017. Similar to the announcement of the community survey,social media and notices were posted at city halls, precinct offices, public libraries aswell as numerous Hidalgo County collaboration participant offices in an effort toencourage attendance at these meetings. Lastly, many Public Housing Authoritiesprovided flyers, posted notices, or mailed information regarding the communitymeetings.
The Community Meetings were held strategically at four (4) different locationsthroughout the County, in an attempt to reach as many residents as possible. TheCommunity Meetings were held as follows:

Assessment of Fair Housing Tool for Local Governments (LG2015)OMB Control Number: 2529-0054
4
DATE TIME LOCATION
WednesdayJuly 12, 2017 9:30 a.m. – 11:30 a.m.
Mercedes Housing Authority400 South Ohio Ave.
Mercedes, Texas 78570
WednesdayJuly 12, 2017 2:00 p.m. – 4:00 p.m.
Edcouch Housing Authority209 West Pacific
Edcouch, TX 78538
ThursdayJuly 13, 2017 9:30 a.m. – 11:30 a.m.
La Joya Housing Authority945 South Leo Ave.La Joya, TX 78560
ThursdayJuly 13, 2017 2:00 p.m. – 4:00 p.m.
City of HidalgoCity Hall Board Chambers704 East Ramon Ayala Dr.
Hidalgo TX 78557
At these Community Meetings, the following was discussed (in English and Spanish):
Identifying all collaborative partner organizations (informed attendees of thenineteen (19) collaborating partners)
Link Community Survey (provided website link to the Community Survey)
Survey end date (provided the end date to the Community Survey)
Local Data (provided information which included where local data could beobtained during the draft availability)
PowerPoint Link (provided presentation on the introduction to the AFFH)
HUD Resources (informed attendees of the AFFH rule and resources)
The Stakeholder Meetings were held strategically at five (5) different locationsthroughout the County, in an attempt to reach as many stakeholders as possible. TheStakeholder Meetings were scheduled by topics as follows:
TOPIC DATE TIME LOCATION
Poverty July 14,2017
9:00 a.m. –12:00 p.m.
Housing Authority of the HidalgoCounty1102 Lilia Dr.Weslaco, TX 78599
Housing July 20,2017
9:30 a.m. –11:30 p.m.
McAllen Housing Authority FamilyDev. Center2501 Maple Ave.McAllen, TX 78501

Assessment of Fair Housing Tool for Local Governments (LG2015)OMB Control Number: 2529-0054
5
Disability andAccess
July 20,2017
1:30 p.m. –3:30 p.m.
McAllen Housing Authority FamilyDev. Center2501 Maple Ave.McAllen, TX 78501
Public Housing July 24,2017
12:00 p.m.–2:00 p.m.
Pharr Housing AuthorityAdministration Office104 W. Polk Ave.Pharr TX 78577
Education July 25,2017
9:30 a.m. –11:30 a.m.
Edinburg Housing Authority910 S. Sugar Rd.Edinburg TX 78539
EmploymentTransportationEnvironmental
July 25,2017
1:00 p.m. –4:00 p.m
City of Mission’s Social Event &Support Center115 S. MayberryMission, TX 78572
Similar to the Community Meetings, the notice of Stakeholder Meetings was publishedin The Monitor and El Periodico on July 5, 2017. Outreach efforts also included socialmedia, flyers, postings, and electronic and regular mail correspondence. No requestsfor translation or accessibility services were received in advance of any of themeetings.
A meeting was held to inform State and Federal Officials of the preparation andcollaboration efforts of this assessment. Collaborative participants presented theHUD’s AFFH PowerPoint presentation, enumerated the entities comprising thecollaborative partners, provided a brief description of the programs overseen by theentitlement communities and Public Housing Authorities as well as requested supportin disseminating information as it relates to the AFH. Representatives from theseElected Officials’ offices were interested in the development of the document as wellas in the use of HUD funding in the region. They expressed an interest in assisting thecollaborative partners’ efforts to reach under-represented populations as well as thecommunity at large.
The following is a summary of the nearly 600 community surveys received:
100% of Zip Codes in Hidalgo County were represented. 80% of respondents were located within City limits. 87% of respondents selected White as their Race. 91% of respondents selected Hispanic or Latino as their Ethnicity. 16% of respondents indicated a primary language other than English. 13% of households indicated a disabled person lived within the household. 70% of respondents were families with children. 70% of households earn $50,000 or less. 19% of respondents were households occupied by an elderly person.
Assessment of Fair Housing Tool for Local Governments (LG2015)OMB Control Number: 2529-0054
6
56% of respondents were homeowners. 70% of respondents were Female.
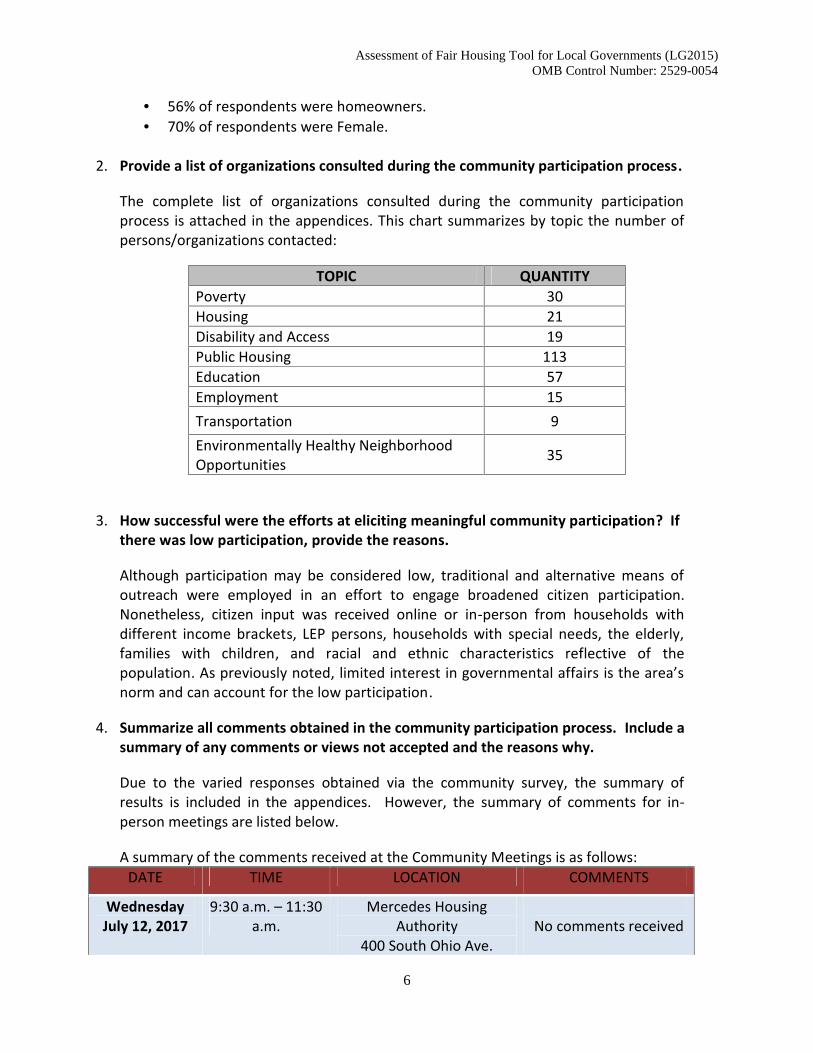
2. Provide a list of organizations consulted during the community participation process.
The complete list of organizations consulted during the community participationprocess is attached in the appendices. This chart summarizes by topic the number ofpersons/organizations contacted:
TOPIC QUANTITYPoverty 30Housing 21Disability and Access 19Public Housing 113Education 57Employment 15Transportation 9Environmentally Healthy NeighborhoodOpportunities 35
3. How successful were the efforts at eliciting meaningful community participation? Ifthere was low participation, provide the reasons.
Although participation may be considered low, traditional and alternative means ofoutreach were employed in an effort to engage broadened citizen participation.Nonetheless, citizen input was received online or in-person from households withdifferent income brackets, LEP persons, households with special needs, the elderly,families with children, and racial and ethnic characteristics reflective of thepopulation. As previously noted, limited interest in governmental affairs is the area’snorm and can account for the low participation.
4. Summarize all comments obtained in the community participation process. Include asummary of any comments or views not accepted and the reasons why.
Due to the varied responses obtained via the community survey, the summary ofresults is included in the appendices. However, the summary of comments for in-person meetings are listed below.
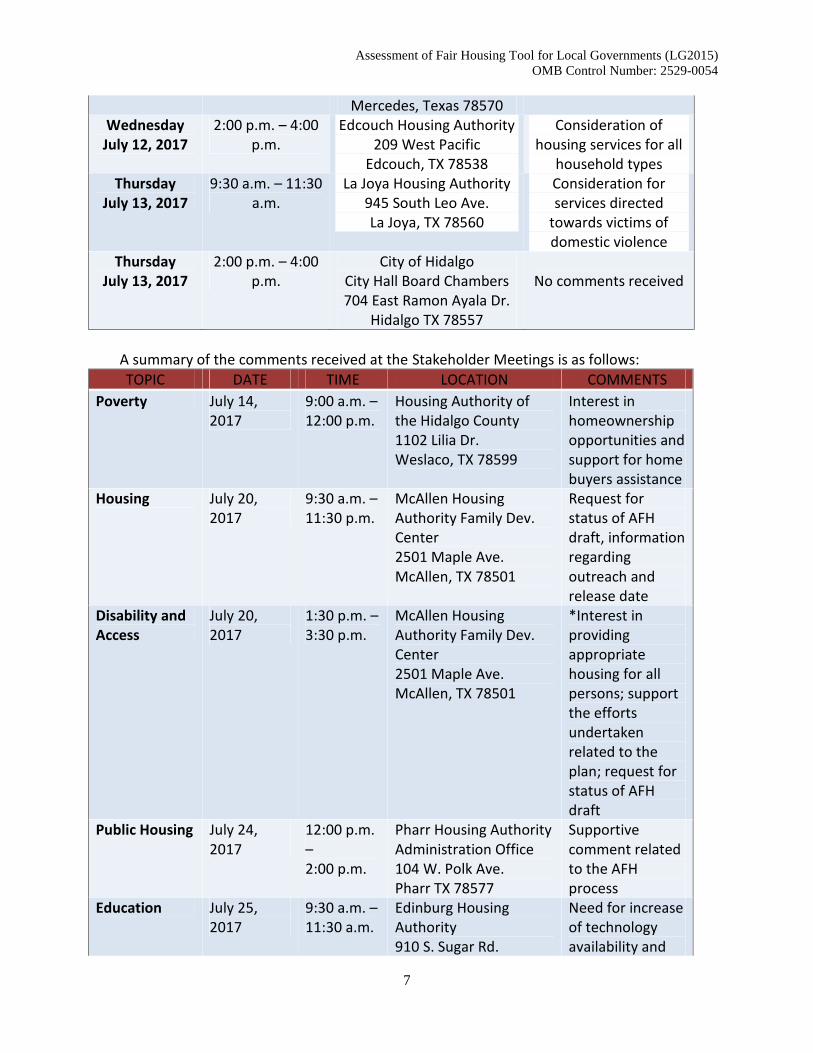
A summary of the comments received at the Community Meetings is as follows:DATE TIME LOCATION COMMENTS
WednesdayJuly 12, 2017
9:30 a.m. – 11:30a.m.
Mercedes HousingAuthority
400 South Ohio Ave.No comments received
Assessment of Fair Housing Tool for Local Governments (LG2015)OMB Control Number: 2529-0054
7
Mercedes, Texas 78570WednesdayJuly 12, 2017
2:00 p.m. – 4:00p.m.
Edcouch Housing Authority209 West Pacific
Edcouch, TX 78538
Consideration ofhousing services for all
household typesThursday
July 13, 20179:30 a.m. – 11:30
a.m.La Joya Housing Authority
945 South Leo Ave.La Joya, TX 78560
Consideration forservices directed
towards victims ofdomestic violence
ThursdayJuly 13, 2017
2:00 p.m. – 4:00p.m.
City of HidalgoCity Hall Board Chambers704 East Ramon Ayala Dr.
Hidalgo TX 78557
No comments received
A summary of the comments received at the Stakeholder Meetings is as follows:TOPIC DATE TIME LOCATION COMMENTS
Poverty July 14,2017
9:00 a.m. –12:00 p.m.
Housing Authority ofthe Hidalgo County1102 Lilia Dr.Weslaco, TX 78599
Interest inhomeownershipopportunities andsupport for homebuyers assistance
Housing July 20,2017
9:30 a.m. –11:30 p.m.
McAllen HousingAuthority Family Dev.Center2501 Maple Ave.McAllen, TX 78501
Request forstatus of AFHdraft, informationregardingoutreach andrelease date
Disability andAccess
July 20,2017
1:30 p.m. –3:30 p.m.
McAllen HousingAuthority Family Dev.Center2501 Maple Ave.McAllen, TX 78501
*Interest inprovidingappropriatehousing for allpersons; supportthe effortsundertakenrelated to theplan; request forstatus of AFHdraft
Public Housing July 24,2017
12:00 p.m.–2:00 p.m.
Pharr Housing AuthorityAdministration Office104 W. Polk Ave.Pharr TX 78577
Supportivecomment relatedto the AFHprocess
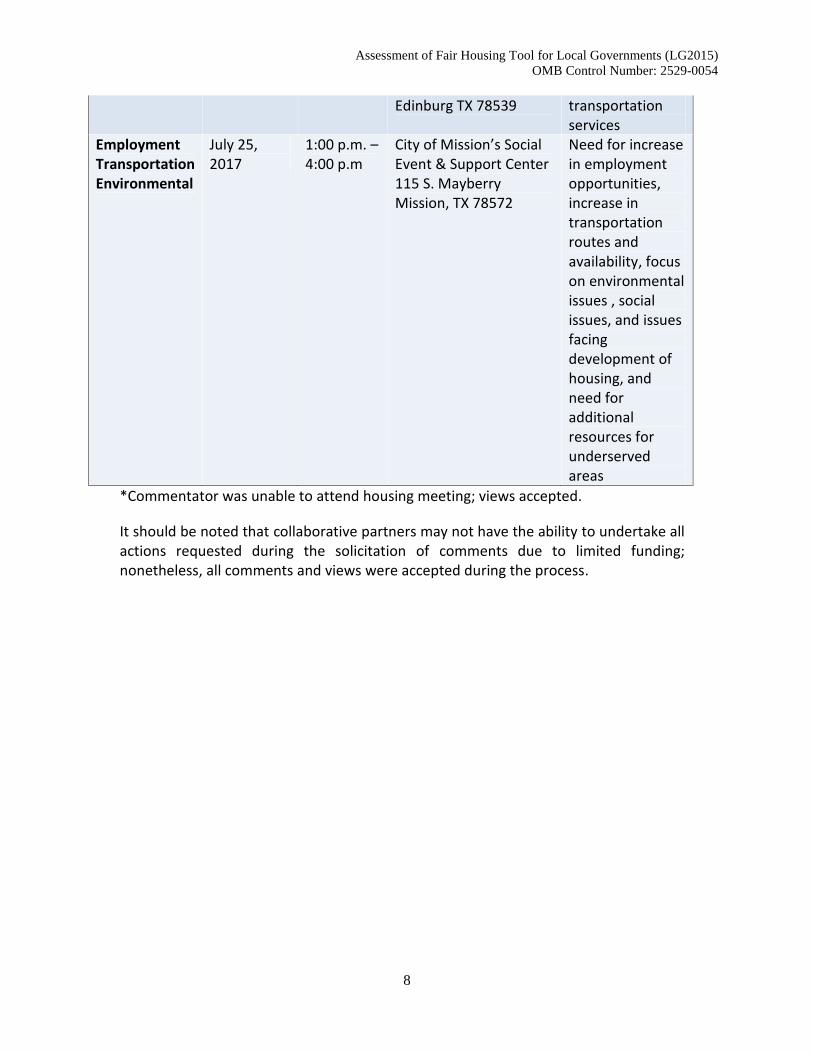
Education July 25,2017
9:30 a.m. –11:30 a.m.
Edinburg HousingAuthority910 S. Sugar Rd.
Need for increaseof technologyavailability and
Assessment of Fair Housing Tool for Local Governments (LG2015)OMB Control Number: 2529-0054
8
Edinburg TX 78539 transportationservices
EmploymentTransportationEnvironmental
July 25,2017
1:00 p.m. –4:00 p.m
City of Mission’s SocialEvent & Support Center115 S. MayberryMission, TX 78572
Need for increasein employmentopportunities,increase intransportationroutes andavailability, focuson environmentalissues , socialissues, and issuesfacingdevelopment ofhousing, andneed foradditionalresources forunderservedareas
*Commentator was unable to attend housing meeting; views accepted.
It should be noted that collaborative partners may not have the ability to undertake allactions requested during the solicitation of comments due to limited funding;nonetheless, all comments and views were accepted during the process.
Assessment of Fair Housing Tool for Local Governments (LG2015)OMB Control Number: 2529-0054
9
IV. Assessment of Past Goals, Actions and Strategies
1. Indicate what fair housing goals were selected by program participant(s) in recentAnalyses of Impediments, Assessments of Fair Housing, or other relevant planningdocuments:
a. Discuss what progress has been made toward their achievement;
The Rio Grande Valley Entitlement Communities (RGVEC) Analysis of Impediments (AI)was composed in 2005 by ICF Consulting, Inc. as part of the Region’s Consolidated Planand Strategy for 2005-2009. Annual updates may have been made to this document toaccount for changes in available resources, fluctuations in income and the need foreligible projects. While the document did not detail specific goals to be accomplishedduring any fiscal year, the development of Consolidated Annual Performance andEvaluation Reports (CAPERs) served to inform the public of the accomplishments of eachgrantee.
Actions identified in the AI that may impede access to affordable housing are listed as:
1. Standard building restrictions2. Regulatory environment concerns3. Additional building codes4. Fees (Development, Subdividing and/or Park)
Jurisdictions do not consider these fees or building codes/restrictions to be excessivebarriers to fair and affordable housing but are used to ensure the construction of decentand safe housing for its residents.
In addition, a review of the 2013 TDHCA’s Analysis of Impediments (AI) noted commonimpediments and barriers by geographic prevalence. According to the State’s AI, thefollowing impediments may occur in Hidalgo County:
NIMBYism Exclusionary Zoning Policies Poor Housing Lack of Fair Housing Information Lending Disparities Mobility/Housing Choice Barriers Lack of Fair Housing Knowledge Lack of Accessible Housing Segregated Housing Conditions
Assessment of Fair Housing Tool for Local Governments (LG2015)OMB Control Number: 2529-0054
10
Nonetheless, progress to address the issues identified in the RGVEC’s analysis ofimpediment include:
Assistance provided to homebuyers and renters Rehabilitation services particularly for very low income and elderly households Improvements to infrastructure Provision of social services to assist in assuaging the needs of low and
moderately income persons
These actions serve to mitigate some of the barriers noted by the State. Funding forthese types of activities is the basis for all five (5) entitlement communities’ use of HUDFormula Grant funds. As such, the accomplishments of each grantee continue tosupport forward progress and encourage fair housing choice for all.
b. Discuss how you have been successful in achieving past goals, and/or how you havefallen short of achieving those goals (including potentially harmful unintendedconsequences); and
Due to a lack of quantifiable goals, an assessment of whether past goals fell short orwere met cannot be ascertained.
c. Discuss any additional policies, actions, or steps that you could take to achieve pastgoals, or mitigate the problems you have experienced.
Policies which impede the process in achieving goals tend to be regulatory in nature andare implemented because of the funding sources utilized. Program participants havelimited control over these policies. Further, dwindling resources negatively affect theability to implement programs. As such, program benefits have lessened over the lastfew years. Until funding is fully restored, not all actions can be undertaken to increaseor maintain housing and support services.
d. Discuss how the experience of program participant(s) with past goals has influencedthe selection of current goals.
The concerns identified in the last Analysis of Impediments remain priorities forentitlement communities. Over the past decade, Hidalgo County has twice beendeclared a Federal Disaster Area due to hurricane landfall and strong rainfall/weatherevents. Compounding the amount of precipitation is the fact that the area is near sea-level. As such, drainage and the alleviation of flooding is a high priority in order toaddress housing to be constructed as well as to assist in areas where residentialdevelopment currently exist. Actions such as these help assure the location, type andaccessibility of units is made available and that it remains safe for residents.
Assessment of Fair Housing Tool for Local Governments (LG2015)OMB Control Number: 2529-0054
11
In an effort to be more far reaching, the goals in this AFH were expounded to specificallyconsider characteristics and demographics of Hidalgo County, highlight jurisdictionalvariations as well as incorporate actions undertaken by public housing authorities.
V. Fair Housing Analysis
A. Demographic Summary
1. Describe demographic patterns in the jurisdiction and region, and describe trends overtime (since 1990).
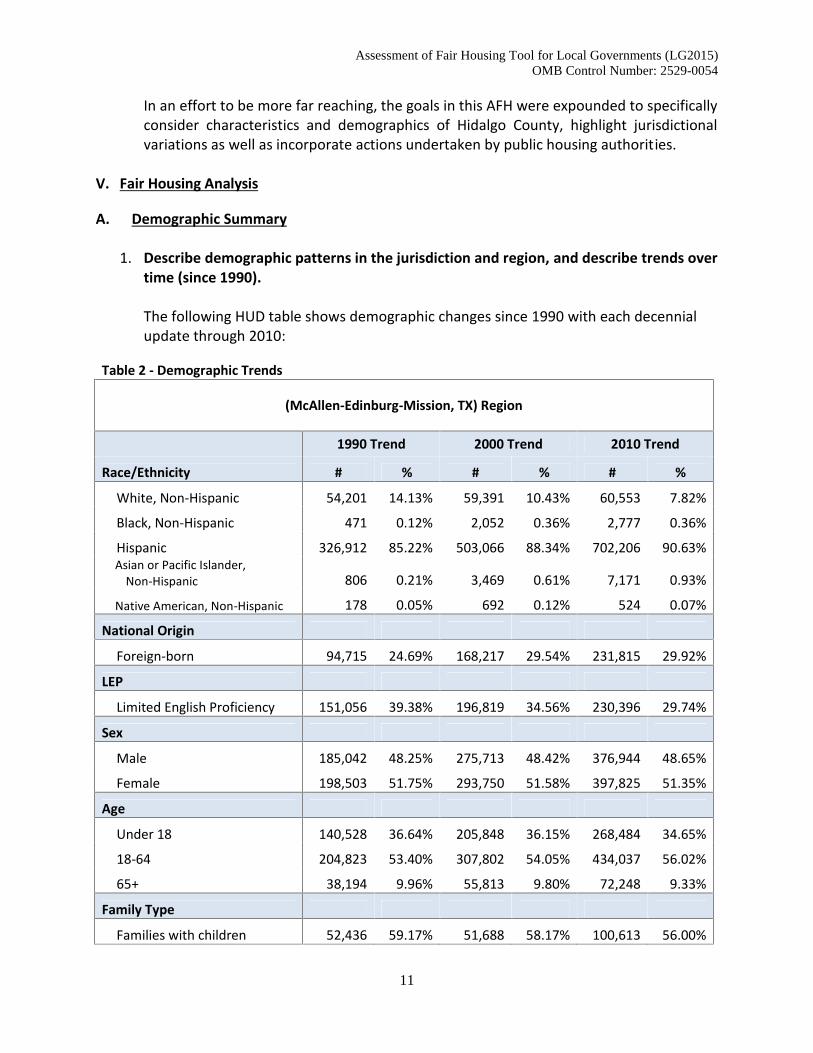
The following HUD table shows demographic changes since 1990 with each decennialupdate through 2010:
Table 2 - Demographic Trends
(McAllen-Edinburg-Mission, TX) Region
1990 Trend 2000 Trend 2010 Trend
Race/Ethnicity # % # % # %
White, Non-Hispanic 54,201 14.13% 59,391 10.43% 60,553 7.82%
Black, Non-Hispanic 471 0.12% 2,052 0.36% 2,777 0.36%
Hispanic 326,912 85.22% 503,066 88.34% 702,206 90.63%Asian or Pacific Islander,
Non-Hispanic 806 0.21% 3,469 0.61% 7,171 0.93%
Native American, Non-Hispanic 178 0.05% 692 0.12% 524 0.07%
National Origin
Foreign-born 94,715 24.69% 168,217 29.54% 231,815 29.92%
LEP
Limited English Proficiency 151,056 39.38% 196,819 34.56% 230,396 29.74%
Sex
Male 185,042 48.25% 275,713 48.42% 376,944 48.65%
Female 198,503 51.75% 293,750 51.58% 397,825 51.35%
Age
Under 18 140,528 36.64% 205,848 36.15% 268,484 34.65%
18-64 204,823 53.40% 307,802 54.05% 434,037 56.02%
65+ 38,194 9.96% 55,813 9.80% 72,248 9.33%
Family Type
Families with children 52,436 59.17% 51,688 58.17% 100,613 56.00%
Assessment of Fair Housing Tool for Local Governments (LG2015)OMB Control Number: 2529-0054
12
Data Source: Decennial Census; ACS
Analysis:
Race/Ethnicity: White Non-Hispanic population grew 12% in a 20-year period from 1990to 2010 but Hispanics’ population grew at a 115% increase resulting in a larger overallrepresentation in the Region which reflects approximately 90.63% of the area.
National Origin: Foreign-born has increased at a 145% growth of population in a 20-year period from 1990 to 2010; however, as an overall regional representation, thispopulation has increased only 5%.
LEP: Limited-English Proficiency has increased at a 53% growth of population in a 20-year period from 1990 to 2010; however, as an overall regional representation, thispopulation has decreased by 10%.
Family Type: Families with children has increased at a 92% growth of population in a20-year period from 1990 to 2010; however, as an overall regional representation, thispopulation has had no significant increase or decrease.
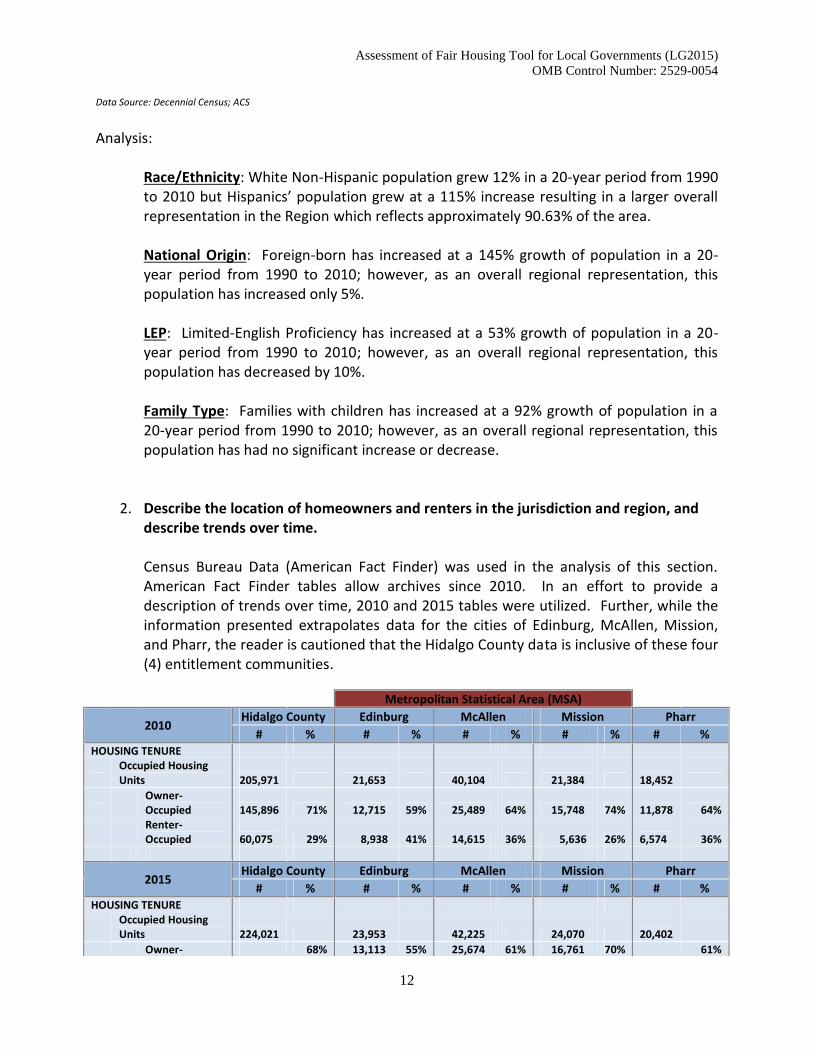
2. Describe the location of homeowners and renters in the jurisdiction and region, anddescribe trends over time.
Census Bureau Data (American Fact Finder) was used in the analysis of this section.American Fact Finder tables allow archives since 2010. In an effort to provide adescription of trends over time, 2010 and 2015 tables were utilized. Further, while theinformation presented extrapolates data for the cities of Edinburg, McAllen, Mission,and Pharr, the reader is cautioned that the Hidalgo County data is inclusive of these four(4) entitlement communities.
Metropolitan Statistical Area (MSA)
2010 Hidalgo County Edinburg McAllen Mission Pharr# % # % # % # % # %
HOUSING TENUREOccupied HousingUnits 205,971 21,653 40,104 21,384 18,452
Owner-Occupied 145,896 71% 12,715 59% 25,489 64% 15,748 74% 11,878 64%Renter-Occupied 60,075 29% 8,938 41% 14,615 36% 5,636 26% 6,574 36%
2015 Hidalgo County Edinburg McAllen Mission Pharr# % # % # % # % # %
HOUSING TENUREOccupied HousingUnits 224,021 23,953 42,225 24,070 20,402
Owner- 68% 13,113 55% 25,674 61% 16,761 70% 61%
Assessment of Fair Housing Tool for Local Governments (LG2015)OMB Control Number: 2529-0054
13
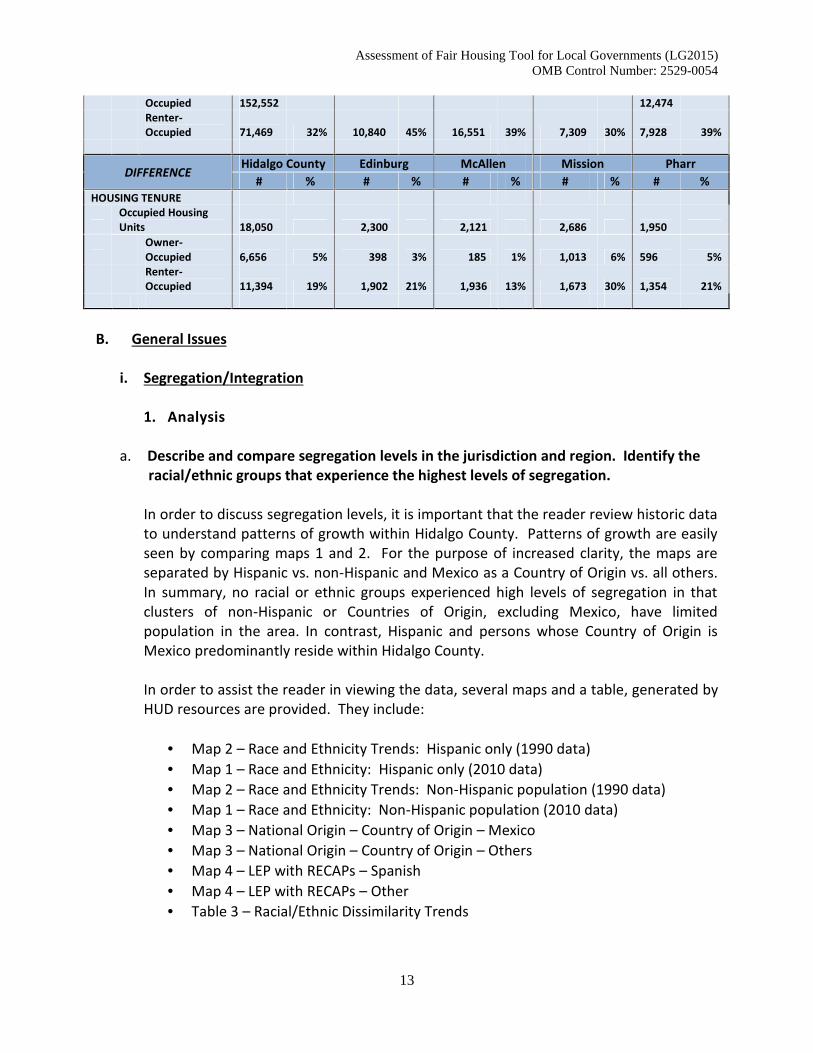
Occupied 152,552 12,474Renter-Occupied 71,469 32% 10,840 45% 16,551 39% 7,309 30% 7,928 39%
DIFFERENCE Hidalgo County Edinburg McAllen Mission Pharr# % # % # % # % # %
HOUSING TENUREOccupied HousingUnits 18,050 2,300 2,121 2,686 1,950
Owner-Occupied 6,656 5% 398 3% 185 1% 1,013 6% 596 5%Renter-Occupied 11,394 19% 1,902 21% 1,936 13% 1,673 30% 1,354 21%
B. General Issues
i. Segregation/Integration
1. Analysis
a. Describe and compare segregation levels in the jurisdiction and region. Identify theracial/ethnic groups that experience the highest levels of segregation.
In order to discuss segregation levels, it is important that the reader review historic datato understand patterns of growth within Hidalgo County. Patterns of growth are easilyseen by comparing maps 1 and 2. For the purpose of increased clarity, the maps areseparated by Hispanic vs. non-Hispanic and Mexico as a Country of Origin vs. all others.In summary, no racial or ethnic groups experienced high levels of segregation in thatclusters of non-Hispanic or Countries of Origin, excluding Mexico, have limitedpopulation in the area. In contrast, Hispanic and persons whose Country of Origin isMexico predominantly reside within Hidalgo County.
In order to assist the reader in viewing the data, several maps and a table, generated byHUD resources are provided. They include:
Map 2 – Race and Ethnicity Trends: Hispanic only (1990 data) Map 1 – Race and Ethnicity: Hispanic only (2010 data) Map 2 – Race and Ethnicity Trends: Non-Hispanic population (1990 data) Map 1 – Race and Ethnicity: Non-Hispanic population (2010 data) Map 3 – National Origin – Country of Origin – Mexico Map 3 – National Origin – Country of Origin – Others Map 4 – LEP with RECAPs – Spanish Map 4 – LEP with RECAPs – Other Table 3 – Racial/Ethnic Dissimilarity Trends
Assessment of Fair Housing Tool for Local Governments (LG2015)OMB Control Number: 2529-0054
14
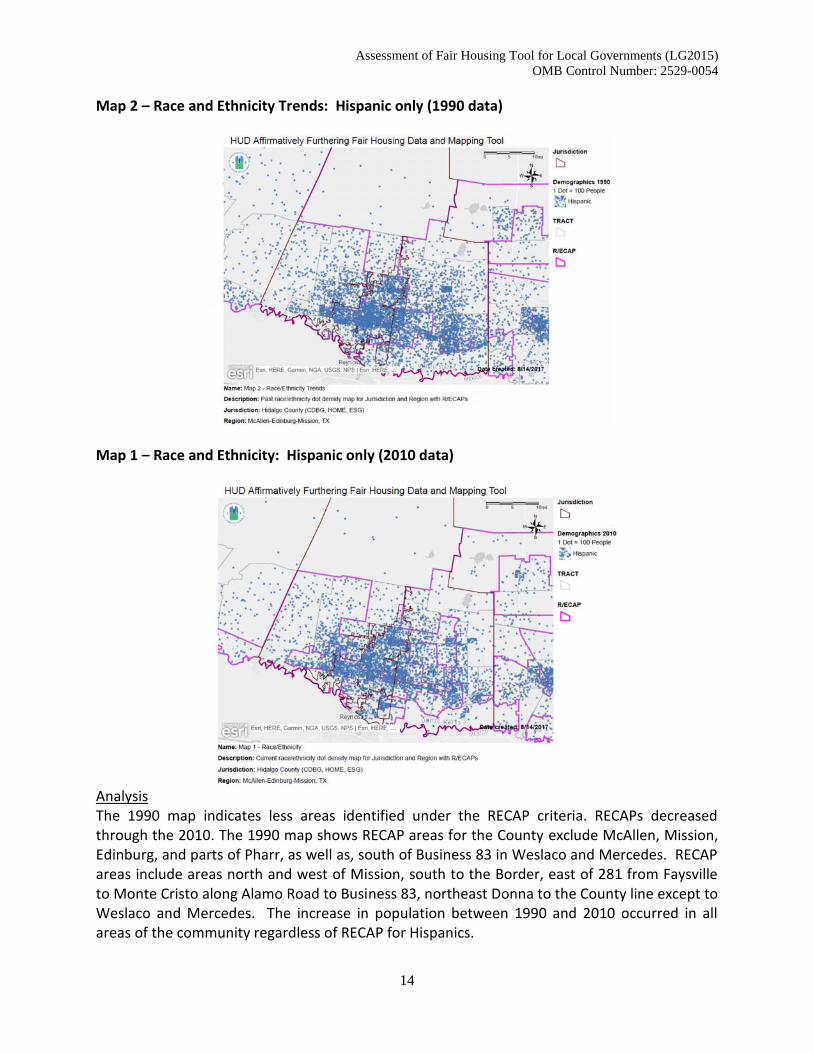
Map 2 – Race and Ethnicity Trends: Hispanic only (1990 data)
Map 1 – Race and Ethnicity: Hispanic only (2010 data)
AnalysisThe 1990 map indicates less areas identified under the RECAP criteria. RECAPs decreasedthrough the 2010. The 1990 map shows RECAP areas for the County exclude McAllen, Mission,Edinburg, and parts of Pharr, as well as, south of Business 83 in Weslaco and Mercedes. RECAPareas include areas north and west of Mission, south to the Border, east of 281 from Faysvilleto Monte Cristo along Alamo Road to Business 83, northeast Donna to the County line except toWeslaco and Mercedes. The increase in population between 1990 and 2010 occurred in allareas of the community regardless of RECAP for Hispanics.
Assessment of Fair Housing Tool for Local Governments (LG2015)OMB Control Number: 2529-0054
15
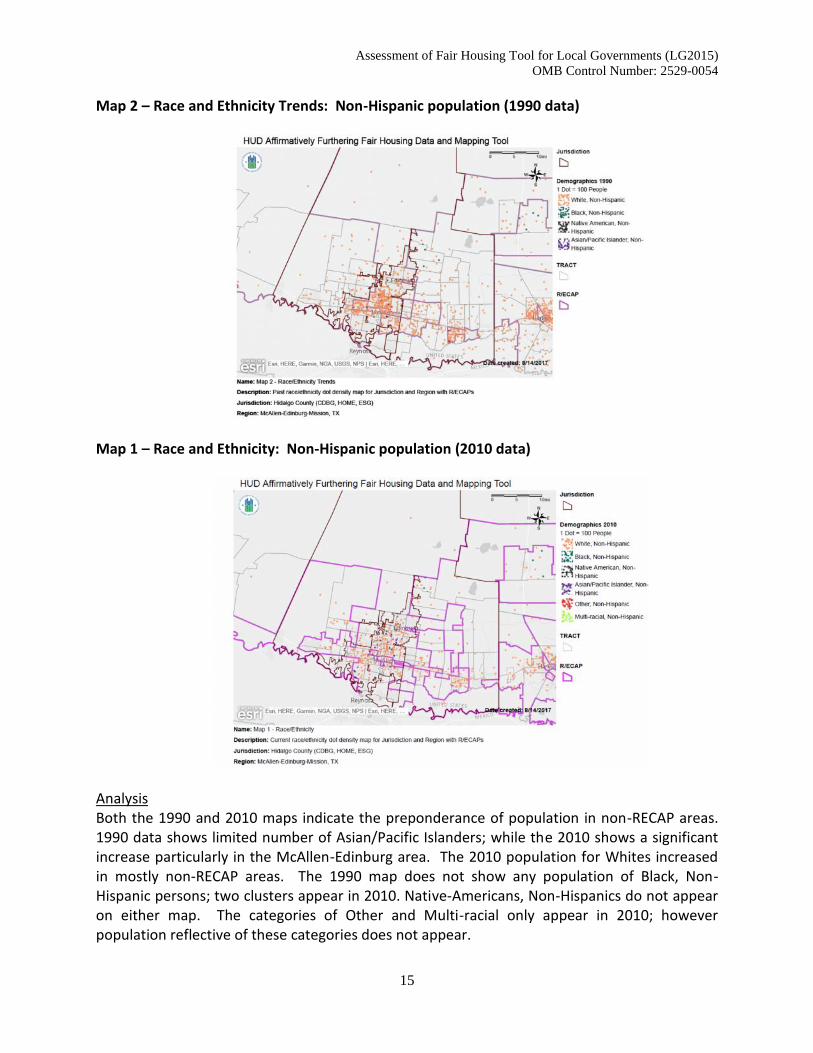
Map 2 – Race and Ethnicity Trends: Non-Hispanic population (1990 data)
Map 1 – Race and Ethnicity: Non-Hispanic population (2010 data)
AnalysisBoth the 1990 and 2010 maps indicate the preponderance of population in non-RECAP areas.1990 data shows limited number of Asian/Pacific Islanders; while the 2010 shows a significantincrease particularly in the McAllen-Edinburg area. The 2010 population for Whites increasedin mostly non-RECAP areas. The 1990 map does not show any population of Black, Non-Hispanic persons; two clusters appear in 2010. Native-Americans, Non-Hispanics do not appearon either map. The categories of Other and Multi-racial only appear in 2010; howeverpopulation reflective of these categories does not appear.
Assessment of Fair Housing Tool for Local Governments (LG2015)OMB Control Number: 2529-0054
16
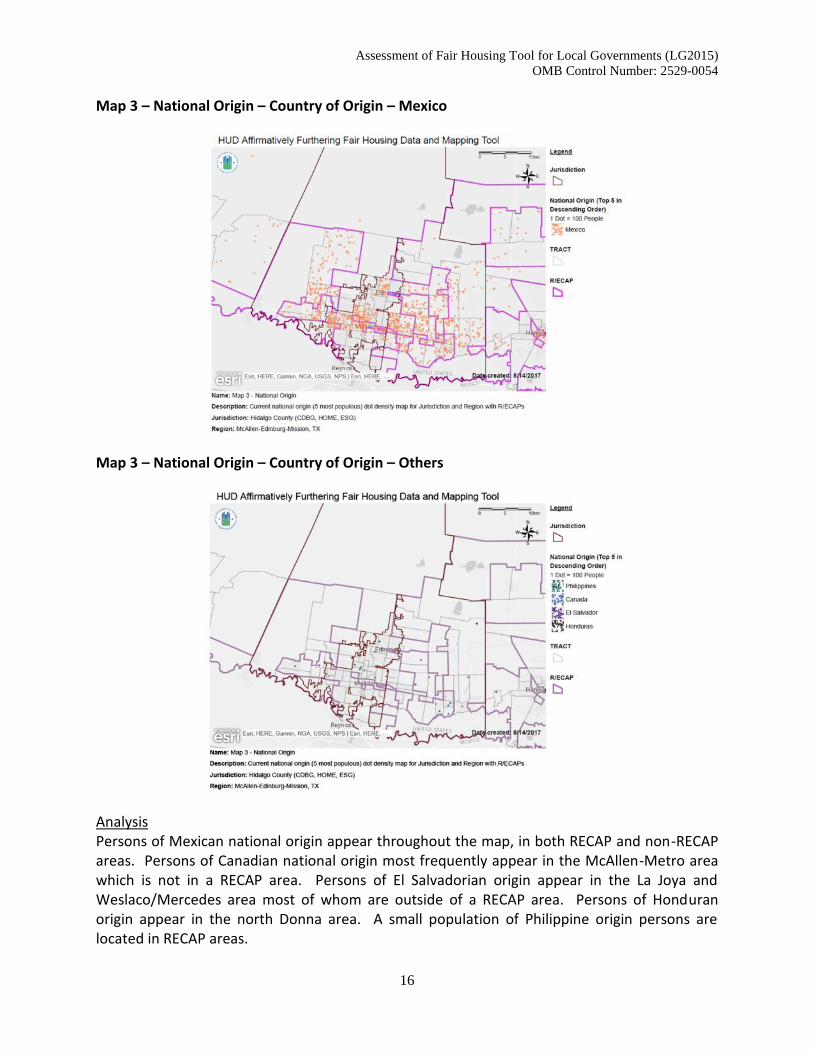
Map 3 – National Origin – Country of Origin – Mexico
Map 3 – National Origin – Country of Origin – Others
AnalysisPersons of Mexican national origin appear throughout the map, in both RECAP and non-RECAPareas. Persons of Canadian national origin most frequently appear in the McAllen-Metro areawhich is not in a RECAP area. Persons of El Salvadorian origin appear in the La Joya andWeslaco/Mercedes area most of whom are outside of a RECAP area. Persons of Honduranorigin appear in the north Donna area. A small population of Philippine origin persons arelocated in RECAP areas.
Assessment of Fair Housing Tool for Local Governments (LG2015)OMB Control Number: 2529-0054
17
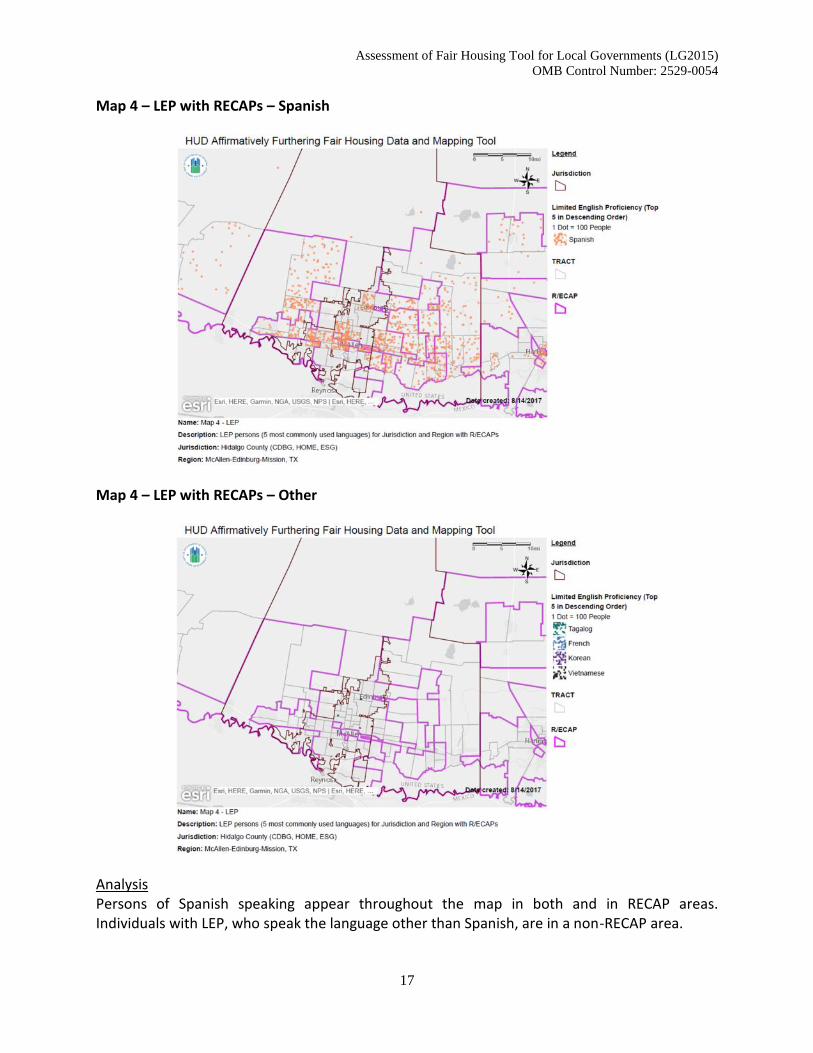
Map 4 – LEP with RECAPs – Spanish
Map 4 – LEP with RECAPs – Other
AnalysisPersons of Spanish speaking appear throughout the map in both and in RECAP areas.Individuals with LEP, who speak the language other than Spanish, are in a non-RECAP area.
Assessment of Fair Housing Tool for Local Governments (LG2015)OMB Control Number: 2529-0054
18
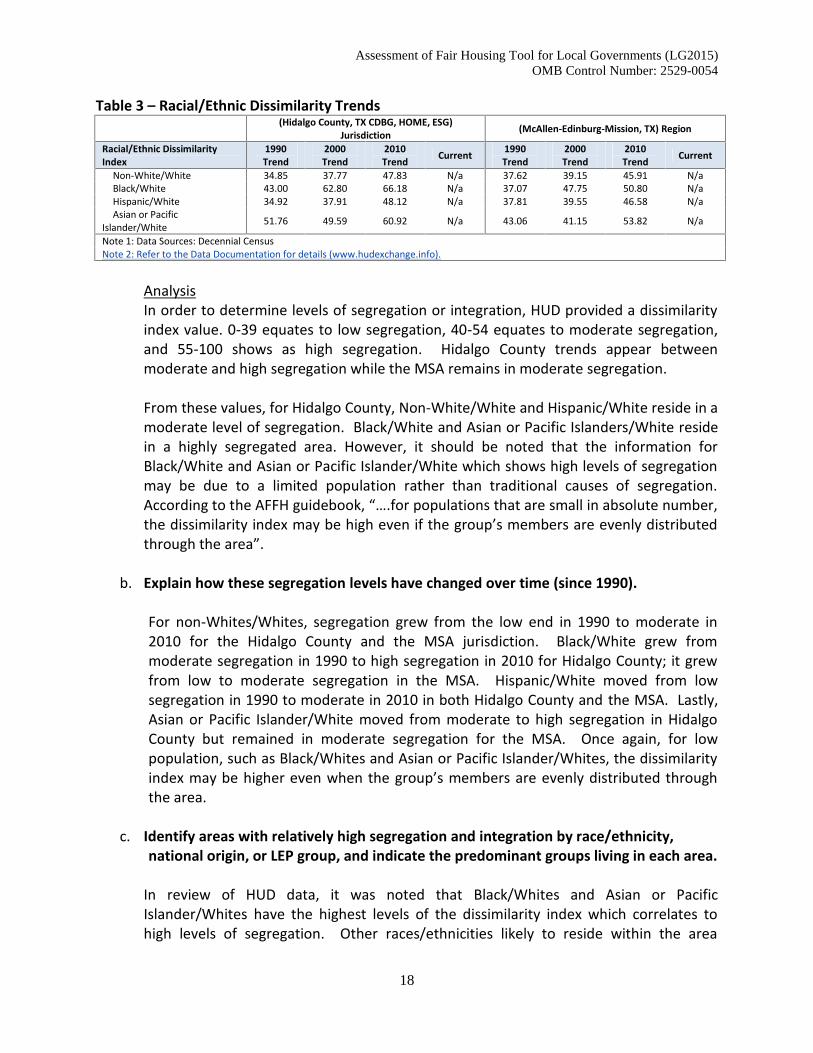
Table 3 – Racial/Ethnic Dissimilarity Trends(Hidalgo County, TX CDBG, HOME, ESG)
Jurisdiction (McAllen-Edinburg-Mission, TX) Region
Racial/Ethnic DissimilarityIndex
1990Trend
2000Trend
2010Trend Current 1990
Trend2000Trend
2010Trend Current
Non-White/White 34.85 37.77 47.83 N/a 37.62 39.15 45.91 N/aBlack/White 43.00 62.80 66.18 N/a 37.07 47.75 50.80 N/aHispanic/White 34.92 37.91 48.12 N/a 37.81 39.55 46.58 N/aAsian or Pacific
Islander/White 51.76 49.59 60.92 N/a 43.06 41.15 53.82 N/a
Note 1: Data Sources: Decennial CensusNote 2: Refer to the Data Documentation for details (www.hudexchange.info).
AnalysisIn order to determine levels of segregation or integration, HUD provided a dissimilarityindex value. 0-39 equates to low segregation, 40-54 equates to moderate segregation,and 55-100 shows as high segregation. Hidalgo County trends appear betweenmoderate and high segregation while the MSA remains in moderate segregation.
From these values, for Hidalgo County, Non-White/White and Hispanic/White reside in amoderate level of segregation. Black/White and Asian or Pacific Islanders/White residein a highly segregated area. However, it should be noted that the information forBlack/White and Asian or Pacific Islander/White which shows high levels of segregationmay be due to a limited population rather than traditional causes of segregation.According to the AFFH guidebook, “….for populations that are small in absolute number,the dissimilarity index may be high even if the group’s members are evenly distributedthrough the area”.
b. Explain how these segregation levels have changed over time (since 1990).
For non-Whites/Whites, segregation grew from the low end in 1990 to moderate in2010 for the Hidalgo County and the MSA jurisdiction. Black/White grew frommoderate segregation in 1990 to high segregation in 2010 for Hidalgo County; it grewfrom low to moderate segregation in the MSA. Hispanic/White moved from lowsegregation in 1990 to moderate in 2010 in both Hidalgo County and the MSA. Lastly,Asian or Pacific Islander/White moved from moderate to high segregation in HidalgoCounty but remained in moderate segregation for the MSA. Once again, for lowpopulation, such as Black/Whites and Asian or Pacific Islander/Whites, the dissimilarityindex may be higher even when the group’s members are evenly distributed throughthe area.
c. Identify areas with relatively high segregation and integration by race/ethnicity,national origin, or LEP group, and indicate the predominant groups living in each area.
In review of HUD data, it was noted that Black/Whites and Asian or PacificIslander/Whites have the highest levels of the dissimilarity index which correlates tohigh levels of segregation. Other races/ethnicities likely to reside within the area
Assessment of Fair Housing Tool for Local Governments (LG2015)OMB Control Number: 2529-0054
19
include Hispanics, persons with Mexico as a Country of Origin, and Spanish-speakingindividuals.
d. Consider and describe the location of owner and renter occupied housing indetermining whether such housing is located in segregated or integrated areas.
No integrated areas exist in Hidalgo County, as defined by HUD’s dissimilarity indexvalue. Conversely, segregated areas exist outside of the MSA, for Black/White and Asianor Pacific Islander/White persons. Based on the Map 1 – Race/Ethnicity – (Non-Hispanic), residential patterns for persons with high segregation values are located innon-MSA areas and near Faysville and in the city of Weslaco. Hidalgo Countyhomeownership rates are more than double the number of renter occupied units.
e. Discuss how patterns of segregation have changed over time (since 1990).
Based on the data between 1990 and 2010, for populations located in the MSA,segregation patterns increased from low to moderate for all classes, except Asian orPacific Islander/White, which remained as moderate. Using 2015 data extrapolation,the households are twice as likely to be homeowners versus renters in the MSA.
Based on the data between 1990 and 2010, for populations located in Hidalgo County,segregation patterns increased from low to moderate for Non-White/White andHispanic/White. The dissimilarity index value which moved from moderate to highincluded Black/White and Asian or Pacific Islander/White. Using 2015 dataextrapolation, the households are twice as likely to be homeowners versus renters inHidalgo County.
f. Discuss whether there are any demographic trends, policies, or practices that couldlead to higher segregation in the jurisdiction in the future.
While no increase in higher segregation is expected to occur, location of housing andquality amenities may be the predictor in determining where growth patterns develop.This may be especially true for persons who settle in the area who were not previously alarge enumeration.
2. Additional Information
a. Beyond the HUD-provided data, provide additional relevant information, ifany, about segregation in the jurisdiction and region affecting groups withother protected characteristics.
N/A
Assessment of Fair Housing Tool for Local Governments (LG2015)OMB Control Number: 2529-0054
20
b. The program participant may also describe other information relevant to itsassessment of segregation, including activities such as place-based investmentsand mobility options for protected class groups.
Due to the moderate/high levels of segregation of the non-Hispanic population,activities such as place-based investments and mobility options do not thoroughly de-concentrate or further concentrate housing of protected classes within any oneparticular area within the county.
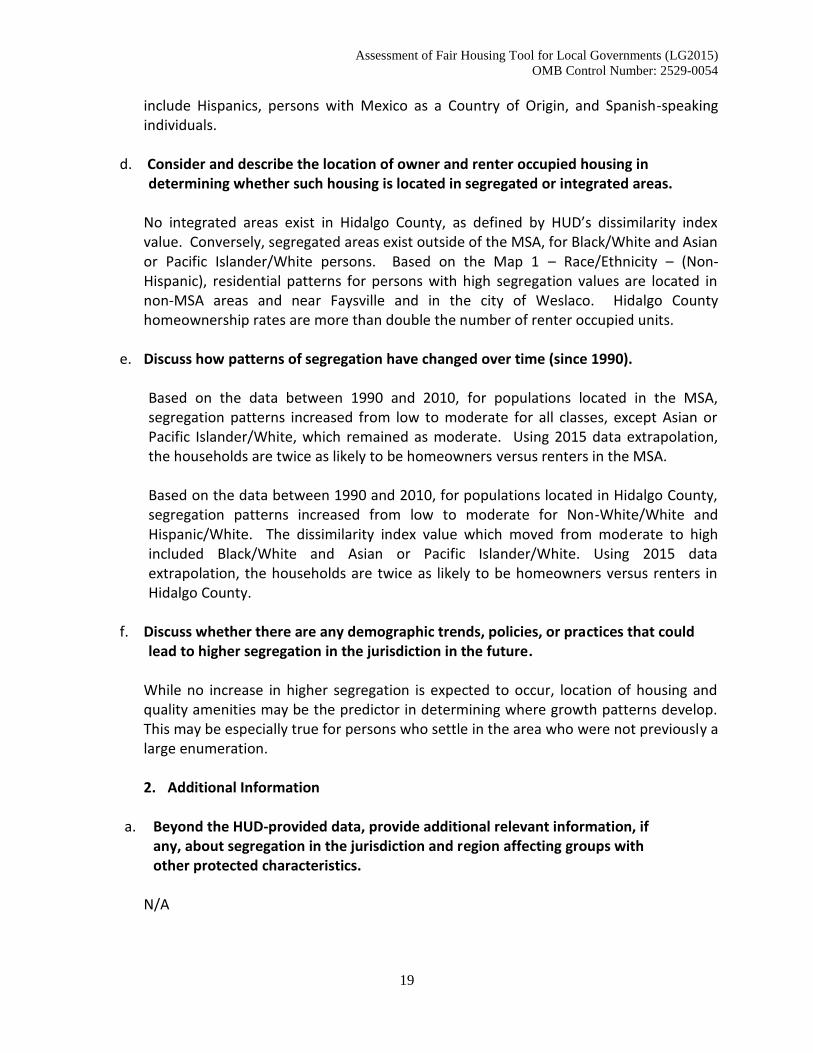
3. Contributing Factors of Segregation –
Consider the listed factors and any other factors affecting the jurisdiction and region.Identify factors that significantly create, contribute to, perpetuate, or increase theseverity of segregation.
Community Opposition Displacement of residents due to economic pressures Lack of community revitalization strategies Lack of private investments in specific neighborhoods Lack of public investments in specific neighborhoods, including services or
amenities Lack of regional cooperation Land use and zoning laws Lending Discrimination Location and type of affordable housing Occupancy codes and restrictions Private discrimination Other
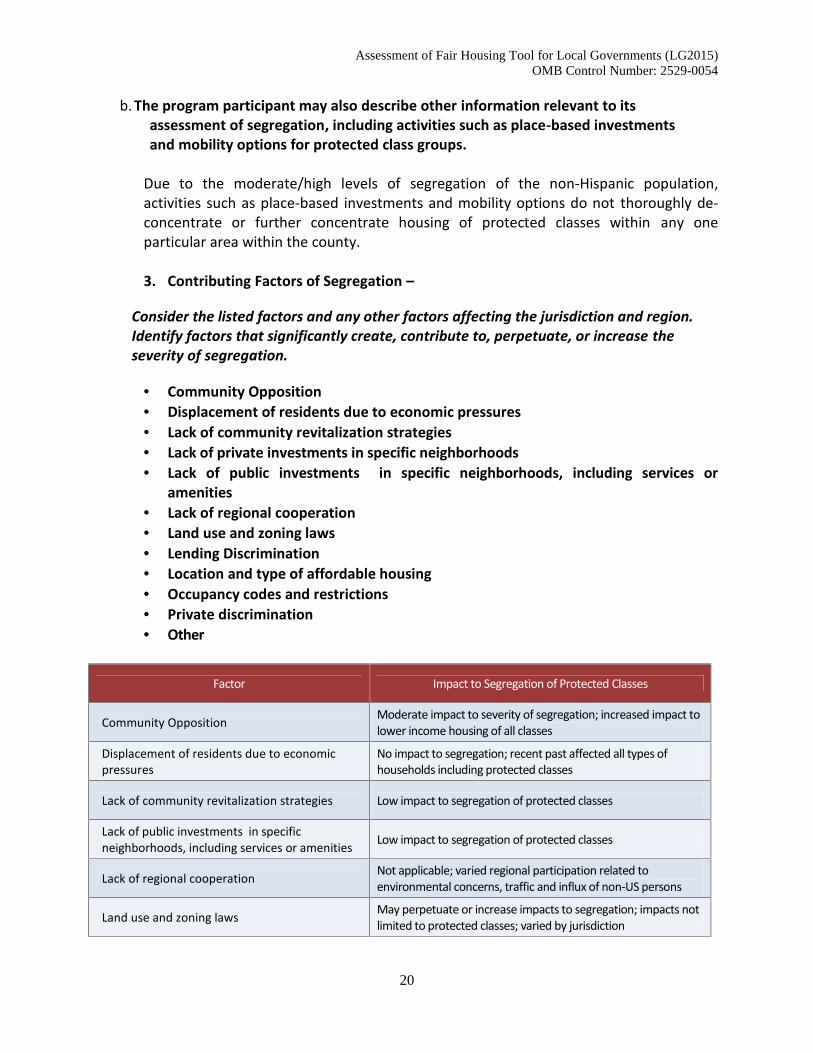
Factor Impact to Segregation of Protected Classes
Community Opposition Moderate impact to severity of segregation; increased impact tolower income housing of all classes
Displacement of residents due to economicpressures
No impact to segregation; recent past affected all types ofhouseholds including protected classes
Lack of community revitalization strategies Low impact to segregation of protected classes
Lack of public investments in specificneighborhoods, including services or amenities Low impact to segregation of protected classes
Lack of regional cooperation Not applicable; varied regional participation related toenvironmental concerns, traffic and influx of non-US persons
Land use and zoning laws May perpetuate or increase impacts to segregation; impacts notlimited to protected classes; varied by jurisdiction
Assessment of Fair Housing Tool for Local Governments (LG2015)OMB Control Number: 2529-0054
21
Lending Discrimination May perpetuate or increase impacts to segregation; impacts notlimited to protected classes; varied by jurisdiction
Location and type of affordable housing
May create or increase impacts to segregation; segregation mayoccur from environmental concerns, jurisdictional issues, andcost of housing; higher impact for large families and persons withspecial needs and/or handicapped
Occupancy codes and restrictions
May perpetuate or increase impacts to segregation; impacts notlimited to protected classes; varied by jurisdiction; higher impactfor large families and persons with special needs and/orhandicapped
Private discrimination Can perpetuate or increase impacts to segregation particularlyfor rental households
Other Income: High Impact of segregation for all classes includingprotected classes
ii. R/ECAPs
1. Analysis
a. Identify any R/ECAPs or groupings of R/ECAP tracts within the jurisdiction.
Hidalgo County appears to be equally divided between a R/ECAP and a NON-R/ECAP area. The R/ECAP area appears predominately in the eastern and westernmost boundaries of the county. Of note, these areas are less populated than theinterior of the county.
b. Which protected classes disproportionately reside in R/ECAPs compared tothe jurisdiction and region?
As expected, due to the area’s high number of Hispanics and persons ofMexican origin, congregations of these individuals reside in the R/ECAPs. Onlya few persons of other racial and ethnic makeup appear in the R/ECAPs.
A fraction of the non-Hispanic White population reside in the R/ECAP area.
Two-thirds of the Black non-Hispanic population resides in the R/ECAP area.
Asian/Pacific Islander, Non-Hispanic do not reside in the R/ECAP area.
(a) Native American, Non-Hispanic, (b) Other, Non-Hispanic, and (c) Multi-racial, Non-Hispanic do not appear on the map.
c. Describe how R/ECAPs have changed over time (since 1990).
R/ECAPs have decreased since 1990. Changes are most significantly seen along Business83 from La Joya east to the city of Weslaco. In addition, the area east of Edinburgtowards Elsa no longer qualifies as a R/ECAP.
Assessment of Fair Housing Tool for Local Governments (LG2015)OMB Control Number: 2529-0054
22
2. Additional Information
a. Beyond the HUD-provided data, provide additional relevant information, ifany, about R/ECAPs in the jurisdiction and region affecting groups with otherprotected characteristics.
N/A
b. The program participant may also describe other information relevant to itsassessment of R/ECAPs, including activities such as place-based investmentsand mobility options for protected class groups.
The reduction in the R/ECAP areas are due to increased economic opportunities,removal of affordable housing barriers/increase in government assistance, and otherrevitalization efforts. Such actions positively affect households including those inprotected classes.
3. Contributing Factors of R/ECAPs
Consider the listed factors and any other factors affecting the jurisdiction andregion. Identify factors that significantly create, contribute to, perpetuate, orincrease the severity of R/ECAPs.
Community Opposition Deteriorated and abandoned properties Displacement of residents due to economic pressures Lack of community revitalization strategies Lack of private investments in specific neighborhoods Lack of public investments in specific neighborhoods, including services or
amenities Lack of regional cooperation Land use and zoning laws Location and type of affordable housing Occupancy codes and restrictions Private discrimination Other
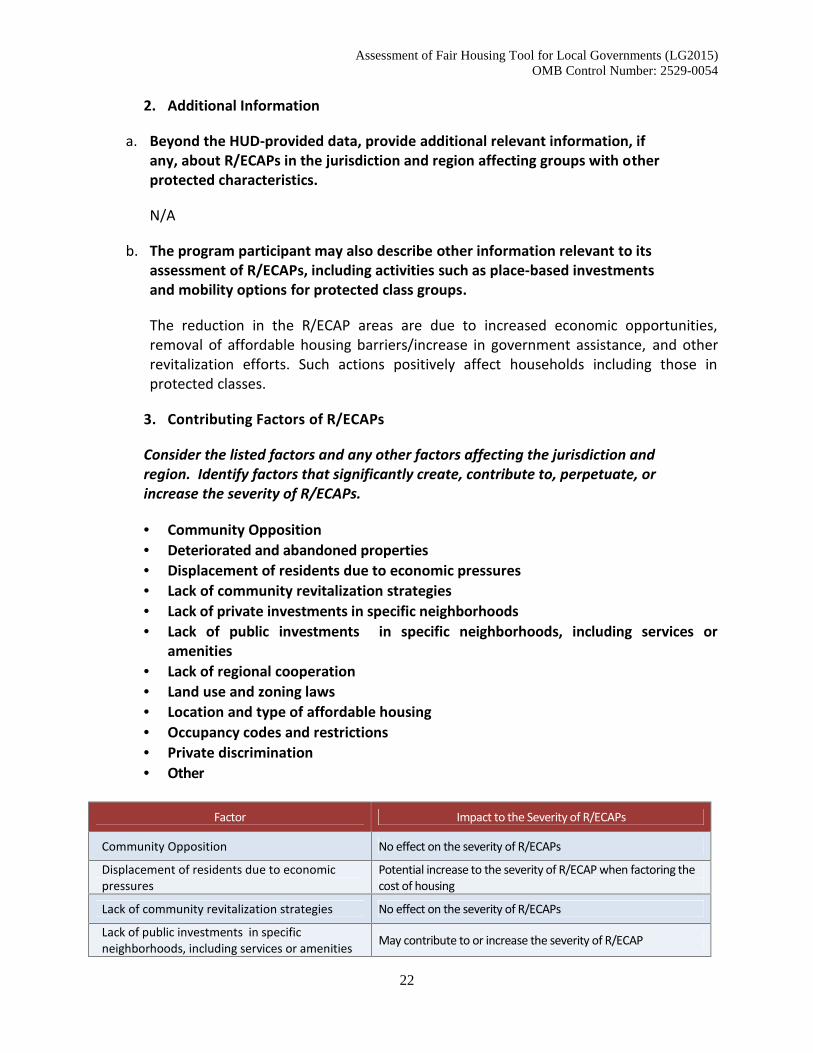
Factor Impact to the Severity of R/ECAPs
Community Opposition No effect on the severity of R/ECAPs
Displacement of residents due to economicpressures
Potential increase to the severity of R/ECAP when factoring thecost of housing
Lack of community revitalization strategies No effect on the severity of R/ECAPs
Lack of public investments in specificneighborhoods, including services or amenities May contribute to or increase the severity of R/ECAP
Assessment of Fair Housing Tool for Local Governments (LG2015)OMB Control Number: 2529-0054
23
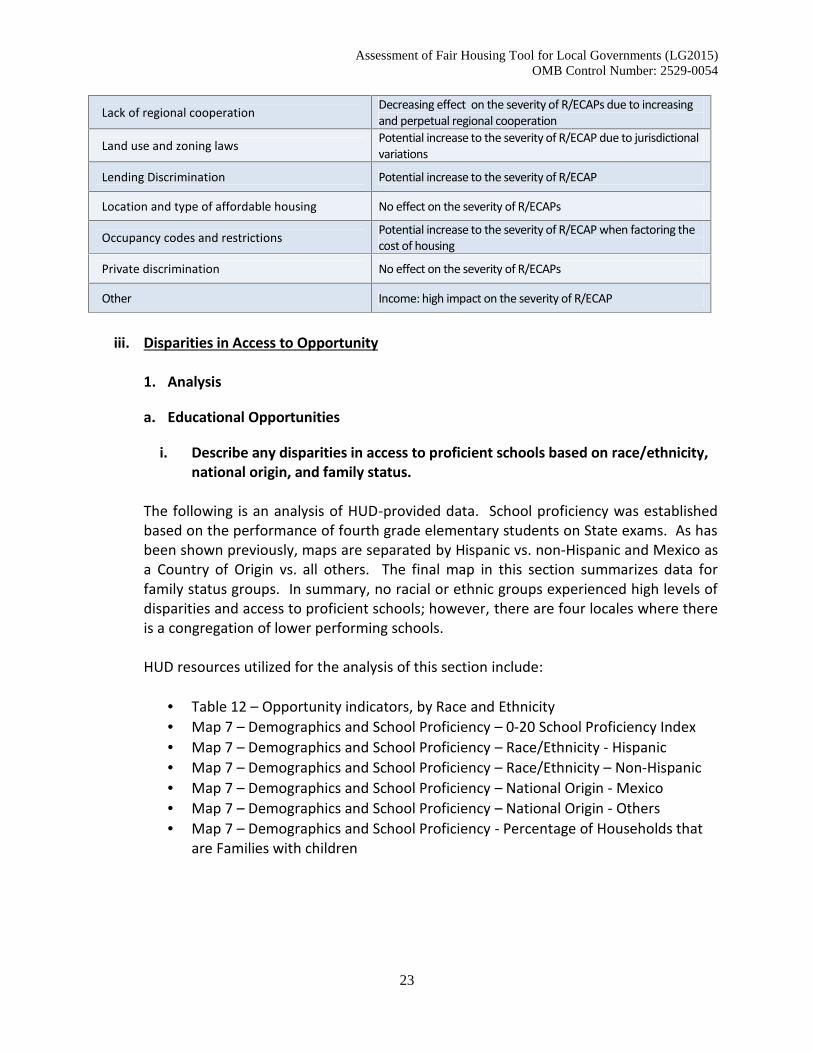
Lack of regional cooperation Decreasing effect on the severity of R/ECAPs due to increasingand perpetual regional cooperation
Land use and zoning laws Potential increase to the severity of R/ECAP due to jurisdictionalvariations
Lending Discrimination Potential increase to the severity of R/ECAP
Location and type of affordable housing No effect on the severity of R/ECAPs
Occupancy codes and restrictions Potential increase to the severity of R/ECAP when factoring thecost of housing
Private discrimination No effect on the severity of R/ECAPs
Other Income: high impact on the severity of R/ECAP
iii. Disparities in Access to Opportunity
1. Analysis
a. Educational Opportunities
i. Describe any disparities in access to proficient schools based on race/ethnicity,national origin, and family status.
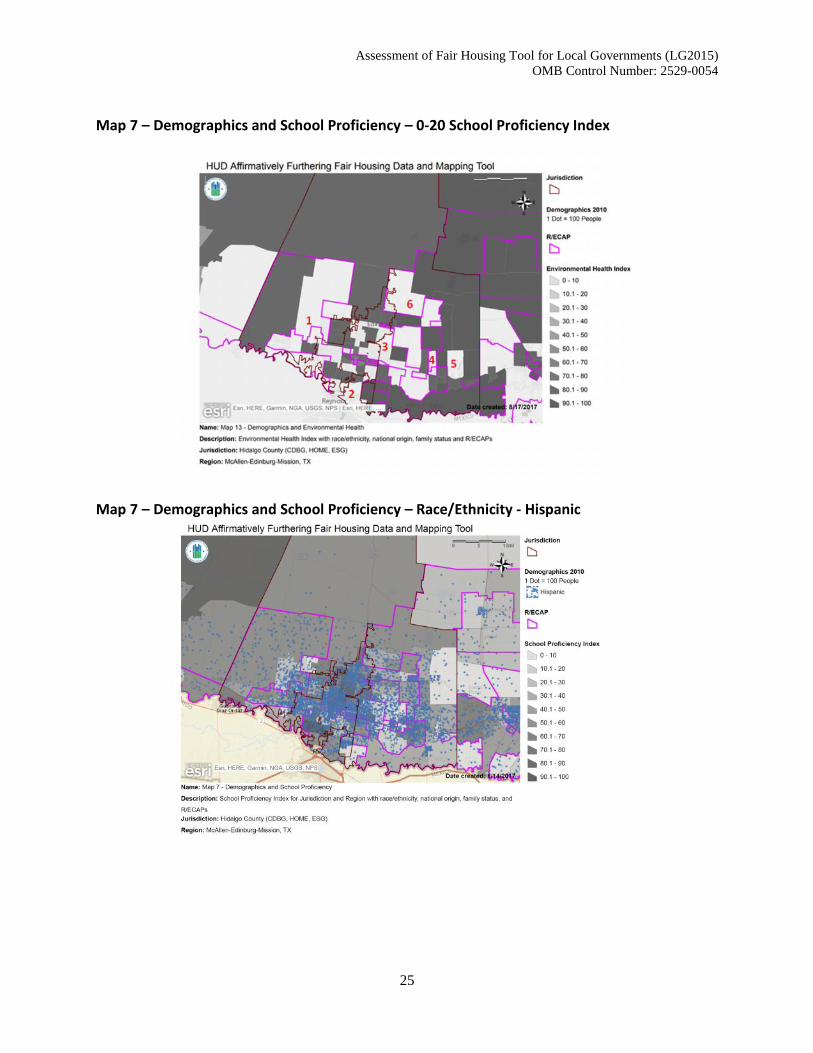
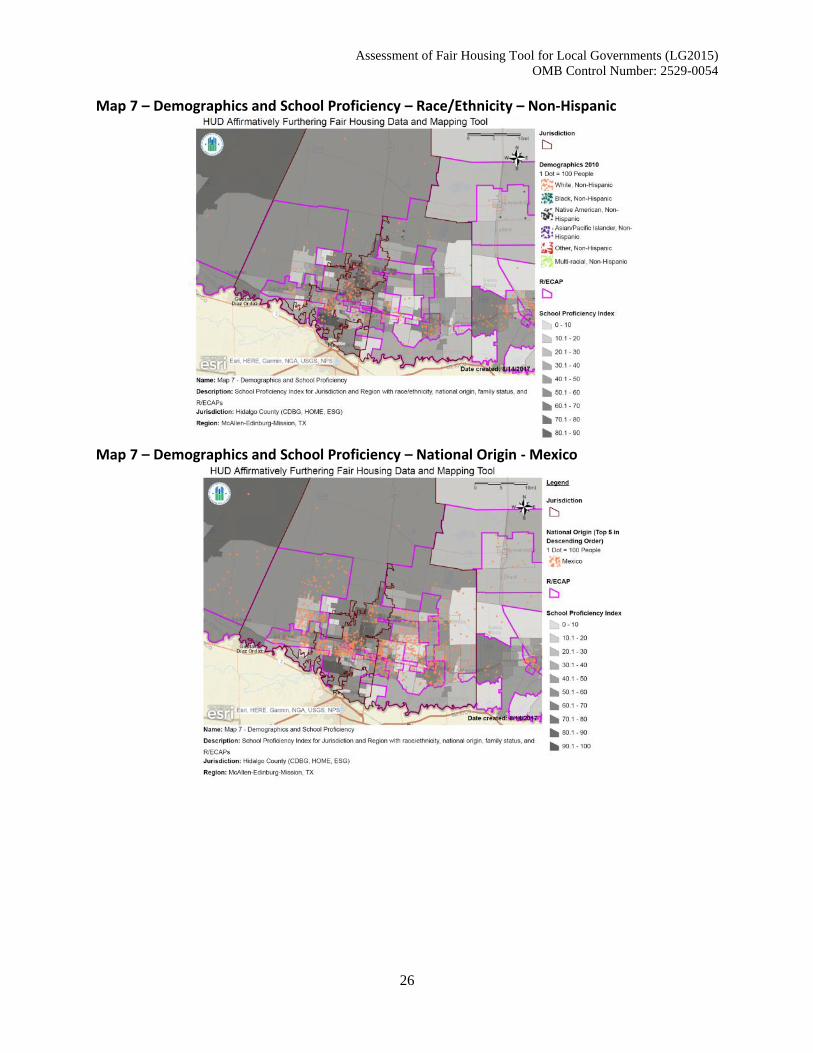
The following is an analysis of HUD-provided data. School proficiency was establishedbased on the performance of fourth grade elementary students on State exams. As hasbeen shown previously, maps are separated by Hispanic vs. non-Hispanic and Mexico asa Country of Origin vs. all others. The final map in this section summarizes data forfamily status groups. In summary, no racial or ethnic groups experienced high levels ofdisparities and access to proficient schools; however, there are four locales where thereis a congregation of lower performing schools.
HUD resources utilized for the analysis of this section include:
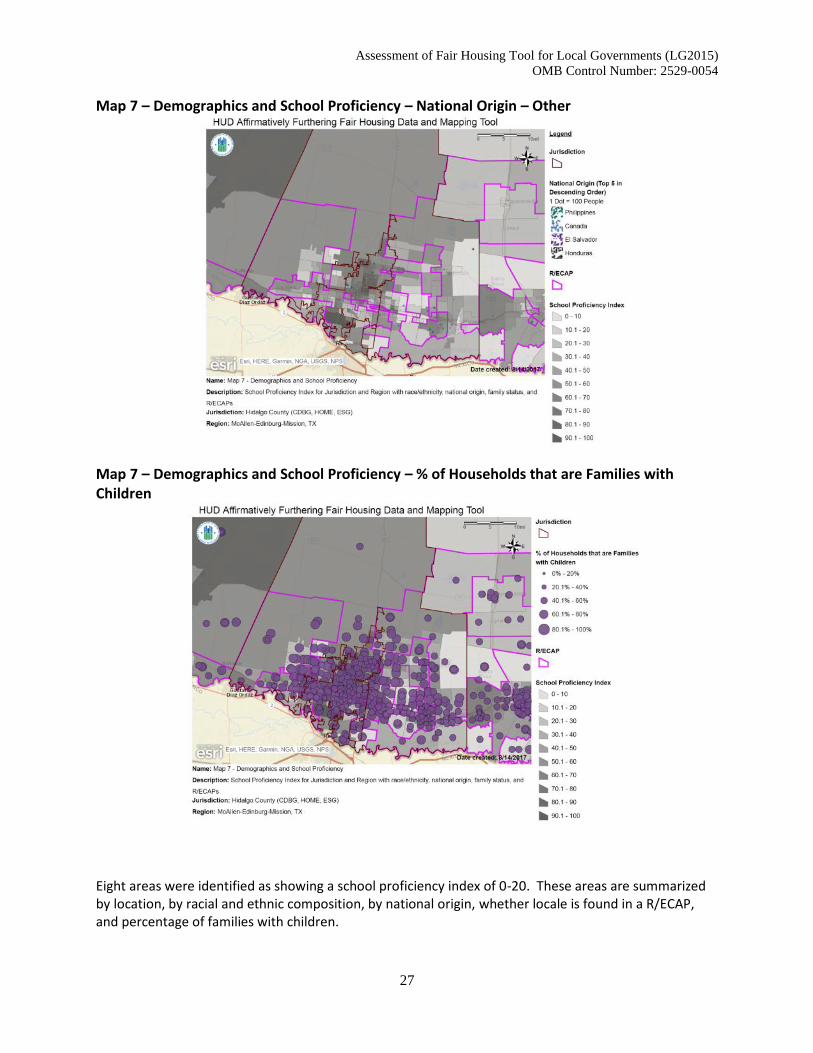
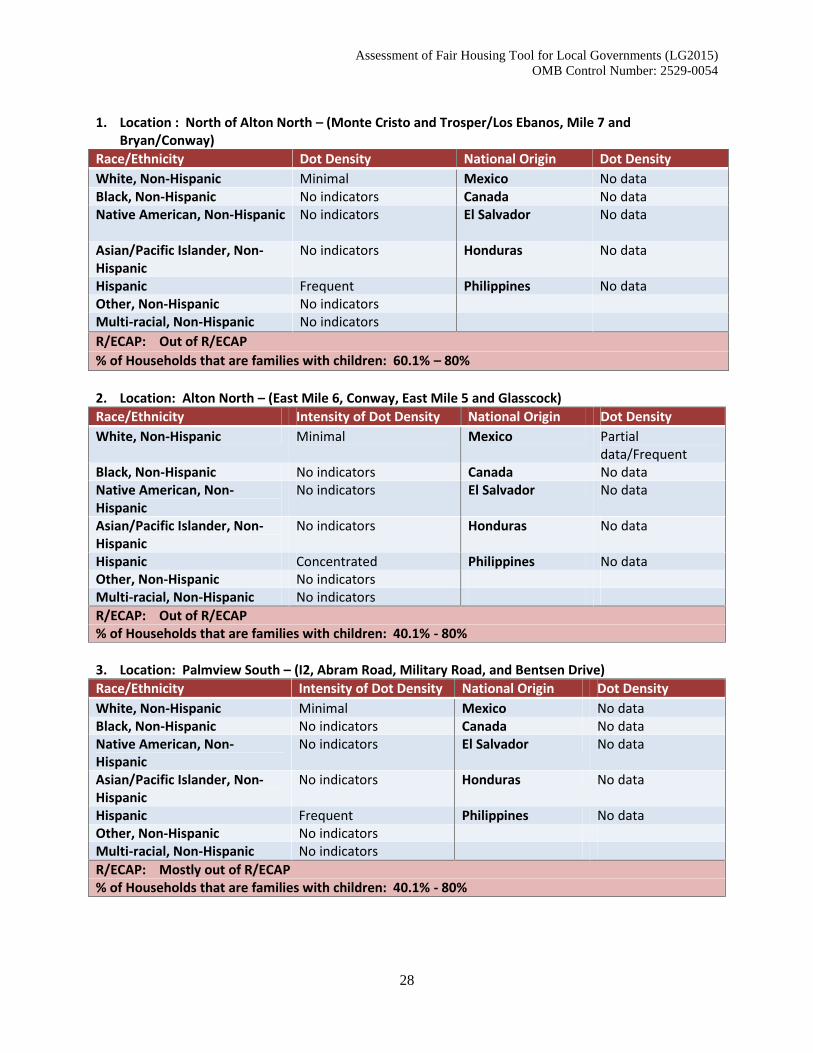
Table 12 – Opportunity indicators, by Race and Ethnicity Map 7 – Demographics and School Proficiency – 0-20 School Proficiency Index Map 7 – Demographics and School Proficiency – Race/Ethnicity - Hispanic Map 7 – Demographics and School Proficiency – Race/Ethnicity – Non-Hispanic Map 7 – Demographics and School Proficiency – National Origin - Mexico Map 7 – Demographics and School Proficiency – National Origin - Others Map 7 – Demographics and School Proficiency - Percentage of Households that
are Families with children
Assessment of Fair Housing Tool for Local Governments (LG2015)OMB Control Number: 2529-0054
24
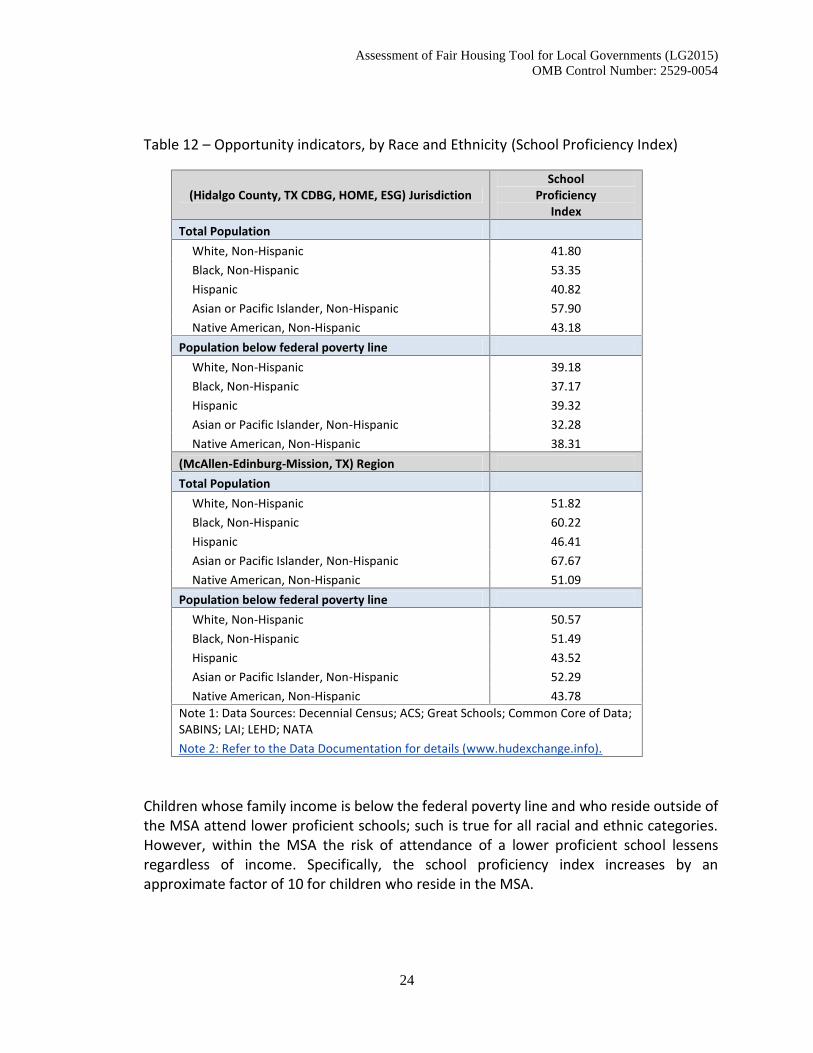
Table 12 – Opportunity indicators, by Race and Ethnicity (School Proficiency Index)
(Hidalgo County, TX CDBG, HOME, ESG) JurisdictionSchool
ProficiencyIndex
Total PopulationWhite, Non-Hispanic 41.80Black, Non-Hispanic 53.35Hispanic 40.82Asian or Pacific Islander, Non-Hispanic 57.90Native American, Non-Hispanic 43.18
Population below federal poverty lineWhite, Non-Hispanic 39.18Black, Non-Hispanic 37.17Hispanic 39.32Asian or Pacific Islander, Non-Hispanic 32.28Native American, Non-Hispanic 38.31
(McAllen-Edinburg-Mission, TX) RegionTotal Population
White, Non-Hispanic 51.82Black, Non-Hispanic 60.22Hispanic 46.41Asian or Pacific Islander, Non-Hispanic 67.67Native American, Non-Hispanic 51.09
Population below federal poverty lineWhite, Non-Hispanic 50.57Black, Non-Hispanic 51.49Hispanic 43.52Asian or Pacific Islander, Non-Hispanic 52.29Native American, Non-Hispanic 43.78
Note 1: Data Sources: Decennial Census; ACS; Great Schools; Common Core of Data;SABINS; LAI; LEHD; NATANote 2: Refer to the Data Documentation for details (www.hudexchange.info).
Children whose family income is below the federal poverty line and who reside outside ofthe MSA attend lower proficient schools; such is true for all racial and ethnic categories.However, within the MSA the risk of attendance of a lower proficient school lessensregardless of income. Specifically, the school proficiency index increases by anapproximate factor of 10 for children who reside in the MSA.
Assessment of Fair Housing Tool for Local Governments (LG2015)OMB Control Number: 2529-0054
25
Map 7 – Demographics and School Proficiency – 0-20 School Proficiency Index
Map 7 – Demographics and School Proficiency – Race/Ethnicity - Hispanic
Assessment of Fair Housing Tool for Local Governments (LG2015)OMB Control Number: 2529-0054
26
Map 7 – Demographics and School Proficiency – Race/Ethnicity – Non-Hispanic
Map 7 – Demographics and School Proficiency – National Origin - Mexico
Assessment of Fair Housing Tool for Local Governments (LG2015)OMB Control Number: 2529-0054
27
Map 7 – Demographics and School Proficiency – National Origin – Other
Map 7 – Demographics and School Proficiency – % of Households that are Families withChildren
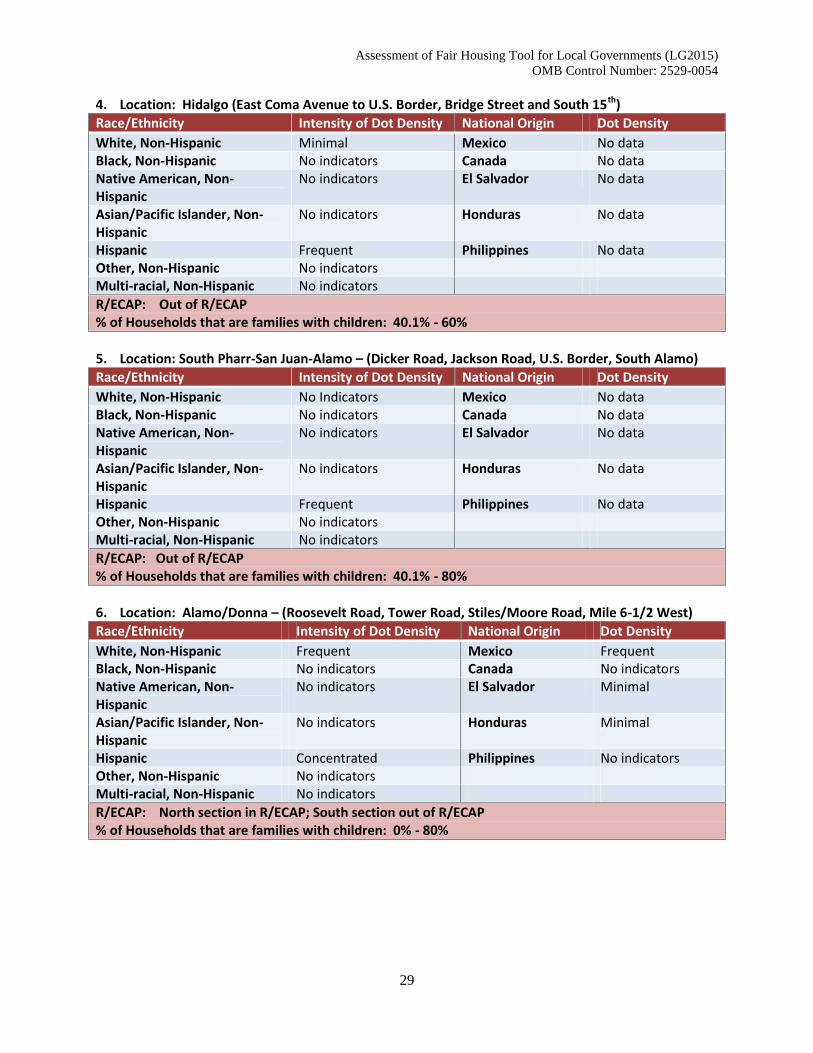
Eight areas were identified as showing a school proficiency index of 0-20. These areas are summarizedby location, by racial and ethnic composition, by national origin, whether locale is found in a R/ECAP,and percentage of families with children.
Assessment of Fair Housing Tool for Local Governments (LG2015)OMB Control Number: 2529-0054
28
1. Location : North of Alton North – (Monte Cristo and Trosper/Los Ebanos, Mile 7 andBryan/Conway)
Race/Ethnicity Dot Density National Origin Dot DensityWhite, Non-Hispanic Minimal Mexico No dataBlack, Non-Hispanic No indicators Canada No dataNative American, Non-Hispanic No indicators El Salvador No data
Asian/Pacific Islander, Non-Hispanic
No indicators Honduras No data
Hispanic Frequent Philippines No dataOther, Non-Hispanic No indicatorsMulti-racial, Non-Hispanic No indicatorsR/ECAP: Out of R/ECAP% of Households that are families with children: 60.1% – 80%
2. Location: Alton North – (East Mile 6, Conway, East Mile 5 and Glasscock)Race/Ethnicity Intensity of Dot Density National Origin Dot DensityWhite, Non-Hispanic Minimal Mexico Partial
data/FrequentBlack, Non-Hispanic No indicators Canada No dataNative American, Non-Hispanic
No indicators El Salvador No data
Asian/Pacific Islander, Non-Hispanic
No indicators Honduras No data
Hispanic Concentrated Philippines No dataOther, Non-Hispanic No indicatorsMulti-racial, Non-Hispanic No indicatorsR/ECAP: Out of R/ECAP% of Households that are families with children: 40.1% - 80%
3. Location: Palmview South – (I2, Abram Road, Military Road, and Bentsen Drive)Race/Ethnicity Intensity of Dot Density National Origin Dot DensityWhite, Non-Hispanic Minimal Mexico No dataBlack, Non-Hispanic No indicators Canada No dataNative American, Non-Hispanic
No indicators El Salvador No data
Asian/Pacific Islander, Non-Hispanic
No indicators Honduras No data
Hispanic Frequent Philippines No dataOther, Non-Hispanic No indicatorsMulti-racial, Non-Hispanic No indicatorsR/ECAP: Mostly out of R/ECAP% of Households that are families with children: 40.1% - 80%
Assessment of Fair Housing Tool for Local Governments (LG2015)OMB Control Number: 2529-0054
29
4. Location: Hidalgo (East Coma Avenue to U.S. Border, Bridge Street and South 15th)Race/Ethnicity Intensity of Dot Density National Origin Dot DensityWhite, Non-Hispanic Minimal Mexico No dataBlack, Non-Hispanic No indicators Canada No dataNative American, Non-Hispanic
No indicators El Salvador No data
Asian/Pacific Islander, Non-Hispanic
No indicators Honduras No data
Hispanic Frequent Philippines No dataOther, Non-Hispanic No indicatorsMulti-racial, Non-Hispanic No indicatorsR/ECAP: Out of R/ECAP% of Households that are families with children: 40.1% - 60%
5. Location: South Pharr-San Juan-Alamo – (Dicker Road, Jackson Road, U.S. Border, South Alamo)Race/Ethnicity Intensity of Dot Density National Origin Dot DensityWhite, Non-Hispanic No Indicators Mexico No dataBlack, Non-Hispanic No indicators Canada No dataNative American, Non-Hispanic
No indicators El Salvador No data
Asian/Pacific Islander, Non-Hispanic
No indicators Honduras No data
Hispanic Frequent Philippines No dataOther, Non-Hispanic No indicatorsMulti-racial, Non-Hispanic No indicatorsR/ECAP: Out of R/ECAP% of Households that are families with children: 40.1% - 80%
6. Location: Alamo/Donna – (Roosevelt Road, Tower Road, Stiles/Moore Road, Mile 6-1/2 West)Race/Ethnicity Intensity of Dot Density National Origin Dot DensityWhite, Non-Hispanic Frequent Mexico FrequentBlack, Non-Hispanic No indicators Canada No indicatorsNative American, Non-Hispanic
No indicators El Salvador Minimal
Asian/Pacific Islander, Non-Hispanic
No indicators Honduras Minimal
Hispanic Concentrated Philippines No indicatorsOther, Non-Hispanic No indicatorsMulti-racial, Non-Hispanic No indicatorsR/ECAP: North section in R/ECAP; South section out of R/ECAP% of Households that are families with children: 0% - 80%
Assessment of Fair Housing Tool for Local Governments (LG2015)OMB Control Number: 2529-0054
30
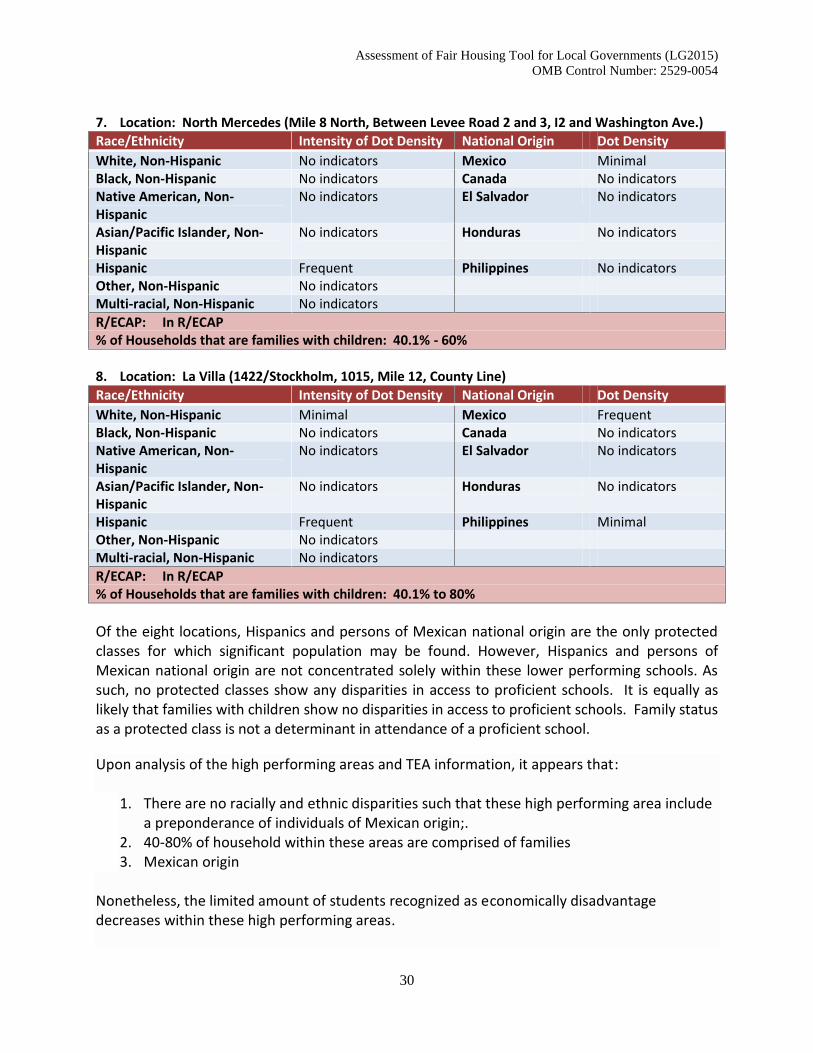
7. Location: North Mercedes (Mile 8 North, Between Levee Road 2 and 3, I2 and Washington Ave.)Race/Ethnicity Intensity of Dot Density National Origin Dot DensityWhite, Non-Hispanic No indicators Mexico MinimalBlack, Non-Hispanic No indicators Canada No indicatorsNative American, Non-Hispanic
No indicators El Salvador No indicators
Asian/Pacific Islander, Non-Hispanic
No indicators Honduras No indicators
Hispanic Frequent Philippines No indicatorsOther, Non-Hispanic No indicatorsMulti-racial, Non-Hispanic No indicatorsR/ECAP: In R/ECAP% of Households that are families with children: 40.1% - 60%
8. Location: La Villa (1422/Stockholm, 1015, Mile 12, County Line)Race/Ethnicity Intensity of Dot Density National Origin Dot DensityWhite, Non-Hispanic Minimal Mexico FrequentBlack, Non-Hispanic No indicators Canada No indicatorsNative American, Non-Hispanic
No indicators El Salvador No indicators
Asian/Pacific Islander, Non-Hispanic
No indicators Honduras No indicators
Hispanic Frequent Philippines MinimalOther, Non-Hispanic No indicatorsMulti-racial, Non-Hispanic No indicatorsR/ECAP: In R/ECAP% of Households that are families with children: 40.1% to 80%
Of the eight locations, Hispanics and persons of Mexican national origin are the only protectedclasses for which significant population may be found. However, Hispanics and persons ofMexican national origin are not concentrated solely within these lower performing schools. Assuch, no protected classes show any disparities in access to proficient schools. It is equally aslikely that families with children show no disparities in access to proficient schools. Family statusas a protected class is not a determinant in attendance of a proficient school.
Upon analysis of the high performing areas and TEA information, it appears that:
1. There are no racially and ethnic disparities such that these high performing area includea preponderance of individuals of Mexican origin;.
2. 40-80% of household within these areas are comprised of families3. Mexican origin
Nonetheless, the limited amount of students recognized as economically disadvantagedecreases within these high performing areas.
Assessment of Fair Housing Tool for Local Governments (LG2015)OMB Control Number: 2529-0054
31
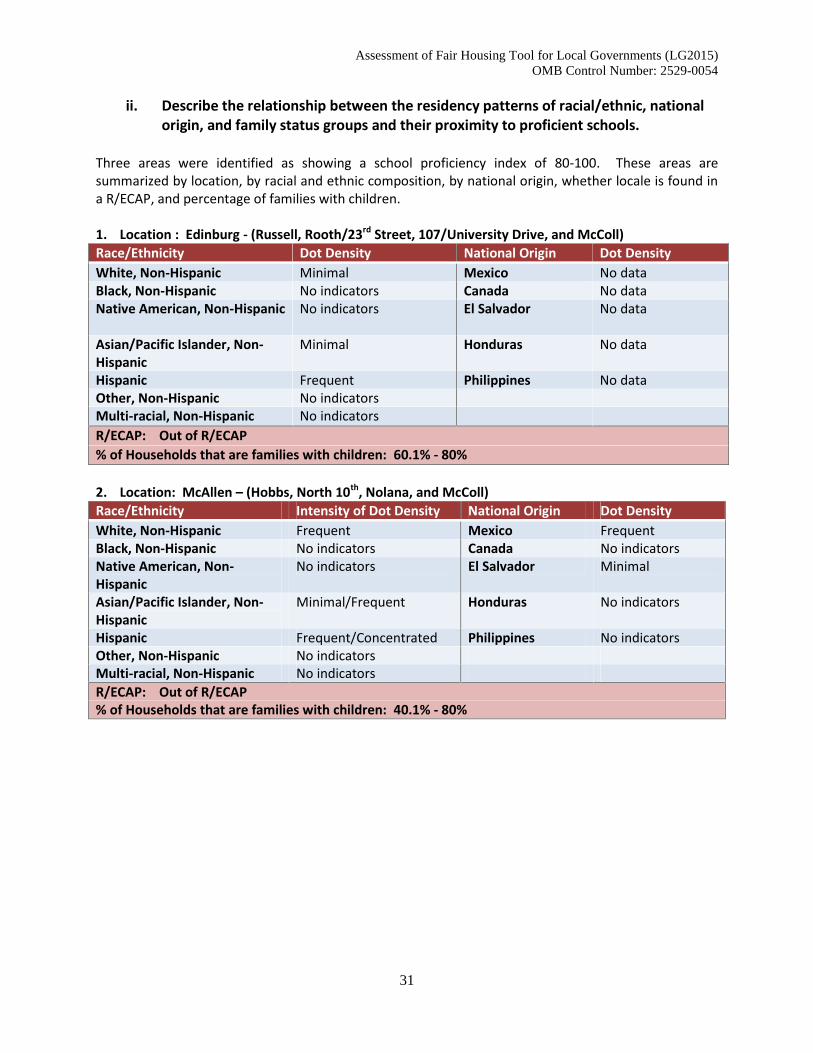
ii. Describe the relationship between the residency patterns of racial/ethnic, nationalorigin, and family status groups and their proximity to proficient schools.
Three areas were identified as showing a school proficiency index of 80-100. These areas aresummarized by location, by racial and ethnic composition, by national origin, whether locale is found ina R/ECAP, and percentage of families with children.
1. Location : Edinburg - (Russell, Rooth/23rd Street, 107/University Drive, and McColl)Race/Ethnicity Dot Density National Origin Dot DensityWhite, Non-Hispanic Minimal Mexico No dataBlack, Non-Hispanic No indicators Canada No dataNative American, Non-Hispanic No indicators El Salvador No data
Asian/Pacific Islander, Non-Hispanic
Minimal Honduras No data
Hispanic Frequent Philippines No dataOther, Non-Hispanic No indicatorsMulti-racial, Non-Hispanic No indicatorsR/ECAP: Out of R/ECAP% of Households that are families with children: 60.1% - 80%
2. Location: McAllen – (Hobbs, North 10th, Nolana, and McColl)Race/Ethnicity Intensity of Dot Density National Origin Dot DensityWhite, Non-Hispanic Frequent Mexico FrequentBlack, Non-Hispanic No indicators Canada No indicatorsNative American, Non-Hispanic
No indicators El Salvador Minimal
Asian/Pacific Islander, Non-Hispanic
Minimal/Frequent Honduras No indicators
Hispanic Frequent/Concentrated Philippines No indicatorsOther, Non-Hispanic No indicatorsMulti-racial, Non-Hispanic No indicatorsR/ECAP: Out of R/ECAP% of Households that are families with children: 40.1% - 80%
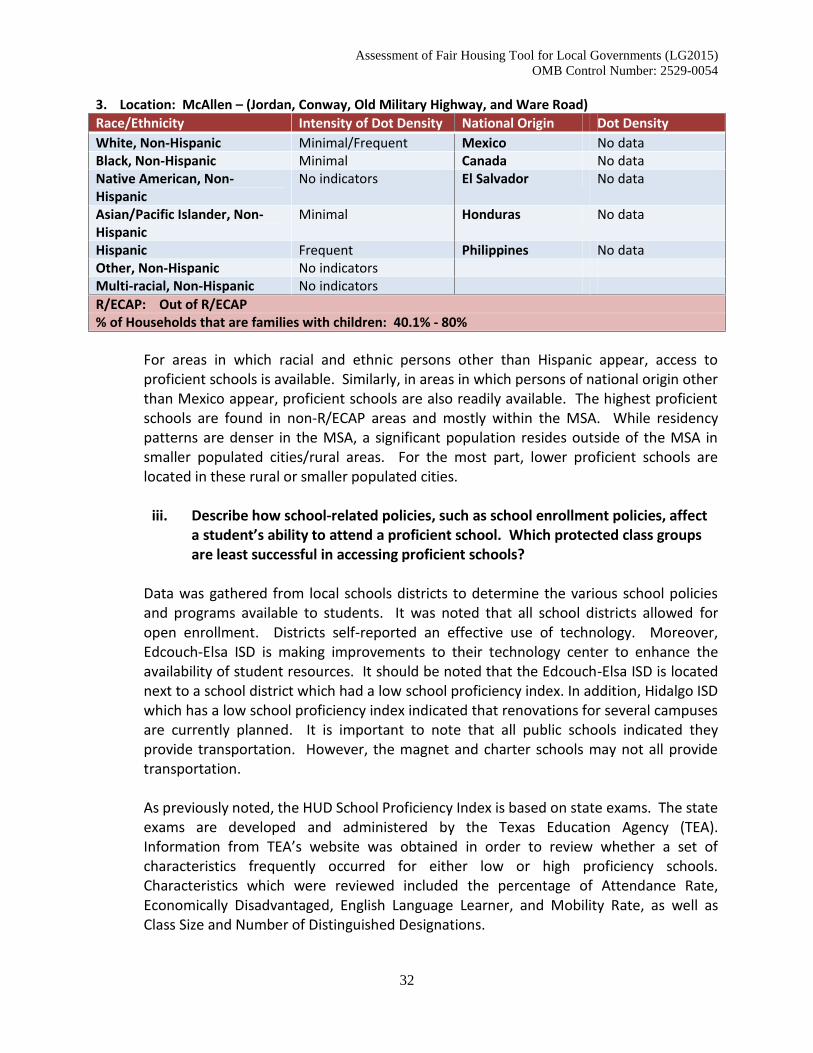
Assessment of Fair Housing Tool for Local Governments (LG2015)OMB Control Number: 2529-0054
32
3. Location: McAllen – (Jordan, Conway, Old Military Highway, and Ware Road)Race/Ethnicity Intensity of Dot Density National Origin Dot DensityWhite, Non-Hispanic Minimal/Frequent Mexico No dataBlack, Non-Hispanic Minimal Canada No dataNative American, Non-Hispanic
No indicators El Salvador No data
Asian/Pacific Islander, Non-Hispanic
Minimal Honduras No data
Hispanic Frequent Philippines No dataOther, Non-Hispanic No indicatorsMulti-racial, Non-Hispanic No indicatorsR/ECAP: Out of R/ECAP% of Households that are families with children: 40.1% - 80%
For areas in which racial and ethnic persons other than Hispanic appear, access toproficient schools is available. Similarly, in areas in which persons of national origin otherthan Mexico appear, proficient schools are also readily available. The highest proficientschools are found in non-R/ECAP areas and mostly within the MSA. While residencypatterns are denser in the MSA, a significant population resides outside of the MSA insmaller populated cities/rural areas. For the most part, lower proficient schools arelocated in these rural or smaller populated cities.
iii. Describe how school-related policies, such as school enrollment policies, affecta student’s ability to attend a proficient school. Which protected class groupsare least successful in accessing proficient schools?
Data was gathered from local schools districts to determine the various school policiesand programs available to students. It was noted that all school districts allowed foropen enrollment. Districts self-reported an effective use of technology. Moreover,Edcouch-Elsa ISD is making improvements to their technology center to enhance theavailability of student resources. It should be noted that the Edcouch-Elsa ISD is locatednext to a school district which had a low school proficiency index. In addition, Hidalgo ISDwhich has a low school proficiency index indicated that renovations for several campusesare currently planned. It is important to note that all public schools indicated theyprovide transportation. However, the magnet and charter schools may not all providetransportation.
As previously noted, the HUD School Proficiency Index is based on state exams. The stateexams are developed and administered by the Texas Education Agency (TEA).Information from TEA’s website was obtained in order to review whether a set ofcharacteristics frequently occurred for either low or high proficiency schools.Characteristics which were reviewed included the percentage of Attendance Rate,Economically Disadvantaged, English Language Learner, and Mobility Rate, as well asClass Size and Number of Distinguished Designations.
Assessment of Fair Housing Tool for Local Governments (LG2015)OMB Control Number: 2529-0054
33
b. Employment Opportunities
i. Describe any disparities in access to jobs and labor markets by protected classgroups.
HUD resources utilized for the analysis of this section include:
Table 12 – Opportunity indicators, by Race and Ethnicity – Jobs Proximity andLabor Market
Map 8 – Demographics and Job Proficiency – Jobs Proximity Index Map 8 – Demographics and Job Proficiency – Race/Ethnicity - Hispanic Map 8 – Demographics and Job Proficiency – Race/Ethnicity – Non-Hispanic Map 8 – Demographics and Job Proficiency – National Origin - Mexico Map 8 – Demographics and Job Proficiency – National Origin - Others Map 8 – Demographics and Job Proficiency - Percentage of Households that are
Families with children Map 9 – Demographics and Labor Market – Labor Market Index Map 9 – Demographics and Labor Market – Race/Ethnicity - Hispanic Map 9 – Demographics and Labor Market – Race/Ethnicity – Non-Hispanic Map 9 – Demographics and Labor Market – National Origin - Mexico Map 9 – Demographics and Labor Market – National Origin - Others Map 9 – Demographics and Labor Market - Percentage of Households that are
Families with children
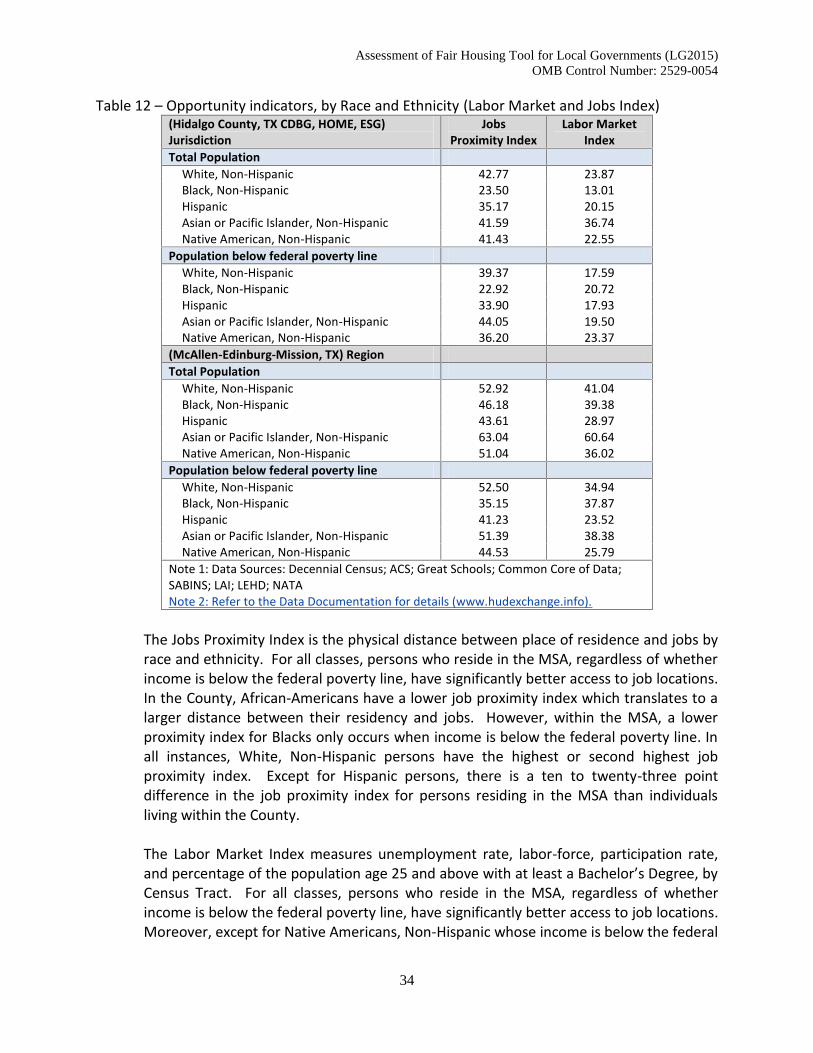
Assessment of Fair Housing Tool for Local Governments (LG2015)OMB Control Number: 2529-0054
34
Table 12 – Opportunity indicators, by Race and Ethnicity (Labor Market and Jobs Index)(Hidalgo County, TX CDBG, HOME, ESG)Jurisdiction
JobsProximity Index
Labor MarketIndex
Total PopulationWhite, Non-Hispanic 42.77 23.87Black, Non-Hispanic 23.50 13.01Hispanic 35.17 20.15Asian or Pacific Islander, Non-Hispanic 41.59 36.74Native American, Non-Hispanic 41.43 22.55
Population below federal poverty lineWhite, Non-Hispanic 39.37 17.59Black, Non-Hispanic 22.92 20.72Hispanic 33.90 17.93Asian or Pacific Islander, Non-Hispanic 44.05 19.50Native American, Non-Hispanic 36.20 23.37
(McAllen-Edinburg-Mission, TX) RegionTotal Population
White, Non-Hispanic 52.92 41.04Black, Non-Hispanic 46.18 39.38Hispanic 43.61 28.97Asian or Pacific Islander, Non-Hispanic 63.04 60.64Native American, Non-Hispanic 51.04 36.02
Population below federal poverty lineWhite, Non-Hispanic 52.50 34.94Black, Non-Hispanic 35.15 37.87Hispanic 41.23 23.52Asian or Pacific Islander, Non-Hispanic 51.39 38.38Native American, Non-Hispanic 44.53 25.79
Note 1: Data Sources: Decennial Census; ACS; Great Schools; Common Core of Data;SABINS; LAI; LEHD; NATANote 2: Refer to the Data Documentation for details (www.hudexchange.info).
The Jobs Proximity Index is the physical distance between place of residence and jobs byrace and ethnicity. For all classes, persons who reside in the MSA, regardless of whetherincome is below the federal poverty line, have significantly better access to job locations.In the County, African-Americans have a lower job proximity index which translates to alarger distance between their residency and jobs. However, within the MSA, a lowerproximity index for Blacks only occurs when income is below the federal poverty line. Inall instances, White, Non-Hispanic persons have the highest or second highest jobproximity index. Except for Hispanic persons, there is a ten to twenty-three pointdifference in the job proximity index for persons residing in the MSA than individualsliving within the County.
The Labor Market Index measures unemployment rate, labor-force, participation rate,and percentage of the population age 25 and above with at least a Bachelor’s Degree, byCensus Tract. For all classes, persons who reside in the MSA, regardless of whetherincome is below the federal poverty line, have significantly better access to job locations.Moreover, except for Native Americans, Non-Hispanic whose income is below the federal
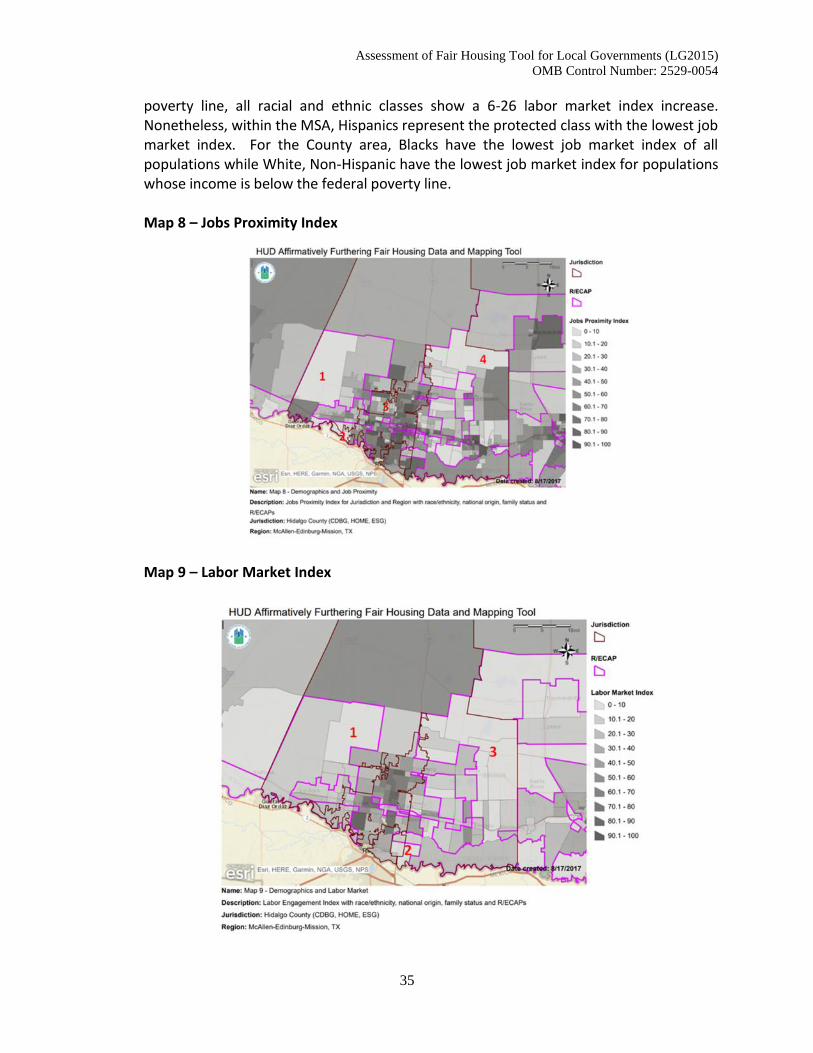
Assessment of Fair Housing Tool for Local Governments (LG2015)OMB Control Number: 2529-0054
35
poverty line, all racial and ethnic classes show a 6-26 labor market index increase.Nonetheless, within the MSA, Hispanics represent the protected class with the lowest jobmarket index. For the County area, Blacks have the lowest job market index of allpopulations while White, Non-Hispanic have the lowest job market index for populationswhose income is below the federal poverty line.
Map 8 – Jobs Proximity Index
Map 9 – Labor Market Index
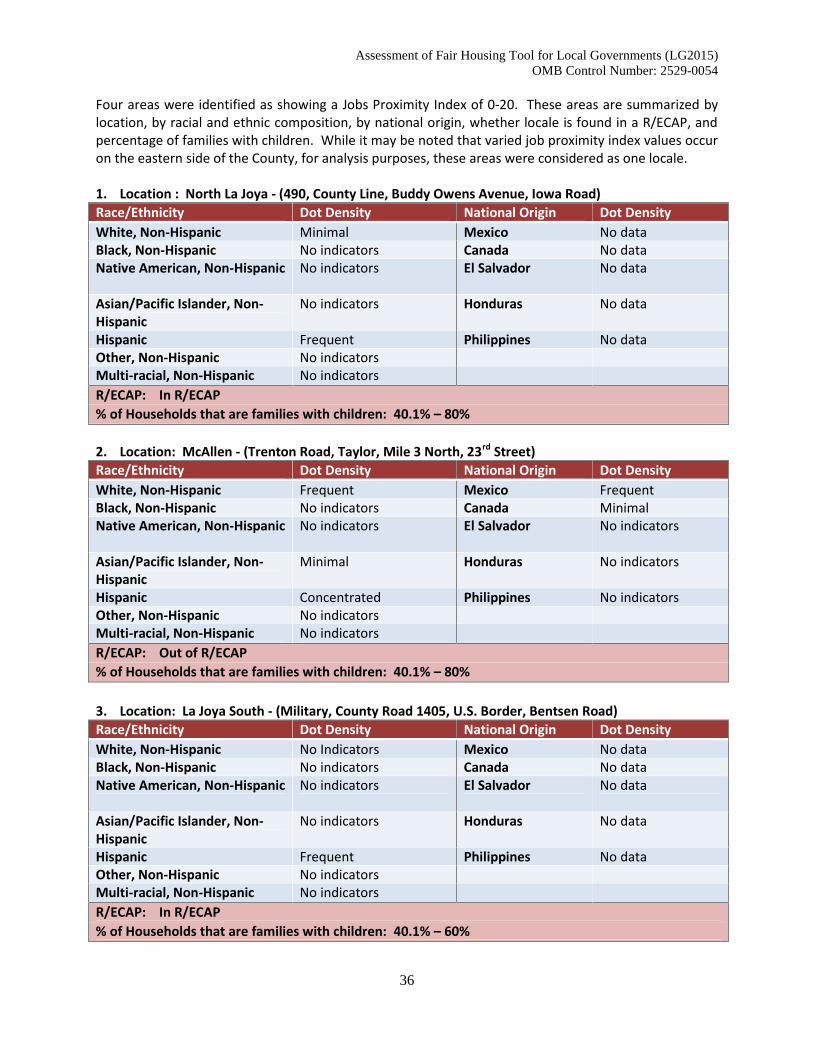
Assessment of Fair Housing Tool for Local Governments (LG2015)OMB Control Number: 2529-0054
36
Four areas were identified as showing a Jobs Proximity Index of 0-20. These areas are summarized bylocation, by racial and ethnic composition, by national origin, whether locale is found in a R/ECAP, andpercentage of families with children. While it may be noted that varied job proximity index values occuron the eastern side of the County, for analysis purposes, these areas were considered as one locale.
1. Location : North La Joya - (490, County Line, Buddy Owens Avenue, Iowa Road)Race/Ethnicity Dot Density National Origin Dot DensityWhite, Non-Hispanic Minimal Mexico No dataBlack, Non-Hispanic No indicators Canada No dataNative American, Non-Hispanic No indicators El Salvador No data
Asian/Pacific Islander, Non-Hispanic
No indicators Honduras No data
Hispanic Frequent Philippines No dataOther, Non-Hispanic No indicatorsMulti-racial, Non-Hispanic No indicatorsR/ECAP: In R/ECAP% of Households that are families with children: 40.1% – 80%
2. Location: McAllen - (Trenton Road, Taylor, Mile 3 North, 23rd Street)Race/Ethnicity Dot Density National Origin Dot DensityWhite, Non-Hispanic Frequent Mexico FrequentBlack, Non-Hispanic No indicators Canada MinimalNative American, Non-Hispanic No indicators El Salvador No indicators
Asian/Pacific Islander, Non-Hispanic
Minimal Honduras No indicators
Hispanic Concentrated Philippines No indicatorsOther, Non-Hispanic No indicatorsMulti-racial, Non-Hispanic No indicatorsR/ECAP: Out of R/ECAP% of Households that are families with children: 40.1% – 80%
3. Location: La Joya South - (Military, County Road 1405, U.S. Border, Bentsen Road)Race/Ethnicity Dot Density National Origin Dot DensityWhite, Non-Hispanic No Indicators Mexico No dataBlack, Non-Hispanic No indicators Canada No dataNative American, Non-Hispanic No indicators El Salvador No data
Asian/Pacific Islander, Non-Hispanic
No indicators Honduras No data
Hispanic Frequent Philippines No dataOther, Non-Hispanic No indicatorsMulti-racial, Non-Hispanic No indicatorsR/ECAP: In R/ECAP% of Households that are families with children: 40.1% – 60%
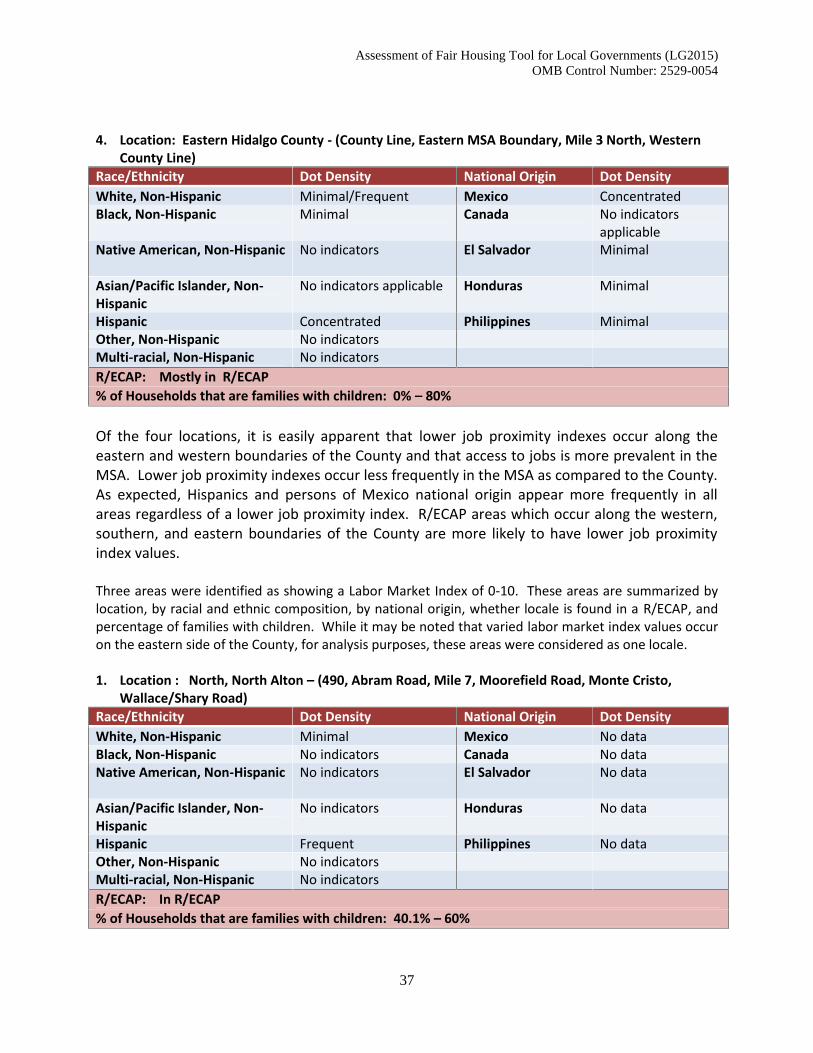
Assessment of Fair Housing Tool for Local Governments (LG2015)OMB Control Number: 2529-0054
37
4. Location: Eastern Hidalgo County - (County Line, Eastern MSA Boundary, Mile 3 North, WesternCounty Line)
Race/Ethnicity Dot Density National Origin Dot DensityWhite, Non-Hispanic Minimal/Frequent Mexico ConcentratedBlack, Non-Hispanic Minimal Canada No indicators
applicableNative American, Non-Hispanic No indicators El Salvador Minimal
Asian/Pacific Islander, Non-Hispanic
No indicators applicable Honduras Minimal
Hispanic Concentrated Philippines MinimalOther, Non-Hispanic No indicatorsMulti-racial, Non-Hispanic No indicatorsR/ECAP: Mostly in R/ECAP% of Households that are families with children: 0% – 80%
Of the four locations, it is easily apparent that lower job proximity indexes occur along theeastern and western boundaries of the County and that access to jobs is more prevalent in theMSA. Lower job proximity indexes occur less frequently in the MSA as compared to the County.As expected, Hispanics and persons of Mexico national origin appear more frequently in allareas regardless of a lower job proximity index. R/ECAP areas which occur along the western,southern, and eastern boundaries of the County are more likely to have lower job proximityindex values.
Three areas were identified as showing a Labor Market Index of 0-10. These areas are summarized bylocation, by racial and ethnic composition, by national origin, whether locale is found in a R/ECAP, andpercentage of families with children. While it may be noted that varied labor market index values occuron the eastern side of the County, for analysis purposes, these areas were considered as one locale.
1. Location : North, North Alton – (490, Abram Road, Mile 7, Moorefield Road, Monte Cristo,Wallace/Shary Road)
Race/Ethnicity Dot Density National Origin Dot DensityWhite, Non-Hispanic Minimal Mexico No dataBlack, Non-Hispanic No indicators Canada No dataNative American, Non-Hispanic No indicators El Salvador No data
Asian/Pacific Islander, Non-Hispanic
No indicators Honduras No data
Hispanic Frequent Philippines No dataOther, Non-Hispanic No indicatorsMulti-racial, Non-Hispanic No indicatorsR/ECAP: In R/ECAP% of Households that are families with children: 40.1% – 60%
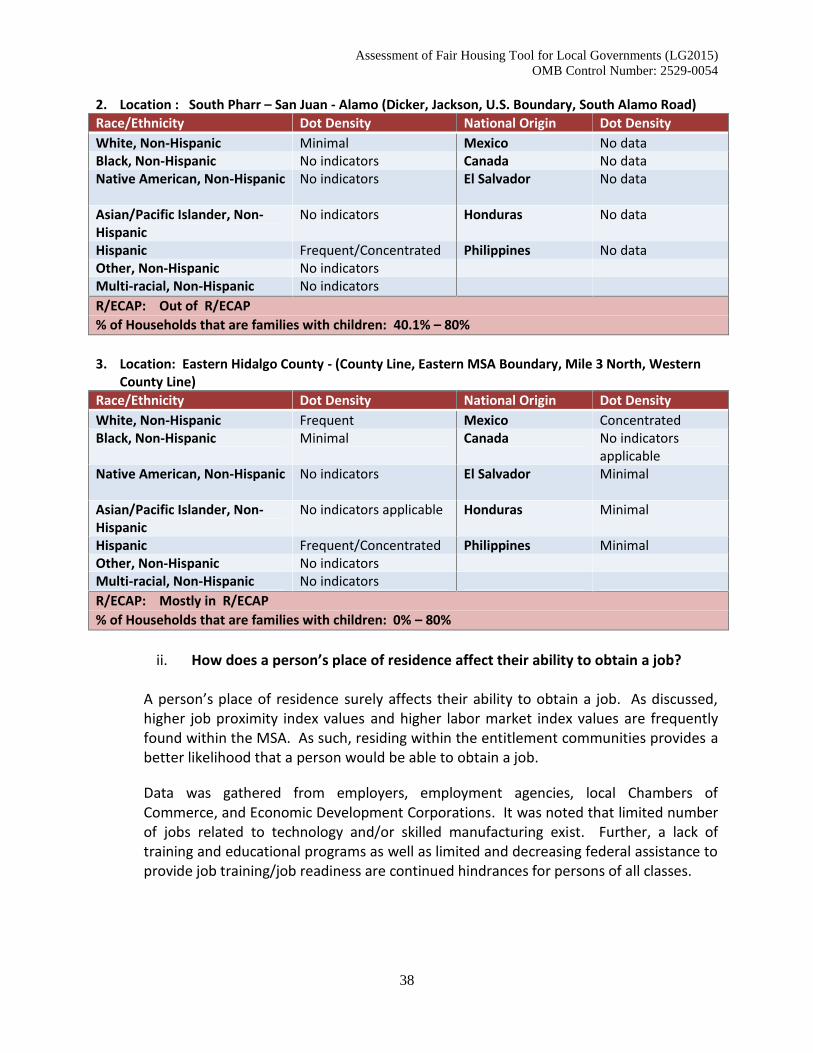
Assessment of Fair Housing Tool for Local Governments (LG2015)OMB Control Number: 2529-0054
38
2. Location : South Pharr – San Juan - Alamo (Dicker, Jackson, U.S. Boundary, South Alamo Road)Race/Ethnicity Dot Density National Origin Dot DensityWhite, Non-Hispanic Minimal Mexico No dataBlack, Non-Hispanic No indicators Canada No dataNative American, Non-Hispanic No indicators El Salvador No data
Asian/Pacific Islander, Non-Hispanic
No indicators Honduras No data
Hispanic Frequent/Concentrated Philippines No dataOther, Non-Hispanic No indicatorsMulti-racial, Non-Hispanic No indicatorsR/ECAP: Out of R/ECAP% of Households that are families with children: 40.1% – 80%
3. Location: Eastern Hidalgo County - (County Line, Eastern MSA Boundary, Mile 3 North, WesternCounty Line)
Race/Ethnicity Dot Density National Origin Dot DensityWhite, Non-Hispanic Frequent Mexico ConcentratedBlack, Non-Hispanic Minimal Canada No indicators
applicableNative American, Non-Hispanic No indicators El Salvador Minimal
Asian/Pacific Islander, Non-Hispanic
No indicators applicable Honduras Minimal
Hispanic Frequent/Concentrated Philippines MinimalOther, Non-Hispanic No indicatorsMulti-racial, Non-Hispanic No indicatorsR/ECAP: Mostly in R/ECAP% of Households that are families with children: 0% – 80%
ii. How does a person’s place of residence affect their ability to obtain a job?
A person’s place of residence surely affects their ability to obtain a job. As discussed,higher job proximity index values and higher labor market index values are frequentlyfound within the MSA. As such, residing within the entitlement communities provides abetter likelihood that a person would be able to obtain a job.
Data was gathered from employers, employment agencies, local Chambers ofCommerce, and Economic Development Corporations. It was noted that limited numberof jobs related to technology and/or skilled manufacturing exist. Further, a lack oftraining and educational programs as well as limited and decreasing federal assistance toprovide job training/job readiness are continued hindrances for persons of all classes.
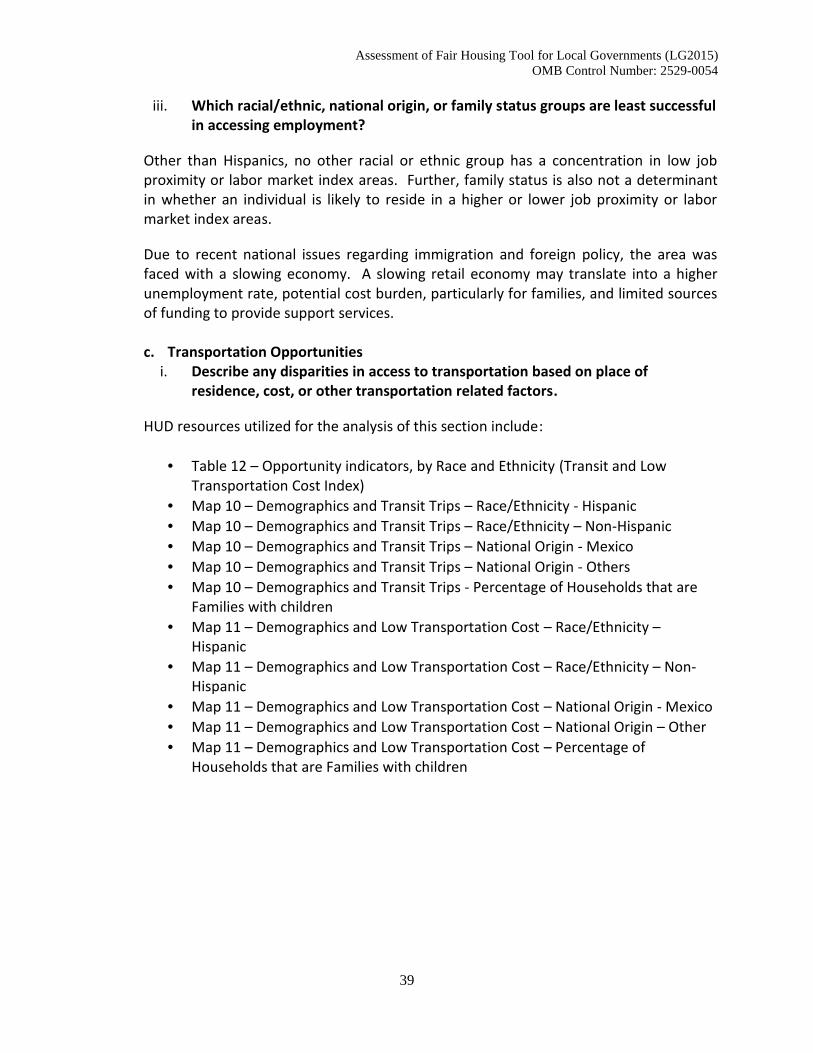
Assessment of Fair Housing Tool for Local Governments (LG2015)OMB Control Number: 2529-0054
39
iii. Which racial/ethnic, national origin, or family status groups are least successfulin accessing employment?
Other than Hispanics, no other racial or ethnic group has a concentration in low jobproximity or labor market index areas. Further, family status is also not a determinantin whether an individual is likely to reside in a higher or lower job proximity or labormarket index areas.
Due to recent national issues regarding immigration and foreign policy, the area wasfaced with a slowing economy. A slowing retail economy may translate into a higherunemployment rate, potential cost burden, particularly for families, and limited sourcesof funding to provide support services.
c. Transportation Opportunitiesi. Describe any disparities in access to transportation based on place of
residence, cost, or other transportation related factors.
HUD resources utilized for the analysis of this section include:
Table 12 – Opportunity indicators, by Race and Ethnicity (Transit and LowTransportation Cost Index)
Map 10 – Demographics and Transit Trips – Race/Ethnicity - Hispanic Map 10 – Demographics and Transit Trips – Race/Ethnicity – Non-Hispanic Map 10 – Demographics and Transit Trips – National Origin - Mexico Map 10 – Demographics and Transit Trips – National Origin - Others Map 10 – Demographics and Transit Trips - Percentage of Households that are
Families with children Map 11 – Demographics and Low Transportation Cost – Race/Ethnicity –
Hispanic Map 11 – Demographics and Low Transportation Cost – Race/Ethnicity – Non-
Hispanic Map 11 – Demographics and Low Transportation Cost – National Origin - Mexico Map 11 – Demographics and Low Transportation Cost – National Origin – Other Map 11 – Demographics and Low Transportation Cost – Percentage of
Households that are Families with children
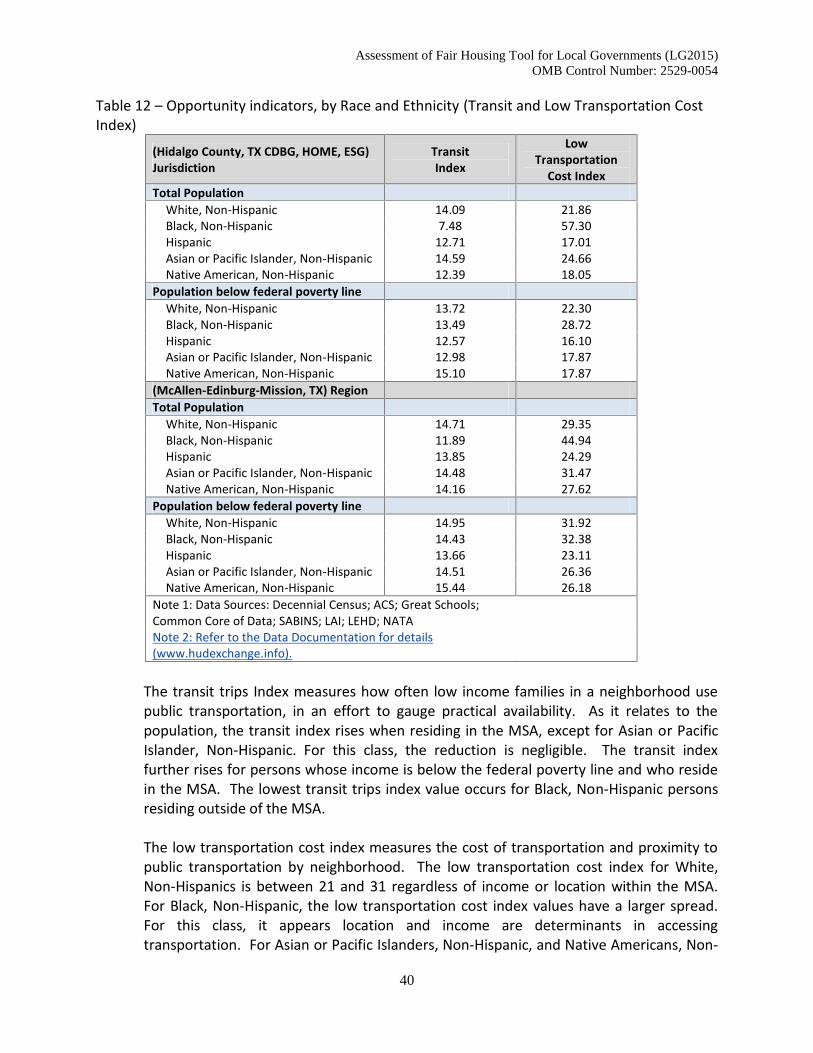
Assessment of Fair Housing Tool for Local Governments (LG2015)OMB Control Number: 2529-0054
40
Table 12 – Opportunity indicators, by Race and Ethnicity (Transit and Low Transportation CostIndex)
(Hidalgo County, TX CDBG, HOME, ESG)Jurisdiction
TransitIndex
LowTransportation
Cost IndexTotal Population
White, Non-Hispanic 14.09 21.86Black, Non-Hispanic 7.48 57.30Hispanic 12.71 17.01Asian or Pacific Islander, Non-Hispanic 14.59 24.66Native American, Non-Hispanic 12.39 18.05
Population below federal poverty lineWhite, Non-Hispanic 13.72 22.30Black, Non-Hispanic 13.49 28.72Hispanic 12.57 16.10Asian or Pacific Islander, Non-Hispanic 12.98 17.87Native American, Non-Hispanic 15.10 17.87
(McAllen-Edinburg-Mission, TX) RegionTotal Population
White, Non-Hispanic 14.71 29.35Black, Non-Hispanic 11.89 44.94Hispanic 13.85 24.29Asian or Pacific Islander, Non-Hispanic 14.48 31.47Native American, Non-Hispanic 14.16 27.62
Population below federal poverty lineWhite, Non-Hispanic 14.95 31.92Black, Non-Hispanic 14.43 32.38Hispanic 13.66 23.11Asian or Pacific Islander, Non-Hispanic 14.51 26.36Native American, Non-Hispanic 15.44 26.18
Note 1: Data Sources: Decennial Census; ACS; Great Schools;Common Core of Data; SABINS; LAI; LEHD; NATANote 2: Refer to the Data Documentation for details(www.hudexchange.info).
The transit trips Index measures how often low income families in a neighborhood usepublic transportation, in an effort to gauge practical availability. As it relates to thepopulation, the transit index rises when residing in the MSA, except for Asian or PacificIslander, Non-Hispanic. For this class, the reduction is negligible. The transit indexfurther rises for persons whose income is below the federal poverty line and who residein the MSA. The lowest transit trips index value occurs for Black, Non-Hispanic personsresiding outside of the MSA.
The low transportation cost index measures the cost of transportation and proximity topublic transportation by neighborhood. The low transportation cost index for White,Non-Hispanics is between 21 and 31 regardless of income or location within the MSA.For Black, Non-Hispanic, the low transportation cost index values have a larger spread.For this class, it appears location and income are determinants in accessingtransportation. For Asian or Pacific Islanders, Non-Hispanic, and Native Americans, Non-
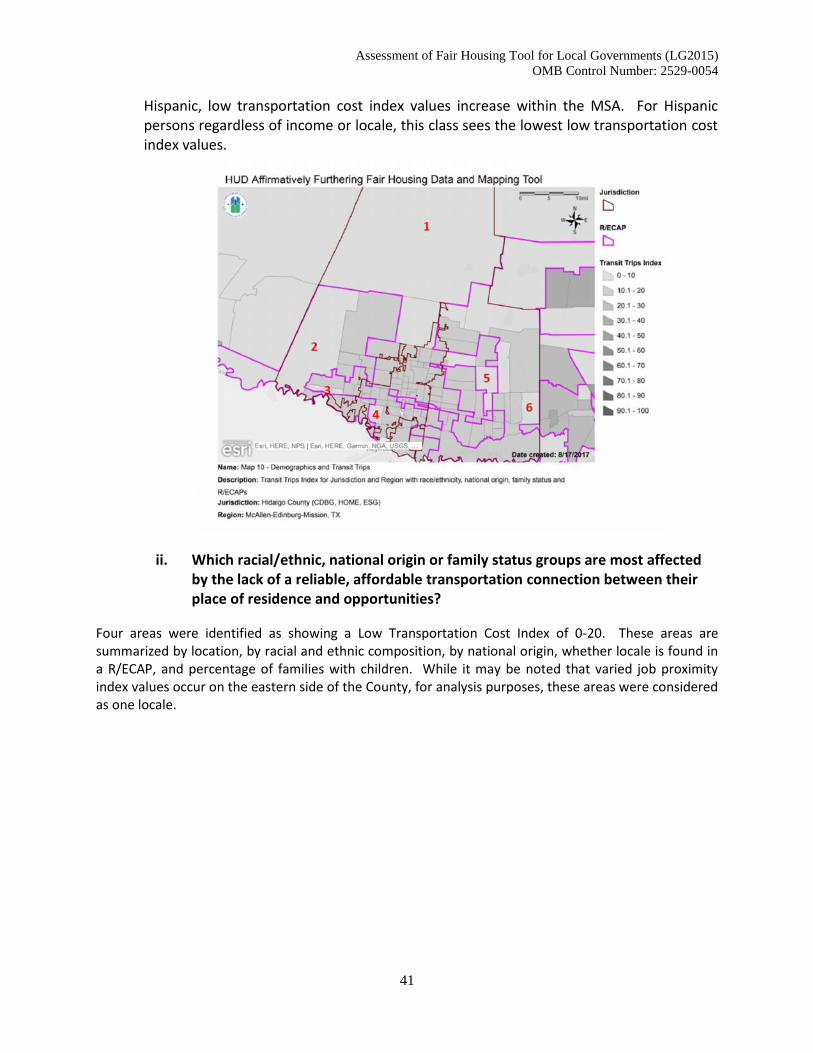
Assessment of Fair Housing Tool for Local Governments (LG2015)OMB Control Number: 2529-0054
41
Hispanic, low transportation cost index values increase within the MSA. For Hispanicpersons regardless of income or locale, this class sees the lowest low transportation costindex values.
ii. Which racial/ethnic, national origin or family status groups are most affectedby the lack of a reliable, affordable transportation connection between theirplace of residence and opportunities?
Four areas were identified as showing a Low Transportation Cost Index of 0-20. These areas aresummarized by location, by racial and ethnic composition, by national origin, whether locale is found ina R/ECAP, and percentage of families with children. While it may be noted that varied job proximityindex values occur on the eastern side of the County, for analysis purposes, these areas were consideredas one locale.
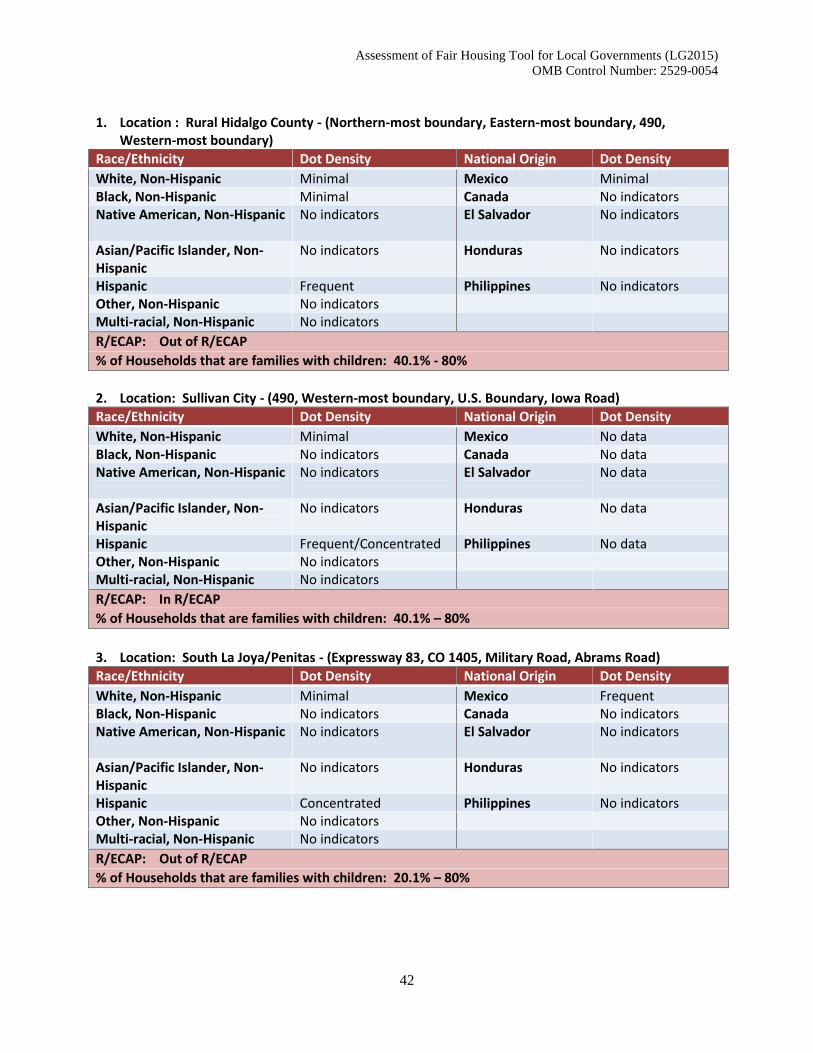
Assessment of Fair Housing Tool for Local Governments (LG2015)OMB Control Number: 2529-0054
42
1. Location : Rural Hidalgo County - (Northern-most boundary, Eastern-most boundary, 490,Western-most boundary)
Race/Ethnicity Dot Density National Origin Dot DensityWhite, Non-Hispanic Minimal Mexico MinimalBlack, Non-Hispanic Minimal Canada No indicatorsNative American, Non-Hispanic No indicators El Salvador No indicators
Asian/Pacific Islander, Non-Hispanic
No indicators Honduras No indicators
Hispanic Frequent Philippines No indicatorsOther, Non-Hispanic No indicatorsMulti-racial, Non-Hispanic No indicatorsR/ECAP: Out of R/ECAP% of Households that are families with children: 40.1% - 80%
2. Location: Sullivan City - (490, Western-most boundary, U.S. Boundary, Iowa Road)Race/Ethnicity Dot Density National Origin Dot DensityWhite, Non-Hispanic Minimal Mexico No dataBlack, Non-Hispanic No indicators Canada No dataNative American, Non-Hispanic No indicators El Salvador No data
Asian/Pacific Islander, Non-Hispanic
No indicators Honduras No data
Hispanic Frequent/Concentrated Philippines No dataOther, Non-Hispanic No indicatorsMulti-racial, Non-Hispanic No indicatorsR/ECAP: In R/ECAP% of Households that are families with children: 40.1% – 80%
3. Location: South La Joya/Penitas - (Expressway 83, CO 1405, Military Road, Abrams Road)Race/Ethnicity Dot Density National Origin Dot DensityWhite, Non-Hispanic Minimal Mexico FrequentBlack, Non-Hispanic No indicators Canada No indicatorsNative American, Non-Hispanic No indicators El Salvador No indicators
Asian/Pacific Islander, Non-Hispanic
No indicators Honduras No indicators
Hispanic Concentrated Philippines No indicatorsOther, Non-Hispanic No indicatorsMulti-racial, Non-Hispanic No indicatorsR/ECAP: Out of R/ECAP% of Households that are families with children: 20.1% – 80%
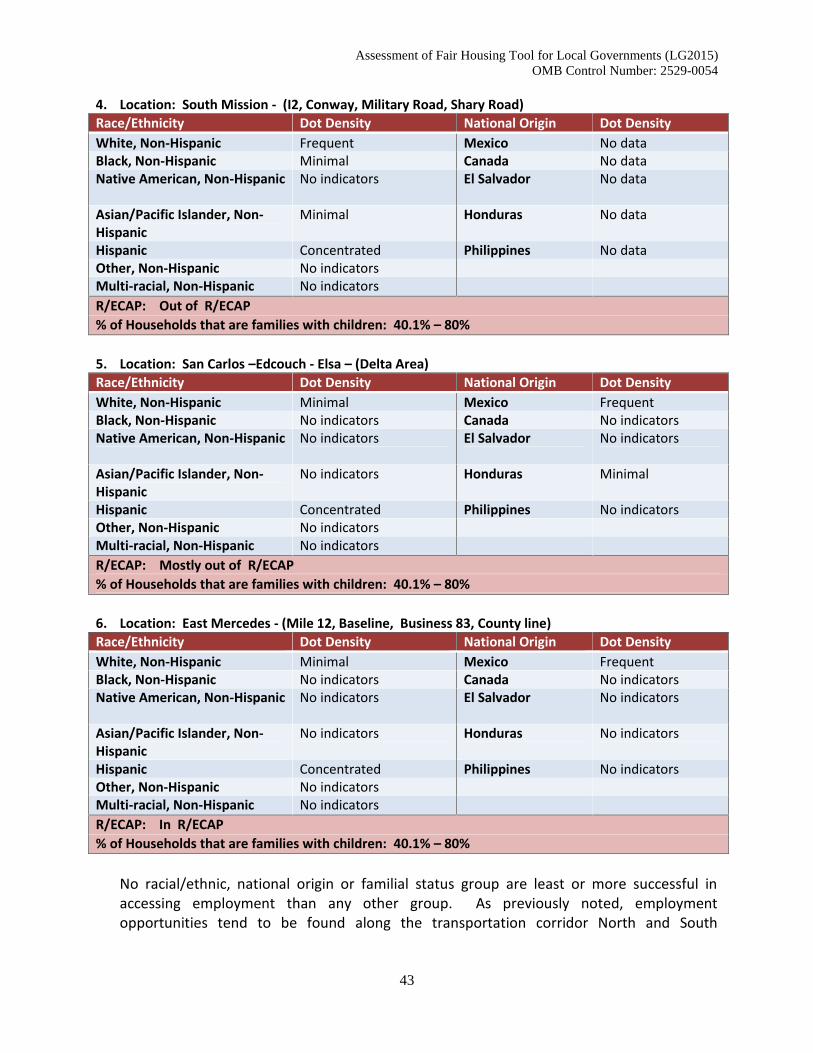
Assessment of Fair Housing Tool for Local Governments (LG2015)OMB Control Number: 2529-0054
43
4. Location: South Mission - (I2, Conway, Military Road, Shary Road)Race/Ethnicity Dot Density National Origin Dot DensityWhite, Non-Hispanic Frequent Mexico No dataBlack, Non-Hispanic Minimal Canada No dataNative American, Non-Hispanic No indicators El Salvador No data
Asian/Pacific Islander, Non-Hispanic
Minimal Honduras No data
Hispanic Concentrated Philippines No dataOther, Non-Hispanic No indicatorsMulti-racial, Non-Hispanic No indicatorsR/ECAP: Out of R/ECAP% of Households that are families with children: 40.1% – 80%
5. Location: San Carlos –Edcouch - Elsa – (Delta Area)Race/Ethnicity Dot Density National Origin Dot DensityWhite, Non-Hispanic Minimal Mexico FrequentBlack, Non-Hispanic No indicators Canada No indicatorsNative American, Non-Hispanic No indicators El Salvador No indicators
Asian/Pacific Islander, Non-Hispanic
No indicators Honduras Minimal
Hispanic Concentrated Philippines No indicatorsOther, Non-Hispanic No indicatorsMulti-racial, Non-Hispanic No indicatorsR/ECAP: Mostly out of R/ECAP% of Households that are families with children: 40.1% – 80%
6. Location: East Mercedes - (Mile 12, Baseline, Business 83, County line)Race/Ethnicity Dot Density National Origin Dot DensityWhite, Non-Hispanic Minimal Mexico FrequentBlack, Non-Hispanic No indicators Canada No indicatorsNative American, Non-Hispanic No indicators El Salvador No indicators
Asian/Pacific Islander, Non-Hispanic
No indicators Honduras No indicators
Hispanic Concentrated Philippines No indicatorsOther, Non-Hispanic No indicatorsMulti-racial, Non-Hispanic No indicatorsR/ECAP: In R/ECAP% of Households that are families with children: 40.1% – 80%
No racial/ethnic, national origin or familial status group are least or more successful inaccessing employment than any other group. As previously noted, employmentopportunities tend to be found along the transportation corridor North and South
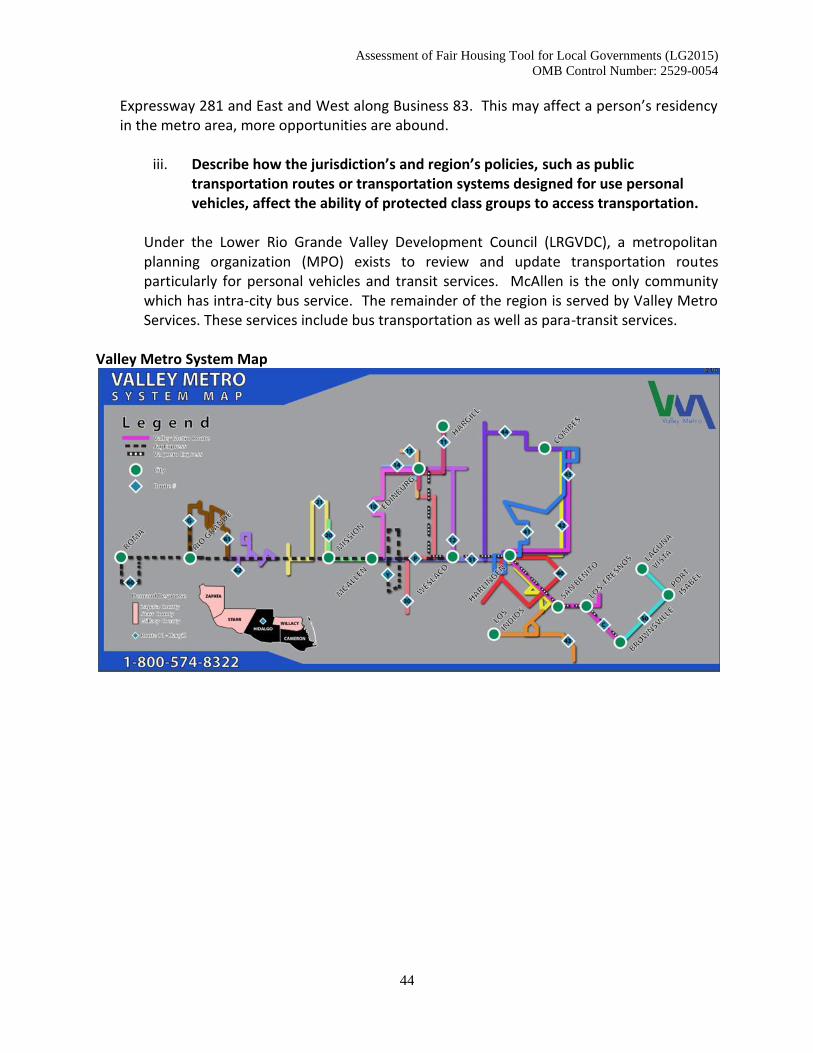
Assessment of Fair Housing Tool for Local Governments (LG2015)OMB Control Number: 2529-0054
44
Expressway 281 and East and West along Business 83. This may affect a person’s residencyin the metro area, more opportunities are abound.
iii. Describe how the jurisdiction’s and region’s policies, such as publictransportation routes or transportation systems designed for use personalvehicles, affect the ability of protected class groups to access transportation.
Under the Lower Rio Grande Valley Development Council (LRGVDC), a metropolitanplanning organization (MPO) exists to review and update transportation routesparticularly for personal vehicles and transit services. McAllen is the only communitywhich has intra-city bus service. The remainder of the region is served by Valley MetroServices. These services include bus transportation as well as para-transit services.
Valley Metro System Map
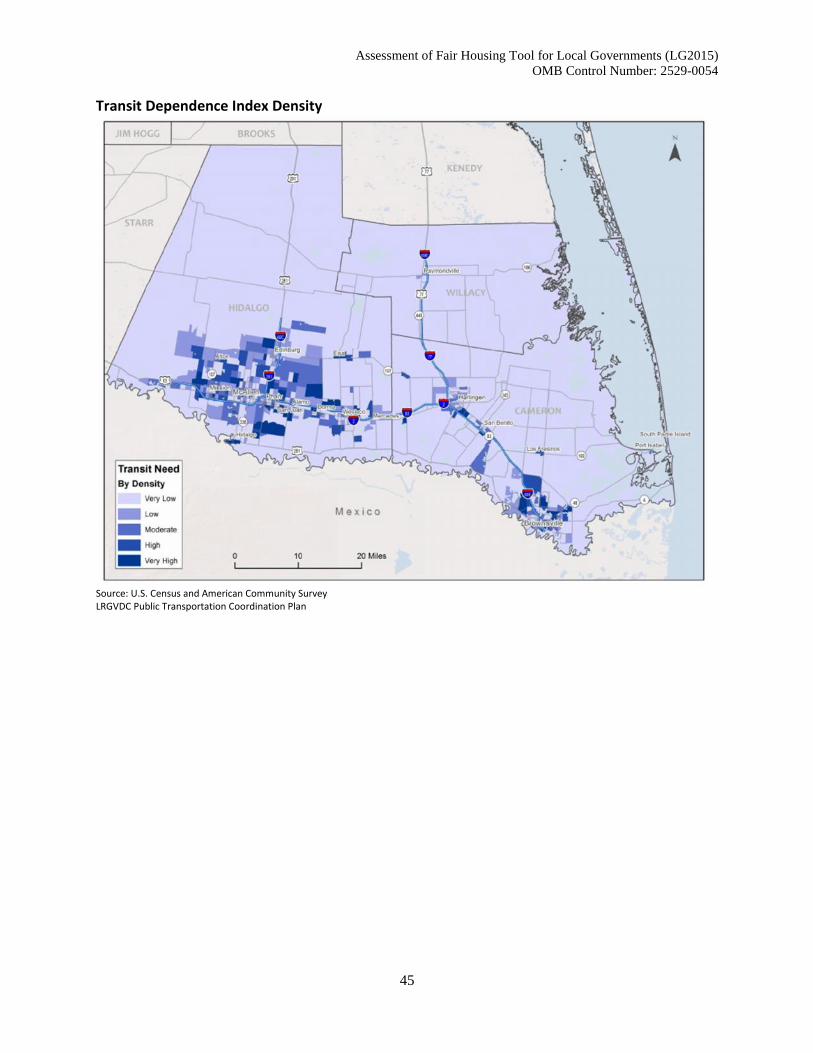
Assessment of Fair Housing Tool for Local Governments (LG2015)OMB Control Number: 2529-0054
45
Transit Dependence Index Density
Source: U.S. Census and American Community SurveyLRGVDC Public Transportation Coordination Plan
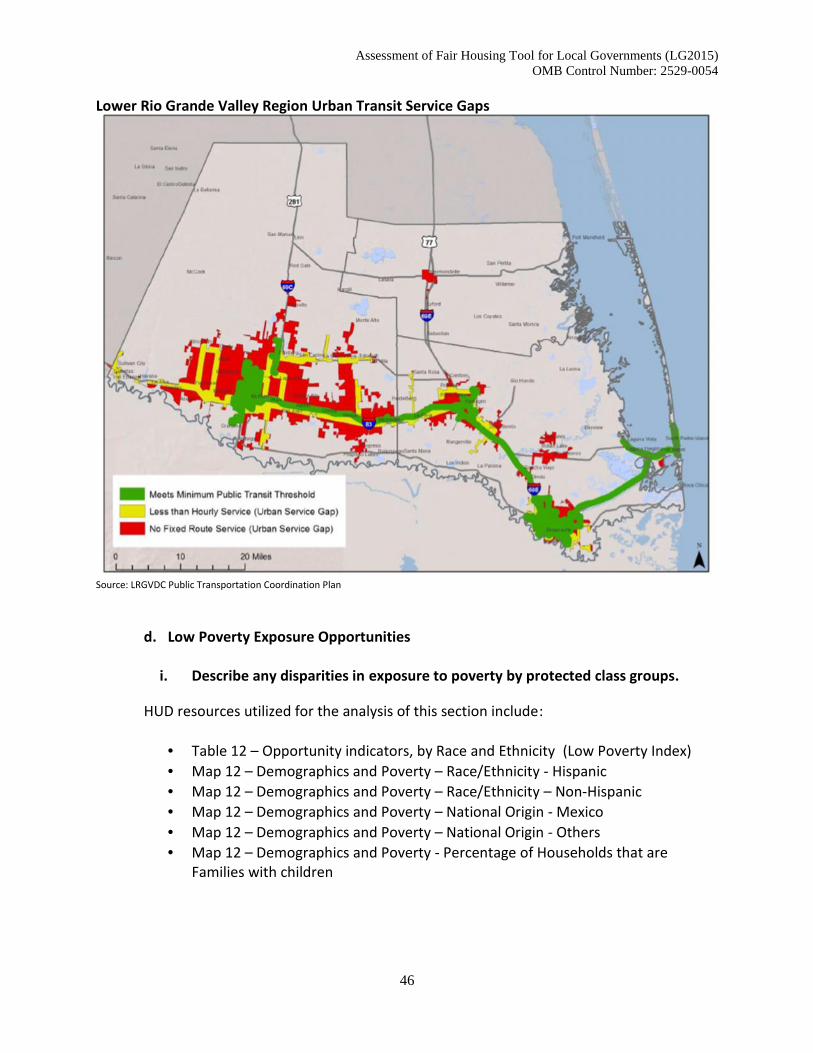
Assessment of Fair Housing Tool for Local Governments (LG2015)OMB Control Number: 2529-0054
46
Lower Rio Grande Valley Region Urban Transit Service Gaps
Source: LRGVDC Public Transportation Coordination Plan
d. Low Poverty Exposure Opportunities
i. Describe any disparities in exposure to poverty by protected class groups.
HUD resources utilized for the analysis of this section include:
Table 12 – Opportunity indicators, by Race and Ethnicity (Low Poverty Index) Map 12 – Demographics and Poverty – Race/Ethnicity - Hispanic Map 12 – Demographics and Poverty – Race/Ethnicity – Non-Hispanic Map 12 – Demographics and Poverty – National Origin - Mexico Map 12 – Demographics and Poverty – National Origin - Others Map 12 – Demographics and Poverty - Percentage of Households that are
Families with children
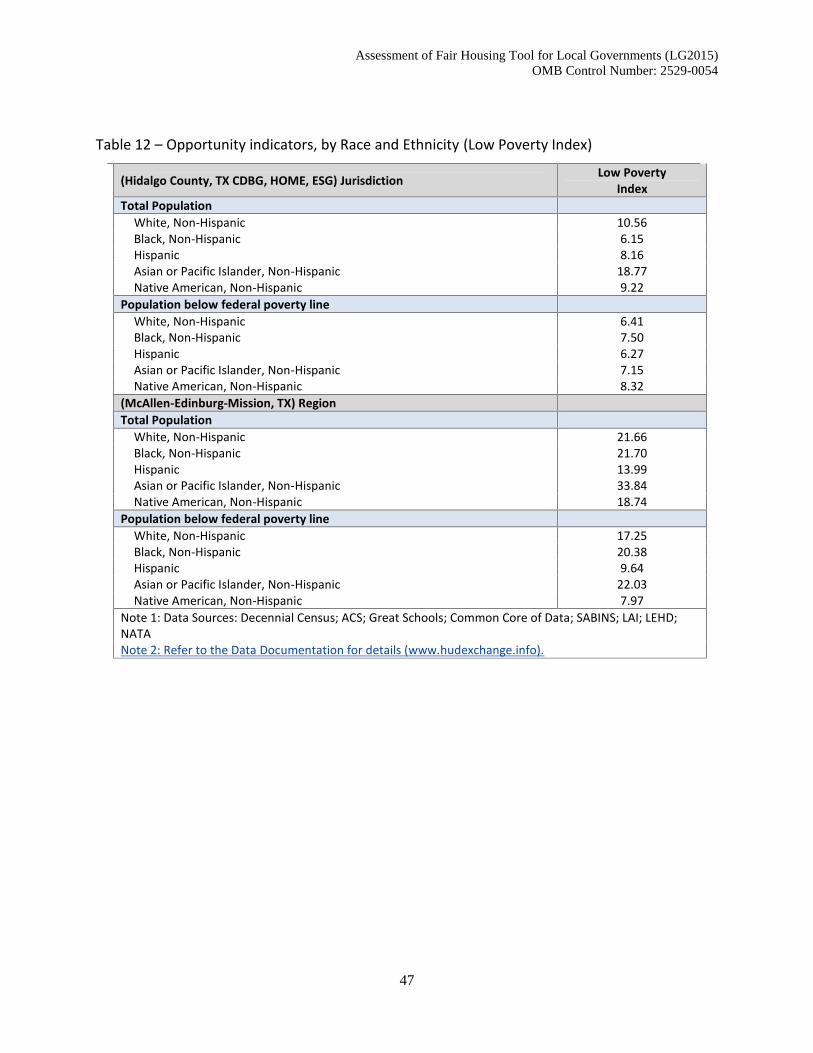
Assessment of Fair Housing Tool for Local Governments (LG2015)OMB Control Number: 2529-0054
47
Table 12 – Opportunity indicators, by Race and Ethnicity (Low Poverty Index)
(Hidalgo County, TX CDBG, HOME, ESG) Jurisdiction Low PovertyIndex
Total PopulationWhite, Non-Hispanic 10.56Black, Non-Hispanic 6.15Hispanic 8.16Asian or Pacific Islander, Non-Hispanic 18.77Native American, Non-Hispanic 9.22
Population below federal poverty lineWhite, Non-Hispanic 6.41Black, Non-Hispanic 7.50Hispanic 6.27Asian or Pacific Islander, Non-Hispanic 7.15Native American, Non-Hispanic 8.32
(McAllen-Edinburg-Mission, TX) RegionTotal Population
White, Non-Hispanic 21.66Black, Non-Hispanic 21.70Hispanic 13.99Asian or Pacific Islander, Non-Hispanic 33.84Native American, Non-Hispanic 18.74
Population below federal poverty lineWhite, Non-Hispanic 17.25Black, Non-Hispanic 20.38Hispanic 9.64Asian or Pacific Islander, Non-Hispanic 22.03Native American, Non-Hispanic 7.97
Note 1: Data Sources: Decennial Census; ACS; Great Schools; Common Core of Data; SABINS; LAI; LEHD;NATANote 2: Refer to the Data Documentation for details (www.hudexchange.info).
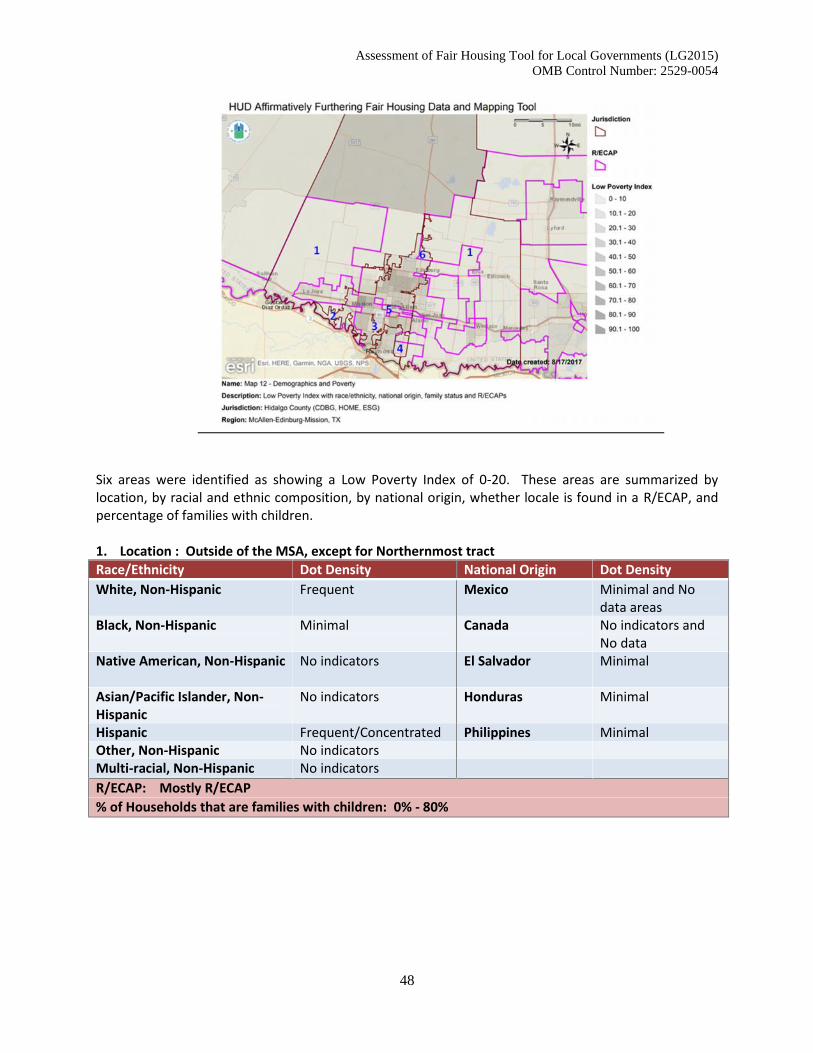
Assessment of Fair Housing Tool for Local Governments (LG2015)OMB Control Number: 2529-0054
48
Six areas were identified as showing a Low Poverty Index of 0-20. These areas are summarized bylocation, by racial and ethnic composition, by national origin, whether locale is found in a R/ECAP, andpercentage of families with children.
1. Location : Outside of the MSA, except for Northernmost tractRace/Ethnicity Dot Density National Origin Dot DensityWhite, Non-Hispanic Frequent Mexico Minimal and No
data areasBlack, Non-Hispanic Minimal Canada No indicators and
No dataNative American, Non-Hispanic No indicators El Salvador Minimal
Asian/Pacific Islander, Non-Hispanic
No indicators Honduras Minimal
Hispanic Frequent/Concentrated Philippines MinimalOther, Non-Hispanic No indicatorsMulti-racial, Non-Hispanic No indicatorsR/ECAP: Mostly R/ECAP% of Households that are families with children: 0% - 80%
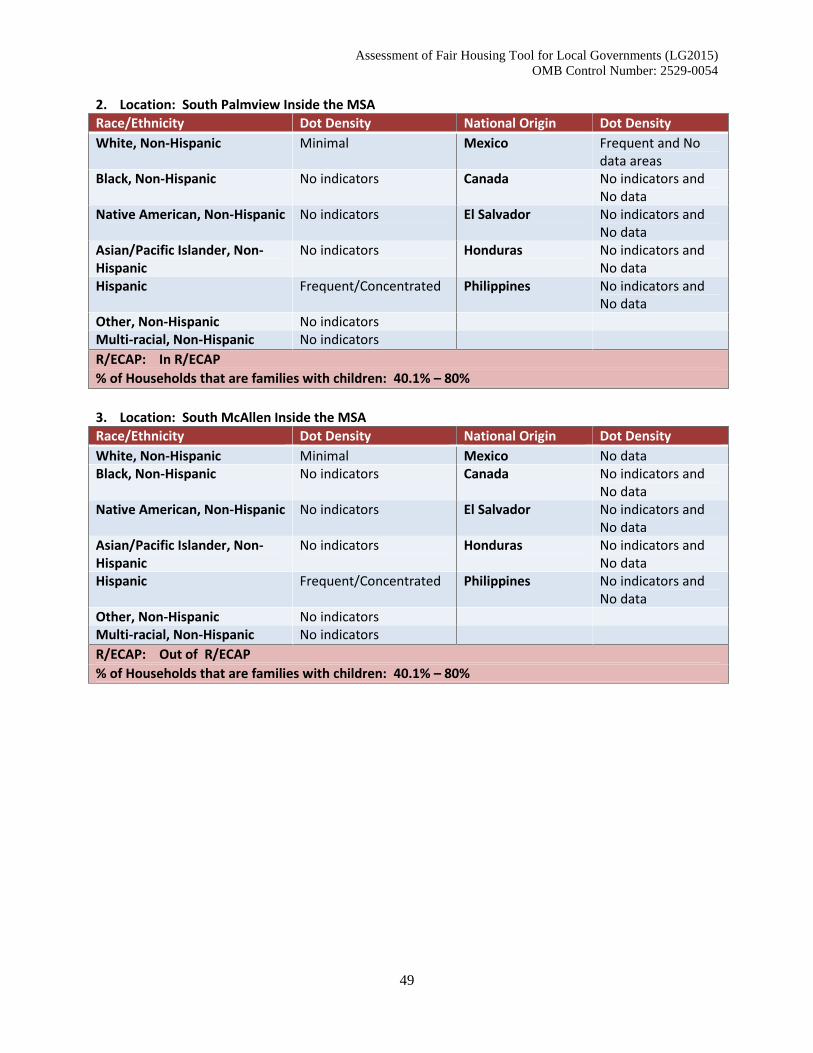
Assessment of Fair Housing Tool for Local Governments (LG2015)OMB Control Number: 2529-0054
49
2. Location: South Palmview Inside the MSARace/Ethnicity Dot Density National Origin Dot DensityWhite, Non-Hispanic Minimal Mexico Frequent and No
data areasBlack, Non-Hispanic No indicators Canada No indicators and
No dataNative American, Non-Hispanic No indicators El Salvador No indicators and
No dataAsian/Pacific Islander, Non-Hispanic
No indicators Honduras No indicators andNo data
Hispanic Frequent/Concentrated Philippines No indicators andNo data
Other, Non-Hispanic No indicatorsMulti-racial, Non-Hispanic No indicatorsR/ECAP: In R/ECAP% of Households that are families with children: 40.1% – 80%
3. Location: South McAllen Inside the MSARace/Ethnicity Dot Density National Origin Dot DensityWhite, Non-Hispanic Minimal Mexico No dataBlack, Non-Hispanic No indicators Canada No indicators and
No dataNative American, Non-Hispanic No indicators El Salvador No indicators and
No dataAsian/Pacific Islander, Non-Hispanic
No indicators Honduras No indicators andNo data
Hispanic Frequent/Concentrated Philippines No indicators andNo data
Other, Non-Hispanic No indicatorsMulti-racial, Non-Hispanic No indicatorsR/ECAP: Out of R/ECAP% of Households that are families with children: 40.1% – 80%
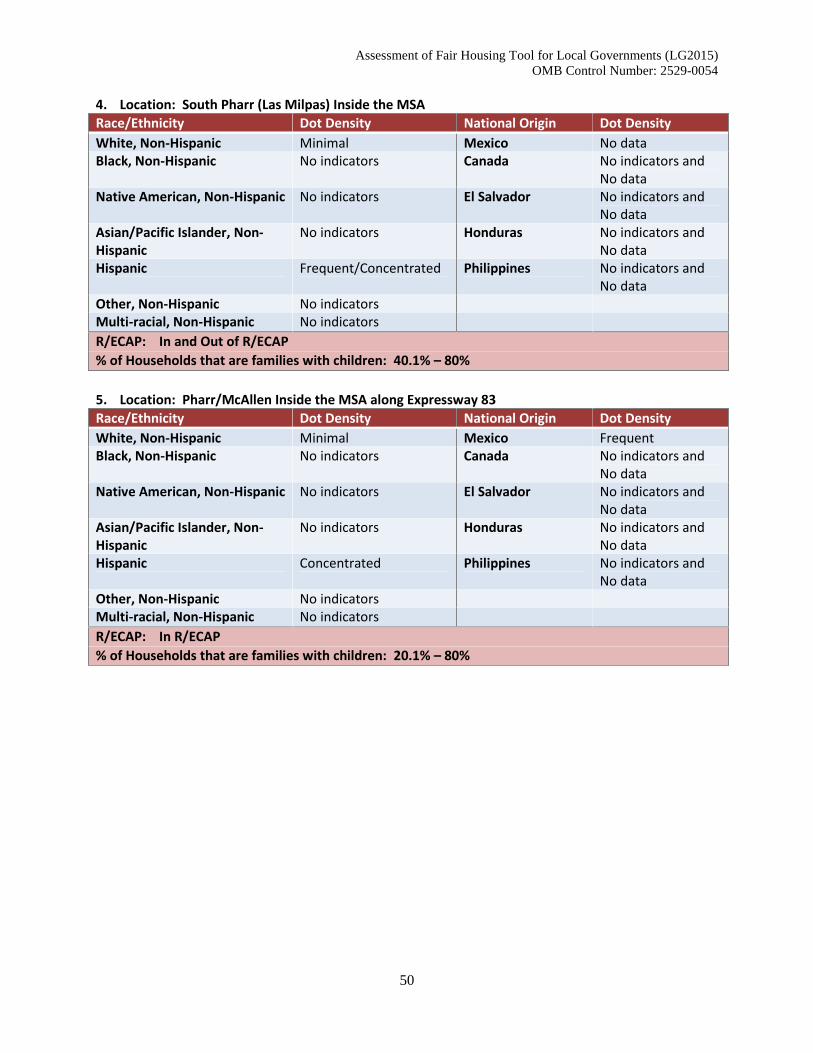
Assessment of Fair Housing Tool for Local Governments (LG2015)OMB Control Number: 2529-0054
50
4. Location: South Pharr (Las Milpas) Inside the MSARace/Ethnicity Dot Density National Origin Dot DensityWhite, Non-Hispanic Minimal Mexico No dataBlack, Non-Hispanic No indicators Canada No indicators and
No dataNative American, Non-Hispanic No indicators El Salvador No indicators and
No dataAsian/Pacific Islander, Non-Hispanic
No indicators Honduras No indicators andNo data
Hispanic Frequent/Concentrated Philippines No indicators andNo data
Other, Non-Hispanic No indicatorsMulti-racial, Non-Hispanic No indicatorsR/ECAP: In and Out of R/ECAP% of Households that are families with children: 40.1% – 80%
5. Location: Pharr/McAllen Inside the MSA along Expressway 83Race/Ethnicity Dot Density National Origin Dot DensityWhite, Non-Hispanic Minimal Mexico FrequentBlack, Non-Hispanic No indicators Canada No indicators and
No dataNative American, Non-Hispanic No indicators El Salvador No indicators and
No dataAsian/Pacific Islander, Non-Hispanic
No indicators Honduras No indicators andNo data
Hispanic Concentrated Philippines No indicators andNo data
Other, Non-Hispanic No indicatorsMulti-racial, Non-Hispanic No indicatorsR/ECAP: In R/ECAP% of Households that are families with children: 20.1% – 80%
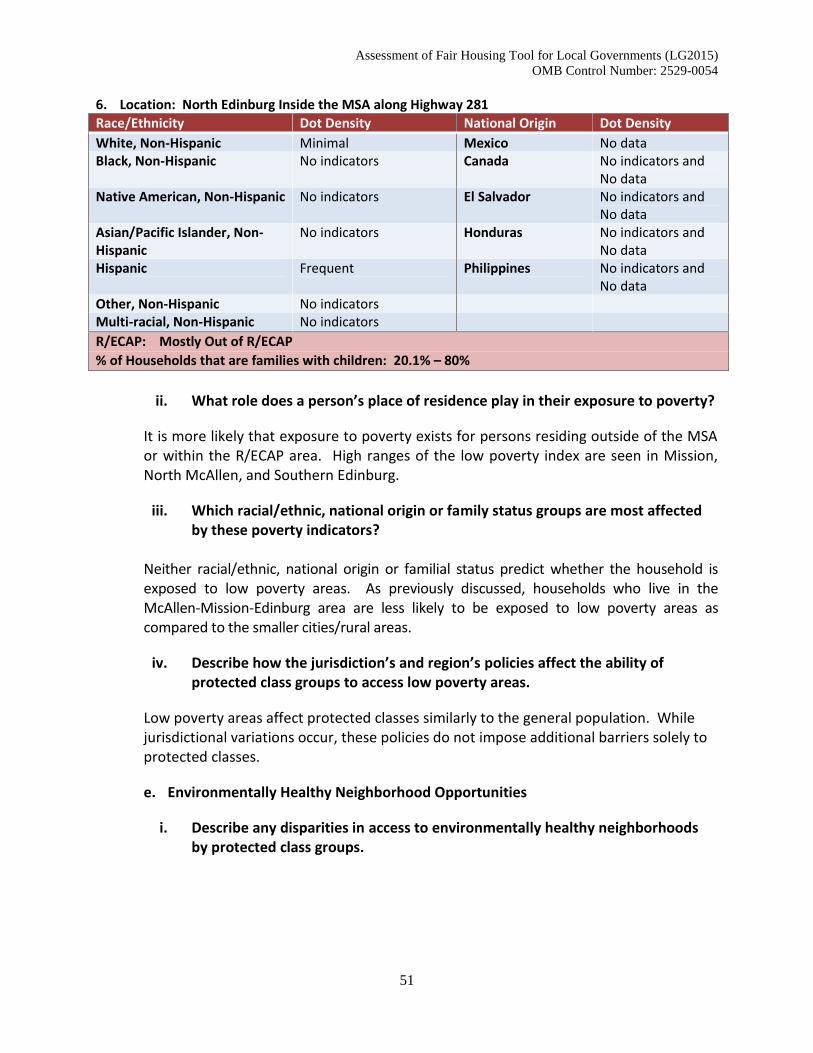
Assessment of Fair Housing Tool for Local Governments (LG2015)OMB Control Number: 2529-0054
51
6. Location: North Edinburg Inside the MSA along Highway 281Race/Ethnicity Dot Density National Origin Dot DensityWhite, Non-Hispanic Minimal Mexico No dataBlack, Non-Hispanic No indicators Canada No indicators and
No dataNative American, Non-Hispanic No indicators El Salvador No indicators and
No dataAsian/Pacific Islander, Non-Hispanic
No indicators Honduras No indicators andNo data
Hispanic Frequent Philippines No indicators andNo data
Other, Non-Hispanic No indicatorsMulti-racial, Non-Hispanic No indicatorsR/ECAP: Mostly Out of R/ECAP% of Households that are families with children: 20.1% – 80%
ii. What role does a person’s place of residence play in their exposure to poverty?
It is more likely that exposure to poverty exists for persons residing outside of the MSAor within the R/ECAP area. High ranges of the low poverty index are seen in Mission,North McAllen, and Southern Edinburg.
iii. Which racial/ethnic, national origin or family status groups are most affectedby these poverty indicators?
Neither racial/ethnic, national origin or familial status predict whether the household isexposed to low poverty areas. As previously discussed, households who live in theMcAllen-Mission-Edinburg area are less likely to be exposed to low poverty areas ascompared to the smaller cities/rural areas.
iv. Describe how the jurisdiction’s and region’s policies affect the ability ofprotected class groups to access low poverty areas.
Low poverty areas affect protected classes similarly to the general population. Whilejurisdictional variations occur, these policies do not impose additional barriers solely toprotected classes.
e. Environmentally Healthy Neighborhood Opportunities
i. Describe any disparities in access to environmentally healthy neighborhoodsby protected class groups.
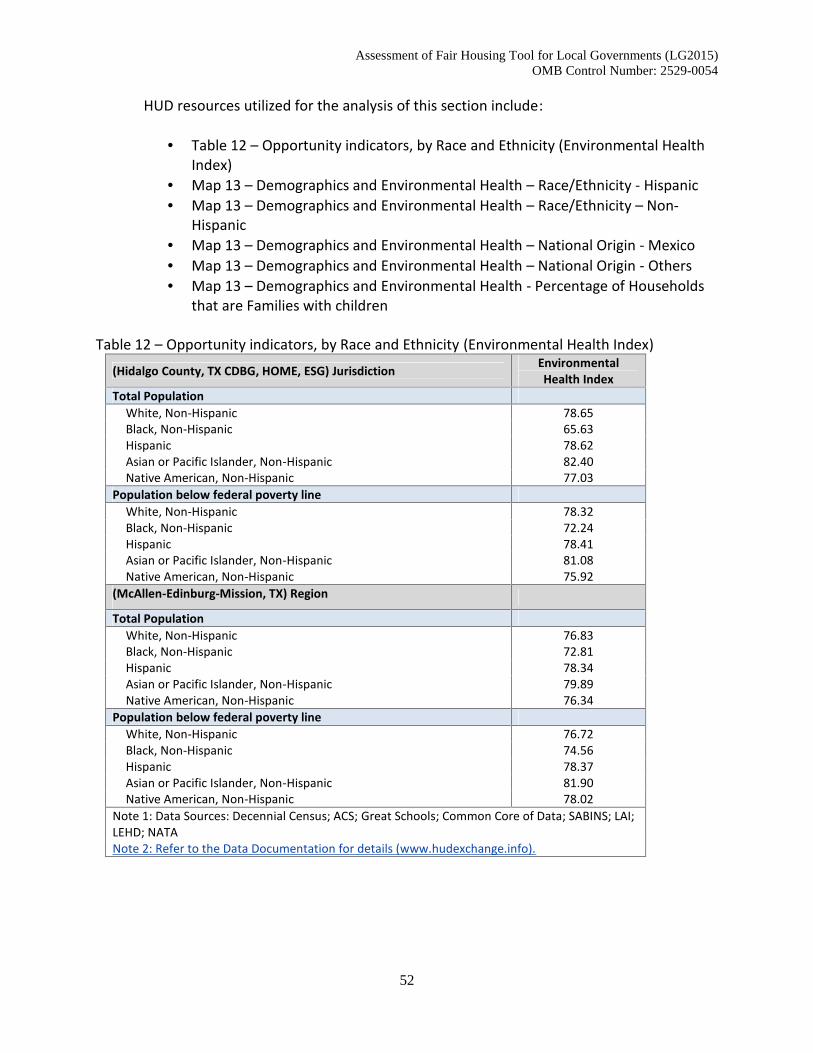
Assessment of Fair Housing Tool for Local Governments (LG2015)OMB Control Number: 2529-0054
52
HUD resources utilized for the analysis of this section include:
Table 12 – Opportunity indicators, by Race and Ethnicity (Environmental HealthIndex)
Map 13 – Demographics and Environmental Health – Race/Ethnicity - Hispanic Map 13 – Demographics and Environmental Health – Race/Ethnicity – Non-
Hispanic Map 13 – Demographics and Environmental Health – National Origin - Mexico Map 13 – Demographics and Environmental Health – National Origin - Others Map 13 – Demographics and Environmental Health - Percentage of Households
that are Families with children
Table 12 – Opportunity indicators, by Race and Ethnicity (Environmental Health Index)(Hidalgo County, TX CDBG, HOME, ESG) Jurisdiction Environmental
Health IndexTotal Population
White, Non-Hispanic 78.65Black, Non-Hispanic 65.63Hispanic 78.62Asian or Pacific Islander, Non-Hispanic 82.40Native American, Non-Hispanic 77.03
Population below federal poverty lineWhite, Non-Hispanic 78.32Black, Non-Hispanic 72.24Hispanic 78.41Asian or Pacific Islander, Non-Hispanic 81.08Native American, Non-Hispanic 75.92
(McAllen-Edinburg-Mission, TX) Region
Total PopulationWhite, Non-Hispanic 76.83Black, Non-Hispanic 72.81Hispanic 78.34Asian or Pacific Islander, Non-Hispanic 79.89Native American, Non-Hispanic 76.34
Population below federal poverty lineWhite, Non-Hispanic 76.72Black, Non-Hispanic 74.56Hispanic 78.37Asian or Pacific Islander, Non-Hispanic 81.90Native American, Non-Hispanic 78.02
Note 1: Data Sources: Decennial Census; ACS; Great Schools; Common Core of Data; SABINS; LAI;LEHD; NATANote 2: Refer to the Data Documentation for details (www.hudexchange.info).
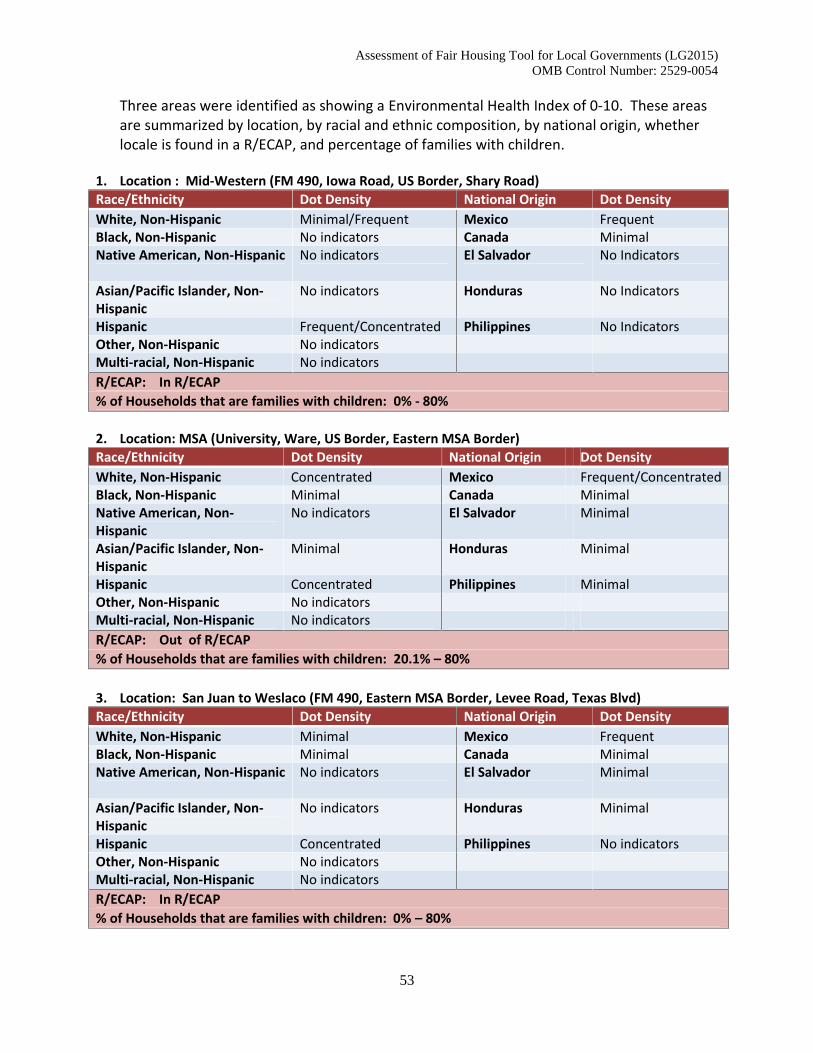
Assessment of Fair Housing Tool for Local Governments (LG2015)OMB Control Number: 2529-0054
53
Three areas were identified as showing a Environmental Health Index of 0-10. These areasare summarized by location, by racial and ethnic composition, by national origin, whetherlocale is found in a R/ECAP, and percentage of families with children.
1. Location : Mid-Western (FM 490, Iowa Road, US Border, Shary Road)Race/Ethnicity Dot Density National Origin Dot DensityWhite, Non-Hispanic Minimal/Frequent Mexico FrequentBlack, Non-Hispanic No indicators Canada MinimalNative American, Non-Hispanic No indicators El Salvador No Indicators
Asian/Pacific Islander, Non-Hispanic
No indicators Honduras No Indicators
Hispanic Frequent/Concentrated Philippines No IndicatorsOther, Non-Hispanic No indicatorsMulti-racial, Non-Hispanic No indicatorsR/ECAP: In R/ECAP% of Households that are families with children: 0% - 80%
2. Location: MSA (University, Ware, US Border, Eastern MSA Border)Race/Ethnicity Dot Density National Origin Dot DensityWhite, Non-Hispanic Concentrated Mexico Frequent/ConcentratedBlack, Non-Hispanic Minimal Canada MinimalNative American, Non-Hispanic
No indicators El Salvador Minimal
Asian/Pacific Islander, Non-Hispanic
Minimal Honduras Minimal
Hispanic Concentrated Philippines MinimalOther, Non-Hispanic No indicatorsMulti-racial, Non-Hispanic No indicatorsR/ECAP: Out of R/ECAP% of Households that are families with children: 20.1% – 80%
3. Location: San Juan to Weslaco (FM 490, Eastern MSA Border, Levee Road, Texas Blvd)Race/Ethnicity Dot Density National Origin Dot DensityWhite, Non-Hispanic Minimal Mexico FrequentBlack, Non-Hispanic Minimal Canada MinimalNative American, Non-Hispanic No indicators El Salvador Minimal
Asian/Pacific Islander, Non-Hispanic
No indicators Honduras Minimal
Hispanic Concentrated Philippines No indicatorsOther, Non-Hispanic No indicatorsMulti-racial, Non-Hispanic No indicatorsR/ECAP: In R/ECAP% of Households that are families with children: 0% – 80%
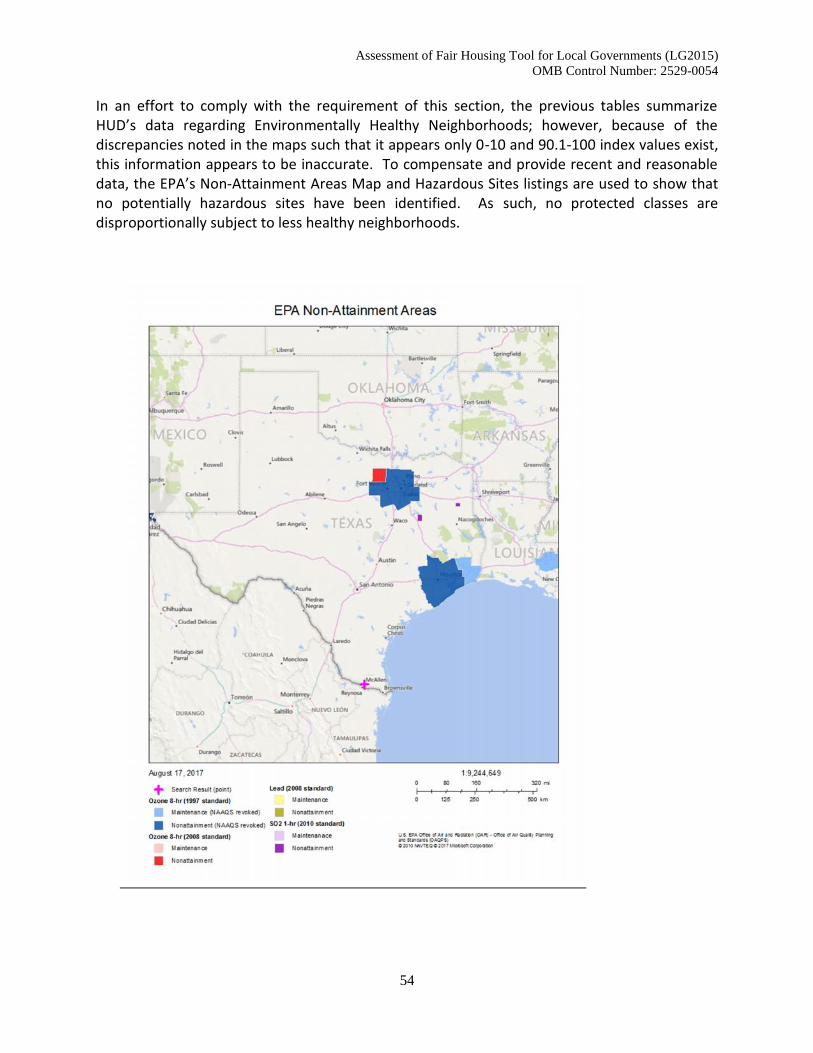
Assessment of Fair Housing Tool for Local Governments (LG2015)OMB Control Number: 2529-0054
54
In an effort to comply with the requirement of this section, the previous tables summarizeHUD’s data regarding Environmentally Healthy Neighborhoods; however, because of thediscrepancies noted in the maps such that it appears only 0-10 and 90.1-100 index values exist,this information appears to be inaccurate. To compensate and provide recent and reasonabledata, the EPA’s Non-Attainment Areas Map and Hazardous Sites listings are used to show thatno potentially hazardous sites have been identified. As such, no protected classes aredisproportionally subject to less healthy neighborhoods.
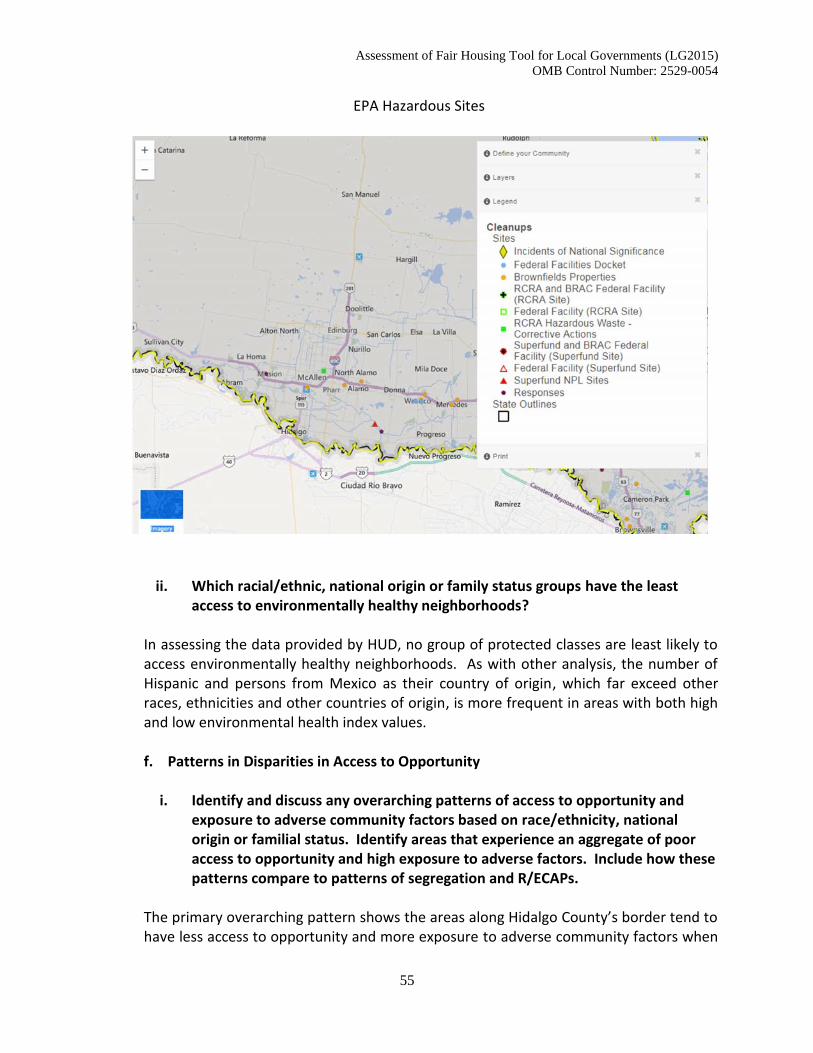
Assessment of Fair Housing Tool for Local Governments (LG2015)OMB Control Number: 2529-0054
55
EPA Hazardous Sites
ii. Which racial/ethnic, national origin or family status groups have the leastaccess to environmentally healthy neighborhoods?
In assessing the data provided by HUD, no group of protected classes are least likely toaccess environmentally healthy neighborhoods. As with other analysis, the number ofHispanic and persons from Mexico as their country of origin, which far exceed otherraces, ethnicities and other countries of origin, is more frequent in areas with both highand low environmental health index values.
f. Patterns in Disparities in Access to Opportunity
i. Identify and discuss any overarching patterns of access to opportunity andexposure to adverse community factors based on race/ethnicity, nationalorigin or familial status. Identify areas that experience an aggregate of pooraccess to opportunity and high exposure to adverse factors. Include how thesepatterns compare to patterns of segregation and R/ECAPs.
The primary overarching pattern shows the areas along Hidalgo County’s border tend tohave less access to opportunity and more exposure to adverse community factors when
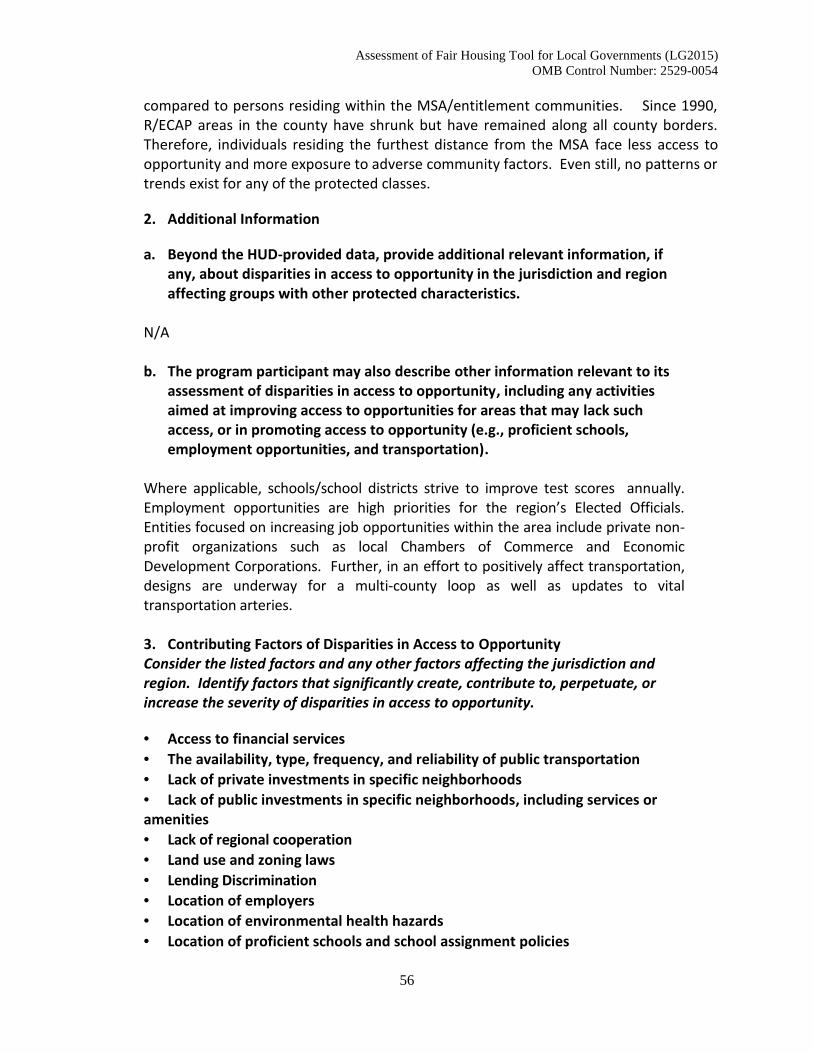
Assessment of Fair Housing Tool for Local Governments (LG2015)OMB Control Number: 2529-0054
56
compared to persons residing within the MSA/entitlement communities. Since 1990,R/ECAP areas in the county have shrunk but have remained along all county borders.Therefore, individuals residing the furthest distance from the MSA face less access toopportunity and more exposure to adverse community factors. Even still, no patterns ortrends exist for any of the protected classes.
2. Additional Information
a. Beyond the HUD-provided data, provide additional relevant information, ifany, about disparities in access to opportunity in the jurisdiction and regionaffecting groups with other protected characteristics.
N/A
b. The program participant may also describe other information relevant to itsassessment of disparities in access to opportunity, including any activitiesaimed at improving access to opportunities for areas that may lack suchaccess, or in promoting access to opportunity (e.g., proficient schools,employment opportunities, and transportation).
Where applicable, schools/school districts strive to improve test scores annually.Employment opportunities are high priorities for the region’s Elected Officials.Entities focused on increasing job opportunities within the area include private non-profit organizations such as local Chambers of Commerce and EconomicDevelopment Corporations. Further, in an effort to positively affect transportation,designs are underway for a multi-county loop as well as updates to vitaltransportation arteries.
3. Contributing Factors of Disparities in Access to OpportunityConsider the listed factors and any other factors affecting the jurisdiction andregion. Identify factors that significantly create, contribute to, perpetuate, orincrease the severity of disparities in access to opportunity.
Access to financial services The availability, type, frequency, and reliability of public transportation Lack of private investments in specific neighborhoods Lack of public investments in specific neighborhoods, including services oramenities Lack of regional cooperation Land use and zoning laws Lending Discrimination Location of employers Location of environmental health hazards Location of proficient schools and school assignment policies
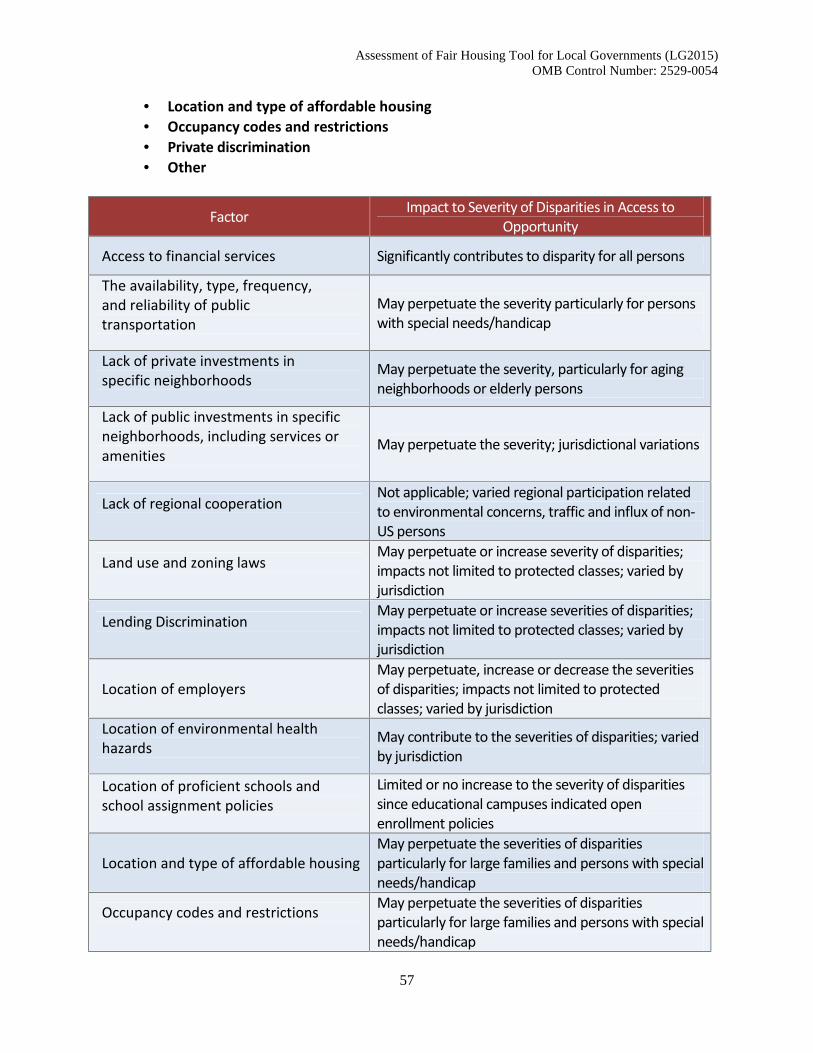
Assessment of Fair Housing Tool for Local Governments (LG2015)OMB Control Number: 2529-0054
57
Location and type of affordable housing Occupancy codes and restrictions Private discrimination Other
Factor Impact to Severity of Disparities in Access toOpportunity
Access to financial services Significantly contributes to disparity for all persons
The availability, type, frequency,and reliability of publictransportation
May perpetuate the severity particularly for personswith special needs/handicap
Lack of private investments inspecific neighborhoods
May perpetuate the severity, particularly for agingneighborhoods or elderly persons
Lack of public investments in specificneighborhoods, including services oramenities
May perpetuate the severity; jurisdictional variations
Lack of regional cooperationNot applicable; varied regional participation relatedto environmental concerns, traffic and influx of non-US persons
Land use and zoning lawsMay perpetuate or increase severity of disparities;impacts not limited to protected classes; varied byjurisdiction
Lending DiscriminationMay perpetuate or increase severities of disparities;impacts not limited to protected classes; varied byjurisdiction
Location of employersMay perpetuate, increase or decrease the severitiesof disparities; impacts not limited to protectedclasses; varied by jurisdiction
Location of environmental healthhazards
May contribute to the severities of disparities; variedby jurisdiction
Location of proficient schools andschool assignment policies
Limited or no increase to the severity of disparitiessince educational campuses indicated openenrollment policies
Location and type of affordable housingMay perpetuate the severities of disparitiesparticularly for large families and persons with specialneeds/handicap
Occupancy codes and restrictions May perpetuate the severities of disparitiesparticularly for large families and persons with specialneeds/handicap
Assessment of Fair Housing Tool for Local Governments (LG2015)OMB Control Number: 2529-0054
58
Private discrimination May create/increase disparities
Other Not applicable
iv. Disproportionate Housing Needs
1. Analysis
a. Which groups (by race/ethnicity and family status) experience higher rates ofhousing cost burden, overcrowding, or substandard housing when compared toother groups? Which groups also experience higher rates of severe housingburdens when compared to other groups?
HUD resources utilized for the analysis of this section include:
Table 10 – Demographics of Households with Severe Housing Cost Burden Table 9 – Demographics of Households with Disproportionate Housing Needs Map 6 – Housing Problems – Race-Ethnicity – % Households with Burden -
Hispanic Map 6 – Housing Problems – Race-Ethnicity – % Households with Burden – Non-
Hispanic Map 6 – Housing Problems – National Origin - % Households with Burden –
Mexico Map 6 – Housing Problems – National Origin - % Households with Burden – Other Table 11 – Publicly Supported Housing by Program Category: Units by Number
of Bedrooms and Number of Children Table 16 – Homeownership and Rental Rates by Race/Ethnicity
For persons residing outside of the MSA, Black, Non-Hispanic and Native-American, Non-Hispanics have the highest percentage of householdsexperiencing any of the four housing problems. However, their total is 65households. Hispanics far exceed their number of households at more than45,000 who experience housing problems. Large family households are morelikely to experience any of the four housing problems regardless of residing in orout of the MSA. Within the MSA, the percentage of households experiencing anyof the four housing problems is greatest for Hispanics and Native-American,Non-Hispanic. However, it should be noted that the Native-American, Non-Hispanic size is exponentially smaller than the number of Hispanics facing any ofthe four housing problems, 80 to 84,400 households, respectively.
Black, Non-Hispanic who reside outside of the MSA disproportionatelyexperience any of the four severe housing problems. Within the MSA, Native-American, Non-Hispanic households experience any of the four severe
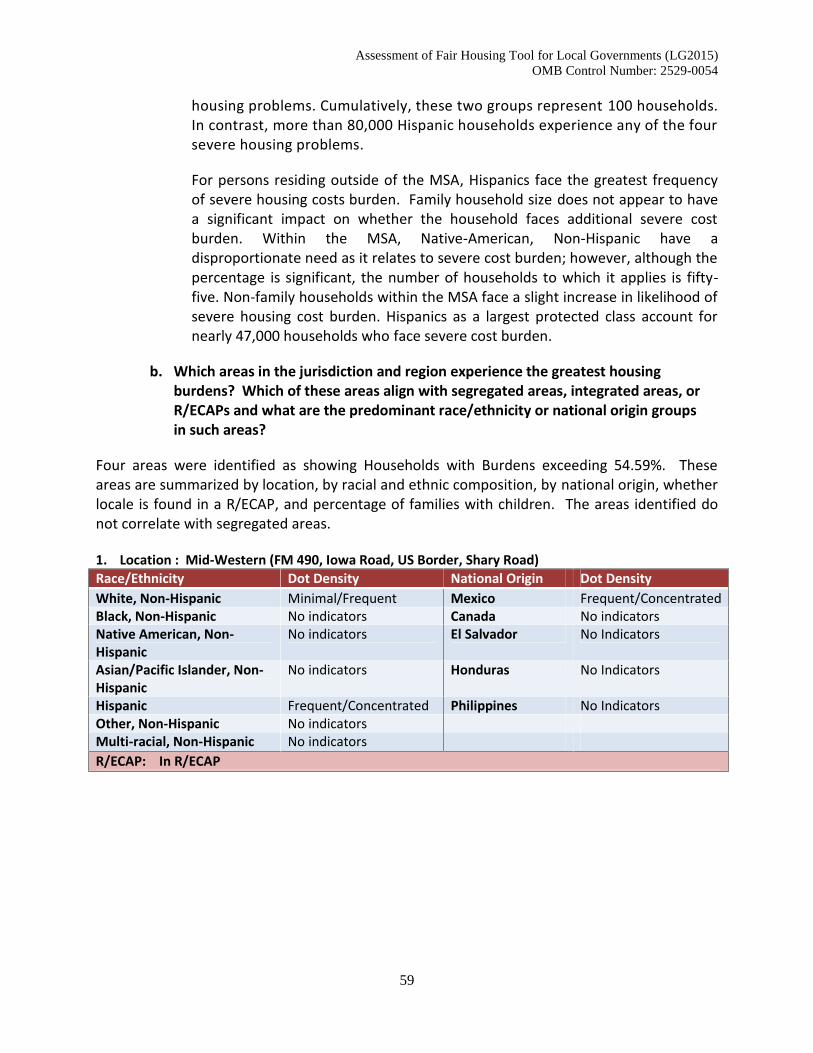
Assessment of Fair Housing Tool for Local Governments (LG2015)OMB Control Number: 2529-0054
59
housing problems. Cumulatively, these two groups represent 100 households.In contrast, more than 80,000 Hispanic households experience any of the foursevere housing problems.
For persons residing outside of the MSA, Hispanics face the greatest frequencyof severe housing costs burden. Family household size does not appear to havea significant impact on whether the household faces additional severe costburden. Within the MSA, Native-American, Non-Hispanic have adisproportionate need as it relates to severe cost burden; however, although thepercentage is significant, the number of households to which it applies is fifty-five. Non-family households within the MSA face a slight increase in likelihood ofsevere housing cost burden. Hispanics as a largest protected class account fornearly 47,000 households who face severe cost burden.
b. Which areas in the jurisdiction and region experience the greatest housingburdens? Which of these areas align with segregated areas, integrated areas, orR/ECAPs and what are the predominant race/ethnicity or national origin groupsin such areas?
Four areas were identified as showing Households with Burdens exceeding 54.59%. Theseareas are summarized by location, by racial and ethnic composition, by national origin, whetherlocale is found in a R/ECAP, and percentage of families with children. The areas identified donot correlate with segregated areas.
1. Location : Mid-Western (FM 490, Iowa Road, US Border, Shary Road)Race/Ethnicity Dot Density National Origin Dot DensityWhite, Non-Hispanic Minimal/Frequent Mexico Frequent/ConcentratedBlack, Non-Hispanic No indicators Canada No indicatorsNative American, Non-Hispanic
No indicators El Salvador No Indicators
Asian/Pacific Islander, Non-Hispanic
No indicators Honduras No Indicators
Hispanic Frequent/Concentrated Philippines No IndicatorsOther, Non-Hispanic No indicatorsMulti-racial, Non-Hispanic No indicatorsR/ECAP: In R/ECAP
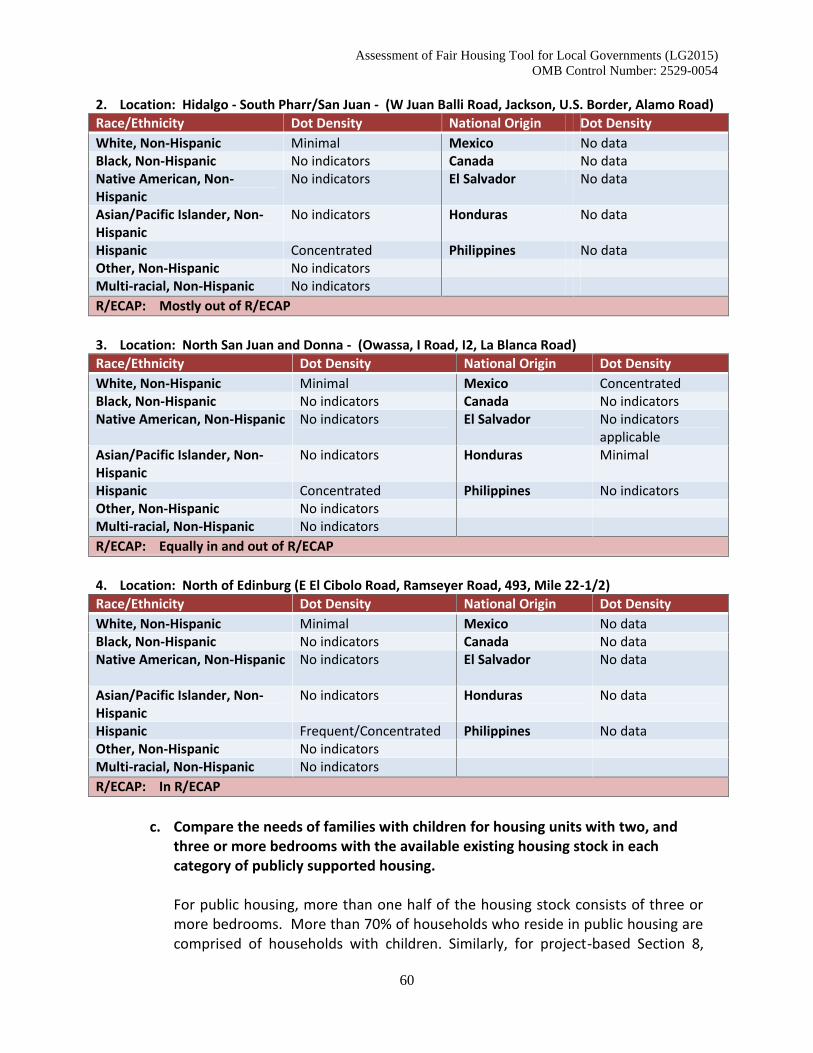
Assessment of Fair Housing Tool for Local Governments (LG2015)OMB Control Number: 2529-0054
60
2. Location: Hidalgo - South Pharr/San Juan - (W Juan Balli Road, Jackson, U.S. Border, Alamo Road)Race/Ethnicity Dot Density National Origin Dot DensityWhite, Non-Hispanic Minimal Mexico No dataBlack, Non-Hispanic No indicators Canada No dataNative American, Non-Hispanic
No indicators El Salvador No data
Asian/Pacific Islander, Non-Hispanic
No indicators Honduras No data
Hispanic Concentrated Philippines No dataOther, Non-Hispanic No indicatorsMulti-racial, Non-Hispanic No indicatorsR/ECAP: Mostly out of R/ECAP
3. Location: North San Juan and Donna - (Owassa, I Road, I2, La Blanca Road)Race/Ethnicity Dot Density National Origin Dot DensityWhite, Non-Hispanic Minimal Mexico ConcentratedBlack, Non-Hispanic No indicators Canada No indicatorsNative American, Non-Hispanic No indicators El Salvador No indicators
applicableAsian/Pacific Islander, Non-Hispanic
No indicators Honduras Minimal
Hispanic Concentrated Philippines No indicatorsOther, Non-Hispanic No indicatorsMulti-racial, Non-Hispanic No indicatorsR/ECAP: Equally in and out of R/ECAP
4. Location: North of Edinburg (E El Cibolo Road, Ramseyer Road, 493, Mile 22-1/2)Race/Ethnicity Dot Density National Origin Dot DensityWhite, Non-Hispanic Minimal Mexico No dataBlack, Non-Hispanic No indicators Canada No dataNative American, Non-Hispanic No indicators El Salvador No data
Asian/Pacific Islander, Non-Hispanic
No indicators Honduras No data
Hispanic Frequent/Concentrated Philippines No dataOther, Non-Hispanic No indicatorsMulti-racial, Non-Hispanic No indicatorsR/ECAP: In R/ECAP
c. Compare the needs of families with children for housing units with two, andthree or more bedrooms with the available existing housing stock in eachcategory of publicly supported housing.
For public housing, more than one half of the housing stock consists of three ormore bedrooms. More than 70% of households who reside in public housing arecomprised of households with children. Similarly, for project-based Section 8,
Assessment of Fair Housing Tool for Local Governments (LG2015)OMB Control Number: 2529-0054
61
42% of units consist of 3 or more bedrooms. More than half of households whoreside in project-based Section 8 units are comprised of households withchildren. No data was available for other multi-family projects. Households withtwo bedrooms are more frequently used in the Housing Choice Voucher (HCV)program. For the HCV program, 68% of households are comprised of householdswith children.
d. Describe the differences in rates of renter and owner occupied housing byrace/ethnicity in the jurisdiction and region.
While no HUD data was provided for this assessment, a review of Censusinformation was undertaken. In Hidalgo County (inclusive of the entitlementcommunities), the owner-occupied housing unit rate was 68.1%. For entitlementcommunities, the owner-occupied housing unit rate ranged from 54.7 to 69.6%.Information was obtained using the American Community Survey 2011-2015(estimate). Further review of Census data indicated that the area’s racial and ethniccomposition includes 90.6% of Hispanics in Hidalgo County.
2. Additional Information
a. Beyond the HUD-provided data, provide additional relevant information, if any,about disproportionate housing needs in the jurisdiction and region affectinggroups with other protected characteristics.
It should be noted that while certain protected classes may disproportionately faceany of the four housing problems, their cumulative numbers are significantly lessthan the number of Hispanic households facing similar problems.
b. The program participant may also describe other information relevant to itsassessment of disproportionate housing needs. For PHAs, such information mayinclude a PHA’s overriding housing needs analysis.
The PHA Housing Analysis is discussed in the publicly supported housing componentof this document.
3. Contributing Factors of Disproportionate Housing Needs
Consider the listed factors and any other factors affecting the jurisdiction andregion. Identify factors that significantly create, contribute to, perpetuate, orincrease the severity of disproportionate housing needs.
The availability of affordable units in a range of sizes Displacement of residents due to economic pressures Lack of private investments in specific neighborhoods
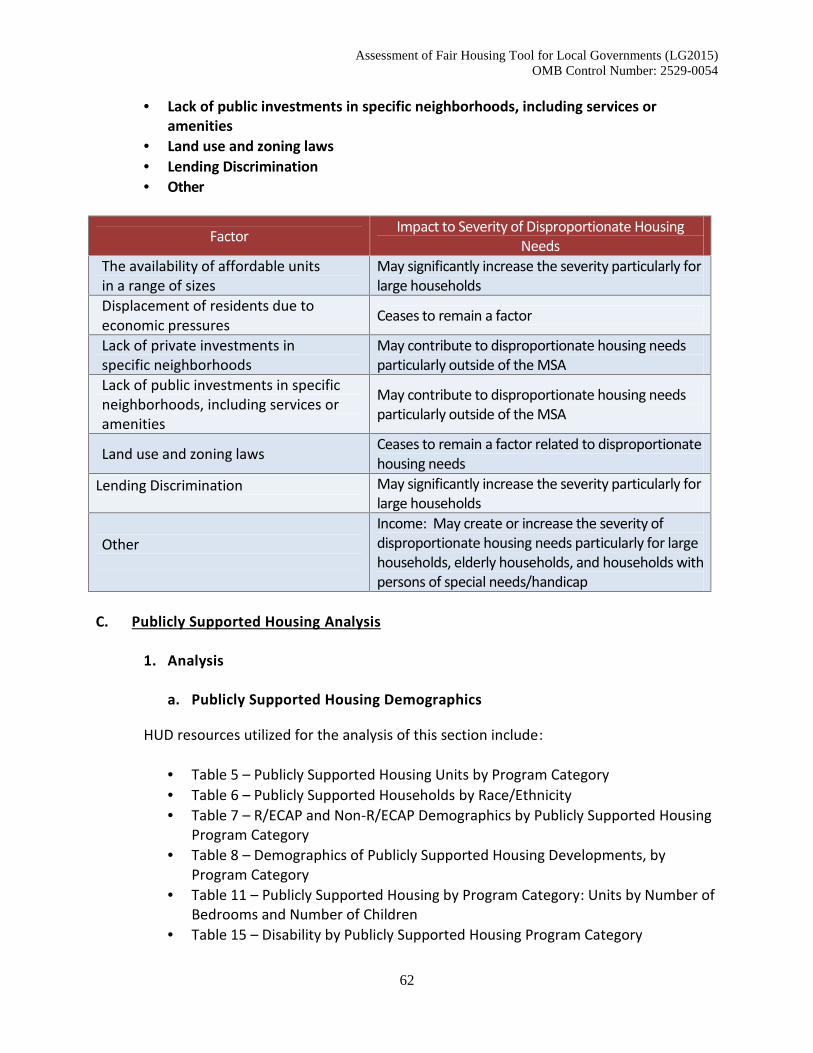
Assessment of Fair Housing Tool for Local Governments (LG2015)OMB Control Number: 2529-0054
62
Lack of public investments in specific neighborhoods, including services oramenities
Land use and zoning laws Lending Discrimination Other
Factor Impact to Severity of Disproportionate HousingNeeds
The availability of affordable unitsin a range of sizes
May significantly increase the severity particularly forlarge households
Displacement of residents due toeconomic pressures Ceases to remain a factor
Lack of private investments inspecific neighborhoods
May contribute to disproportionate housing needsparticularly outside of the MSA
Lack of public investments in specificneighborhoods, including services oramenities
May contribute to disproportionate housing needsparticularly outside of the MSA
Land use and zoning laws Ceases to remain a factor related to disproportionatehousing needs
Lending Discrimination May significantly increase the severity particularly forlarge households
OtherIncome: May create or increase the severity ofdisproportionate housing needs particularly for largehouseholds, elderly households, and households withpersons of special needs/handicap
C. Publicly Supported Housing Analysis
1. Analysis
a. Publicly Supported Housing Demographics
HUD resources utilized for the analysis of this section include:
Table 5 – Publicly Supported Housing Units by Program Category Table 6 – Publicly Supported Households by Race/Ethnicity Table 7 – R/ECAP and Non-R/ECAP Demographics by Publicly Supported Housing
Program Category Table 8 – Demographics of Publicly Supported Housing Developments, by
Program Category Table 11 – Publicly Supported Housing by Program Category: Units by Number of
Bedrooms and Number of Children Table 15 – Disability by Publicly Supported Housing Program Category
Assessment of Fair Housing Tool for Local Governments (LG2015)OMB Control Number: 2529-0054
63
Map 5 – Publicly Supported Housing and Race/Ethnicity – Hispanic Map 5 – Publicly Supported Housing and Race/Ethnicity – Non-Hispanic
i. Are certain racial/ethnic groups more likely to be residing in one category ofpublicly supported housing than other categories (public housing, project-based Section 8, Other HUD Multifamily Assisted developments, and HousingChoice Voucher (HCV))?
For Hidalgo County, more than 99% of households who reside in public housing orproject based section 8 and HCV Program are Hispanic. No data was available forOther Multi-Family in Hidalgo County and all housing types for the MSA. However,due to the region’s racial and ethnic composition, it could be inferred that Hispanicswould make up the preponderance of households utilizing other multi-family units inHidalgo County and public housing, project based section 8, other multi-family andHCV Program within the MSA.
ii. Compare the demographics, in terms of protected class, of residents of eachcategory of publicly supported housing (public housing, project-based Section8, Other HUD Multifamily Assisted developments, and HCV) to the populationin general, and persons who meet the income eligibility requirements for therelevant category of publicly supported housing. Include in the comparison, adescription of whether there is a higher or lower proportion of groups basedon protected class.
Based on an analysis of Table 6 - Publicly Supported Households by Race/Ethnicity, ananalysis was undertaken which was limited to Hidalgo County because the informationfor the MSA publicly supported housing units did not populate. While relativelyinsignificant there is a difference between the percentage of White, Non-Hispanic, wholive in publicly supported housing versus the region, less than 1% and 6% respectively.No Black, Non-Hispanic, and Asian or Pacific Islander, reside in publicly supportedhousing and their presence in the region is limited to around 0.25%. However, Hispanicsare highly represented in the region, MSA and in publicly supported housing.
White, Non-Hispanic account for nearly 4% of eligible households; however, less than1% reside in these publicly supported categories. Blacks, Non-Hispanic account for lessthan 1% of eligible households; however, none reside in these publicly supportedcategories. Hispanics account for more than 95% of eligible households but account for99% of these publicly supported units. Lastly, Asian or Pacific Islander, Non-Hispanicaccount for less than 1% of eligible households; however, none reside in these publiclysupported categories. The reader should be cautioned that this data is fluid.Annualized data may indicate a more represented use of publicly supported housing byother racial and ethnic classes.
Assessment of Fair Housing Tool for Local Governments (LG2015)OMB Control Number: 2529-0054
64
b. Publicly Supported Housing Location and Occupancy
i. Describe patterns in the geographic location of publicly supported housingby program category (public housing, project-based Section 8, Other HUDMultifamily Assisted developments, HCV, and LIHTC) in relation topreviously discussed segregated areas and R/ECAPs.
Publicly housing appears along Business 83 and Highway 281 (I2) transportation routes.Other Multi-Family developments appear within the City of Mission and the City of Mercedes.Project-Based Section 8 developments also appear along Business 83 and Highway 281transportation routes with an additional development located within the City of Elsa. LowIncome Housing Tax Credit developments appear along Business 83 and Highway 281transportation routes with additional developments located within the City of Elsa, Edcouchand North Alton. IN considering the location of all publicly supported housing, approximately60% of developments occur outside of the R/ECAP. Because no segregated areas wereidentified no housing developments are situation within segregated areas.
ii. Describe patterns in the geographic location for publicly supported housingthat primarily serves families with children, elderly persons, or persons withdisabilities in relation to previously discussed segregated areas or R/ECAPs?
For public housing and HCV Program in non-R/ECAP areas as well as Project-BasedSection 8 in R/ECAP, the majority of households are classified as families withchildren. Project-Based Section 8 in non-R/ECAP account for 35% of householdswhich include children. Project-Based Section 8 in non-R/ECAP areas have apreponderance of elderly households. It is worth noting that Project-Based Section8 include HUD 202-Elderly developments. Households with a person with adisability account for 21% of Public Housing Units in non-R/ECAP areas. Thepercentage lessens for all other categories.
iii. How does the demographic composition of occupants of publicly supportedhousing in R/ECAPS compare to the demographic composition of occupantsof publicly supported housing outside of R/ECAPs?
The percentages of racial/ethnic categories vary very slightly between R/ECAPand non-R/ECAP areas.
iv. (A) Do any developments of public housing, properties converted under theRAD, and LIHTC developments have a significantly different demographiccomposition, in terms of protected class, than other developments of thesame category? Describe how these developments differ.
There is no significant differential demographic composition.
Assessment of Fair Housing Tool for Local Governments (LG2015)OMB Control Number: 2529-0054
65
(B) Provide additional relevant information, if any, about occupancy, byprotected class, in other types of publicly supported housing.
N/A
v. Compare the demographics of occupants of developments, for each categoryof publicly supported housing (public housing, project-based Section 8, OtherHUD Multifamily Assisted developments, properties converted under RAD,and LIHTC) to the demographic composition of the areas in which they arelocated. Describe whether developments that are primarily occupied by onerace/ethnicity are located in areas occupied largely by the samerace/ethnicity. Describe any differences for housing that primarily servesfamilies with children, elderly persons, or persons with disabilities.
To the extent that developments are primarily occupied by one race/ethnicity(Hispanic), such developments are reflective of areas occupied largely by thesame race and ethnicity.
c. Disparities in Access to Opportunity
i. Describe any disparities in access to opportunity for residents of publiclysupported housing, including within different program categories (publichousing, project-based Section 8, Other HUD Multifamily AssistedDevelopments, HCV, and LIHTC) and between types (housing primarilyserving families with children, elderly persons, and persons withdisabilities) of publicly supported housing.
There are no disparities in access for opportunity for residents of publichousing based on protected classes.
2. Additional Information
a. Beyond the HUD-provided data, provide additional relevant information, ifany, about publicly supported housing in the jurisdiction and region,particularly information about groups with other protected characteristicsand about housing not captured in the HUD-provided data.
N/A
b. The program participant may also describe other information relevant to itsassessment of publicly supported housing. Information may include relevantprograms, actions, or activities, such as tenant self-sufficiency, place-basedinvestments, or mobility programs.
Assessment of Fair Housing Tool for Local Governments (LG2015)OMB Control Number: 2529-0054
66
Actions in order to assist individuals in public housing may include Self-Sufficiency Programs that:
Federally subsidized programs assisting public housing authorities withmanagement of mobility opportunities for families in public housing andhousing choice voucher programs. Program permits an escrow balance tobuild-in; furthering the assistance to those individual who are successfulwithin the program and become homeowners.
Public Housing Authorities develop relationships with local schools and orsecondary education providers furthering the academic needs of familieswith subsidized program.
Community services requirements within the Public Housing Programpermit the exposure to employment opportunities for families in need.
3. Contributing Factors of Publicly Supported Housing Location and Occupancy
Consider the listed factors and any other factors affecting the jurisdiction andregion. Identify factors that significantly create, contribute to, perpetuate, orincrease the severity of fair housing issues related to publicly supported housing,including Segregation, RECAPs, Disparities in Access to Opportunity, andDisproportionate Housing Needs. For each contributing factor that is significant,note which fair housing issue(s) the selected contributing factor relates to.
Admissions and occupancy policies and procedures, including preferences inpublicly supported housing
Land use and zoning laws Community opposition Impediments to mobility Lack of private investment in specific neighborhoods Lack of public investment in specific neighborhoods, including services and
amenities Lack of regional cooperation Occupancy codes and restrictions Quality of affordable housing information programs Siting selection policies, practices and decisions for publicly supported
housing, including discretionary aspects of Qualified Allocation Plans andother programs
Source of income discrimination Other
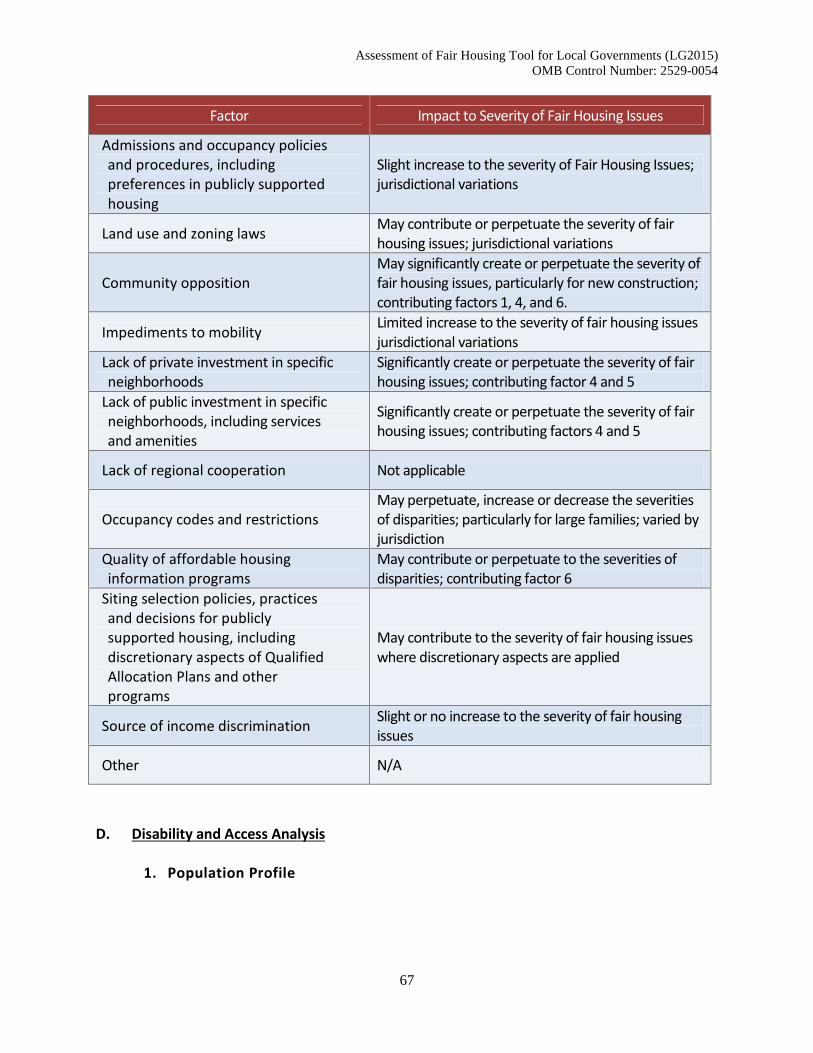
Assessment of Fair Housing Tool for Local Governments (LG2015)OMB Control Number: 2529-0054
67
Factor Impact to Severity of Fair Housing Issues
Admissions and occupancy policiesand procedures, includingpreferences in publicly supportedhousing
Slight increase to the severity of Fair Housing Issues;jurisdictional variations
Land use and zoning laws May contribute or perpetuate the severity of fairhousing issues; jurisdictional variations
Community oppositionMay significantly create or perpetuate the severity offair housing issues, particularly for new construction;contributing factors 1, 4, and 6.
Impediments to mobility Limited increase to the severity of fair housing issuesjurisdictional variations
Lack of private investment in specificneighborhoods
Significantly create or perpetuate the severity of fairhousing issues; contributing factor 4 and 5
Lack of public investment in specificneighborhoods, including servicesand amenities
Significantly create or perpetuate the severity of fairhousing issues; contributing factors 4 and 5
Lack of regional cooperation Not applicable
Occupancy codes and restrictionsMay perpetuate, increase or decrease the severitiesof disparities; particularly for large families; varied byjurisdiction
Quality of affordable housinginformation programs
May contribute or perpetuate to the severities ofdisparities; contributing factor 6
Siting selection policies, practicesand decisions for publiclysupported housing, includingdiscretionary aspects of QualifiedAllocation Plans and otherprograms
May contribute to the severity of fair housing issueswhere discretionary aspects are applied
Source of income discrimination Slight or no increase to the severity of fair housingissues
Other N/A
D. Disability and Access Analysis
1. Population Profile
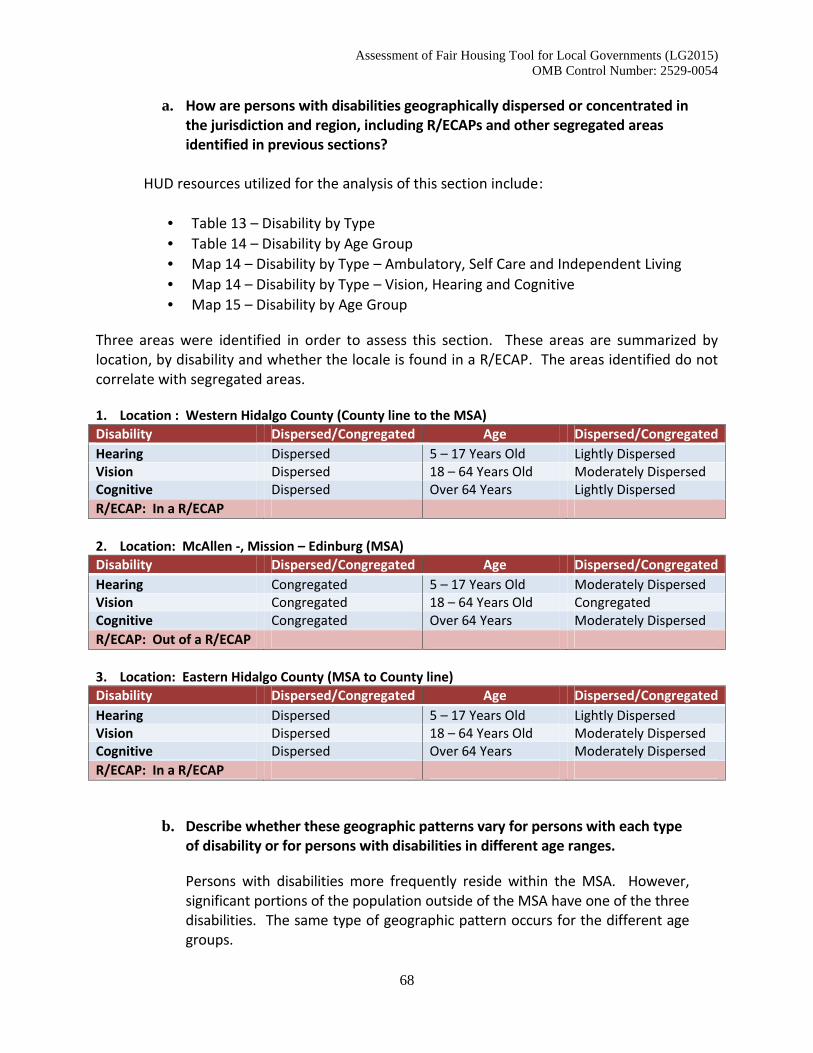
Assessment of Fair Housing Tool for Local Governments (LG2015)OMB Control Number: 2529-0054
68
a. How are persons with disabilities geographically dispersed or concentrated inthe jurisdiction and region, including R/ECAPs and other segregated areasidentified in previous sections?
HUD resources utilized for the analysis of this section include:
Table 13 – Disability by Type Table 14 – Disability by Age Group Map 14 – Disability by Type – Ambulatory, Self Care and Independent Living Map 14 – Disability by Type – Vision, Hearing and Cognitive Map 15 – Disability by Age Group
Three areas were identified in order to assess this section. These areas are summarized bylocation, by disability and whether the locale is found in a R/ECAP. The areas identified do notcorrelate with segregated areas.
1. Location : Western Hidalgo County (County line to the MSA)Disability Dispersed/Congregated Age Dispersed/CongregatedHearing Dispersed 5 – 17 Years Old Lightly DispersedVision Dispersed 18 – 64 Years Old Moderately DispersedCognitive Dispersed Over 64 Years Lightly DispersedR/ECAP: In a R/ECAP
2. Location: McAllen -, Mission – Edinburg (MSA)Disability Dispersed/Congregated Age Dispersed/CongregatedHearing Congregated 5 – 17 Years Old Moderately DispersedVision Congregated 18 – 64 Years Old CongregatedCognitive Congregated Over 64 Years Moderately DispersedR/ECAP: Out of a R/ECAP
3. Location: Eastern Hidalgo County (MSA to County line)Disability Dispersed/Congregated Age Dispersed/CongregatedHearing Dispersed 5 – 17 Years Old Lightly DispersedVision Dispersed 18 – 64 Years Old Moderately DispersedCognitive Dispersed Over 64 Years Moderately DispersedR/ECAP: In a R/ECAP
b. Describe whether these geographic patterns vary for persons with each typeof disability or for persons with disabilities in different age ranges.
Persons with disabilities more frequently reside within the MSA. However,significant portions of the population outside of the MSA have one of the threedisabilities. The same type of geographic pattern occurs for the different agegroups.
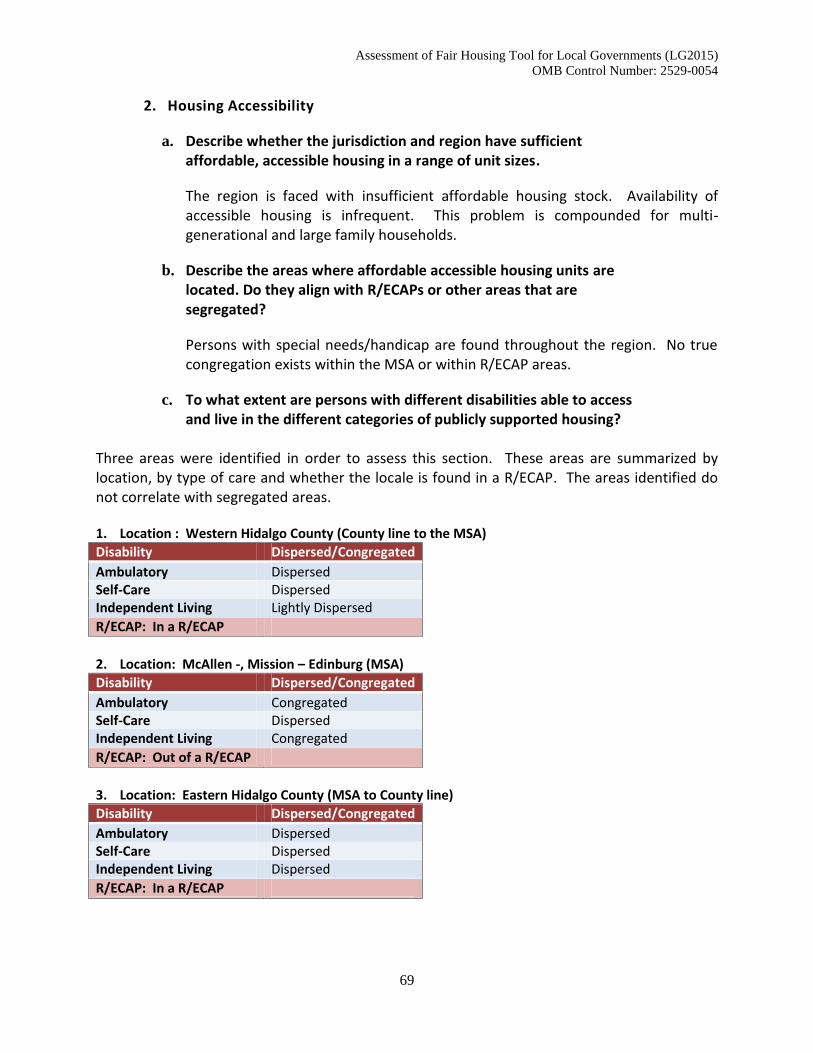
Assessment of Fair Housing Tool for Local Governments (LG2015)OMB Control Number: 2529-0054
69
2. Housing Accessibility
a. Describe whether the jurisdiction and region have sufficientaffordable, accessible housing in a range of unit sizes.
The region is faced with insufficient affordable housing stock. Availability ofaccessible housing is infrequent. This problem is compounded for multi-generational and large family households.
b. Describe the areas where affordable accessible housing units arelocated. Do they align with R/ECAPs or other areas that aresegregated?
Persons with special needs/handicap are found throughout the region. No truecongregation exists within the MSA or within R/ECAP areas.
c. To what extent are persons with different disabilities able to accessand live in the different categories of publicly supported housing?
Three areas were identified in order to assess this section. These areas are summarized bylocation, by type of care and whether the locale is found in a R/ECAP. The areas identified donot correlate with segregated areas.
1. Location : Western Hidalgo County (County line to the MSA)Disability Dispersed/CongregatedAmbulatory DispersedSelf-Care DispersedIndependent Living Lightly DispersedR/ECAP: In a R/ECAP
2. Location: McAllen -, Mission – Edinburg (MSA)Disability Dispersed/CongregatedAmbulatory CongregatedSelf-Care DispersedIndependent Living CongregatedR/ECAP: Out of a R/ECAP
3. Location: Eastern Hidalgo County (MSA to County line)Disability Dispersed/CongregatedAmbulatory DispersedSelf-Care DispersedIndependent Living DispersedR/ECAP: In a R/ECAP
Assessment of Fair Housing Tool for Local Governments (LG2015)OMB Control Number: 2529-0054
70
3. Integration of Persons with Disabilities Living in Institutions and Other SegregatedSettings
a. To what extent do persons with disabilities in or from thejurisdiction or region reside in segregated or integrated settings?
No concentration of persons with disability appears within the region.Further, since the region does not contain segregated settings, it maybe inferred that persons with disabilities are integrated within thecommunity/region.
b. Describe the range of options for persons with disabilities to accessaffordable housing and supportive services.
Local affordable housing and supportive service providers have madehome modification programs available for persons with disabilities.Requirements for the use of federal funds have further madeavailable affordable and accessible housing units in both the renterand home-owner markets.
4. Disparities in Access to Opportunity
a. To what extent are persons with disabilities able to access the following?Identify major barriers faced concerning:
i. Government services and facilities
ii. Public infrastructure (e.g., sidewalks, pedestrian crossings, pedestriansignals)
iii. Transportation
iv. Proficient schools and educational programs
v. Jobs
Based on the community-wide survey, barriers to accessing facilities and servicesin the above listed continue to exist for persons with disabilities. In particular,government facilities, public infrastructure, and transportation were noted aschallenging for persons with disabilities.
b. Describe the processes that exist in the jurisdiction and region for persons withdisabilities to request and obtain reasonable accommodations and accessibilitymodifications to address the barriers discussed above.
Assessment of Fair Housing Tool for Local Governments (LG2015)OMB Control Number: 2529-0054
71
In order to request reasonable accommodations and accessibility modifications,persons often begin with a verbal request. Should the modification be delayed,the verbal request might be followed by a written request and/or legal recourse.In most cases, attention to the issue is prompt even if physical modifications toaddress the barriers are latent.
c. Describe any difficulties in achieving homeownership experienced by personswith disabilities and by persons with different types of disabilities.
Hindrances to achieving homeownership for persons with disabilities mirror thehindrances for the general population. Hindrances may include lack of financialmeans, readiness, and knowledge regarding appropriate lending and applicabilityof municipal/county regulations. Nonetheless, persons with disabilities faceincreased obstacles when intending to purchase an established home.Modifications to address the individuals/families needs may further increase thecost of housing as well as extend the period before the unit is readily available.
5. Disproportionate Housing Needs
a. Describe any disproportionate housing needs experienced by persons withdisabilities and by persons with certain types of disabilities.
Upon review of HUD’s maps and tables, no data was available to determinewhether disproportionate housing needs exist for persons with disabilities.However, in viewing where persons with disabilities and where personsexperiencing one of the four housing problems reside, overlap occurs. It can beinferred that persons with disabilities are faced with similar challenges.
6. Additional Information
a. Beyond the HUD-provided data, provide additional relevant information, ifany, about disability and access issues in the jurisdiction and region affectinggroups with other protected characteristics.
N/A
b. The program participant may also describe other information relevant to itsassessment of disability and access issues.
Based on the community survey, physical therapy and occupational therapy, aswell as, provision of glasses (vision) were most frequently noted as servicesaccessed by households for whom a person of special needs/handicap resides.The services which would most improve quality of life for persons with a
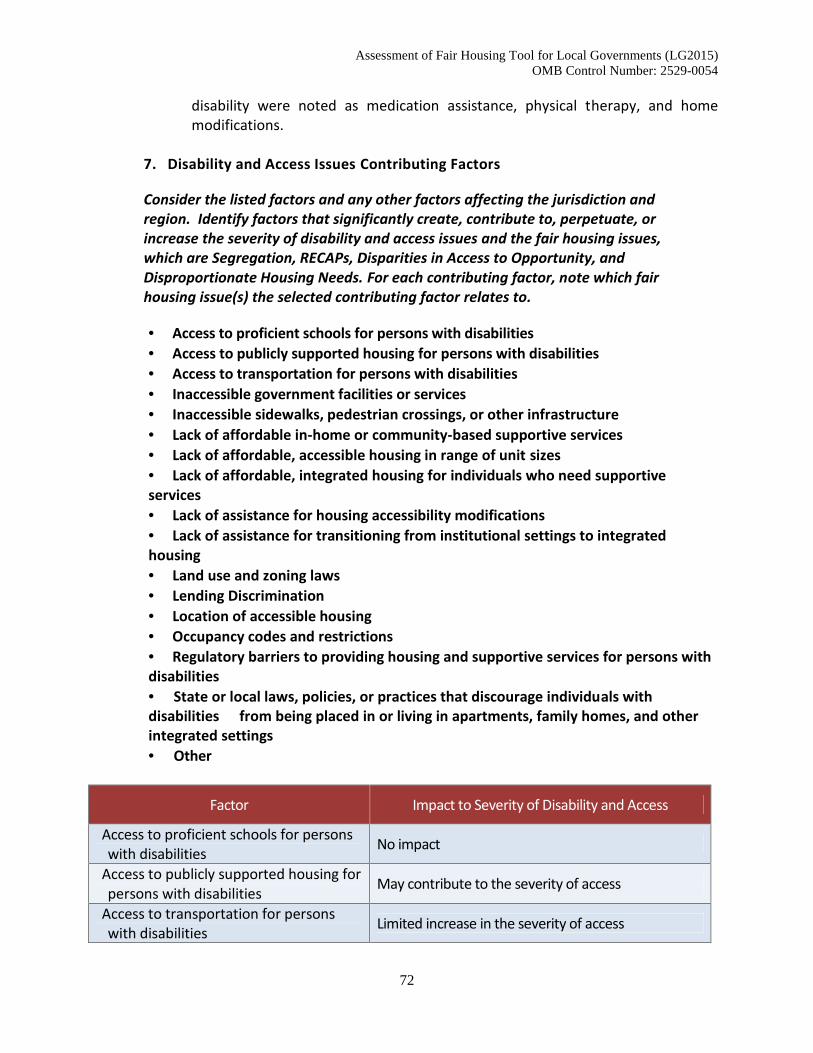
Assessment of Fair Housing Tool for Local Governments (LG2015)OMB Control Number: 2529-0054
72
disability were noted as medication assistance, physical therapy, and homemodifications.
7. Disability and Access Issues Contributing Factors
Consider the listed factors and any other factors affecting the jurisdiction andregion. Identify factors that significantly create, contribute to, perpetuate, orincrease the severity of disability and access issues and the fair housing issues,which are Segregation, RECAPs, Disparities in Access to Opportunity, andDisproportionate Housing Needs. For each contributing factor, note which fairhousing issue(s) the selected contributing factor relates to.
Access to proficient schools for persons with disabilities Access to publicly supported housing for persons with disabilities Access to transportation for persons with disabilities Inaccessible government facilities or services Inaccessible sidewalks, pedestrian crossings, or other infrastructure Lack of affordable in-home or community-based supportive services Lack of affordable, accessible housing in range of unit sizes Lack of affordable, integrated housing for individuals who need supportiveservices Lack of assistance for housing accessibility modifications Lack of assistance for transitioning from institutional settings to integratedhousing Land use and zoning laws Lending Discrimination Location of accessible housing Occupancy codes and restrictions Regulatory barriers to providing housing and supportive services for persons withdisabilities State or local laws, policies, or practices that discourage individuals withdisabilities from being placed in or living in apartments, family homes, and otherintegrated settings Other
Factor Impact to Severity of Disability and Access
Access to proficient schools for personswith disabilities No impact
Access to publicly supported housing forpersons with disabilities May contribute to the severity of access
Access to transportation for personswith disabilities Limited increase in the severity of access
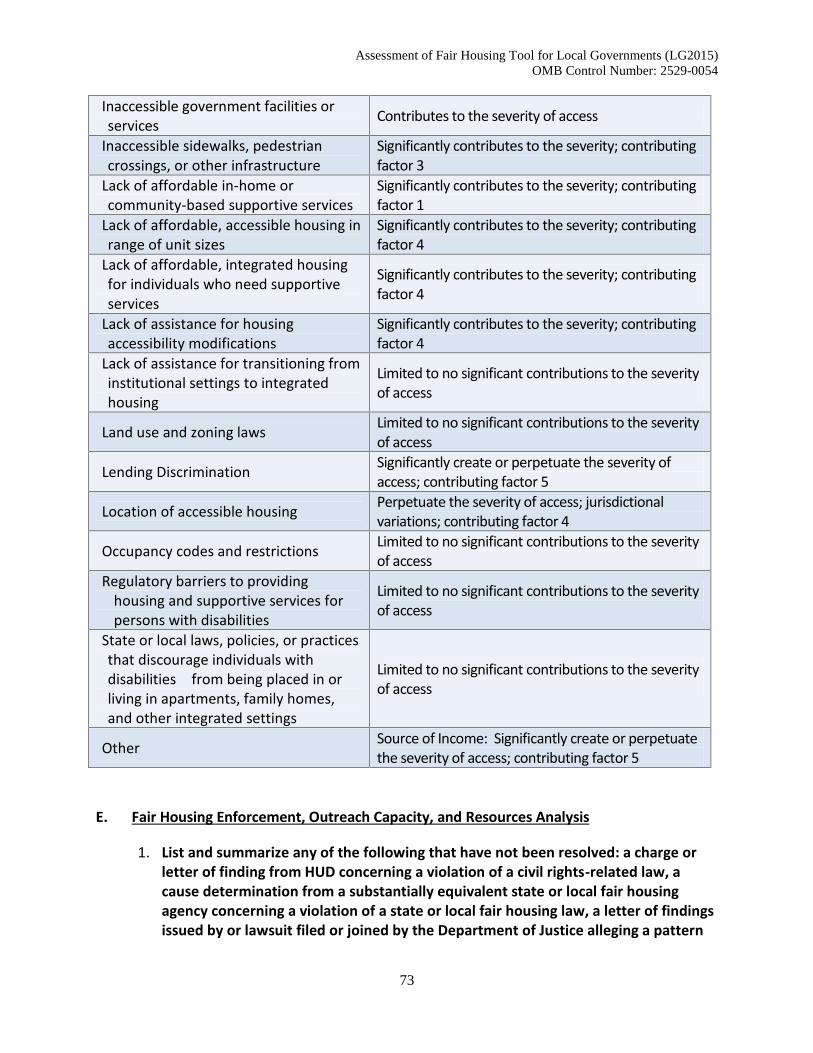
Assessment of Fair Housing Tool for Local Governments (LG2015)OMB Control Number: 2529-0054
73
Inaccessible government facilities orservices Contributes to the severity of access
Inaccessible sidewalks, pedestriancrossings, or other infrastructure
Significantly contributes to the severity; contributingfactor 3
Lack of affordable in-home orcommunity-based supportive services
Significantly contributes to the severity; contributingfactor 1
Lack of affordable, accessible housing inrange of unit sizes
Significantly contributes to the severity; contributingfactor 4
Lack of affordable, integrated housingfor individuals who need supportiveservices
Significantly contributes to the severity; contributingfactor 4
Lack of assistance for housingaccessibility modifications
Significantly contributes to the severity; contributingfactor 4
Lack of assistance for transitioning frominstitutional settings to integratedhousing
Limited to no significant contributions to the severityof access
Land use and zoning laws Limited to no significant contributions to the severityof access
Lending Discrimination Significantly create or perpetuate the severity ofaccess; contributing factor 5
Location of accessible housing Perpetuate the severity of access; jurisdictionalvariations; contributing factor 4
Occupancy codes and restrictions Limited to no significant contributions to the severityof access
Regulatory barriers to providinghousing and supportive services forpersons with disabilities
Limited to no significant contributions to the severityof access
State or local laws, policies, or practicesthat discourage individuals withdisabilities from being placed in orliving in apartments, family homes,and other integrated settings
Limited to no significant contributions to the severityof access
Other Source of Income: Significantly create or perpetuatethe severity of access; contributing factor 5
E. Fair Housing Enforcement, Outreach Capacity, and Resources Analysis
1. List and summarize any of the following that have not been resolved: a charge orletter of finding from HUD concerning a violation of a civil rights-related law, acause determination from a substantially equivalent state or local fair housingagency concerning a violation of a state or local fair housing law, a letter of findingsissued by or lawsuit filed or joined by the Department of Justice alleging a pattern
Assessment of Fair Housing Tool for Local Governments (LG2015)OMB Control Number: 2529-0054
74
or practice or systemic violation of a fair housing or civil rights law, or a claim underthe False Claims Act related to fair housing, nondiscrimination, or civil rightsgenerally, including an alleged failure to affirmatively further fair housing.
N/A
2. Describe any state or local fair housing laws. What characteristics are protectedunder each law?
Local fair housing laws mirror the Federal fair housing law. Protected classes arebased on race, color, religion, sex, handicap, national origin and familial status.However, some jurisdictional variations exist.
3. Identify any local and regional agencies and organizations that provide fair housinginformation, outreach, and enforcement, including their capacity and the resourcesavailable to them.
The Fair Housing Council of Greater San Antonio was contacted regarding thedevelopment of this AFH document. The agency serves as a Fair Housing InitiativesProgram (FHIP) grantee for the region. In addition, Texas Rural Legal Aid providedcomments during stakeholder meetings and in one-to-one conversations. Bothorganizations serve to provide fair housing information, outreach and assistance forpersons with fair housing issues.
4. Additional Information
a. Provide additional relevant information, if any, about fair housingenforcement, outreach capacity, and resources in the jurisdiction and region.
N/A
b. The program participant may also include information relevant to programs,actions, or activities to promote fair housing outcomes and capacity.
In an effort to encourage participation in the development of this AFH document,representatives from Texas Low Income Housing Information Service and TexasLegal Aid assisted in obtaining the views and concerns of colonia residents. Coloniasare located outside of the MSA and are within R/ECAP areas.
5. Fair Housing Enforcement, Outreach Capacity, and Resources Contributing Factors
Consider the listed factors and any other factors affecting the jurisdiction andregion. Identify factors that significantly create, contribute to, perpetuate, orincrease the severity of fair housing enforcement, outreach capacity, and resourcesand the fair housing issues, which are Segregation, RECAPs, Disparities in Access to
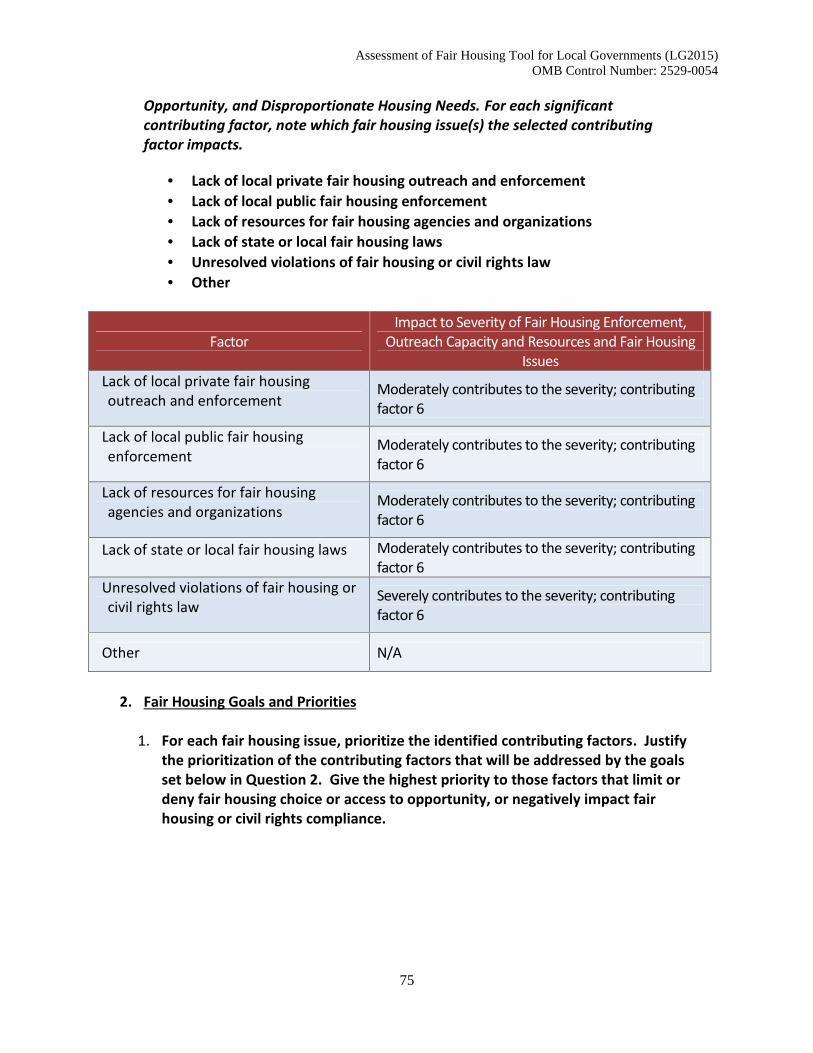
Assessment of Fair Housing Tool for Local Governments (LG2015)OMB Control Number: 2529-0054
75
Opportunity, and Disproportionate Housing Needs. For each significantcontributing factor, note which fair housing issue(s) the selected contributingfactor impacts.
Lack of local private fair housing outreach and enforcement Lack of local public fair housing enforcement Lack of resources for fair housing agencies and organizations Lack of state or local fair housing laws Unresolved violations of fair housing or civil rights law Other
FactorImpact to Severity of Fair Housing Enforcement,
Outreach Capacity and Resources and Fair HousingIssues
Lack of local private fair housingoutreach and enforcement
Moderately contributes to the severity; contributingfactor 6
Lack of local public fair housingenforcement
Moderately contributes to the severity; contributingfactor 6
Lack of resources for fair housingagencies and organizations
Moderately contributes to the severity; contributingfactor 6
Lack of state or local fair housing laws Moderately contributes to the severity; contributingfactor 6
Unresolved violations of fair housing orcivil rights law
Severely contributes to the severity; contributingfactor 6
Other N/A
2. Fair Housing Goals and Priorities
1. For each fair housing issue, prioritize the identified contributing factors. Justifythe prioritization of the contributing factors that will be addressed by the goalsset below in Question 2. Give the highest priority to those factors that limit ordeny fair housing choice or access to opportunity, or negatively impact fairhousing or civil rights compliance.
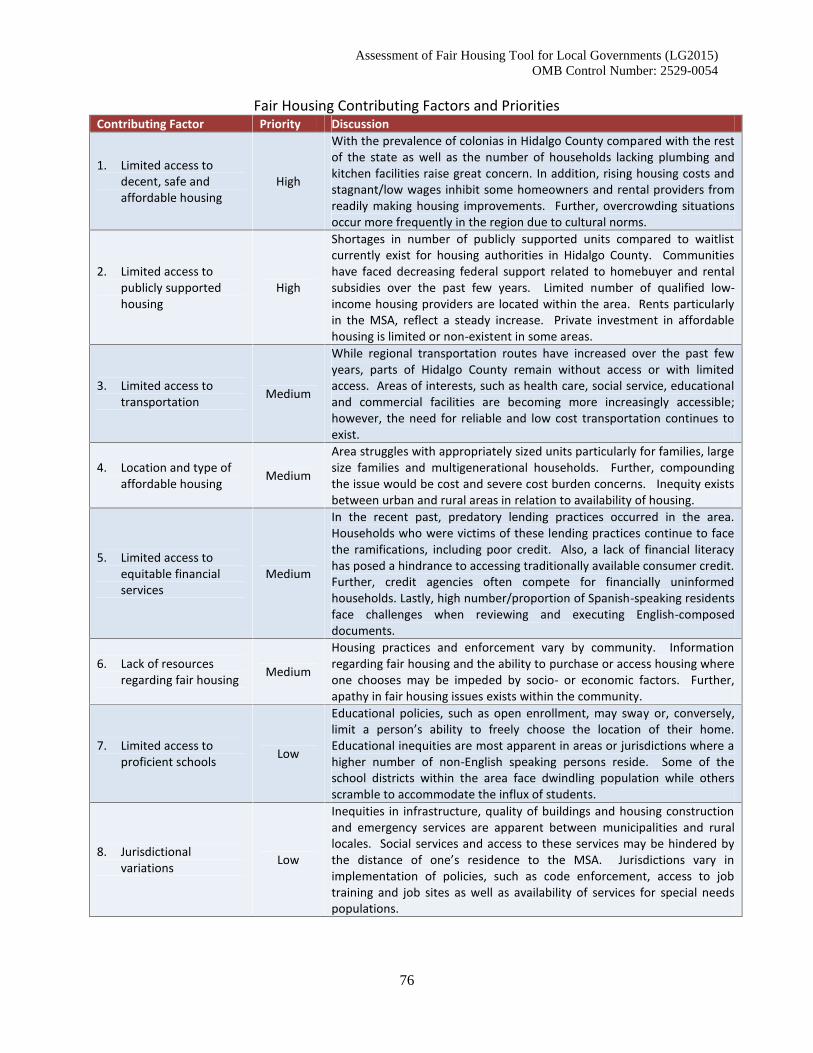
Assessment of Fair Housing Tool for Local Governments (LG2015)OMB Control Number: 2529-0054
76
Fair Housing Contributing Factors and PrioritiesContributing Factor Priority Discussion
1. Limited access todecent, safe andaffordable housing
High
With the prevalence of colonias in Hidalgo County compared with the restof the state as well as the number of households lacking plumbing andkitchen facilities raise great concern. In addition, rising housing costs andstagnant/low wages inhibit some homeowners and rental providers fromreadily making housing improvements. Further, overcrowding situationsoccur more frequently in the region due to cultural norms.
2. Limited access topublicly supportedhousing
High
Shortages in number of publicly supported units compared to waitlistcurrently exist for housing authorities in Hidalgo County. Communitieshave faced decreasing federal support related to homebuyer and rentalsubsidies over the past few years. Limited number of qualified low-income housing providers are located within the area. Rents particularlyin the MSA, reflect a steady increase. Private investment in affordablehousing is limited or non-existent in some areas.
3. Limited access totransportation Medium
While regional transportation routes have increased over the past fewyears, parts of Hidalgo County remain without access or with limitedaccess. Areas of interests, such as health care, social service, educationaland commercial facilities are becoming more increasingly accessible;however, the need for reliable and low cost transportation continues toexist.
4. Location and type ofaffordable housing Medium
Area struggles with appropriately sized units particularly for families, largesize families and multigenerational households. Further, compoundingthe issue would be cost and severe cost burden concerns. Inequity existsbetween urban and rural areas in relation to availability of housing.
5. Limited access toequitable financialservices
Medium
In the recent past, predatory lending practices occurred in the area.Households who were victims of these lending practices continue to facethe ramifications, including poor credit. Also, a lack of financial literacyhas posed a hindrance to accessing traditionally available consumer credit.Further, credit agencies often compete for financially uninformedhouseholds. Lastly, high number/proportion of Spanish-speaking residentsface challenges when reviewing and executing English-composeddocuments.
6. Lack of resourcesregarding fair housing Medium
Housing practices and enforcement vary by community. Informationregarding fair housing and the ability to purchase or access housing whereone chooses may be impeded by socio- or economic factors. Further,apathy in fair housing issues exists within the community.
7. Limited access toproficient schools Low
Educational policies, such as open enrollment, may sway or, conversely,limit a person’s ability to freely choose the location of their home.Educational inequities are most apparent in areas or jurisdictions where ahigher number of non-English speaking persons reside. Some of theschool districts within the area face dwindling population while othersscramble to accommodate the influx of students.
8. Jurisdictionalvariations Low
Inequities in infrastructure, quality of buildings and housing constructionand emergency services are apparent between municipalities and rurallocales. Social services and access to these services may be hindered bythe distance of one’s residence to the MSA. Jurisdictions vary inimplementation of policies, such as code enforcement, access to jobtraining and job sites as well as availability of services for special needspopulations.
Assessment of Fair Housing Tool for Local Governments (LG2015)OMB Control Number: 2529-0054
77
2. For each fair housing issue with significant contributing factors identified inQuestion 1, set one or more goals. Explain how each goal is designed to overcomethe identified contributing factor and related fair housing issue(s). For goalsdesigned to overcome more than one fair housing issue, explain how the goal willovercome each issue and the related contributing factors. For each goal, identifymetrics and milestones for determining what fair housing results will be achieved,and indicate the timeframe for achievement.
The goals and strategies listed herein provide a framework for action to address these fairhousing issues and contributing factors. Such actions will be undertaken in the coming yearsthrough efforts by the County, Cities and PHAs in conjunction with community stakeholders.The following chart summarizes goals, contributing factors, fair housing issues and metrics andtimeframe:
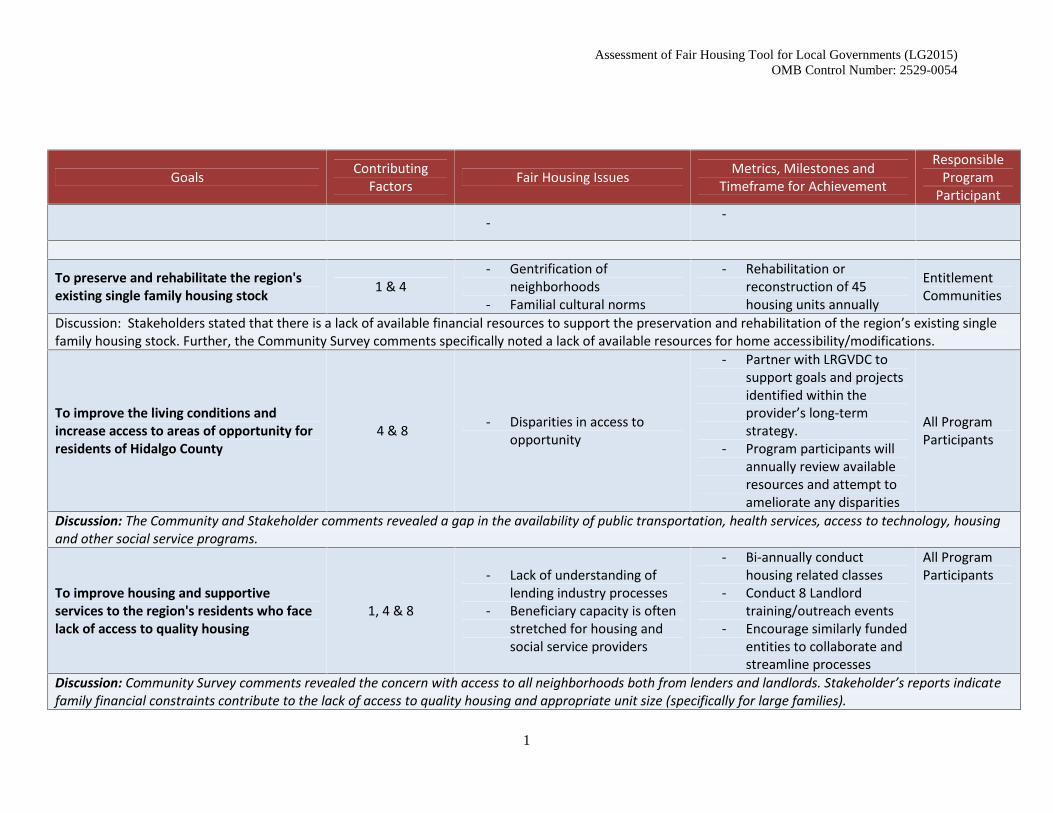
Assessment of Fair Housing Tool for Local Governments (LG2015)OMB Control Number: 2529-0054
1
Goals ContributingFactors Fair Housing Issues Metrics, Milestones and
Timeframe for Achievement
ResponsibleProgram
Participant
- -
To preserve and rehabilitate the region'sexisting single family housing stock 1 & 4
- Gentrification ofneighborhoods
- Familial cultural norms
- Rehabilitation orreconstruction of 45housing units annually
EntitlementCommunities
Discussion: Stakeholders stated that there is a lack of available financial resources to support the preservation and rehabilitation of the region’s existing singlefamily housing stock. Further, the Community Survey comments specifically noted a lack of available resources for home accessibility/modifications.
To improve the living conditions andincrease access to areas of opportunity forresidents of Hidalgo County
4 & 8 - Disparities in access toopportunity
- Partner with LRGVDC tosupport goals and projectsidentified within theprovider’s long-termstrategy.
- Program participants willannually review availableresources and attempt toameliorate any disparities
All ProgramParticipants
Discussion: The Community and Stakeholder comments revealed a gap in the availability of public transportation, health services, access to technology, housingand other social service programs.
To improve housing and supportiveservices to the region's residents who facelack of access to quality housing
1, 4 & 8
- Lack of understanding oflending industry processes
- Beneficiary capacity is oftenstretched for housing andsocial service providers
- Bi-annually conducthousing related classes
- Conduct 8 Landlordtraining/outreach events
- Encourage similarly fundedentities to collaborate andstreamline processes
All ProgramParticipants
Discussion: Community Survey comments revealed the concern with access to all neighborhoods both from lenders and landlords. Stakeholder’s reports indicatefamily financial constraints contribute to the lack of access to quality housing and appropriate unit size (specifically for large families).
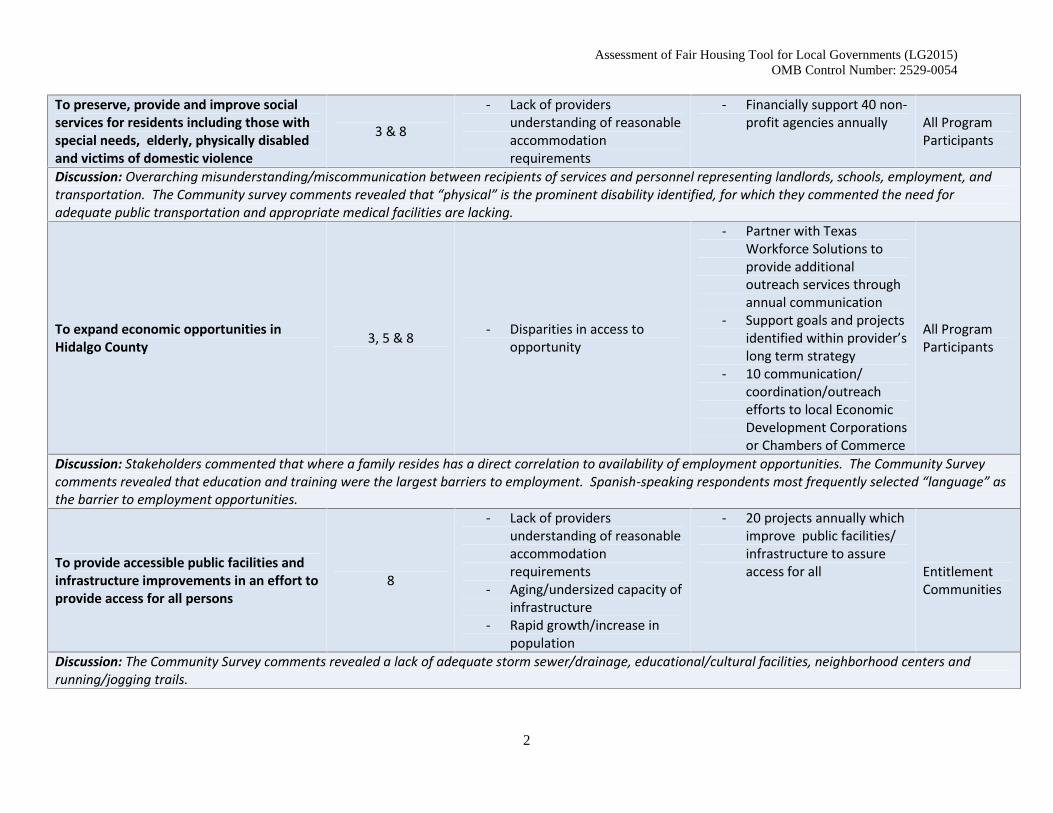
Assessment of Fair Housing Tool for Local Governments (LG2015)OMB Control Number: 2529-0054
2
To preserve, provide and improve socialservices for residents including those withspecial needs, elderly, physically disabledand victims of domestic violence
3 & 8
- Lack of providersunderstanding of reasonableaccommodationrequirements
- Financially support 40 non-profit agencies annually All Program
Participants
Discussion: Overarching misunderstanding/miscommunication between recipients of services and personnel representing landlords, schools, employment, andtransportation. The Community survey comments revealed that “physical” is the prominent disability identified, for which they commented the need foradequate public transportation and appropriate medical facilities are lacking.
To expand economic opportunities inHidalgo County 3, 5 & 8 - Disparities in access to
opportunity
- Partner with TexasWorkforce Solutions toprovide additionaloutreach services throughannual communication
- Support goals and projectsidentified within provider’slong term strategy
- 10 communication/coordination/outreachefforts to local EconomicDevelopment Corporationsor Chambers of Commerce
All ProgramParticipants
Discussion: Stakeholders commented that where a family resides has a direct correlation to availability of employment opportunities. The Community Surveycomments revealed that education and training were the largest barriers to employment. Spanish-speaking respondents most frequently selected “language” asthe barrier to employment opportunities.
To provide accessible public facilities andinfrastructure improvements in an effort toprovide access for all persons
8
- Lack of providersunderstanding of reasonableaccommodationrequirements
- Aging/undersized capacity ofinfrastructure
- Rapid growth/increase inpopulation
- 20 projects annually whichimprove public facilities/infrastructure to assureaccess for all Entitlement
Communities
Discussion: The Community Survey comments revealed a lack of adequate storm sewer/drainage, educational/cultural facilities, neighborhood centers andrunning/jogging trails.
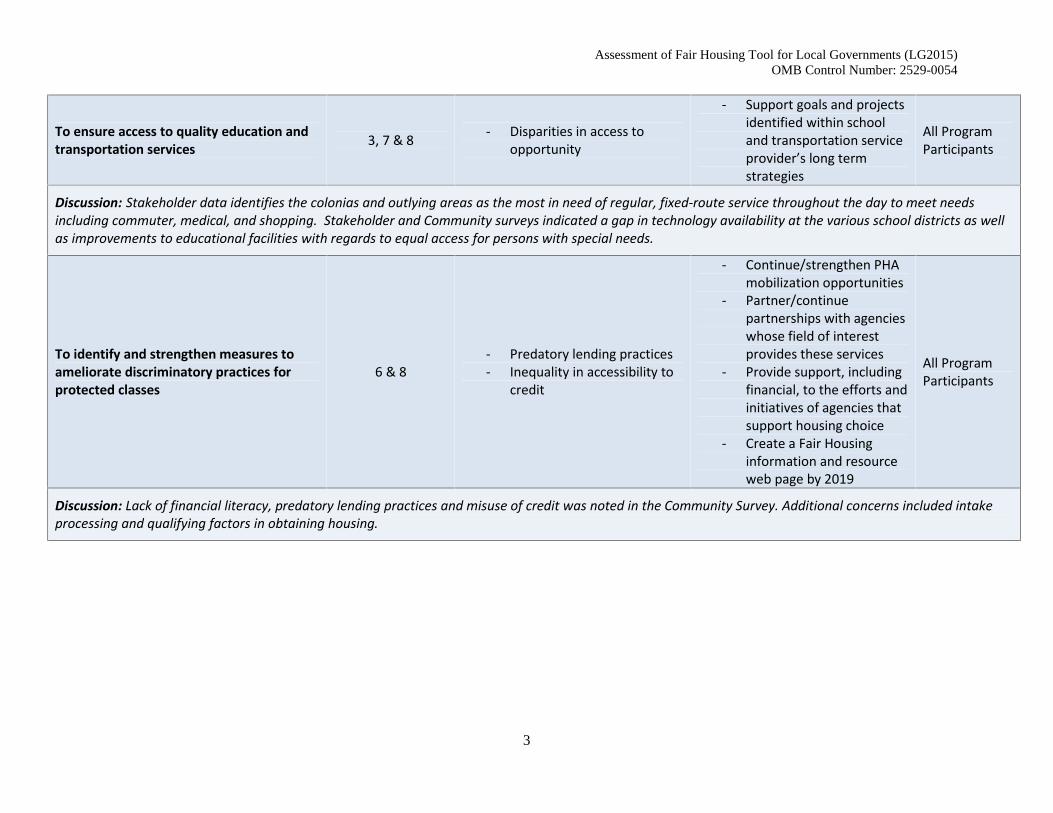
Assessment of Fair Housing Tool for Local Governments (LG2015)OMB Control Number: 2529-0054
3
To ensure access to quality education andtransportation services 3, 7 & 8 - Disparities in access to
opportunity
- Support goals and projectsidentified within schooland transportation serviceprovider’s long termstrategies
All ProgramParticipants
Discussion: Stakeholder data identifies the colonias and outlying areas as the most in need of regular, fixed-route service throughout the day to meet needsincluding commuter, medical, and shopping. Stakeholder and Community surveys indicated a gap in technology availability at the various school districts as wellas improvements to educational facilities with regards to equal access for persons with special needs.
To identify and strengthen measures toameliorate discriminatory practices forprotected classes
6 & 8- Predatory lending practices- Inequality in accessibility to
credit
- Continue/strengthen PHAmobilization opportunities
- Partner/continuepartnerships with agencieswhose field of interestprovides these services
- Provide support, includingfinancial, to the efforts andinitiatives of agencies thatsupport housing choice
- Create a Fair Housinginformation and resourceweb page by 2019
All ProgramParticipants
Discussion: Lack of financial literacy, predatory lending practices and misuse of credit was noted in the Community Survey. Additional concerns included intakeprocessing and qualifying factors in obtaining housing.
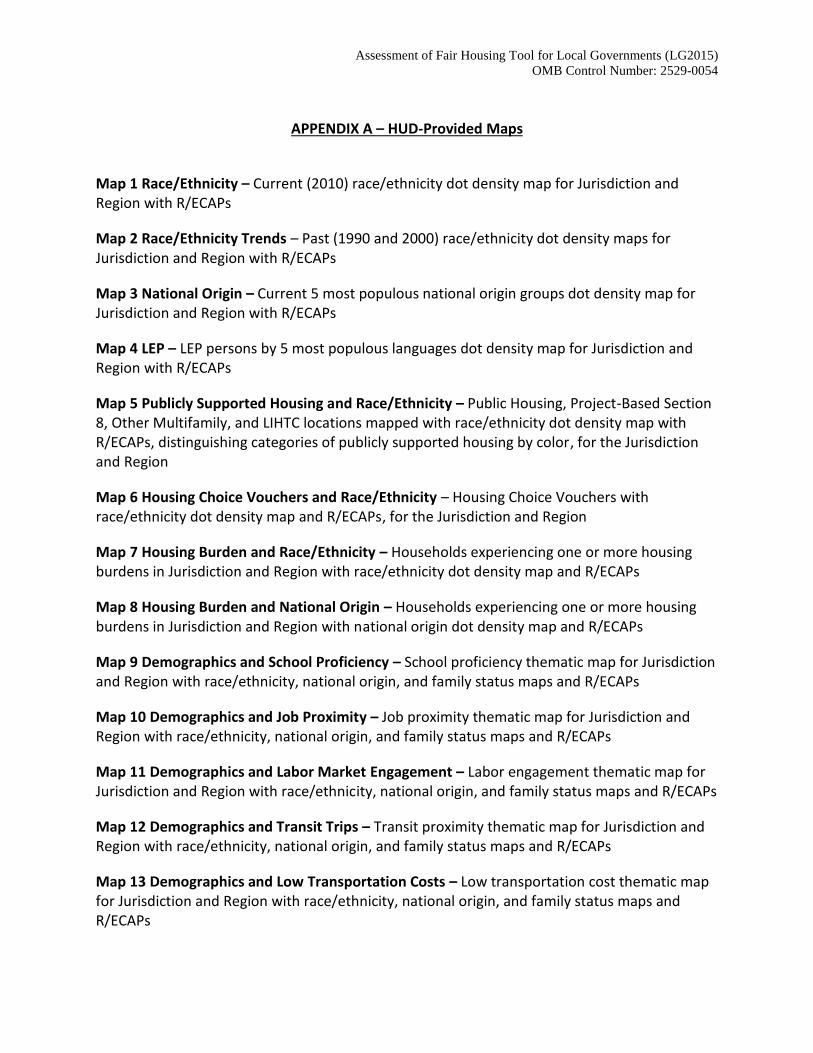
Assessment of Fair Housing Tool for Local Governments (LG2015)OMB Control Number: 2529-0054
APPENDIX A – HUD-Provided Maps
Map 1 Race/Ethnicity – Current (2010) race/ethnicity dot density map for Jurisdiction andRegion with R/ECAPs
Map 2 Race/Ethnicity Trends – Past (1990 and 2000) race/ethnicity dot density maps forJurisdiction and Region with R/ECAPs
Map 3 National Origin – Current 5 most populous national origin groups dot density map forJurisdiction and Region with R/ECAPs
Map 4 LEP – LEP persons by 5 most populous languages dot density map for Jurisdiction andRegion with R/ECAPs
Map 5 Publicly Supported Housing and Race/Ethnicity – Public Housing, Project-Based Section8, Other Multifamily, and LIHTC locations mapped with race/ethnicity dot density map withR/ECAPs, distinguishing categories of publicly supported housing by color, for the Jurisdictionand Region
Map 6 Housing Choice Vouchers and Race/Ethnicity – Housing Choice Vouchers withrace/ethnicity dot density map and R/ECAPs, for the Jurisdiction and Region
Map 7 Housing Burden and Race/Ethnicity – Households experiencing one or more housingburdens in Jurisdiction and Region with race/ethnicity dot density map and R/ECAPs
Map 8 Housing Burden and National Origin – Households experiencing one or more housingburdens in Jurisdiction and Region with national origin dot density map and R/ECAPs
Map 9 Demographics and School Proficiency – School proficiency thematic map for Jurisdictionand Region with race/ethnicity, national origin, and family status maps and R/ECAPs
Map 10 Demographics and Job Proximity – Job proximity thematic map for Jurisdiction andRegion with race/ethnicity, national origin, and family status maps and R/ECAPs
Map 11 Demographics and Labor Market Engagement – Labor engagement thematic map forJurisdiction and Region with race/ethnicity, national origin, and family status maps and R/ECAPs
Map 12 Demographics and Transit Trips – Transit proximity thematic map for Jurisdiction andRegion with race/ethnicity, national origin, and family status maps and R/ECAPs
Map 13 Demographics and Low Transportation Costs – Low transportation cost thematic mapfor Jurisdiction and Region with race/ethnicity, national origin, and family status maps andR/ECAPs
Assessment of Fair Housing Tool for Local Governments (LG2015)OMB Control Number: 2529-0054
2
Map 14 Demographics and Poverty – Low poverty thematic map for Jurisdiction and Regionwith race/ethnicity, national origin, and family status maps and R/ECAPs
Map 15 Demographics and Environmental Health – Environmental health thematic map forJurisdiction and Region with race/ethnicity, national origin, and family status maps withR/ECAPs
Map 16 Disability by Type – Population of persons with disabilities dot density map by personswith vision, hearing, cognitive, ambulatory, self-care, and independent living difficulties withR/ECAPs for Jurisdiction and Region
Map 17 Disability by Age Group – All persons with disabilities by age range (5-17; 18-64; and65+) dot density map with R/ECAPs for Jurisdiction and Region
Assessment of Fair Housing Tool for Local Governments (LG2015)OMB Control Number: 2529-0054
APPENDIX B – HUD-Provided Tables
Table 1 Demographics – Tabular demographic data for Jurisdiction and Region (including totalpopulation, the number and percentage of persons by race/ethnicity, national origin (10 mostpopulous), LEP (10 most populous), disability (by disability type), sex, age range (under 18, 18-64, 65+), and households with children)
Table 2 Demographic Trends – Tabular demographic trend data for Jurisdiction and Region(including the number and percentage of persons by race/ethnicity, total national origin(foreign born), total LEP, sex, age range (under 18, 18-64, 65+), and households with children)
Table 3 Racial/Ethnic Dissimilarity – Tabular race/ethnicity dissimilarity index for Jurisdictionand Region
Table 4 R/ECAP Demographics – Tabular data for the percentage of racial/ethnic groups,families with children, and national origin groups (10 most populous) for the Jurisdiction andRegion who reside in R/ECAPs
Table 5 Publicly Supported Housing Units by Program Category – Tabular data for total unitsby 4 categories of publicly supported housing in the Jurisdiction (Public Housing, Project-BasedSection 8, Other Multifamily, Housing Choice Voucher (HCV) Program) for the Jurisdiction
Table 6 Publicly Supported Housing Residents by Race/Ethnicity – Tabular race/ethnicity datafor 4 categories of publicly supported housing (Public Housing, Project-Based Section 8, OtherMultifamily, HCV) in the Jurisdiction compared to the population as a whole, and to personsearning 30% AMI, in the Jurisdiction
Table 7 R/ECAP and Non-R/ECAP Demographics by Publicly Supported Housing ProgramCategory – Tabular data on publicly supported housing units and R/ECAPs for the Jurisdiction
Table 8 Demographics of Publicly Supported Housing Developments by Program Category –Development level demographics by Public Housing, Project-Based Section 8, and OtherMultifamily1 for the Jurisdiction
Table 9 Demographics of Households with Disproportionate Housing Needs – Tabular data oftotal households in the Jurisdiction and Region and the total number and percentage ofhouseholds experiencing one or more housing burdens by race/ethnicity and family size in theJurisdiction and Region
1 Please note that, for the first year, census tract level demographic data in which publicly supported housingdevelopments are located, also including LIHTC developments, are available through the AFFH Data and MappingTool which includes a data query function and ability to export tables.
Assessment of Fair Housing Tool for Local Governments (LG2015)OMB Control Number: 2529-0054
2
Table 10 Demographics of Households with Severe Housing Cost Burden – Tabular data of thetotal number of households in the Jurisdiction and Region and the number and percentage ofhouseholds experiencing severe housing burdens by race/ethnicity for the Jurisdiction andRegion
Table 11 Publicly Supported Housing by Program Category: Units by Number of Bedroomsand Number of Children – Tabular data on the number of bedrooms for units of 4 categories ofpublicly supported housing (Public Housing, Project-Based Section 8, Other Multifamily, HCV)for the Jurisdiction
Table 12 Opportunity Indicators by Race/Ethnicity – Tabular data of opportunity indices forschool proficiency, jobs proximity, labor-market engagement, transit trips, low transportationcosts, low poverty, and environmental health for the Jurisdiction and Region by race/ethnicityand among households below the Federal poverty line.
Table 13 Disability by Type – Tabular data of persons with vision, hearing, cognitive,ambulatory, self-care, and independent living disabilities for the Jurisdiction and Region
Table 14 Disability by Age Group – Tabular data of persons with disabilities by age range (5-17,18-64, and 65+) for the Jurisdiction and Region
Table 15 Disability by Publicly Supported Housing Program Category – Tabular data ondisability and publicly supported housing for the Jurisdiction and Region
Assessment of Fair Housing Tool for Local Governments (LG2015)OMB Control Number: 2529-0054
APPENDIX C – Contributing Factors Descriptions
Access to financial servicesThe term “financial services” refers here to economic services provided by a range of qualityorganizations that manage money, including credit unions, banks, credit card companies, and insurancecompanies. These services would also include access to credit financing for mortgages, home equity,and home repair loans. Access to these services includes physical access - often dictated by the locationof banks or other physical infrastructure - as well as the ability to obtain credit, insurance or other keyfinancial services. Access may also include equitable treatment in receiving financial services, includingequal provision of information and equal access to mortgage modifications. For purposes of thiscontributing factor, financial services do not include predatory lending including predatory foreclosurepractices, storefront check cashing, payday loan services, and similar services. Gaps in banking servicescan make residents vulnerable to these types of predatory lending practices, and lack of access toquality banking and financial services may jeopardize an individual’s credit and the overall sustainabilityof homeownership and wealth accumulation.
Access to proficient schools for persons with disabilitiesIndividuals with disabilities may face unique barriers to accessing proficient schools. In somejurisdictions, some school facilities may not be accessible or may only be partially accessible toindividuals with different types of disabilities (often these are schools built before the enactment of theADA or the Rehabilitation Act of 1973). In general, a fully accessible building is a building that complieswith all of the ADA's requirements and has no barriers to entry for persons with mobility impairments.It enables students and parents with physical or sensory disabilities to access and use all areas of thebuilding and facilities to the same extent as students and parents without disabilities, enabling studentswith disabilities to attend classes and interact with students without disabilities to the fullest extent. Incontrast, a partially accessible building allows for persons with mobility impairments to enter and exitthe building, access all relevant programs, and have use of at least one restroom, but the entire buildingis not accessible and students or parents with disabilities may not access areas of the facility to the sameextent as students and parents without disabilities. In addition, in some instances school policies steerindividuals with certain types of disabilities to certain facilities or certain programs or certain programsdo not accommodate the disability-related needs of certain students.
Access to publicly supported housing for persons with disabilitiesThe lack of a sufficient number of accessible units or lack of access to key programs and services posesbarriers to individuals with disabilities seeking to live in publicly supported housing. For purposes of thisassessment, publicly supported housing refers to housing units that are subsidized by federal, state, orlocal entities. “Accessible housing” refers to housing that accords individuals with disabilities equalopportunity to use and enjoy a dwelling. The concept of “access” here includes physical access forindividuals with different types of disabilities (for example, ramps and other accessibility features forindividuals with mobility impairments, visual alarms and signals for individuals who are deaf or hard ofhearing, and audio signals, accessible signage, and other accessibility features for individuals who areblind or have low vision), as well as the provision of auxiliary aids and services to provide effectivecommunication for individuals who are deaf or hard of hearing, are blind or have low vision, orindividuals who have speech impairments. The concept of “access” here also includes programmaticaccess, which implicates such policies as application procedures, waitlist procedures, transferprocedures and reasonable accommodation procedures.
Assessment of Fair Housing Tool for Local Governments (LG2015)OMB Control Number: 2529-0054
2
Access to transportation for persons with disabilitiesIndividuals with disabilities may face unique barriers to accessing transportation, including both publicand private transportation, such as buses, rail services, taxis, and para-transit. The term “access” in thiscontext includes physical accessibility, policies, physical proximity, cost, safety, reliability, etc. It includesthe lack of accessible bus stops, the failure to make audio announcements for persons who are blind orhave low vision, and the denial of access to persons with service animals. The absence of or clusteringof accessible transportation and other transportation barriers may limit the housing choice of individualswith disabilities.
Admissions and occupancy policies and procedures, including preferences in publicly supportedhousingThe term “admissions and occupancy policies and procedures” refers here to the policies andprocedures used by publicly supported housing providers that affect who lives in the housing, includingpolicies and procedures related to marketing, advertising vacancies, applications, tenant selection,assignment, and maintained or terminated occupancy. Procedures that may relate to fair housinginclude, but are not limited to:
Admissions preferences (e.g. residency preference, preferences for local workforce, etc.) Application, admissions, and waitlist policies (e.g. in-person application requirements, rules
regarding applicant acceptance or rejection of units, waitlist time limitations, first come firstserve, waitlist maintenance, etc.).
Income thresholds for new admissions or for continued eligibility. Designations of housing developments (or portions of developments) for the elderly and/or
persons with disabilities. Occupancy limits. Housing providers’ policies for processing reasonable accommodations and modifications
requests. Credit or criminal record policies. Eviction policies and procedures.
The availability of affordable units in a range of sizesThe provision of affordable housing is often important to individuals with certain protectedcharacteristics because groups are disproportionately represented among those who would benefitfrom low-cost housing. What is “affordable” varies by circumstance, but an often used rule of thumb isthat a low- or moderate-income family can afford to rent or buy a decent-quality dwelling withoutspending more than 30 percent of its income. This contributing factor refers to the availability of unitsthat a low- or moderate-income family could rent or buy, including one bedroom units and multi-bedroom units for larger families. When considering availability, consider transportation costs, schoolquality, and other important factors in housing choice. Whether affordable units are available with agreater number of bedrooms and in a range of different geographic locations may be a particular barrierfacing families with children.
The availability, type, frequency, and reliability of public transportationPublic transportation is shared passenger transport service available for use by the general public,including buses, light rail, and rapid transit. Public transportation includes paratransit services forpersons with disabilities. The availability, type, frequency, and reliability of public transportation affectwhich households are connected to community assets and economic opportunities. Transportationpolicies that are premised upon the use of a personal vehicle may impact public transportation.
Assessment of Fair Housing Tool for Local Governments (LG2015)OMB Control Number: 2529-0054
3
“Availability” as used here includes geographic proximity, cost, safety and accessibility, as well aswhether the transportation connects individuals to places they need to go such as jobs, schools, retailestablishments, and healthcare. “Type” refers to method of transportation such as bus or rail.“Frequency” refers to the interval at which the transportation runs. “Reliability” includes such factors asan assessment of how often trips are late or delayed, the frequency of outages, and whether thetransportation functions in inclement weather.
Community oppositionThe opposition of community members to proposed or existing developments—including housingdevelopments, affordable housing, publicly supported housing (including use of housing choicevouchers), multifamily housing, or housing for persons with disabilities—is often referred to as “Not inmy Backyard,” or NIMBY-ism. This opposition is often expressed in protests, challenges to land-userequests or zoning waivers or variances, lobbying of decision-making bodies, or even harassment andintimidation. Community opposition can be based on factual concerns (concerns are concrete and notspeculative, based on rational, demonstrable evidence, focused on measurable impact on aneighborhood) or can be based on biases (concerns are focused on stereotypes, prejudice, and anxietyabout the new residents or the units in which they will live). Community opposition, when successful atblocking housing options, may limit or deny housing choice for individuals with certain protectedcharacteristics.
Deteriorated and abandoned propertiesThe term “deteriorated and abandoned properties” refers here to residential and commercial propertiesunoccupied by an owner or a tenant, which are in disrepair, unsafe, or in arrears on real property taxes.Deteriorated and abandoned properties may be signs of a community’s distress and disinvestment andare often associated with crime, increased risk to health and welfare, plunging decreasing propertyvalues, and municipal costs. The presence of multiple unused or abandoned properties in a particularneighborhood may have resulted from mortgage or property tax foreclosures. The presence of suchproperties can raise serious health and safety concerns and may also affect the ability of homeownerswith protected characteristics to access opportunity through the accumulation of home equity.Demolition without strategic revitalization and investment can result in further deterioration of alreadydamaged neighborhoods.
Displacement of residents due to economic pressuresThe term “displacement” refers here to a resident’s undesired departure from a place where anindividual has been living. “Economic pressures” may include, but are not limited to, rising rents, risingproperty taxes related to home prices, rehabilitation of existing structures, demolition of subsidizedhousing, loss of affordability restrictions, and public and private investments in neighborhoods. Suchpressures can lead to loss of existing affordable housing in areas experiencing rapid economic growthand a resulting loss of access to opportunity assets for lower income families that previously lived there.Where displacement disproportionately affects persons with certain protected characteristic, thedisplacement of residents due to economic pressures may exacerbate patterns of residentialsegregation.
Impediments to mobilityThe term “impediments to mobility” refers here to barriers faced by individuals and families whenattempting to move to a neighborhood or area of their choice, especially integrated areas and areas ofopportunity. This refers to both Housing Choice Vouchers and other public and private housing options.Many factors may impede mobility, including, but not limited to:
Assessment of Fair Housing Tool for Local Governments (LG2015)OMB Control Number: 2529-0054
4
Lack of quality mobility counseling. Mobility counseling is designed to assist families in movingfrom high-poverty to low-poverty neighborhoods that have greater access to opportunity assetsappropriate for each family (e.g. proficient schools for families with children or effective publictransportation.). Mobility counseling can include a range of options including, assistance forfamilies for “second moves” after they have accessed stable housing, and ongoing post-movesupport for families.
Lack of appropriate payment standards, including exception payment standards to the standardfair market rent (FMR). Because FMRs are generally set at the 40th percentile of themetropolitan-wide rent distribution, some of the most desirable neighborhoods do not have asignificant number of units available in the FMR range. Exception payment standards areseparate payment standard amounts within the basic range for a designated part of an FMRarea. Small areas FMRs, which vary by zip code, may be used in the determination of potentialexception payment standard levels to support a greater range of payment standards.
Jurisdictional fragmentation among multiple providers of publicly supported housing that servesingle metropolitan areas and lack of regional cooperation mechanisms, including PHAjurisdictional limitations.
HCV portability issues that prevent a household from using a housing assistance voucher issuedin one jurisdiction when moving to another jurisdiction where the program is administered by adifferent local PHA.
Lack of a consolidated waitlist for all assisted housing available in the metropolitan area. Discrimination based on source of income, including SSDI, Housing Choice Vouchers, or other
tenant-based rental assistance.
Inaccessible buildings, sidewalks, pedestrian crossings, or other infrastructureMany public buildings, sidewalks, pedestrian crossings, or other infrastructure components areinaccessible to individuals with disabilities including persons with mobility impairments, individuals whoare deaf or hard of hearing, and persons who are blind or have low vision. These accessibility issues canlimit realistic housing choice for individuals with disabilities. Inaccessibility is often manifest by the lackof curb cuts, lack of ramps, and the lack of audible pedestrian signals. While the Americans withDisabilities Act and related civil rights laws establish accessibility requirements for infrastructure, theselaws do not apply everywhere and/or may be inadequately enforced.
Inaccessible government facilities or servicesInaccessible government facilities and services may pose a barrier to fair housing choice for individualswith disabilities by limiting access to important community assets such as public meetings, socialservices, libraries, and recreational facilities. Note that the concept of accessibility includes bothphysical access (including to websites and other forms of communication) as well as policies andprocedures. While the Americans with Disabilities Act and related civil rights laws require that newlyconstructed and altered government facilities, as well as programs and services, be accessible toindividuals with disabilities, these laws may not apply in all circumstances and/or may be inadequatelyenforced.
Lack of affordable, accessible housing in a range of unit sizesWhat is “affordable” varies by circumstance, but an often used rule of thumb is that a low- or moderate-income family can afford to rent or buy a decent-quality dwelling without spending more than 30percent of its income. For purposes of this assessment, “accessible housing” refers to housing thataccords individuals with disabilities equal opportunity to use and enjoy a dwelling. Characteristics thataffect accessibility may include physical accessibility of units and public and common use areas of
Assessment of Fair Housing Tool for Local Governments (LG2015)OMB Control Number: 2529-0054
5
housing, as well as application procedures, such as first come first serve waitlists, inaccessible websitesor other technology, denial of access to individuals with assistance animals, or lack of information aboutaffordable accessible housing. The clustering of affordable, accessible housing with a range of unit sizesmay also limit fair housing choice for individuals with disabilities.
Lack of affordable in-home or community-based supportive servicesThe term “in-home or community-based supportive services” refers here to medical and othersupportive services available for targeted populations, such as individuals with mental illnesses,cognitive or developmental disabilities, and/or physical disabilities in their own home or community (asopposed to in institutional settings). Such services include personal care, assistance with housekeeping,transportation, in-home meal service, integrated adult day services and other services (including, butnot limited to, medical, social, education, transportation, housing, nutritional, therapeutic, behavioral,psychiatric, nursing, personal care, and respite). They also include assistance with activities of dailyliving such as bathing, dressing, eating, and using the toilet, shopping, managing money or medications,and various household management activities, such as doing laundry. Public entities must provideservices to individuals with disabilities in community settings rather than institutions when: 1) suchservices are appropriate to the needs of the individual; 2) the affected persons do not opposecommunity-based treatment; and 3) community-based services can be reasonably accommodated,taking into account the resources available to the public entity and the needs of others who arereceiving disability-related services from the entity. Assessing the cost and availability of these servicesis also an important consideration, including the role of state Medicaid agencies. The outreach ofgovernment entities around the availability of community supports to persons with disabilities ininstitutions may impact these individuals’ knowledge of such supports and their ability to transition tocommunity-based settings.
Lack of affordable, integrated housing for individuals who need supportive servicesWhat is “affordable” varies by the circumstances affecting the individual, and includes the cost ofhousing and services taken together. Integrated housing is housing where individuals with disabilitiescan live and interact with persons without disabilities to the fullest extent possible. In its 1991rulemaking implementing Title II of the ADA, the U.S. Department of Justice defined “the mostintegrated setting appropriate to the needs of qualified individuals with disabilities” as “a setting thatenables individuals with disabilities to interact with nondisabled persons to the fullest extent possible.”By contrast, segregated settings are occupied exclusively or primarily by individuals with disabilities.Segregated settings sometimes have qualities of an institutional nature, including, but not limited to,regimentation in daily activities, lack of privacy or autonomy, policies limiting visitors, limits onindividuals’ ability to engage freely in community activities and manage their own activities of dailyliving, or daytime activities primarily with other individuals with disabilities. For purposes of this tool“supportive services” means medical and other voluntary supportive services available for targetedpopulations groups, such as individuals with mental illnesses, intellectual or developmental disabilities,and/or physical disabilities, in their own home or community (as opposed to institutional settings). Suchservices may include personal care, assistance with housekeeping, transportation, in-home meal service,integrated adult day services and other services. They also include assistance with activities of dailyliving such as bathing, dressing, and using the toilet, shopping, managing money or medications, andvarious household management activities, such as doing laundry.
Lack of assistance for housing accessibility modificationsThe term “housing accessibility modification” refers here to structural changes made to existingpremises, occupied or to be occupied by a person with a disability, in order to afford such person full
Assessment of Fair Housing Tool for Local Governments (LG2015)OMB Control Number: 2529-0054
6
enjoyment and use of the premises. Housing accessibility modifications can include structural changesto interiors and exteriors of dwellings and to common and public use areas. Under the Fair Housing Act,landlords are required by fair housing laws to permit certain reasonable modifications to a housing unit,but are not required to pay for the modification unless the housing provider is a recipient of Federalfinancial assistance and therefore subject to Section 504 of the Rehabilitation Act or is covered by theAmericans with Disabilities Act (in such cases the recipient must pay for the structural modification as areasonable accommodation for an individual with disabilities). However, the cost of these modificationscan be prohibitively expensive. Jurisdictions may consider establishing a modification fund to assistindividuals with disabilities in paying for modifications or providing assistance to individuals applying forgrants to pay for modifications.
Lack of assistance for transitioning from institutional settings to integrated housingThe integration mandate of the ADA and Olmstead v. L.C., 527 U.S. 581 (1999) (Olmstead) compelsstates to offer community-based health care services and long-term services and supports for individualswith disabilities who can live successfully in housing with access to those services and supports. Inpractical terms, this means that states must find housing that enables them to assist individuals withdisabilities to transition out of institutions and other segregated settings and into the most integratedsetting appropriate to the needs of each individual with a disability. A critical consideration in each stateis the range of housing options available in the community for individuals with disabilities and whetherthose options are largely limited to living with other individuals with disabilities, or whether thoseoptions include substantial opportunities for individuals with disabilities to live and interact withindividuals without disabilities. For further information on the obligation to provide integrated housingopportunities, please refer to HUD’s Statement on the Role of Housing in Accomplishing the Goals ofOlmstead, the U.S. Department of Justice’s Statement on Olmstead Enforcement, as well as the U.S.Department of Health and Human Services’ Centers for Medicare and Medicaid Services final rule andregulations regarding Home and Community-Based Setting requirements. Policies that perpetuatesegregation may include: inadequate community-based services; reimbursement and other policies thatmake needed services unavailable to support individuals with disabilities in mainstream housing;conditioning access to housing on willingness to receive supportive services; incentivizing thedevelopment or rehabilitation of segregated settings. Policies or practices that promote communityintegration may include: the administration of long-term State or locally-funded tenant-based rentalassistance programs; applying for funds under the Section 811 Project Rental Assistance Demonstration;implementing special population preferences in the HCV and other programs; incentivizing thedevelopment of integrated supportive housing through the LIHTC program; ordinances banning housingdiscrimination of the basis of source of income; coordination between housing and disability servicesagencies; increasing the availability of accessible public transportation.
Lack of community revitalization strategiesThe term “community revitalization strategies” refers here to realistic planned activities to improve thequality of life in areas that lack public and private investment, services and amenities, have significantdeteriorated and abandoned properties, or other indicators of community distress. Revitalization caninclude a range of activities such as improving housing, attracting private investment, creating jobs, andexpanding educational opportunities or providing links to other community assets. Strategies mayinclude such actions as rehabilitating housing; offering economic incentives for housingdevelopers/sponsors, businesses (for commercial and employment opportunities), bankers, and otherinterested entities that assist in the revitalization effort; and securing financial resources (public, for-profit, and nonprofit) from sources inside and outside the jurisdiction to fund housing improvements,community facilities and services, and business opportunities in neighborhoods in need of revitalization.
Assessment of Fair Housing Tool for Local Governments (LG2015)OMB Control Number: 2529-0054
7
When a community is being revitalized, the preservation of affordable housing units can be a strategy topromote integration.
Lack of local private fair housing outreach and enforcementThe term “local private fair housing outreach and enforcement” refers to outreach and enforcementactions by private individuals and organizations, including such actions as fair housing education,conducting testing, bring lawsuits, arranging and implementing settlement agreements. A lack ofprivate enforcement is often the result of a lack of resources or a lack of awareness about rights underfair housing and civil rights laws, which can lead to under-reporting of discrimination, failure to takeadvantage of remedies under the law, and the continuation of discriminatory practices. Activities toraise awareness may include technical training for housing industry representatives and organizations,education and outreach activities geared to the general public, advocacy campaigns, fair housing testingand enforcement.
Lack of local public fair housing enforcementThe term “local public fair housing enforcement” refers here to enforcement actions by State and localagencies or non-profits charged with enforcing fair housing laws, including testing, lawsuits, settlements,and fair housing audits. A lack of enforcement is a failure to enforce existing requirements under stateor local fair housing laws. This may be assessed by reference to the nature, extent, and disposition ofhousing discrimination complaints filed in the jurisdiction.
Lack of private investment in specific neighborhoodsThe term “private investment” refers here to investment by non-governmental entities, such ascorporations, financial institutions, individuals, philanthropies, and non-profits, in housing andcommunity development infrastructure. Private investment can be used as a tool to advance fairhousing, through innovative strategies such as mixed-use developments, targeted investment, andpublic-private partnerships. Private investments may include, but are not limited to: housingconstruction or rehabilitation; investment in businesses; the creation of community amenities, such asrecreational facilities and providing social services; and economic development of the neighborhoodsthat creates jobs and increase access to amenities such as grocery stores, pharmacies, and banks. Itshould be noted that investment solely in housing construction or rehabilitation in areas that lack othertypes of investment may perpetuate fair housing issues. While “private investment” may include manytypes of investment, to achieve fair housing outcomes such investments should be strategic and part ofa comprehensive community development strategy.
Lack of public investment in specific neighborhoods, including services or amenitiesThe term “public investment” refers here to the money government spends on housing and communitydevelopment, including public facilities, infrastructure, services. Services and amenities refer to servicesand amenities provided by local or state governments. These services often include sanitation, water,streets, schools, emergency services, social services, parks and transportation. Lack of or disparities inthe provision of municipal and state services and amenities have an impact on housing choice and thequality of communities. Inequalities can include, but are not limited to disparity in physicalinfrastructure (such as whether or not roads are paved or sidewalks are provided and kept up);differences in access to water or sewer lines, trash pickup, or snow plowing. Amenities can include, butare not limited to recreational facilities, libraries, and parks. Variance in the comparative quality andarray of municipal and state services across neighborhoods impacts fair housing choice.
Assessment of Fair Housing Tool for Local Governments (LG2015)OMB Control Number: 2529-0054
8
Lack of regional cooperationThe term “regional cooperation” refers here to formal networks or coalitions of organizations, people,and entities working together to plan for regional development. Cooperation in regional planning can bea useful approach to coordinate responses to identified fair housing issues and contributing factorsbecause fair housing issues and contributing factors not only cross multiple sectors—including housing,education, transportation, and commercial and economic development—but these issues are often notconstrained by political-geographic boundaries. When there are regional patterns in segregation orR/ECAP, access to opportunity, disproportionate housing needs, or the concentration of affordablehousing there may be a lack of regional cooperation and fair housing choice may be restricted.
Lack of resources for fair housing agencies and organizationsA lack of resources refers to insufficient resources for public or private organizations to conduct fairhousing activities including testing, enforcement, coordination, advocacy, and awareness-raising. Fairhousing testing has been particularly effective in advancing fair housing, but is rarely used todaybecause of costs. Testing refers to the use of individuals who, without any bona fide intent to rent orpurchase a home, apartment, or other dwelling, pose as prospective buyers or renters of real estate forthe purpose of gathering information which may indicate whether a housing provider is complying withfair housing laws. “Resources” as used in this factor can be either public or private funding or otherresources. Consider also coordination mechanisms between different enforcement actors.
Lack of state or local fair housing lawsState and local fair housing laws are important to fair housing outcomes. Consider laws that arecomparable or “substantially equivalent” to the Fair Housing Act or other relevant federal laws affectingfair housing laws, as well as those that include additional protections. Examples of state and local lawsaffecting fair housing include legislation banning source of income discrimination, protections forindividuals based on sexual orientation, age, survivors of domestic violence, or other characteristics,mandates to construct affordable housing, and site selection policies. Also consider changes to existingState or local fair housing laws, including the proposed repeal or dilution of such legislation.
Land use and zoning lawsThe term “land use and zoning laws” generally refers to regulation by State or local government of theuse of land and buildings, including regulation of the types of activities that may be conducted, thedensity at which those activities may be performed, and the size, shape and location of buildings andother structures or amenities. Zoning and land use laws affect housing choice by determining wherehousing is built, what type of housing is built, who can live in that housing, and the cost and accessibilityof the housing. Examples of such laws and policies include, but are not limited to:
Limits on multi-unit developments, which may include outright bans on multi-unitdevelopments or indirect limits such as height limits and minimum parking requirements.
Minimum lot sizes, which require residences to be located on a certain minimum sized area ofland.
Occupancy restrictions, which regulate how many persons may occupy a property and,sometimes, the relationship between those persons (refer also to occupancy codes andrestrictions for further information).
Inclusionary zoning practices that mandate or incentivize the creation of affordable units. Requirements for special use permits for all multifamily properties or multifamily properties
serving individuals with disabilities. Growth management ordinances.
Assessment of Fair Housing Tool for Local Governments (LG2015)OMB Control Number: 2529-0054
9
Lending DiscriminationThe term “lending discrimination” refers here to unequal treatment based on protected class in thereceipt of financial services and in residential real estate related transactions. These services andtransactions encompass a broad range of transactions, including but not limited to: the making orpurchasing of loans or other financial assistance for purchasing, constructing, improving, repairing, ormaintaining a dwelling, as well as the selling, brokering, or appraising or residential real estateproperty. Discrimination in these transaction includes, but is not limited to: refusal to make a mortgageloan or refinance a mortgage loan; refusal to provide information regarding loans or providing unequalinformation; imposing different terms or conditions on a loan, such as different interest rates, points, orfees; discriminating in appraising property; refusal to purchase a loan or set different terms orconditions for purchasing a loan; discrimination in providing other financial assistance for purchasing,constructing, improving, repairing, or maintaining a dwelling or other financial assistance secured byresidential real estate; and discrimination in foreclosures and the maintenance of real estate ownedproperties.
Location of accessible housingThe location of accessible housing can limit fair housing choice for individuals with disabilities. Forpurposes of this assessment, accessible housing refers to housing opportunities in which individuals withdisabilities have equal opportunity to use and enjoy a dwelling. Characteristics that affect accessibilitymay include physical accessibility of units and public and common use areas of housing, as well asapplication procedures, such as first come first serve waitlists, inaccessible websites or othertechnology, denial of access to individuals with assistance animals, or lack of information aboutaffordable accessible housing. Federal, state, and local laws apply different accessibility requirements tohousing. Generally speaking, multifamily housing built in 1991 or later must have accessibility featuresin units and in public and common use areas for persons with disabilities in accordance with therequirements of the Fair Housing Act. Housing built by recipients of Federal financial assistance or by,on behalf of, or through programs of public entities must have accessibility features in units and inpublic and common use areas, but the level of accessibility required may differ depending on when thehousing was constructed or altered. Single family housing is generally not required to be accessible byFederal law, except accessibility requirements typically apply to housing constructed or operated by arecipient of Federal financial assistance or a public entity. State and local laws differ regardingaccessibility requirements. An approximation that may be useful in this assessment is that buildingsbuilt before 1992 tend not to be accessible.
Location of employersThe geographic relationship of job centers and large employers to housing, and the linkages betweenthe two (including, in particular, public transportation) are important components of fair housing choice.Include consideration of the type of jobs available, variety of jobs available, job training opportunities,benefits and other key aspects that affect job access.
Location of environmental health hazardsThe geographic relationship of environmental health hazards to housing is an important component offair housing choice. When environmental health hazards are concentrated in particular areas,neighborhood health and safety may be compromised and patterns of segregation entrenched.Relevant factors to consider include the type and number of hazards, the degree of concentration ordispersion, and health effects such as asthma, cancer clusters, obesity, etc. Additionally, industrial sitingpolicies and incentives for the location of housing may be relevant to this factor.
Assessment of Fair Housing Tool for Local Governments (LG2015)OMB Control Number: 2529-0054
10
Location of proficient schools and school assignment policiesThe geographic relationship of proficient schools to housing, and the policies that govern attendance,are important components of fair housing choice. The quality of schools is often a major factor indeciding where to live and school quality is also a key component of economic mobility. Relevantfactors to consider include whether proficient schools are clustered in a portion of the jurisdiction orregion, the range of housing opportunities close to proficient schools, and whether the jurisdiction haspolicies that enable students to attend a school of choice regardless of place of residence. Policies toconsider include, but are not limited to: inter-district transfer programs, limits on how many studentsfrom other areas a particular school will accept, and enrollment lotteries that do not provide access forthe majority of children.
Location and type of affordable housingAffordable housing includes, but is not limited to publicly supported housing; however each category ofpublicly supported housing often serves different income-eligible populations at different levels ofaffordability. What is “affordable” varies by circumstance, but an often used rule of thumb is that a low-or moderate-income family can afford to rent or buy a decent-quality dwelling without spending morethan 30 percent of its income. The location of housing encompasses the current location as well as pastsiting decisions. The location of affordable housing can limit fair housing choice, especially if the housingis located in segregated areas, R/ECAPs, or areas that lack access to opportunity. The type of housing(whether the housing primarily serves families with children, elderly persons, or persons withdisabilities) can also limit housing choice, especially if certain types of affordable housing are located insegregated areas, R/ECAPs, or areas that lack access to opportunity, while other types of affordablehousing are not. The provision of affordable housing is often important to individuals with protectedcharacteristics because they are disproportionately represented among those that would benefit fromlow-cost housing.
Occupancy codes and restrictionsThe term “occupancy codes and restrictions” refers here to State and local laws, ordinances, andregulations that regulate who may occupy a property and, sometimes, the relationship between thosepersons. Standards for occupancy of dwellings and the implication of those standards for persons withcertain protected characteristics may affect fair housing choice. Occupancy codes and restrictionsinclude, but are not limited to:
Occupancy codes with “persons per square foot” standards. Occupancy codes with “bedrooms per persons” standards. Restrictions on number of unrelated individuals in a definition of “family.” Restrictions on occupancy to one family in single family housing along with a restricted
definition of “family.” Restrictions that directly or indirectly affect occupancy based on national origin, religion, or any
other protected characteristic. Restrictions on where voucher holders can live.
Private DiscriminationThe term “private discrimination” refers here to discrimination in the private housing market that isillegal under the Fair Housing Act or related civil rights statutes. This may include, but is not limited to,discrimination by landlords, property managers, home sellers, real estate agents, lenders, homeowners’associations, and condominium boards. Some examples of private discrimination include:
Assessment of Fair Housing Tool for Local Governments (LG2015)OMB Control Number: 2529-0054
11
Refusal of housing providers to rent to individuals because of a protected characteristic. The provision of disparate terms, conditions, or information related to the sale or rental of a
dwelling to individuals with protected characteristics. Steering of individuals with protected characteristics by a real estate agent to a particular
neighborhood or area at the exclusion of other areas. Failure to grant a reasonable accommodation or modification to persons with disabilities. Prohibitions, restrictions, or limitations on the presence or activities of children within or around
a dwelling.
Useful references for the extent of private discrimination may be number and nature of complaints filedagainst housing providers in the jurisdiction, testing evidence, and unresolved violations of fair housingand civil rights laws.
Quality of affordable housing information programsThe term “affordable housing information programs” refers here to the provision of information relatedto affordable housing to potential tenants and organizations that serve potential tenants, including themaintenance, updating, and distribution of the information. This information includes: but is not limitedto, listings of affordable housing opportunities or local landlords who accept Housing Choice Vouchers;mobility counseling programs; and community outreach to potential beneficiaries. The quality of suchinformation relates to, but is not limited to:
How comprehensive the information is (e.g. that the information provided includes a variety ofneighborhoods, including those with access to opportunity indicators)
How up-to-date the information is (e.g. that the publicly supported housing entity is takingactive steps to maintain, update and improve the information).
Pro-active outreach to widen the pool of participating rental housing providers, including bothowners of individual residences and larger rental management companies.
Regulatory barriers to providing housing and supportive services for persons with disabilitiesSome local governments require special use permits for or place other restrictions on housing andsupportive services for persons with disabilities, as opposed to allowing these uses as of right. Theserequirements sometimes apply to all groups of unrelated individuals living together or to some subset ofunrelated individuals. Such restrictions may include, but are not limited to, dispersion requirements orlimits on the number of individuals residing together. Because special use permits require specificapproval by local bodies, they can enable community opposition to housing for persons with disabilitiesand lead to difficulty constructing this type of units in areas of opportunity or anywhere at all. Otherrestrictions that limit fair housing choice include requirements that life-safety features appropriate forlarge institutional settings be installed in housing where supportive services are provided to one or moreindividuals with disabilities. Note that the Fair Housing Act makes it unlawful to utilize land use policiesor actions that treat groups of persons with disabilities less favorably than groups of persons withoutdisabilities, to take action against, or deny a permit, for a home because of the disability of individualswho live or would live there, or to refuse to make reasonable accommodations in land use and zoningpolicies and procedures where such accommodations may be necessary to afford persons or groups ofpersons with disabilities an equal opportunity to use and enjoy housing.
Siting selection policies, practices and decisions for publicly supported housing, including discretionaryaspects of Qualified Allocation Plans and other programsThe term “siting selection” refers here to the placement of new publicly supported housing
Assessment of Fair Housing Tool for Local Governments (LG2015)OMB Control Number: 2529-0054
12
developments. Placement of new housing refers to new construction or acquisition with rehabilitationof previously unsubsidized housing. State and local policies, practices, and decisions can significantlyaffect the location of new publicly supported housing. Local policies, practices, and decisions that mayinfluence where developments are sited include, but are not limited to, local funding approvalprocesses, zoning and land use laws, local approval of LIHTC applications, and donations of land andother municipal contributions. For example, for LIHTC developments, the priorities and requirementsset out in the governing Qualified Allocation Plan (QAP) influence where developments are locatedthrough significant provisions in QAPs such as local veto or support requirements and criteria and pointsawarded for project location.
Source of income discriminationThe term “source of income discrimination” refers here to the refusal by a housing provider to accepttenants based on type of income. This type of discrimination often occurs against individuals receivingassistance payments such as Supplemental Security Income (SSI) or other disability income, socialsecurity or other retirement income, or tenant-based rental assistance, including Housing ChoiceVouchers. Source of income discrimination may significantly limit fair housing choice for individualswith certain protected characteristics. The elimination of source of income discrimination and theacceptance of payment for housing, regardless of source or type of income, increases fair housing choiceand access to opportunity.
State or local laws, policies, or practices that discourage individuals with disabilities from being placedin or living in apartments, family homes, and other integrated settingsState and local laws, policies, or practices may discourage individuals with disabilities from moving to orbeing placed in integrated settings. Such laws, policies, or practices may include medical assistance orsocial service programs that require individuals to reside in institutional or other segregated settings inorder to receive services, a lack of supportive services or affordable, accessible housing, or a lack ofaccess to transportation, education, or jobs that would enable persons with disabilities to live inintegrated, community-based settings.
Unresolved violations of fair housing or civil rights lawUnresolved violations of fair housing and civil rights laws include determinations or adjudications of aviolation or relevant laws that have not been settled or remedied. This includes determinations ofhousing discrimination by an agency, court, or Administrative Law Judge; findings of noncompliance byHUD or state or local agencies; and noncompliance with fair housing settlement agreements.