Embed Size (px)
Citation preview

Assessment of flood forecasting and Assessment of flood forecasting and warning system for Tropical Regionswarning system for Tropical Regions
Study Countries: Indonesia, Malaysia, Vietnam, PhilippinesStudy Countries: Indonesia, Malaysia, Vietnam, Philippines
Participating Orgs: IHPParticipating Orgs: IHP--National Committee Study Countries; National Committee Study Countries; ICHARM; HTC Kuala LumpurICHARM; HTC Kuala Lumpur
Project Team Leader: Dr. Mohamed Nor (Malaysia)Team Members: Dr. H.Pawitan (Indonesia), Dr. Guillermo Tabios III
(Philippines), Dr. H. Thuyen/Dr. Ahn (Vietnam)
November 3, 2009

Outline of PresentationOutline of Presentation
••Study Objectives and Final Report ContentsStudy Objectives and Final Report Contents••Status of ProjectStatus of Project••Description of Study AreasDescription of Study Areas••Field VisitsField Visits••Final Report ContentsFinal Report Contents

Study ObjectivesStudy Objectives••Assessment of existing flood forerecasting and Assessment of existing flood forerecasting and warning system (FFWS) of the four study countries: warning system (FFWS) of the four study countries: Indonesia, Malaysia, Philippines and Vietnam. One Indonesia, Malaysia, Philippines and Vietnam. One specific river/watershed system to be studied in specific river/watershed system to be studied in each country have been selected.each country have been selected.
••Review of stateReview of state--ofof--the art FF methods and models the art FF methods and models including rainfall forecasting techniques such as including rainfall forecasting techniques such as ‘‘nowcastingnowcasting’’ methodsmethods
••Visit watershed of each of the four countriesVisit watershed of each of the four countries
••Analyze, synthesize and propose an improved FF Analyze, synthesize and propose an improved FF model and FFWS based on field visit, experiences model and FFWS based on field visit, experiences from different countries including statefrom different countries including state--ofof--artart--techniques.techniques.
••Final report (contents next slide).Final report (contents next slide).

Final Report OutlineFinal Report Outline1.Introduction
1.1 Background2.Study objectives3.Description of study areas
3.1 Hydrometeorology regime3.2 Hydrometeorological network3.3 History and characteristics of floods events3.4 Objectives and needs of FFWS
4.Review of current practices and State-of-the-Art of Technology4.1 Field visits4.2 Data Collection and Flood Monitoring in Study Areas
4.2.1 Hydrometeorological data4.2.2 Flood monitoring (measurement, visual, etc) system
4.3 Existing FFWS in Study areas4.3.1 Current technology used4.3.2 Dissemination of flood information and flood warning4.3.3 Effectiveness and problems
4.4 Improved modeling tools used for FFWS4.5 Improved dissemination tools of flood information and warning
5.Major findings5.1 Assessment and Propose Improvement5.2 Comparison and assessment of existing FFWS 5.3 Proposed improvement to FFWS
6.Conclusions and recommendationsREFERENCES

Status of Project and ScheduleStatus of Project and Schedule••First Meeting held in Kuala Lumpur, Malaysia in April First Meeting held in Kuala Lumpur, Malaysia in April 2020--24, 2009 and also field visit of Klang River System24, 2009 and also field visit of Klang River System••Second Meeting held in Bogor, Indonesia in July 16Second Meeting held in Bogor, Indonesia in July 16--19, 2009 and field visit to Ciliwung River System19, 2009 and field visit to Ciliwung River System••Third Meeting held in Danang, Vietnam in October 7Third Meeting held in Danang, Vietnam in October 7--10, 2009 and also field visit to Thu Bon River System10, 2009 and also field visit to Thu Bon River System••Fourth Meeting to be held in Manila, Philippines Fourth Meeting to be held in Manila, Philippines scheduled in January 13scheduled in January 13--16, 2010 and to visit Marikina 16, 2010 and to visit Marikina River SystemRiver System••Project Progress Report in Wuhan, China on Project Progress Report in Wuhan, China on November 3, 2009.November 3, 2009.••Submit Final Project Report by first week of March, Submit Final Project Report by first week of March, 2010.2010.

Bogor, Indonesia July 16-19, 2009
Danang, VietnamOctober 8-10, 2009

Selected River/Watershed System from Each Selected River/Watershed System from Each CountryCountry
••Ciliwung River in IndonesiaCiliwung River in Indonesia••Klang River in MalaysiaKlang River in Malaysia••Marikina River in PhilippinesMarikina River in Philippines••Thu Bon River in VietnamThu Bon River in Vietnam

Summary of Preliminary Assessment of FFWS of Indonesia, Summary of Preliminary Assessment of FFWS of Indonesia, Malaysia, Philippines and Vietnam River Systems StudiedMalaysia, Philippines and Vietnam River Systems StudiedSystems and Issues Ciliwung River
(Indonesia)Klang River (Malaysia)
Marikina River (Philippines)
Thu Bon River (Vietnam)
FFW System in general
Operational Operational Completed in 1990’s but not operational now
Not fully operational and needs updating
Data Monitoring Issues (hardware and software)
Yes None equipment working but no real-time data transmission
Yes
Coordination Issues (nat’l to local gov’t and to public)
Yes None Yes Yes
Information Dissemination Issues
radio, TV, local public address (PA)
radio, TV, local PA, internet, SMS
radio, TV, local PA, internet
radio, TV, internet
Rainfall Forecasting None but real-time rainfall available
None but real-time rainfall available
None None
Flood Forecasting Limited Yes Hardware available but not currently operational
yes using upstream observe water levels but no downstream inundation model
Land Use and Other Issues
Yes Yes Yes none

Details of studied river system and Details of studied river system and associated FFWS base on presentations by:associated FFWS base on presentations by:••Dr. Hidayat Pawitan for Ciliwung River in Indonesia Dr. Hidayat Pawitan for Ciliwung River in Indonesia (11 slides)(11 slides)••Dr. Mohamed Nor for Klang River in Malaysia (13 Dr. Mohamed Nor for Klang River in Malaysia (13 slides)slides)••Dr. Guillermo Tabios III for Marikina River in the Dr. Guillermo Tabios III for Marikina River in the Philippines (12 slides)Philippines (12 slides)••Dr. Hoang Minh Tuyen for Thu Bon in Vietnam (17 Dr. Hoang Minh Tuyen for Thu Bon in Vietnam (17 slides)slides)

CILIWUNG RIVER SYSTEMCILIWUNG RIVER SYSTEMINDONESIAINDONESIA

Location ofCiliwung RiverWithin the GreaterJakarta Basin


Ciliwung River Slope
DAS Ciliwung terletak pada dataran landai, bergelombang hingga pegunungan, daerah Katulampa ketinggian sekitar 300 m dpl. Sedangkan daerah berbukit atau bergelombang, yaitu mulai Kedungbodak ke arah selatan sampai daerah Tugu selatan (1057 m), semakin ke arah selatan dan timur termasuk daerah pegunungan yang merupakan batas DAS seperti, Gunung Halimun (1665 m), Gunung Mega Mendung (1672 m) dan Gunung Pangrango (3019 m).
0 20 40 60 80 1000
500
1000
1500
2000
Gunung Mas
Megamendung
CiawiBogor Depok Manggarai
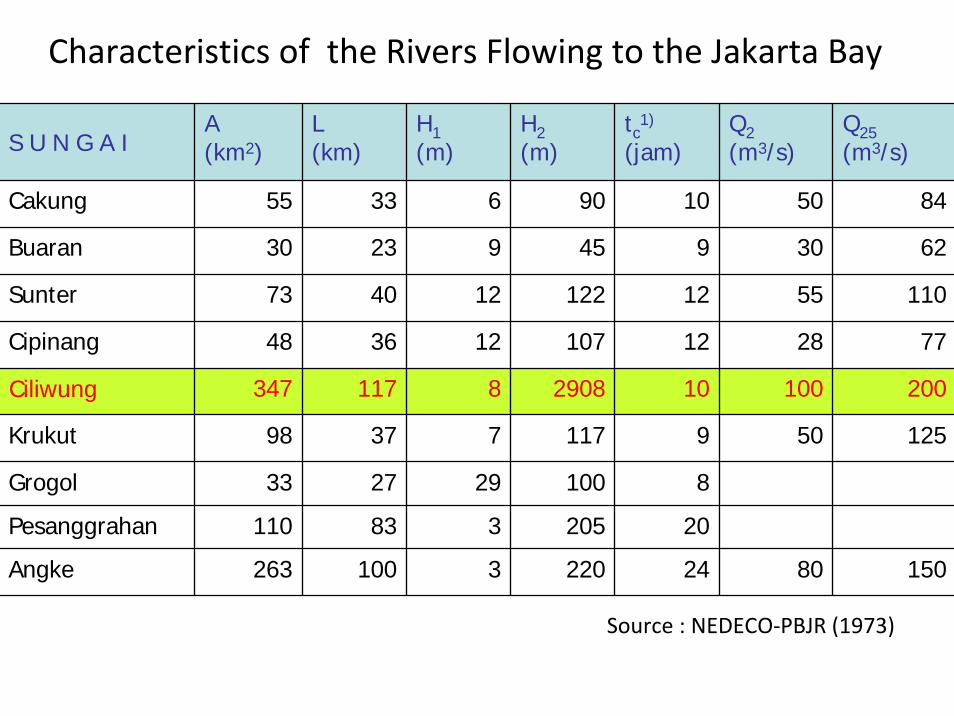
15080242203100263Angke
20205383110Pesanggrahan
8100292733Grogol
12550911773798Krukut
2001001029088117347Ciliwung
772812107123648Cipinang
1105512122124073Sunter
623094592330Buaran
8450109063355Cakung
Q25(m3/s)
Q2(m3/s)
tc1)
(jam)H2(m)
H1(m)
L(km)
A(km2)S U N G A I
Source : NEDECO‐PBJR (1973)
Characteristics of the Rivers Flowing to the Jakarta Bay

050
100150
200250300
350400
450500
1974
1976
1978
1980
1982
1984
1986
1988
1990
1992
1994
1996
1998
2000
2002
Ting
gi m
uka
air
(cm
)
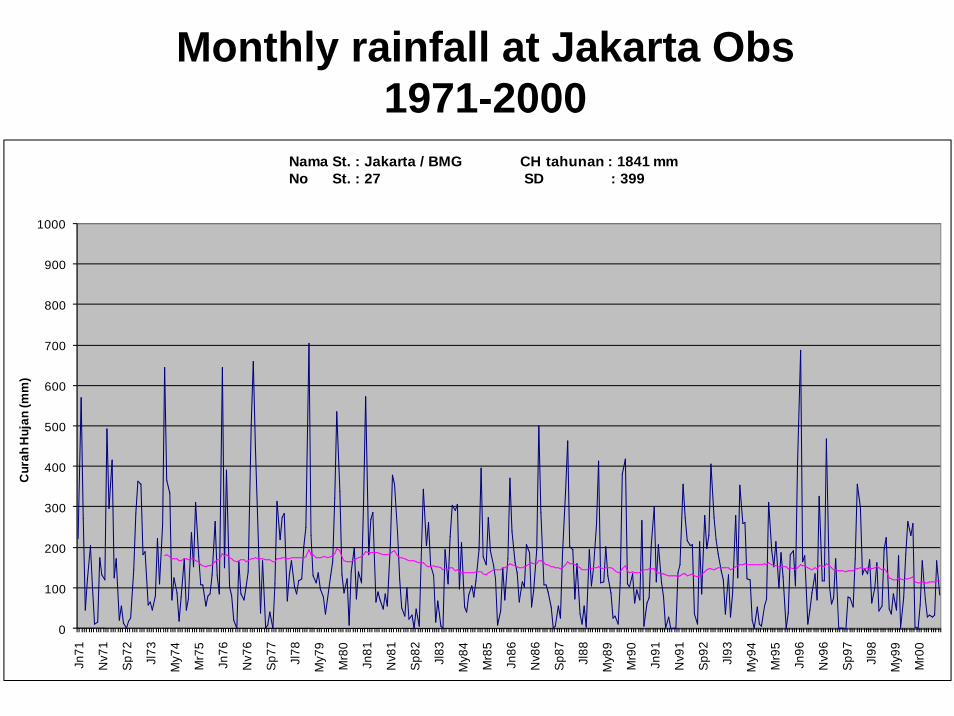
Monthly rainfall at Jakarta Obs 1971-2000
0
100
200
300
400
500
600
700
800
900
1000
Jn71
Nv7
1
Sp72
Jl73
My7
4
Mr7
5
Jn76
Nv7
6
Sp77
Jl78
My7
9
Mr8
0
Jn81
Nv8
1
Sp82
Jl83
My8
4
Mr8
5
Jn86
Nv8
6
Sp87
Jl88
My8
9
Mr9
0
Jn91
Nv9
1
Sp92
Jl93
My9
4
Mr9
5
Jn96
Nv9
6
Sp97
Jl98
My9
9
Mr0
0
Cur
ah H
ujan
(mm
)
Nama St. : Jakarta / BMG CH tahunan : 1841 mmNo St. : 27 SD : 399

Monthly rainfall at Bogor/Dramaga Sta1971-2000
0
100
200
300
400
500
600
700
800
900
1000
Jn71
Nv71
Sp72
Jl73
My7
4
Mr7
5
Jn76
Nv76
Sp77
Jl78
My7
9
Mr8
0
Jn81
Nv81
Sp82
Jl83
My8
4
Mr8
5
Jn86
Nv86
Sp87
Jl88
My8
9
Mr9
0
Jn91
Nv91
Sp92
Jl93
My9
4
Mr9
5
Jn96
Nv96
Sp97
Jl98
My9
9
Mr0
0
Cura
h Huj
an (m
m)
Nama St. : Bogor / Dramaga CH tahunan : 3973 mmNo St. : 44 SD : 600

PENDANGKALAN
L E M B A G A P E N E R B A N G A N D A N A N T A R I K S A N A S I O N A L ( L A P A N )
CITRA IKONOS SEBAGIAN DARI
WILAYAH CIKARANG (BEKASI)
Terjadi pendangkalanyang cukup luas di
beberapa bagian sungaiberdampak besar
pada terjadinya banjir
Deposition and Erosion Issues

Land Use in 1990 vs 1996

Runoff Curve Numbers in 1990 vs 1996 (Noted increases of 23%, 22% and 19% in Jakarta, Depok and Bogor areas, respectively.)
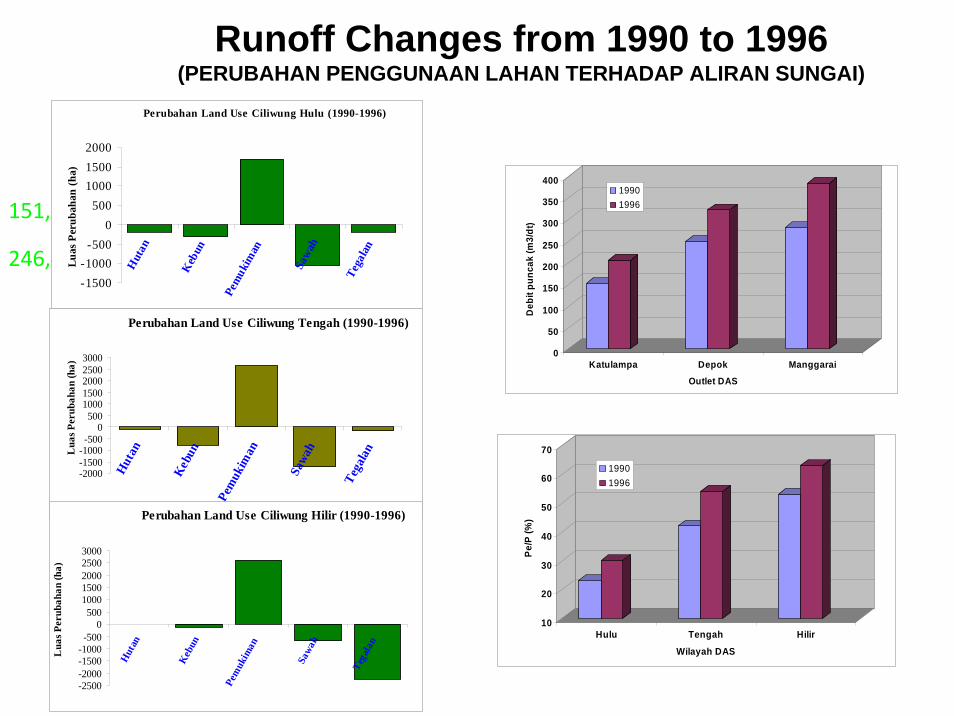
Runoff Changes from 1990 to 1996(PERUBAHAN PENGGUNAAN LAHAN TERHADAP ALIRAN SUNGAI)
Perubahan Land Use Ciliwung Tengah (1990-1996)
-2000-1500-1000-500
0500
10001500200025003000
Hut
an
Keb
un
Pem
ukim
an
Sawa
h
Tega
lanLua
s Per
ubah
an (h
a)
0
50
100
150
200
250
300
350
400
Deb
it pu
ncak
(m3/
dt)
Katulampa Depok Manggarai
Outlet DAS
19901996151,1 km2
246,4 km2325,8 km2
Perubahan Land Use Ciliwung Hulu (1990-1996)
-1500-1000
-5000
500100015002000
Hut
an
Keb
un
Pem
ukim
an
Sawa
h
Tega
lan
Luas
Per
ubah
an (h
a)
Perubahan Land Use Ciliwung Hilir (1990-1996)
-2500-2000-1500-1000-500
0500
10001500200025003000
Hut
an
Keb
un
Pem
ukim
an
Sawa
h
Tega
lan
Lua
s Per
ubah
an (h
a)
10
20
30
40
50
60
70
Pe/P
(%)
Hulu Tengah Hilir
Wilayah DAS
19901996

KLANG RIVER SYSTEMKLANG RIVER SYSTEMMALAYSIAMALAYSIA

LumpurKuala
S.Linggi
KELANTAN
Ipoh
Shah Alam
S.Perak
S.Bernam
Seremban
S.Klang
SELANGOR
Kangar
Alor Setar
George Town
PINANGPULAU
GKAWILAU
S.Muda
KEDAH
PERLIS
PERAK
THAILAND
S.Rompin
SINGAPORE
Kuantan
S.Pahang
S.Cukai
S.Muar
S.Batu Pahat
S.Benut
PAHANG
SEMBILANNEGERI
MELAKA
MelakaS.Melaka
JOHOR
S.Kuantan
S.Johor
BahruJohor
S.Endau
S.Dungun
Kuala Terengganu
Kota Bharu
TERENGGANU
S.Kelantan
S.Terengganu
S.Rejang
S.Sadong
S.Rejang
S.Sadong
S.SarawakS.SarawakKucingKucing
SARAWAK
S.BaramS.Baram
LABUAN
KotaKinabaluKotaKinabalu
SABAH
S.KinabatanganS.Kinabatangan
FLOOD PRONE AREA (EAST MALAYSIA)
S.Rejang
S.Sadong
S.Rejang
S.Sadong
S.SarawakS.SarawakKucingKucing
SARAWAK
S.BaramS.Baram
LABUAN
KotaKinabaluKotaKinabalu
SABAH
S.KinabatanganS.Kinabatangan
FLOOD PRONE AREA (EAST MALAYSIA)
Kelantan• Sungai Kelantan
• Sungai Golok• Sungai Semerak
Terenganu• Sungai Besut
• Sungai Dungun• Sungai Terengganu
• Sungai Kemaman• Sungai Marang• Sungai Chalok
Pahang• Sungai Pahang
• Sungai KuantanJohor
• Sungai Benut• Sungai Johor
• Sungai Batu Pahat• Sungai Muar
Selangor• Sungai Langat• Sungai Buloh
• Sungai Kelang• Sungai Bernam
• Sg. SelangorW.Persekutuan KL
• Sungai KlangMelaka
• Sungai Melaka
Negeri Sembilan• Sungai Linggi• Sungai Pahang• Sungai MuarPerak• Sungai Perak• Sungai Kerian• Sungai Kurau• Sungai SlimKedah• Sungai Kedah• Sungai MudaPulau Pinang• Sungai Juru• Sungai Muda• Sungai Pinang• Sungai Perai• Sungai JawiPerlis• Sungai Perlis• Sungai ArauSabah• Sungai Kinabatangan• Sungai PadasSarawak• Sungai Batang Sadong• Sg. Sarawak
Flood Prone Areas

Sun. 10 JUNE 2007
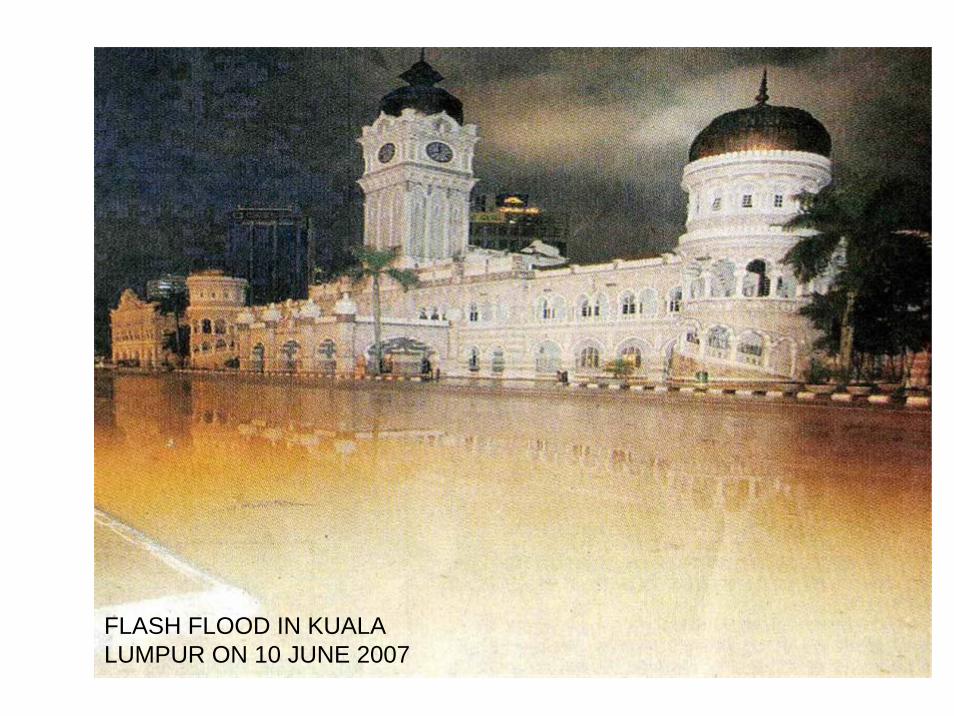
FLASH FLOOD IN KUALA LUMPUR ON 10 JUNE 2007

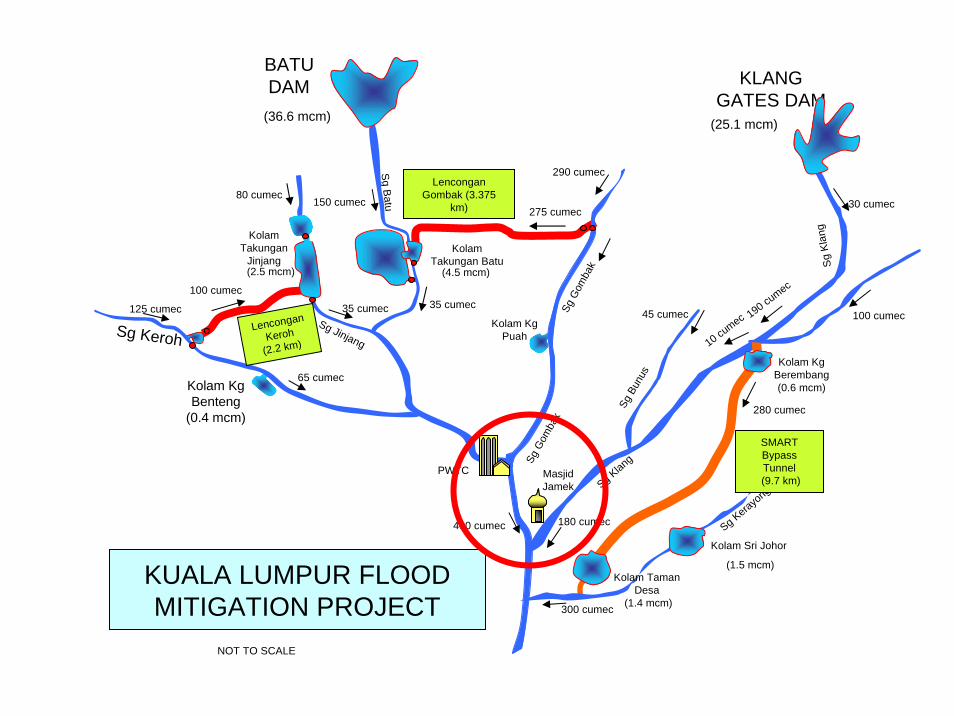
An Integrated Flood Forecasting and Warning System Control Centre for the
Klang Valley • 1,280 km2
• 120 km – Sungai Klang
• 11 main tributaries• Population of 4
million• 1,330 m at highest
point• 4 hours lead time• Tidal intrusion up
to Sungai Damansara
Kuala Lumpur
Shah Alam
Petaling Jaya
Ampang
Construction Cost = RM 24,749,400Modeling Cost = RM 4,617,737
KLANGGATES DAM
30 cumec
Sg Kerayong
280 cumec
300 cumec
Sg KerohSg Jinjang
Sg B
atuSg
Gom
bak
PWTC
Kolam Kg Benteng
(0.4 mcm)
Kolam Takungan
JinjangKolam
Takungan Batu
Kolam Kg Puah
100 cumec
275 cumec
400 cumec
290 cumec
35 cumec35 cumec
150 cumec
65 cumec
Lencongan Gombak (3.375
km)
Lencongan
Keroh
(2.2 km)
Sg KlangSg
Gom
bak
80 cumec
125 cumec
(2.5 mcm) (4.5 mcm)
BATUDAM
Masjid Jamek
Kolam Kg Berembang (0.6 mcm)
Kolam Taman Desa
(1.4 mcm)
Sg B
unus
45 cumec
180 cumec
100 cumec190 cumec
10 cumec
Sg K
lang
SMART Bypass Tunnel(9.7 km)
KUALA LUMPUR FLOODMITIGATION PROJECT
NOT TO SCALE
Kolam Sri Johor
(1.5 mcm)
(36.6 mcm) (25.1 mcm)

Radio, PSTNSatellite
Rainfall & River Level
Sensors14 Master Stations
DID Mailbox
DID National Flood
Monitoring Centrehttp:infobanjir.water.gov
.myWorld Wide Web
On-Line Flood Information “FLOOD-INFO”-schematic diagram
EmailProvider

RTU Stations
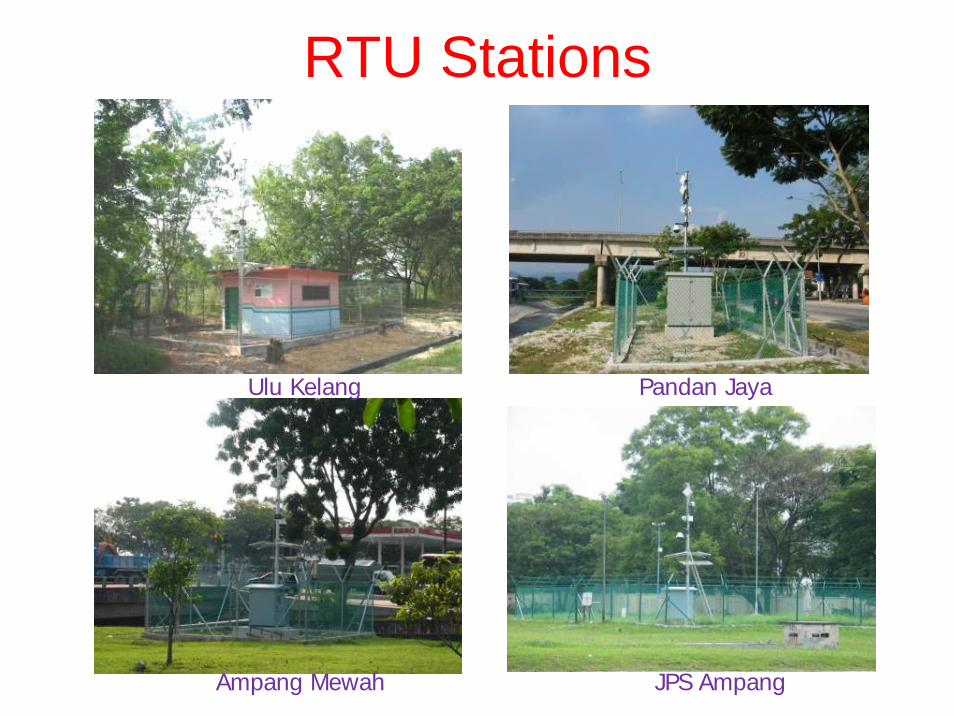
RTU Stations
Ulu Kelang Pandan Jaya
JPS AmpangAmpang Mewah

Control Centre
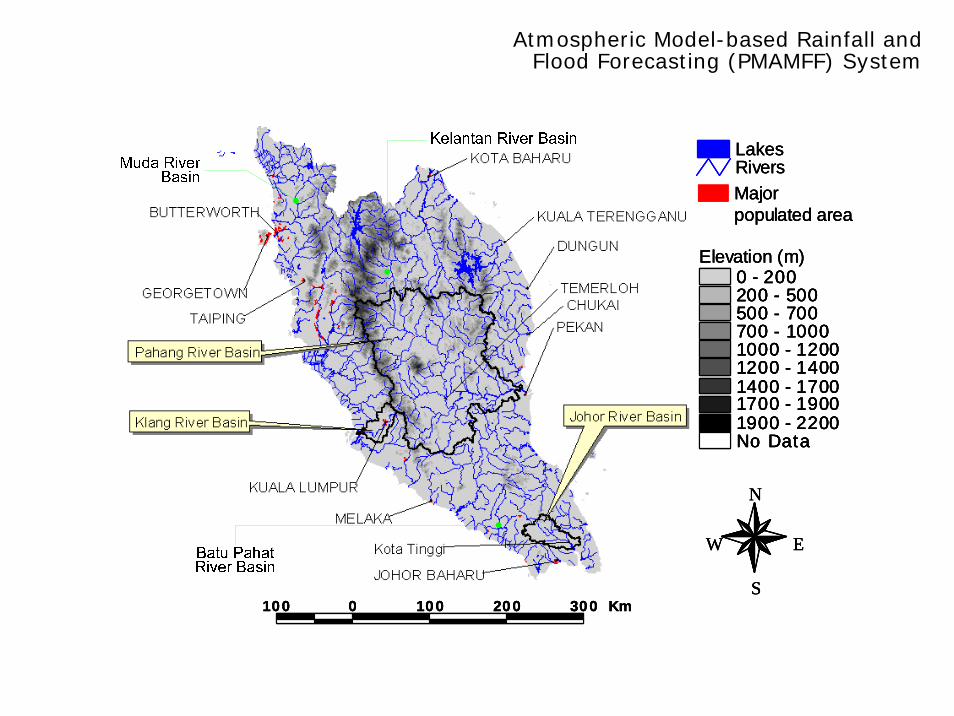
Majorpopulated area
RiversLakes
100 0 100 200 300 Km
N
EW
S
0 - 200200 - 500500 - 700700 - 10001000 - 12001200 - 14001400 - 17001700 - 19001900 - 2200No Data
Elevation (m)
Majorpopulated areaMajorpopulated area
RiversLakesRiversLakes
100 0 100 200 300 Km100 0 100 200 300 Km
N
EW
S
N
EW
S
0 - 200200 - 500500 - 700700 - 10001000 - 12001200 - 14001400 - 17001700 - 19001900 - 2200No Data
Elevation (m)0 - 200200 - 500500 - 700700 - 10001000 - 12001200 - 14001400 - 17001700 - 19001900 - 2200No Data
0 - 200200 - 500500 - 700700 - 10001000 - 12001200 - 14001400 - 17001700 - 19001900 - 2200No Data
Elevation (m)
Atmospheric Model-based Rainfall and Flood Forecasting (PMAMFF) System

User
Radar Rainfall Reflectivity Data
Ground model/DTM
Spatial Resolution
Recorded Rain Gauge Data
Event/Time Series length
Area/coordinated of interest
Data process
Rainfall precipitation
Input for hydrologicalmodelling
User
Radar Rainfall Reflectivity Data
Ground model/DTM
Spatial Resolution
Recorded Rain Gauge Data
Event/Time Series length
Area/coordinated of interest
Data process
Rainfall precipitation
Input for hydrologicalmodelling
Radar Rainfall Analyzer and Integrator for Malaysia (RAIM)
MERSING
SUBANG

MARIKINA RIVER SYSTEMMARIKINA RIVER SYSTEMPHILIPPINESPHILIPPINES

Weather and Rainfall System in Metro Manila
Metro Manila and Luzon in general of the Philippines derive their rainfall yield mainly from the following weather systems:
•Southwest monsoons which originate from the Indian Ocean during the “wet” season or the northern hemisphere summer (June to September),
•Rain intensification afforded by the tropical cyclones or typhoons which cross the country from either the western Pacific Ocean or China Sea,
•Thunderstorms associated with the inter-tropical convergence zone(ITCZ) which seasonally oscillates between north and south of the
equator..
•In most parts of the region, the “dry” season is during the so-called December to April while May and November are transitional months..

(JICA)
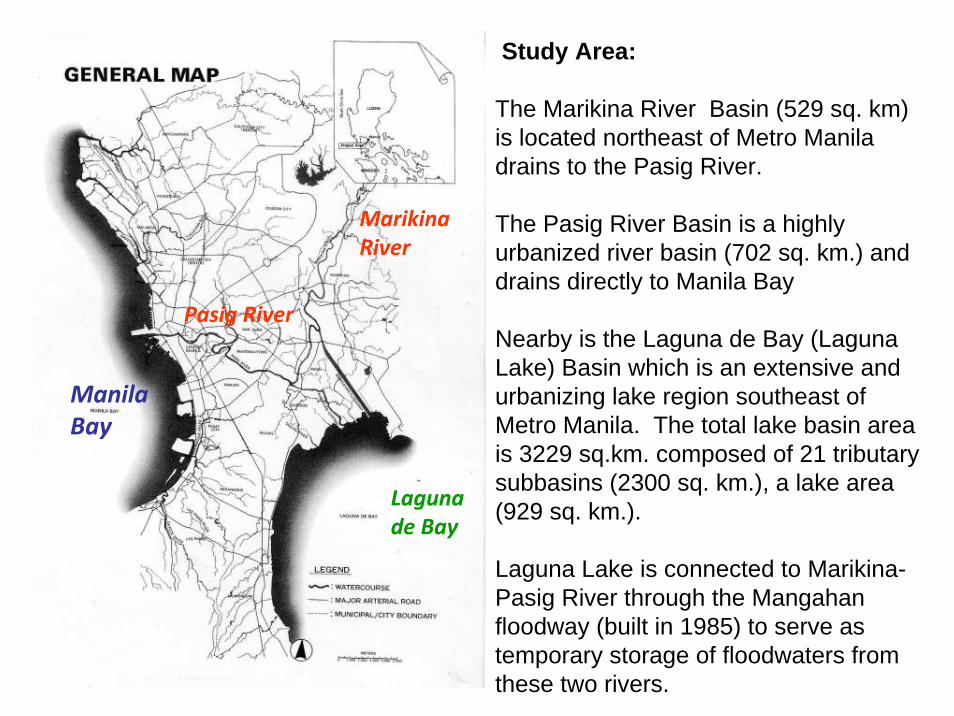
Study Area:
The Marikina River Basin (529 sq. km) is located northeast of Metro Manila drains to the Pasig River.
The Pasig River Basin is a highly urbanized river basin (702 sq. km.) and drains directly to Manila Bay
Nearby is the Laguna de Bay (Laguna Lake) Basin which is an extensive and urbanizing lake region southeast of Metro Manila. The total lake basin area is 3229 sq.km. composed of 21 tributary subbasins (2300 sq. km.), a lake area (929 sq. km.).
Laguna Lake is connected to Marikina-Pasig River through the Mangahan floodway (built in 1985) to serve as temporary storage of floodwaters from these two rivers.
MarikinaRiver
Pasig River
Lagunade Bay
ManilaBay
Tabak
Bosoboso
Pasig
Science Garden
101
102103
104
105
106107
108
109110
111
112
113
114
115
116
117
118
119 120
121122
123 124
125126
127
128
129
130131
132133
134135
136
137138
139
140
141
142143
144
145
146
147
148149
150
151152
153
154
155
156
157
158
159
160
161
162163
164
165166
167
168169
170
171
172
173
174
175
176177
178
179
180181182
183
184
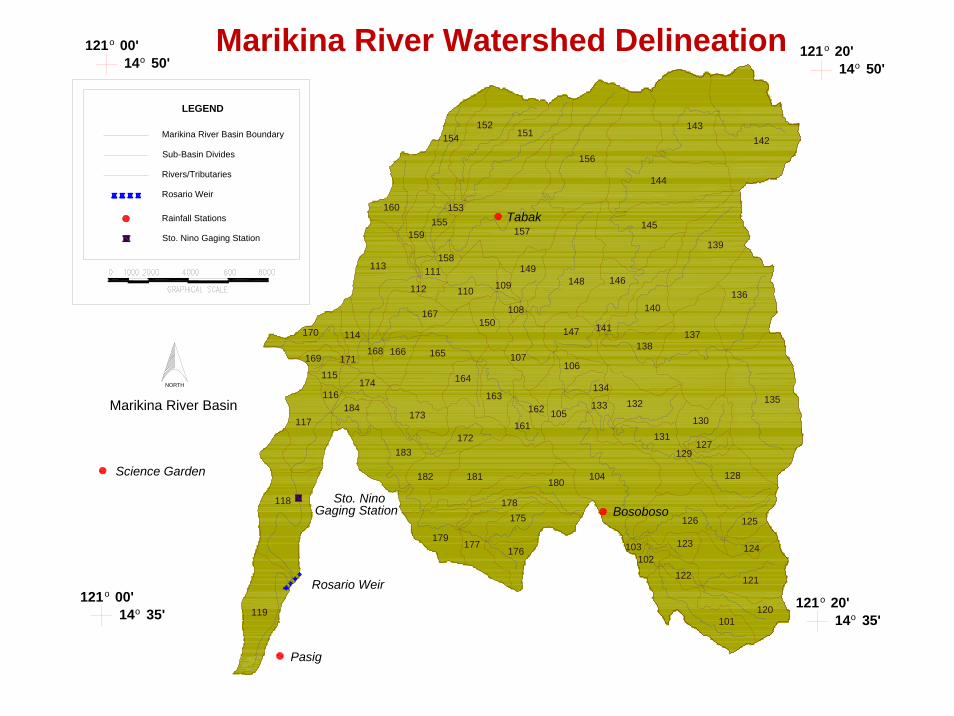
Rainfall Stations
Rivers/Tributaries
Sub-Basin Divides
Marikina River Basin Boundary
LEGEND
Marikina River Basin
Sto. Nino Gaging Station
Sto. Nino Gaging Station
121 00'o
14 50'o
121 00'o
14 35'o121 20'o
14 35'o
121 20'o
14 50'o
Rosario Weir
Rosario Weir
NORTH
Marikina River Watershed Delineation

METRO MANILA FLOOD PROBLEM AND FLOOD CONTROL
Flood flows of the Marikina River, joining Pasig River•can inundate the lower parts of Metro Manila,•has to be diverted to Laguna de Bay during heavy monsoon and typhoon episodes via the so-called Mangahan Floodway controlled by an 8-gated weir inlet with a diversion capacity of 2400 cu.m/s),
With the floodflow diversions from Marikina River and its own natural tributary inflows,•Laguna de Bay becomes a temporary flood retention basin during the rainy season,•so that its higher water level (above Manila Bay) would prevent salinity or seawater intrusion•but unfavorable to traditional brackish-water aquaculture and fisheries.
The recession of the lake water level by outflow through the same Pasig River almost takes the entire dry season.
The expected high water levels in the lake during the wet season have led to lakeshore diking system to protect the lakeshore communities.

Laguna Lake
Manila Bay
Metro Manila
CalirayaPump-
StorageSystem
Pasig-NapindanRiver
Mangahan Floodway

Effective Flood Control Operating System (EFCOS) Project of 1981‐1982.
EFCOS PROJECT (1981-1982) -Effective Flood Control Operation System including Telemetering and Flood Warning System in Pasig-Marikina-Laguna Lake Complex
Despite the construction of the Manggahan Floodway, the Rosario Weir, the Napindan Hydraulic Control Structure and the Napindan Channel (in 1980) which operated in an integrated and synchronized manner, it was not able to effectively relieve Metro Manila of the flood due to the inundations of the Pasig and high water level of the Laguna Lake.
In this connection, EFCOS Project study (Japanese funded) was conducted in 1981-1982 to establish an effective flood control system for the Manggahan Floodway and the Napindan Hydraulic Control Structure by means of telemetering and warning facilities.
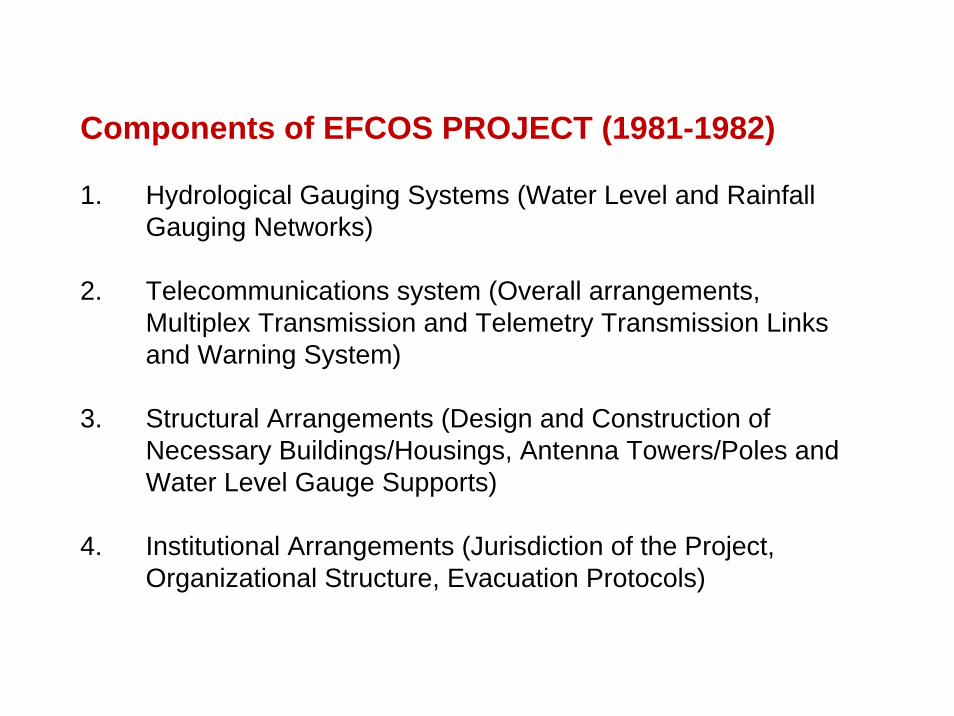
Components of EFCOS PROJECT (1981-1982)
1. Hydrological Gauging Systems (Water Level and Rainfall Gauging Networks)
2. Telecommunications system (Overall arrangements, Multiplex Transmission and Telemetry Transmission Links and Warning System)
3. Structural Arrangements (Design and Construction of Necessary Buildings/Housings, Antenna Towers/Poles and Water Level Gauge Supports)
4. Institutional Arrangements (Jurisdiction of the Project, Organizational Structure, Evacuation Protocols)

Land use planning issue: villages and shopping malls built in river floodplains which is well within the river meander belt.

Marikina River and Rosario Weir as viewed looking downstream from Manalo Bridge.
River constriction of a land reclamation for a housing development.
CirculoVerde Site
Manalo Bridge
Circulo Verde sign at this corner
Circulo Verde housing development


THU BON RIVER SYSTEMTHU BON RIVER SYSTEMVIETNAMVIETNAM

Catchment Area: 10350 km2
Annual rainfall: 1960-4000 mmRainfall season: September to December
HydroMet Network

0200400600800
1000
1 3 5 7 9 11
mm
0200400600800
1000
1 3 5 7 9 11
0200400600800
1000
1 3 5 7 9 11
0
200
400
600
800
1000
1 3 5 7 9 11
0
200
400
600
800
1000
1 3 5 7 9 11
0100200300400500600700
1 3 5 7 9 11
mm
0100200300400500600700
1 3 5 7 9 11
mm
0
200
400
600
800
1000
1 3 5 7 9 11
mm
Rainfall distribution in the year at some stations

Annual rainfall Map

Big floods in Thu Bon basin cause of:Tropical storms or tropical depressions landing in combination with cold air surge; Inter-Tropical Convergence Zone (ITCZ) in combination with cold air surge and tropical depression.
When typhoon landing the northern part of the basin or directly to the basin, may cause big flood / inundation. Due to the affect of coastal line and topography, before landfall, typhoon often moves along the coast and causes rains over the basin.
Due to heavy rains that concentrate in a narrow and sloppy area, Thu Bon river has much bigger run-off volume in comparison to the almost all rivers in the North Viet Nam.
The maximum annual discharge is often very high, water concentrates quickly in small and sloppy part of basin in upper stream, runs down very quickly to narrow, flat and populated down stream (because there is not middle stream) and often causes dangerous inundation.
Flood Features in Thu Bon basin


Telephoned- Rainfall & Water level Stations
served for Flood forecasting
Communicating observed data to Central Hydro-Meteorological forecasting center and Regional Hydro-Meteorological Center
From: September to December

Flood Forecasting Alternatives in operation of ThuBon basin
• WLAi Nghia=f(WLThanh My• WLAi Nghia +f(Avg rainfall on
basin (Waring time 12 h)• WLCamLe =f(AiNghia)• WLGiao Thuy =f(WL Nong Son,
HiepDuc• WLCauLau=f(WL GiaoThuy)• WLHoiAn=f(WL CauLau)
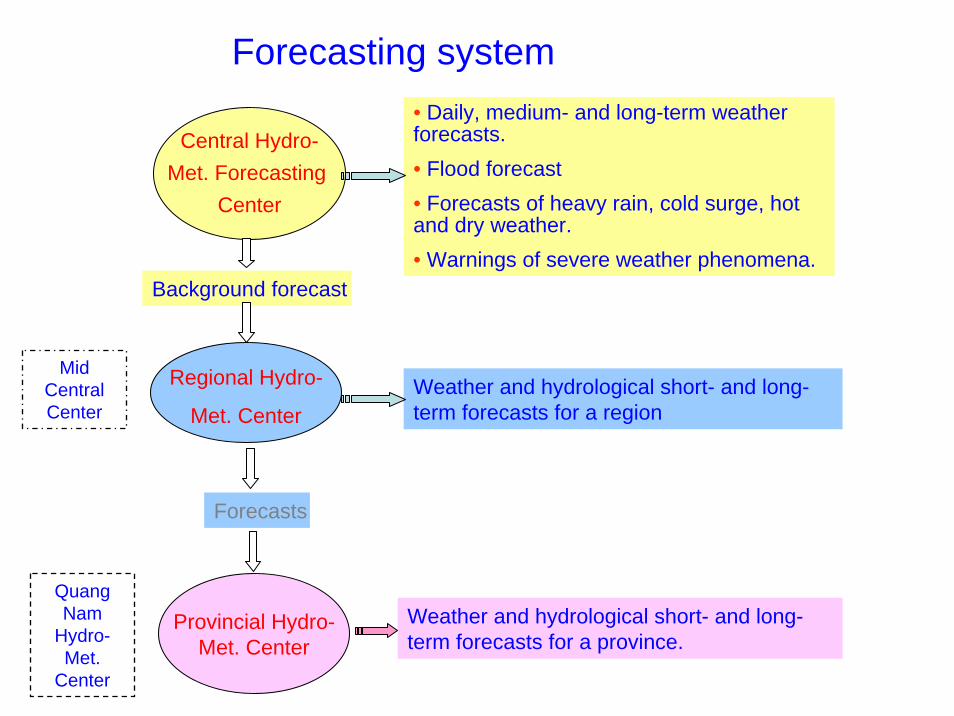
Background forecast
Central Hydro-Met. Forecasting
Center
• Daily, medium- and long-term weather forecasts.• Flood forecast• Forecasts of heavy rain, cold surge, hot and dry weather.• Warnings of severe weather phenomena.
Regional Hydro-
Met. CenterWeather and hydrological short- and long-term forecasts for a region
Forecasts
Provincial Hydro-Met. Center
Weather and hydrological short- and long-term forecasts for a province.
Forecasting system
Mid CentralCenter
Quang Nam
Hydro-Met.
Center
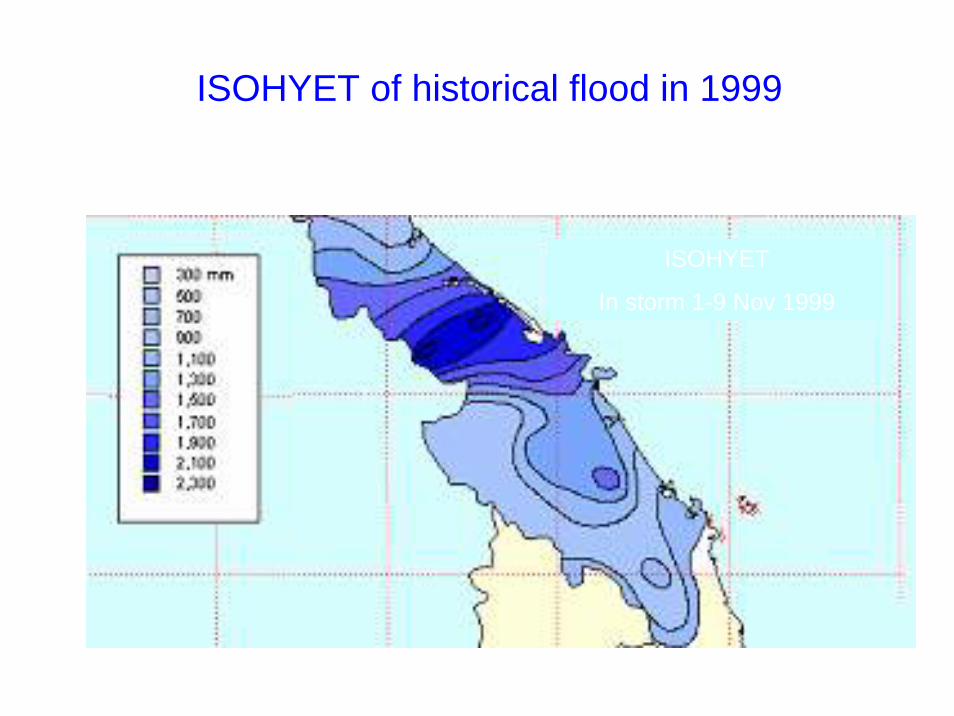
ISOHYET
In storm 1-9 Nov 1999
ISOHYET of historical flood in 1999

Hydrograph at stations of historical flood in 1999
HuÕ
0
1 0 0
2 0 0
3 0 0
4 0 0
5 0 0
6 0 0
7 0 0
(c m)
Phó èc
0
1 0 0
2 0 0
3 0 0
4 0 0
5 0 0
6 0 0
(cm)
¸ i NghÜa
4 0 0
5 0 0
6 0 0
7 0 0
8 0 0
9 0 0
1 0 0 0
1 1 0 0
(cm) C©u L©u
0
100
200
300
400
500
600
(cm)
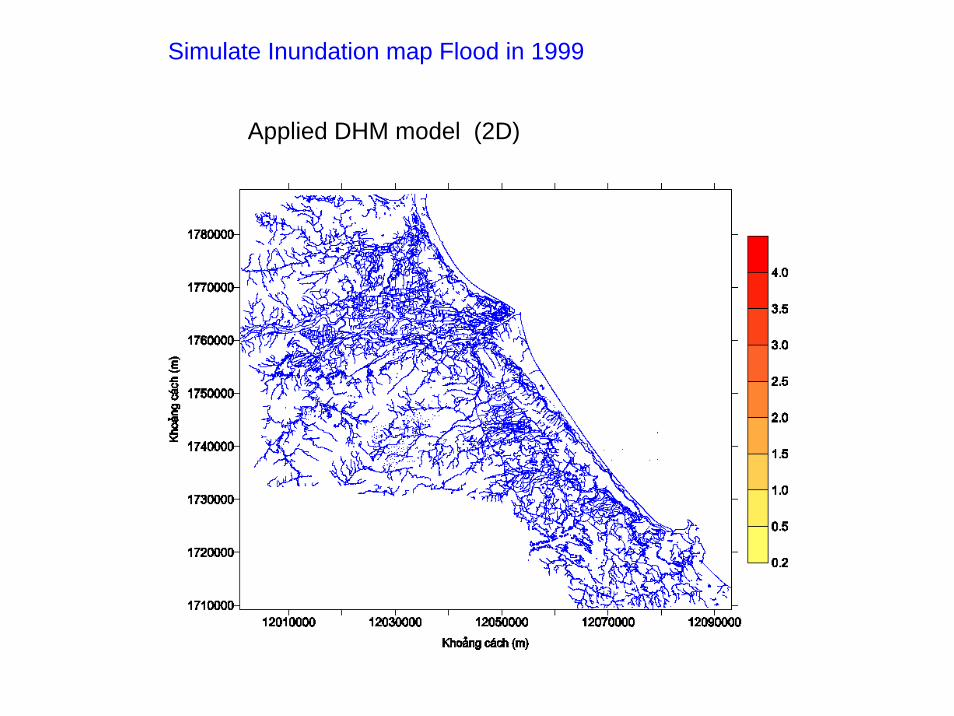
Simulate Inundation map Flood in 1999
Applied DHM model (2D)

Application of models for Thu Bon Basin

Soil Map
Land use Map
Topo Map

Thµnh MüS«ng Bung
S«ng K«n
1
23 4
5
S«ng Tóy Loan
N«ng S¬n
6
7
8Ly Ly
Schematization for Hydrodynamic model

Models have not been applied for operational forecasting. The tools used for flood forecasting are not updated.
The forecasting time for maximum WL is only 12-24 hours.
The warning time is only 24-36 hours, but not high confident because of rainfall prediction
Especially, River flow are regulated by reservoirs on upstream. It is necessary applying models to forecast.
There have not been any models applied for inundation forecasting in downstream.
Problems and Issues of FFWS in Vietnam

The problems to be improvedEnrichment of data sources (quantity, quality, in time) for
weather, hydrological forecasts and warningsConsolidating and upgrading observation network to meet
requirement of storm and flood forecasting and warning activities;Updating observation technology;Upgrading the calibration facilitiesStrengthening hydro-met. survey capabilities
Development of hydro-meteorological forecasting system Developing telecommunication system and material-technical base for forecasting activities;Developing forecasting technologies;Improving forecast system

Improvement of meteorological, hydrological, environment data collection, processing, archives and service systemImproving the management system of meterological and hydrological data to meet increasing needs of socio-economic activities, sientific research, etc.Strengthening the material technical base for hydro-meteorological documentation.
Research and Development will be focusing on:Improvement of forecast capabilities Improvement of telecommunication facilitiesInterpretation of satellite and radar imagesFamiliarizing and mastering new observation equipment and technologies
The problems to be improved