Embed Size (px)
Citation preview

African Journal of Biotechnology Vol. 7 (5), pp. 546-552, 4 March, 2008 Available online at http://www.academicjournals.org/AJB DOI: 10.5897/AJB07.837 ISSN 1684–5315 © 2008 Academic Journals
Full Length Research Paper
Assessment of genetic diversity in Triticum spp. and Aegilops spp. using AFLP markers
M. Khalighi1, A. Arzani1* and M. A. Poursiahbidi2
1Department of Agronomy and Plant Breeding, College of Agriculture, Isfahan University of Technology, Isfahan-84156
83111, Iran. 2Ilam Agricultural Research Center, Ilam-69317 73834, Iran.
Accepted 17 December, 2007
Genetic diversity among some wild relatives of wheat was estimated using amplified fragment length polymorphism (AFLP) and morphological markers. Thirty one Triticum and Aegilops genotypes including twenty-four Triticum and Aegilops accessions belonging to five diploid (Triticum baeoticum, Triticum monococcum, Aegilops umbellulata, Aegilops caudata and Aegilops tauschii), five tetraploid (Triticum dicoccoides, Triticum dicoccum, Aegilops crassa (4x), Aegilops cylindrica, Aegilops triuncialis) and two hexaploid (Triticum compactum, A. crassa (6x)) species sampled from different eco-geographical regions of Iran; a durum wheat cultivar 'Langdon', a local wheat cultivar 'Roshan', a wheat cultivar 'Chinese spring' and four synthetic hexaploid wheats were evaluated. Genetic diversity among wheat accessions was estimated using 14 PstI:MseI primer pair combinations. Of the approximately 414 detected AFLP markers, 387 (93.5%) were polymorphic with 28 bands per used primer pair. Cluster analysis of 31 accessions belonging to the 15 species by UPGMA cluster analysis based on Jaccard’s similarity estimates for AFLP data divided all accessions into two major clusters reflecting almost their genome composition. The first one included wheat species having A and AB genomes, while second cluster included wheat species having C, D, AB, CD, UC, DM, DDM and ABD genomes. The genetic similarity coefficients ranged from 0.12 between Ae. glabra and accession number 3 of T. monococcum and 0.57 between A. crassa (6x) and Ae. crassa (4x-6x). Two Aegilops species of A. umbellulata and A. caudata were ranked as the second most related species. Key words: Amplified fragment length polymorphism (AFLP), genetic diversity, wheat, Triticum spp., wild wheat, Aegilops spp.
INTRODUCTION Bread wheat (Triticum aestivum L.) is the most widely grown plant in the world due to its physiological charac-teristics that adapt wheat cultivars for production in a wide range of eco-geographical conditions and the che-mical and physical properties of the wheat gluten that contribute to the wide use of wheat grain for many different food products. It is the staple food for 35% of the world’s population, and is becoming increasingly impor-tant in the developing world (CIMMYT 2003). To meet the demand for developing high yielding and stress-resistant wheat cultivars, it is desirable to increase the genetic *Corresponding author. E-mail: [email protected].
base of this crop. There has been a growing concern about the remaining variability in the bread wheat gene pool which is grossly insufficient to address current and future breeding objectives (Rejesus et al., 1996). In last decades, the narrow genetic basis of modern wheat cultivars is well evident, as breeders prefer using either improved cultivars as parents or advanced breeding materials to accelerate the development of new cultivars. While in the beginning, selection was utilized to isolate pure lines from heterogeneous landraces or natural popu-lations, today improved cultivars were used as parents in wheat breeding programs. It is therefore necessary to broaden the genetic base of wheat. The wild relatives of bread wheat, T. aestivum L., are considered as potential sources of useful alleles for bread- wheat improvement.

The genus Aegilops L. and Triticum L. have contributed two of the three (B and D) and one of the three (A) bread wheat genomes, respectively. The genus Aegilops con-tains 22 species comprising both diploids and polyploids, that originated from center of origin (van Slageren, 1994). Consequently, study of the genetic diversity of the genetic resources of such species may provide significant information regarding their potential for breeding pur-poses.
Genetic erosion caused by modern cultivation proce-dure has narrowed the genetic base of many crops, including bread wheat. Wild relatives and related species can be successfully crossed with bread wheat (Jiang et al., 1993; Sharma, 1995; Arzani et al., 2000). Conse-quently, genes from the wild relatives can be introgressed in the cultivated wheats through recombination of the homologous chromosomes, and undesirable gene linkages can be mostly broken by repeated backcrossing to cultivated wheat (Friebe et al., 1996). Amphiploids from interspecific crosses between tetraploid wheats and Aegilops species, as their close relatives, are useful bridging germplasm for introduction of desirable alien characters to bread wheats (Friebe et al., 1996).
Iran is very rich in habitat diversity due to the diversity in its geomorphology, topography and climate. This has helped the survival of a diverse plant species in the wild. Amongst the Iranian flora, there are some of the most important food crops such as wheat and its wild relatives. These species represent a large reservoir of useful characteristics that can be exploited for wheat improve-ment. Many agronomically interesting characterisics, comprising resistance to biotic and abiotic stresses have been transferred from these species to wheat (Jiang et al., 1993; Friebe et al., 1996). Accessions of Aegilops tauschii, particularly those from Iran have already proved a diverse genetic storehouse of potentially useful characteristics for incorporation into modern wheat culti-vars (Lagudah et al., 1993; Thompson and Haak, 1997). Nishikawa et al. (1980) and Dvorak et al. (1998) suggested that the region of SE and SW Caspian sea including Iran and Armenia, were the geographical place of origin of T. aestivum L. Comparative study of micro-satellite diversity in wheat germplasm among a wide range of world areas indicated that the greatest genetic diversity originated from Iran (Huang et al., 2002).
Traditionally, germplasm has been characterized based on agronomic and morphological studies, but recently use of molecular markers to study diversity of crop spe-cies has become common. DNA markers have the advantage of directly detecting sequence variation among cultivars. The use of micro-satellites (simple sequence repeats, SSRs) and amplified fragment length polymorphisms (AFLPs) are routine methods for quickly and efficiently estimating relationships between lines and populations of many plant species. AFLP is an efficient, reproducible technique which combines the reliability of RFLP and the power of PCR technique (Vos et al., 1995).
Khalighi et al. 547 AFLP has been widely used to discriminate between different accessions of a number of plants species includ-ing T. aestivum L. (Barrett and Kidwell 1998; Barrett et al., 1998; Bohn and Melchinger, 1999; Ridout and Donini, 1999; Soleimani et al., 2002; Almanza-Pinzon et al., 2003).
Quantification of genetic diversity in cultivated and wild crops has important implications for breeding programs and for the conservation of genetic resources. The primary objective of this study was to understand the extent and pattern of genetic diversity among diploid and polyploid wild species of wheat using AFLP marker and to compare these genetic diversity estimates with those of using morphological traits. MATERIALS AND METHODS Plant materials A collection of twenty-four Triticum and Aegilops accessions belonging to five diploid (T. baeoticum (Boiss. em. Schiemann.) [syn.= T. monococcum (L.) ssp. aegilopoides Link em. Thell.], T. monococcum (L.), Ae. umbellulata (Zhuk.), Ae. caudata (L.) and A. tauschii (Coss.)), five tetraploid (T. dicoccoides (Koern. ex Asch. & Graebn) [=T. turgidum L. ssp. dicoccoides (Koern. ex Asch. and Graebn) Thell.], T. dicoccum (Schrank ex Schübler) [=T. turgidum (L.) ssp. dicoccum (Schrank ex Schübler) Thell.], Ae. crassa Boiss (4x), Ae. cylindrica Host., A. triuncialis L.) and two hexaploid (T. compactum [=T. aestivum L. ssp. compactum (Host) MacKey], Ae. crassa Boiss (6x)) species and sampled from different eco-geographical regions of Iran was used (Table 1). Four synthetic hexaploid wheat lines provided by CIMMYT, a durum wheat and two bread wheat cultivars were also used in this study. AFLP analysis Single plant from each accession was selected and then selfed seeds of the selected plant of each accession were used. Leaves from ten plants derived from individual selfed plant of each accession were combined and their DNA was extracted. DNA extraction was performed according to Dellaporta et al. (1983) method for young leaf tissue with modifications. One hundred milligrams of frozen leaf samples were ground with liquid nitrogen followed by addition of 400 µl of extraction buffer. The supernatant removed after the first centrifugation was transferred to a clean tube and centrifuged for the second time at 12,000 g for 10 m, followed by ethanol precipitation. DNA concentration was determined by comparing its intensity with those of DNA standard (λDNA with known concentrations) on the ethidium bromide stained 1% agarose gel.
AFLP analysis was based on established protocol (Vos et al., 1995). Fourteen PstI:MseI primer combinations were used. Five hundred nanograms of DNA from each genotypes were digested with Tru91 (an isoschizomer of MseI) and PstI restriction enzymes. A total of 250 ng genomic DNA was restricted with MseI and PstI (5U of each) for 2 - 3 h at 37°C in 1 x restriction buffer OPA (One-Phor-all; Pharamacia) in a final volume of 50 µl. After controlling for complete digestion, 10 µl of a ligation mix [50 pmol MseI adapter, 5 pmol PstI adapter, 10 mM ATP, 1 x OPA buffer and 1 U T4 DNA ligase (Promega)] was added and the samples incubated for 3 h at 37°C. The digestion-ligation reaction was terminated by incubating at 65°C for 10 m, and products were then diluted 1:5 in TE buffer [10 mM Tris, 1 mM EDTA].

548 Afr. J. Biotechnol.
Table 1. Wild wheat relatives (Triticum and Aegilops accessions), synthetic wheat lines, durum and bread wheat cultivars used for diversity study.
S/N Species Genome Growing status Location Origin
1 T. baeoticum (1) A Wild Semirom-Isfahan Central Iran
2 T. baeoticum (2) A Wild Kohkiloye-Boyerahmad SW Iran
3 T. baeoticum (3) A Wild Lorestan West Iran
4 T. baeoticum (4) A Wild Shirvancherdavel Ilam West Iran
5 T. baeoticum (5) A Wild Khoramabad Lorestan West Iran
6 T. baeoticum (6) A Wild KarajTehran Iran
7 T. baeoticum (7) A Wild PiranshahrKordestan West Iran
8 T. monococcum (1) A Wild Shirvancherd-Ilam West Iran
9 T. monococcum (2) A Wild Shirvancherd-Ilam West Iran
10 T. monococcum (3) A Wild Lorestan West Iran
11 T. monococcum (4) A Wild Kermanshah West Iran
12 T. turgidum ssp. dicoccoides AB Wild Semirom-Isfahan Central Iran
13 T. turgidum ssp. dicoccum AB Wild West Azerbaijan NW Iran
14 T. compactum ABD Wild Maco-Azerbaijan NW Iran
15 Ae. tauschii D Wild Ilam-Ilam West Iran
16 Ae. crassa (6x) DDM Wild Ilam-Ilam West Iran
17 Ae. crassa (mixoploid 4x & 6x) DM-DDM Wild Ilam-Ilam West Iran
18 Ae. crassa (4x) DM Wild Ilam-Ilam West Iran
19 Ae. glabra Wild Ilam-Ilam West Iran
20 Ae. umbellulata U Wild Ilam-Ilam West Iran
21 Ae. caudata C Wild Ilam-Ilam West Iran
22 Ae. cyclindrica CD Wild Ilam-Ilam West Iran
23 Ae. triuncialis (1) UC Wild Ivan- Ilam West Iran
24 Ae. triuncialis (2) UC Wild Ilam-Ilam West Iran
25 Altar84/Ae. tauschii ABD Synt. wheat Genetic Resources CIMMYT
26 Croc 1/ Ae. tauschii ABD Synt. wheat Genetic Resources CIMMYT
27 Yar/ Ae. tauschii ABD Synt. wheat Genetic Resources CIMMYT
28 Srn/ Ae. tauschii ABD Synt. wheat Genetic Resources CIMMYT
29 T. turgidum ssp. durum cv. Langdon AB Durumwheat Genetic Resources CIMMYT
30 T. aestivum cv. Chinese spring ABD Bread wheat Genetic Resources CIMMYT
31 T. aestivum cv. Roshan ABD Bread wheat Isfahan Iran
A pre-amplification reaction was performed in a 50 µl reaction containing 5 µl of template DNA, 150 ng of MseI and PstI primer, 0.25 mM dNTPs, 10 x PCR buffer, 1.2 mM MgCl2 and 1 U Taq Polymerase (Accutherm, GeneCraft, Germany). Samples were subjected to pre-amplification thermocycle profile [initial denature-tion step 94°C (2 min), 40 cycles of 94°C (30 s), 56°C (30 s), 72°C (1 min) and a final extension 72°C (5 min)]. The pre-amplified DNA was diluted (1:5) and used for selective amplification. Selective amplifications were performed in a 20 µl reaction containing: 5 µl of the diluted template DNA, 60 ng MseI, PstI primer each having three selective nucleotides (with exception of primer combinations 7 and 10 each of which having two selective nucleotides for PstI), 10 x PCR buffer, 1.2 mM MgCl2 and 1 U Taq Polymerase (Accutherm, GeneCraft, Germany). Samples were subjected to the selective amplification thermocycle profile of initial denaturation step 94°C (2 min); 12 cycles of 94°C (30 s), 65°C (30 s) (step -0.7°C/cycle for cycles 2 - 12), 72°C (1 min); 23 cycles of 94°C (30 s), 56°C (30 s), 72°C (1 min) and a final extension 72°C (5 min). All amplifications were conducted in Techgene thermocycler (Biometra, Germany).
The selective amplification product were resolved in a 6% polyacrylamide gel prepared with 1x TBE as the running buffer and
electrophoresed at 80 W for 2 h using Biometra Model S2 gel electrophoresis equipment with Biometra Model PS9009TC power supply. After electrophoresis, the amplification products were visualized by silver staining according to the protocol of Bassam et al. (1991). Data analysis
Polymorphic bands from AFLPs were individually
identified by their
specific migration rates in the electrophoretic analyses. Once bands
were properly and distinctively identified, binary (0/1) matrices were
constructed to compare the patterns. Jaccard's similarity coeffi-
cients were generated by the SIMQUAL
subroutine from the NTSYS-pc 2.02e (Exeter Software, Setanket, NY) statistical pack-age. This similarity algorithm was chosen because it ignores 0/0 matches, and is appropriate for molecular marker data producing only dominant bands (such as AFLPs). Cluster analyses along with their corresponding dendrograms
were generated by the UPGMA,
with the SAHN and TREE subroutines from the NTSYS-pc statis-
tical package. The goodness-of-fit of the clustering was tested

Khalighi et al. 549
Table 2. PstI- and MseI-selective nucleotide combinations used for AFLP analysis. Sequences of the adapters and primers used in the pre-amplification indicated at the bottom rows.
S/N Primer combination Polymorphic bands
PstI- MseI- Total bands Number %
1 AAG CAA 16 14 87.5
2 ACT CTA 41 38 92.7
3 AGG CTA 35 34 97.1
4 AGG GCG 40 37 92.5
5 AGT CAT 38 37 97.4
6 AGG CTT 17 16 94.1
7 AG GCG 47 45 95.8
8 ACG CAA 17 16 94.1
9 ACT CAT 20 19 95
10 AG CTT 22 20 90.9
11 ACT CTT 20 18 90
12 AAG CGT 51 47 92.2
13 ACG CGT 35 33 94.3
14 ACG CTG 15 13 86.7
Total 414 387 93.5
PstI adapter Ligation 5'-CCTACGCAGTCTACGAG-3'
3'-ACGTGGATGCGTCAG-5'
MseI adapter
5'-GACGATGAGTCCTGAG-3'
3'-GACTCAGGACTCAT-5'
Primers Pre-amplification
PstI 5'-GACTGCGTACATGCAG-3'
MseI 5'-GATGAGTCCTGAGTAA-3' using the MXCOMP program, which directly compares the original similarity matrix and the cophenetic value matrix, as suggested by Rohlf (1997).
RESULTS AND DISCUSSION
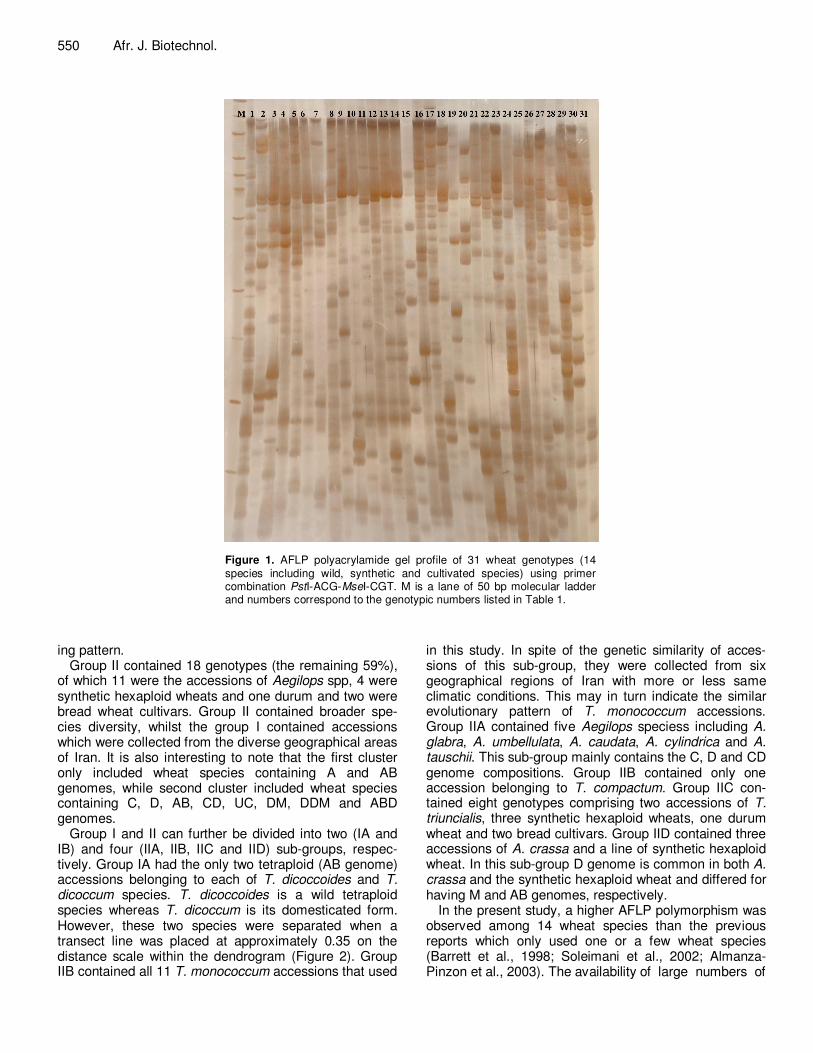
Analysis of the 31 Triticum and Aegilops genotypes with fourteen AFLP primer pairs identified a total of 414 reliably detectable fragments, of which 387 (93.5%) were polymorphic between two or more accessions (Table 2). Primer combinations 7 (P-AG/M-GCG) and 12 (P-AAG/M-CGT) produced the greatest polymorphic bands (45 and 47, respectively) and primer combinations 14 (P-ACG/M-CTG) and 1 (P-AAG/M-CAA) produced the lowest polymorphic bands (13 and 14, respectively) (see Table 2). The average number of bands per primer combination was 30 with a level of polymorphism ranging from 86.7% to 97.4%. An example of an AFLP pattern produced using the PstI-ACG/MseI-CGT primer combi-nation is presented in Figure 1.
The genetic similarity coefficients ranged from 0.12 between A. glabra and accession number 3 of T. monococcum and 0.57 between A. crassa (6x) and A. crassa (4x-6x). Two Aegilops species of A. umbellulata and A. caudata were ranked as the second most related species. The mean of similarity index for 31 studied
genotypes was 25% with the lowest mean of similarity index (32%) belonging to the accessions of T. monocot-ccum. Mean of similarity index for hexaploid synthetic wheats was estimated as 0.34%.
Cluster analysis of 31 accessions belonging to the 14 species was performed using NTSYS-pc statistical package. A dendrogram was generated by UPGMA cluster analysis based on Jaccard’s similarity estimates for AFLP data revealed two main groups (Figure 2). The measure of goodness-of-fit of a cluster analysis is given by the ‘‘cophenetic correlation’’ (r). The dendrogram had a matrix correlation r = 0.8 which is interpreted as a good fit. The two main distinct groups (I and II) had closely corresponded with their genome composition. Group I contained 13 accessions belonging to T. dicoccoides, T. dicoccum and T. monococcum species. Studies on the sequencing of the internal transcribed spacer (ITS)-2 region of nuclear ribosomal DNA showed that the A genome of T. dicoccoides originated from T. monocot-ccum (Zhang et al., 2002). One of the two enzyme used for DNA digestion in AFLP, Pst1, is a methylation sensitive enzyme and will only cut hypomethylated regions (Almanza-Pinzon et al., 2003). Hence, the biased distribution of AFLP markers toward A genome and high genetic similarity between A genome of the einkorn and emmer wheats could be attributed to their similar cluster-
550 Afr. J. Biotechnol.
Figure 1. AFLP polyacrylamide gel profile of 31 wheat genotypes (14 species including wild, synthetic and cultivated species) using primer combination PstI-ACG-MseI-CGT. M is a lane of 50 bp molecular ladder and numbers correspond to the genotypic numbers listed in Table 1.
ing pattern. Group II contained 18 genotypes (the remaining 59%),
of which 11 were the accessions of Aegilops spp, 4 were synthetic hexaploid wheats and one durum and two were bread wheat cultivars. Group II contained broader spe-cies diversity, whilst the group I contained accessions which were collected from the diverse geographical areas of Iran. It is also interesting to note that the first cluster only included wheat species containing A and AB genomes, while second cluster included wheat species containing C, D, AB, CD, UC, DM, DDM and ABD genomes.
Group I and II can further be divided into two (IA and IB) and four (IIA, IIB, IIC and IID) sub-groups, respec-tively. Group IA had the only two tetraploid (AB genome) accessions belonging to each of T. dicoccoides and T. dicoccum species. T. dicoccoides is a wild tetraploid species whereas T. dicoccum is its domesticated form. However, these two species were separated when a transect line was placed at approximately 0.35 on the distance scale within the dendrogram (Figure 2). Group IIB contained all 11 T. monococcum accessions that used
in this study. In spite of the genetic similarity of acces-sions of this sub-group, they were collected from six geographical regions of Iran with more or less same climatic conditions. This may in turn indicate the similar evolutionary pattern of T. monococcum accessions. Group IIA contained five Aegilops speciess including A. glabra, A. umbellulata, A. caudata, A. cylindrica and A. tauschii. This sub-group mainly contains the C, D and CD genome compositions. Group IIB contained only one accession belonging to T. compactum. Group IIC con-tained eight genotypes comprising two accessions of T. triuncialis, three synthetic hexaploid wheats, one durum wheat and two bread cultivars. Group IID contained three accessions of A. crassa and a line of synthetic hexaploid wheat. In this sub-group D genome is common in both A. crassa and the synthetic hexaploid wheat and differed for having M and AB genomes, respectively.
In the present study, a higher AFLP polymorphism was observed among 14 wheat species than the previous reports which only used one or a few wheat species (Barrett et al., 1998; Soleimani et al., 2002; Almanza-Pinzon et al., 2003). The availability of large numbers of

Khalighi et al. 551
Figure 2. Dendrogram generated for 31 wheat genotypes belonging to 14 species using UPGMA cluster analysis based on Jaccard’s similarity estimates for AFLP data.
fragments defining independent genetic loci with highly reproducible polymorphism detection enables the efficient evaluation of genetic diversity. A low level of polymor-phism observed in wheat especially among cultivated lines and/or cultivars (Reif et al., 2005). A narrow genetic diversity among durum wheat genotypes was also found (Soleimani et al., 2002; Shoaib and Arabi, 2006). It has been suggested that genetic diversity in wheat is narrow due to a modern breeding (Huang et al., 2002; Reif et al., 2005). Nevertheless, there has been growing public concern that the tremendous enhancements of yield by modern breeding would go hand in hand with a large decrease in diversity, which could threaten future selec-tion progress. Therefore, increasing the genetic diversity through the introgression of novel materials including wild relatives which contain numerous unique alleles that are absent in modern wheat cultivars should be emphasized.
Expectedly, T. monococcum to T. monococcum subsp baeoticum and likewise, T. dicoccom to T. dicoccoides were very closely related considering their genetic simila-rity coefficients. This finding is in complete agreement with that of Yildirim and Akkaya (2006). This result also supports those classifications that recognize baeoticum as a subspecies of T. monococcum not as a distinct spe-
cies of T. baeoticum (http://www.k-state.edu/wgrc/Taxonomy/taxintro.html for details).
Cluster analysis of 31 Triticum and Aegilops genotypes based on morphological characters, with Dice coefficient followed by UPGMA algorithm, revealed eight major clusters (Arzani et al., 2005). The degree of relationship between the distance estimates based on AFLPs and morphological markers was studied as correlation among all similarity matrices. The correlation between the two measurements correlated was highly significant (r = 0.63**). Despite the differences between similarity matri-ces computed based on the two markers (range= 0.16 – 1.0 and mean = 0.54 for morphological markers and range= 0.12 – 0.57 and mean= 0.25 for AFLP markers), similarities in the two measurements were identified according to both the correlations of the similarity indices and discriminating of genotypes in the cluster analyses. Lage et al. (2003) used 5 morphological markers with 13 agronomic (quantitative) traits and AFLPs to assess the genetic diversity of synthetic hexaploid wheats and their comparison of genetic distances showed no correlation between the two diversity measurements. Our study of AFLP and morphological diversity in 31 wheat genotypes belonging to 14 species shows that the wild relatives are

552 Afr. J. Biotechnol. valuable sources for increasing variation to incorporate novel germplasm in the cultigens. ACKNOWLEDGMENT This research was supported in part by Interuniversity Research Funds of Isfahan University of Technology and Shahrekord University. REFERENCES Almanza-Pinzon I, Khairallah M, Fox PN, Warburton ML (2003).
Comparison of molecular markers and coefficients of parentage for the analysis of genetic diversity among spring bread wheat genotypes. Euphytica 130: 77-86.
Arzani A, Khalighi MR, Shiran B, Kharazian N (2005). Evaluation of diversity in wild relatives of wheat. Czech. J. Genet. Plant Breed. 41: 112-117.
Arzani A, Poursiahbidi M, Rezai A (2000). Influences of durum wheat and Aegilops genotypes on the production of amphihaploid plants. Iran Agric. Res. 19: 49-62.
Barrett BA, Kidwell KK (1998). AFLP-based genetic diversity assessment among wheat cultivars from the Pacific Northwest. Crop Sci. 38: 1261-1271.
Barrett BA, Kidwell KK, Fox PN (1998). Comparison of AFLP and pedigree-based genetic diversity assessment methods using wheat cultivars from the Pacific Northwest. Crop Sci. 38: 1271-1278.
Bassam BJ, Caetano-Anolles G, Gresshoff PM (1991). Fast and sensitive silver staining of DNA in polyacrylamide gels. Anal. Biochem. 196: 80-83.
Bohn M, Utz HF, Melchinger AE (1999). Genetic similarities among winter wheat cultivars determined on the basis of RFLPs, AFLPs, SSRs and their use for predicting progeny variance. Crop Sci 39: 228–237.
CIMMYT (2003). Wheat in the developing world. http://www.cimmyt.org /research/wheat/map/developing_world/index.htm
Dellaporta SL, Wood J, Hicks JB (1983). A plant DNA minipreparation. Plant Mol. Biol. Rep. 1: 19-21.
Dvorak J, Luo MC, Yang ZL, Zhang HB (1998). The structure of the Aegilops tauschii genepool and the evolution of hexaploid wheat. Theor. Appl. Genet. 97: 657–670
Friebe B, Jiang J, Raupp WJ, McIntosh RA, Gill BS (1996). Characterization of wheat alien translocations conferring resistance to diseases and pests. Euphytica 91: 59-87.
Huang XQ, Borner A, Roder M, Ganal MW (2002). Assessing genetic diversity of wheat (Triticum aestivum L.) germplasm using microsatellite markers. Theor. Appl. Genet. 105: 699-707.
Jiang J, Friebe B, Gill BS (1993). Recent advances in alien gene transfer in wheat. Euphytica 73: 199-212.
Lage J, Warburton ML, Crossa J, Skovmand B, Andersen SB (2003). Assessment of genetic diversity in synthetic hexaploid wheats and their Triticum dicoccum and Aegilops tauschii parents using AFLPs and agronomic traits. Euphytica 134: 305-317.
Lagudah ES, Appels R, McNeil D, Schachtman DP (1993). Exploiting
the diploid ‘D’genome chromatin for wheat improvement. In ‘Gene conservation and Exploitation’ (Eds. Gustafson JP, Appels R, Raven R), pp. 87-107, (Plenum Press, NY, USA).
Nishikawa K, Furuta Y, Wada T (1980). Genetic studies on alpha-amylase isozymes in wheat. III. Intraspecific variation in Aegilops squarrosa and birthplace of hexaploid wheat. Jpn. J. Genet. 55: 325-336.
Reif JC, Zhang P, Dreisigacker S, Warburton ML, van Ginkel M, Hoisington D, Bohn M, Melchinger AE (2005). Wheat genetic diversity trends during domestication and breeding. Theor. Appl. Genet. 110: 859-864.
Rejesus RM, van Ginkel M, Smale M (1996). Wheat Breeder’s Perspectives of Genetic Diversity and Germplasm Use. Wheat Special Report 40. Mexico D.F., CIMMYT.
Ridout CJ, Donini P (1999). Use of AFLP in cereals research. Trends Plant Sci. 4: 76-79.
Rohlf FJ (1997). Numerical Taxonomy and Multivariance Analysis System, [201]. Department of Ecology and Evolution State, Univeristy of New York.
Sharma HC (1995). How wide can a wide cross be? Euphytica 82: 43-64.
Shoaib A, Arabi MIE (2006). Genetic diversity among Syrian cultivated and landraces wheat revealed by AFLP markers. Genet. Resour. Crop Evol. 53: 901-906.
Soleimani VD, Baum BR, Johnson DA (2002). AFLP and pedigree-based genetic diversity estimates in modern cultivars of durum wheat [Triticum turgidum L. subsp. durum (Desf.) Husn.]. Theor. Appl. Genet. 104: 350-357.
Thompson JP, Haak MI (1997). Resistance to root lesion nematode (Pratylenchus thornei) in Aegilops tauschii Coss., the D-genome donor of wheat. Austr. J. Agric. Res. 48: 553-559.
van Slageren MW (1994). Wild Wheats: a monograph of Aegilops L. and Amblyopyrum (Jaub. & Spach) Eig (Poaceae). Wageningen Agricultural University Papers 94–97, Wageningen, the Netherlands.
Vos P, Hogers R, Bleeker M, Reijans M, Van De Lee T, Hornes M, Fritjers A, Pot J, Peleman J, Kuiper M, Zabeau M (1995). AFLP: a new technique for DNA fingerprint. Nucleic Acid Res. 23: 4407–4414.
Yildirim F, Akkaya MS (2006). DNA fingerprinting and genetic characterization of Anatolian Triticum spp. using AFLP markers. Genet. Resour. Crop Evol. 53: 1033-1042.
Zhang W, Qu L-J, Gu H, Gao W, Liu M, Chen J, Chen Z (2002). Studies on the origin and evolution of tetraploid wheats based on the internal transcribed spacer (ITS) sequences of nuclear ribosomal DNA. Theor. Appl. Genet. 104: 1099-1106.