Embed Size (px)
Citation preview
7/25/2019 Assessment of Geothermal Potential at Ungaran Volcano, Indonesia
http://slidepdf.com/reader/full/assessment-of-geothermal-potential-at-ungaran-volcano-indonesia 1/6
PROCEEDINGS, Thirty-Fourth Workshop on Geothermal Reservoir Engineering
Stanford University, Stanford, California, February 9-11, 2009
SGP-TR-187
ASSESSMENT OF GEOTHERMAL POTENTIAL AT UNGARAN VOLCANO, INDONESIA
DEDUCED FROM NUMERICAL ANALYSIS
Agus Setyawan1, Sachio Ehara2, Yasuhiro Fujimitsu2, Hakim Saibi2
1 Department of Physics, Faculty of Mathematics and Natural Science, Diponegoro University, Jl.Prof.Soedarto,
Semarang, Indonesia.2Department of Earth Resources Engineering, Faculty of Engineering, Kyushu University, 744, Motooka, Nishi-ku,
Fukuoka 819-0395, Japan.
e-mail: [email protected]
ABSTRACT
Ungaran volcano is located in the Central Java,
Indonesia. Numerical analysis has performed in orderto assess the geothermal potential of Ungaran
volcano using a 3-D finite difference simulator
HYDROTHERM Ver2.2. A conceptual model
constructed based on the results of geophysical
studies such as gravity, spontaneous-potential, micro-
earthquake, infrared imagery and shallow ground
temperature. Deep geothermal fluids have been
supplied from below in the central part of the
volcano, then change into a lateral flow; part of the
geothermal fluid reaches to the ground surface and
forms the Gedongsongo fumarole area. The
background temperature distributions and mass flux
patterns were calculated for 150,000 years to obtain
the quasi-steady state. The meteoric water flow
pattern demonstrates predominant downward flow,
with mass flux varying between 10-8
g/cm2sec up to
10-7
g/cm2sec. The thermal evolution was calculated
for up to 30,000 years. The deep geothermal fluids
supplied from below in the central part of the volcano
has an enthalpy of 1085 kJ/kg (250oC) and a mass
flow of 230 kg/s to 250 kg/s. In order to estimate the
geothermal potential for conventional electric power
production, we employed the minimum reservoir
temperature is 150oC and the performance of
reservoir was predicted for 30 years production.
Depths of the reservoir are assumed from 0.5 km to 3
km beneath mean sea level. As the result, theestimated geothermal potentials are 2.3 MW up to
40.4 MW depending on different thicknesses of the
reservoir.Keywords: Ungaran volcano, Indonesia, numerical
analysis, assessment geothermal potential
INTRODUCTION
Ungaran volcano located in the Central Java province
about 30 Km southwest of Semarang, Indonesia as
shown in Figure 1, is still undeveloped geothermal
prospect. There are some geothermal manifestations
at the piedmont of Ungaran volcano. Gedongsongo is
the main geothermal manifestation in Ungaranvolcano, located in the southern part of the Ungaran
volcano which several geothermal manifestations
such as fumaroles, hot springs, hot acid pool and acid
surface hydrothermal alteration rocks exist. In this
study, a hydrothermal model of Ungaran volcano is
presented using numerical simulation technique
based on mass and energy balance equations,
supported by the computer program
HYDROTHERM 2.2. (Hayba and Ingebritsen, 1994).
The objective of this study is to assess the geothermal
potential of Ungaran volcano for conventional
electric power production.
Figure 1: Location of the study area.
7/25/2019 Assessment of Geothermal Potential at Ungaran Volcano, Indonesia
http://slidepdf.com/reader/full/assessment-of-geothermal-potential-at-ungaran-volcano-indonesia 2/6
GEOLOGY
Ungaran is a complex volcano consisting of a
younger body, which was formed by the most recent
volcanic activity, and an older body formed by prior
volcanic activity. The Young Ungaran body seems to
have been constructed inside a caldera formed during
the older Ungaran activity. According to Kohno etal. (2006), the Old Ungaran body formed prior to
500,000 years ago, and the Young Ungaran volcano
did not form until 300,000 years ago. The volcanic
rocks are rich in alkali elements and are classified as
trachyandesite to trachybasaltic andesite. Ungaran
volcanic area is composed of andesitic lava, perlitic
lava, and volcanic breccia from the post Ungaran
caldera stages, as shown in Figure 2 (Thanden et al.,
1996). There are geothermal manifestations at the
piedmont of Ungaran, namely Gedongsongo,
Banaran, Kendalisodo, Diwak, Kaliulo, and Nglimut.
Gedongsongo is the main geothermal feature
associated with the Quaternary Ungaran andesiticvolcanic complex. Moreover, a structural analysis of
this area has revealed that the Ungaran volcanic
system is controlled primarily by the occurrence of
the Ungaran collapse structure running from the
northwest to the southeast. Fault systems trending
northwest to southeast and northeast to southwest
control the old volcanic rocks of the pre-caldera
formation.
Figure 2: Geologic map.
CONCEPTUAL GEOTHERMAL MODEL
A model of underground geothermal fluid flows was
presented based on the several geophysical surveys
(Setyawan et al., 2008). The geophysical surveys
consist of spontaneous-potential (SP), micro-
earthquake, infrared imagery, and shallow ground
temperature observations. SP data showed that the
main upflow zone of geothermal fluid is situated at
the central part of the volcano around the collapse
wall and the lateral flow of geothermal fluid causes
the geothermal activities at Gedongsongo area. Two
hundred seventy events including four earthquake
swarms were recorded during 4-day seismic
observation in 2005, and the hypocenters are
distribute located in a shallower region than 500 m
around the collapsed wall. The total heat discharge
rate from Gedongsongo area was estimated as 1.25
MW by using the infrared imagery and the hot
springs data. The shallow ground temperatures
exhibit negative trend with altitude and it shows that
geothermal anomalies are only distributed around
Gedongsongo fumarole area. The following
conceptual model of hydrothermal system beneath
Ungaran volcano was presented based on the
geophysical, geological and geochemical data. Deep
geothermal fluids are supplied from below in the
central part of the volcano, then changes into a lateral
flow; part of the geothermal fluid reaches to the
ground surface and forms the Gedongsongo fumarole
area.
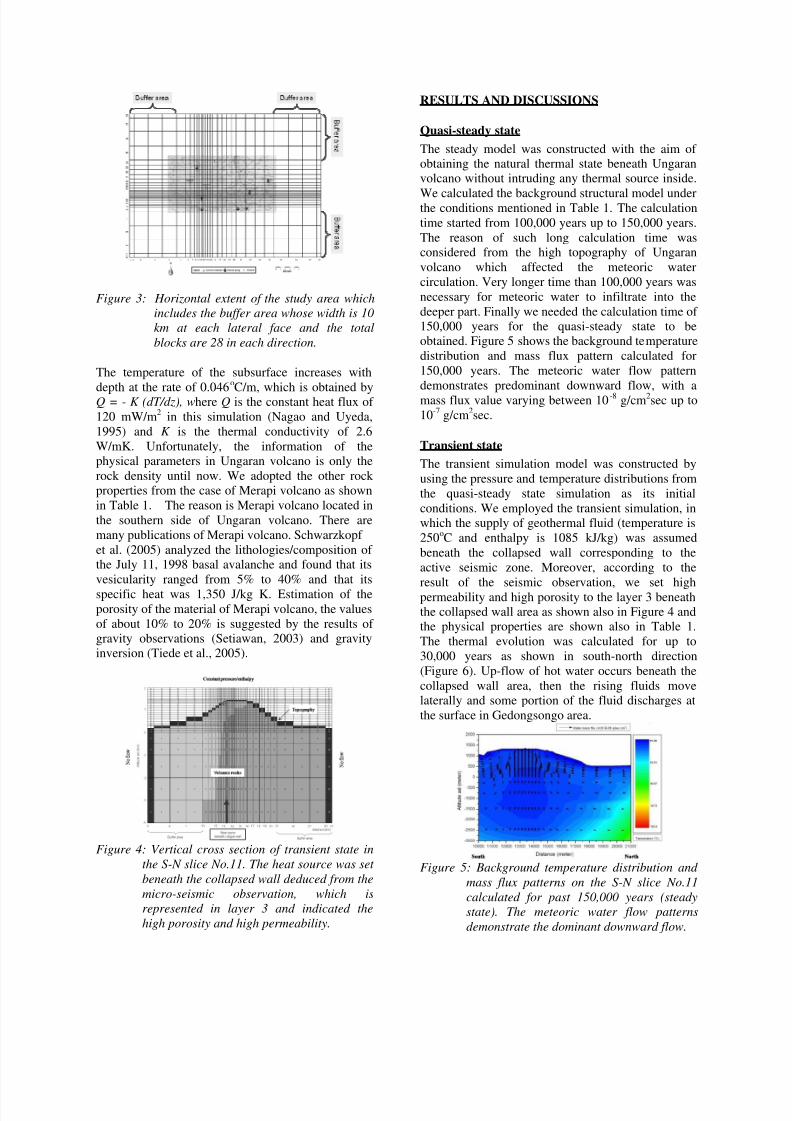
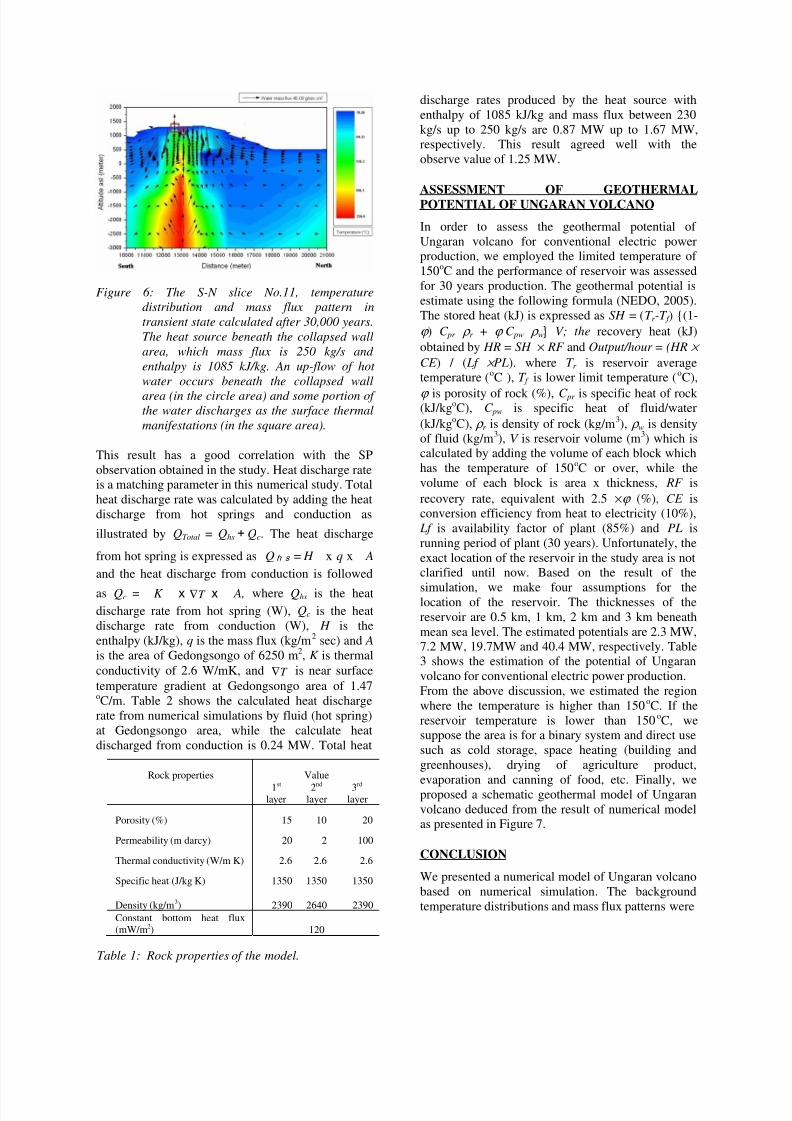
GRID DESIGN AND BOUNDARY CONDITION
The numerical simulation covers an area of 21 km in
a east-west direction, 11 km in a north-south
direction as depicted in Figure 3. In order to absorb
the boundary effect of the numerical model, we set
the extra block and called the buffer areas. The buffer
areas are set 10 km each lateral faces of the analytical
area. The vertical cross section of the center edifice
in slice No 18 of east-west direction was presented in
Figure 4. The vertical pressure distribution is given as
hydrostatic and the ground surface boundary pressure
value is fixed at 1.013 bars. The hydrological
boundary condition at the surface is assumed to be
permeable. To set up constant-value and no-flow
boundaries, HYDROTHERM uses the following
convention for indexing blocks and allowing flow
between blocks. In the input file, the user labels
active blocks with sequential positive-integer values,
constant blocks with -1, and inactive blocks with 0.
Interface between active and inactive blocks are no-
flow boundaries, as are the sides of active blocks that
lie on the grid boundaries. Flow between constant
blocks and an adjacent active block varies with the
pressure/enthalpy conditions in the active block.
According to the results of 2D modeling of gravity,
we set two layers in Ungaran volcano; the first layer
is lower density and the second layer is higherdensity. The detail setting of layer blocks: (-1) is
constant blocks of 1st layer, (-2) constant block of 2
nd
layer, (1) is active blocks of 1st layer, (2) is active
block of 2nd
layer and (0) is inactive blocks, which
also can be seen in Figure 4. The temperature (T ) of
the surface is according from the altitude point ( H )
following the empirical formula obtained by shallow
ground temperature measurement of Ungaran on
September 2007, which is followed by:
T = 33.56 oC – 0.0084 (
oC/m) x H (m).
7/25/2019 Assessment of Geothermal Potential at Ungaran Volcano, Indonesia
http://slidepdf.com/reader/full/assessment-of-geothermal-potential-at-ungaran-volcano-indonesia 3/6
Figure 3: Horizontal extent of the study area which
includes the buffer area whose width is 10
km at each lateral face and the total
blocks are 28 in each direction.
The temperature of the subsurface increases with
depth at the rate of 0.046
o
C/m, which is obtained byQ = - K (dT/dz), where Q is the constant heat flux of
120 mW/m2 in this simulation (Nagao and Uyeda,
1995) and K is the thermal conductivity of 2.6
W/mK. Unfortunately, the information of the
physical parameters in Ungaran volcano is only the
rock density until now. We adopted the other rock
properties from the case of Merapi volcano as shown
in Table 1. The reason is Merapi volcano located in
the southern side of Ungaran volcano. There are
many publications of Merapi volcano. Schwarzkopf
et al. (2005) analyzed the lithologies/composition of
the July 11, 1998 basal avalanche and found that its
vesicularity ranged from 5% to 40% and that its
specific heat was 1,350 J/kg K. Estimation of the
porosity of the material of Merapi volcano, the values
of about 10% to 20% is suggested by the results of
gravity observations (Setiawan, 2003) and gravity
inversion (Tiede et al., 2005).
Figure 4: Vertical cross section of transient state in
the S-N slice No.11. The heat source was set
beneath the collapsed wall deduced from the
micro-seismic observation, which is
represented in layer 3 and indicated the
high porosity and high permeability.
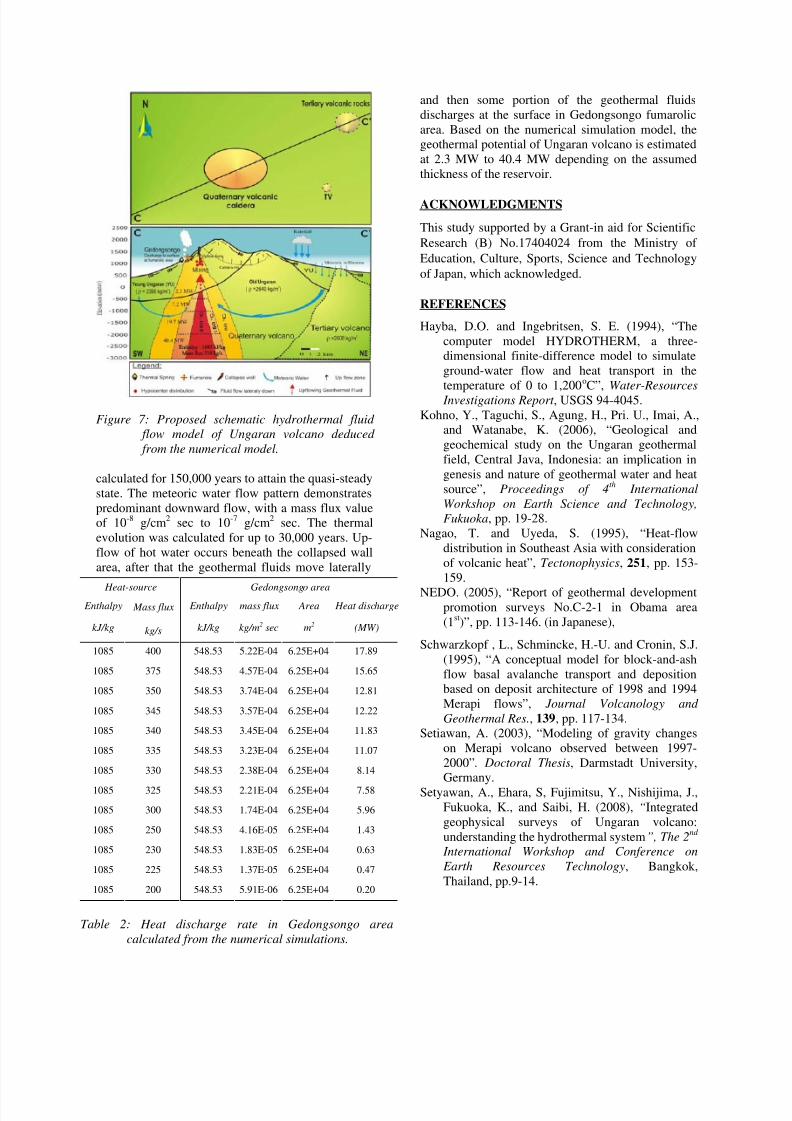
RESULTS AND DISCUSSIONS
Quasi-steady state
The steady model was constructed with the aim of
obtaining the natural thermal state beneath Ungaran
volcano without intruding any thermal source inside.
We calculated the background structural model underthe conditions mentioned in Table 1. The calculation
time started from 100,000 years up to 150,000 years.
The reason of such long calculation time was
considered from the high topography of Ungaran
volcano which affected the meteoric water
circulation. Very longer time than 100,000 years was
necessary for meteoric water to infiltrate into the
deeper part. Finally we needed the calculation time of
150,000 years for the quasi-steady state to be
obtained. Figure 5 shows the background temperature
distribution and mass flux pattern calculated for
150,000 years. The meteoric water flow pattern
demonstrates predominant downward flow, with a
mass flux value varying between 10-8 g/cm2sec up to
10-7
g/cm2sec.
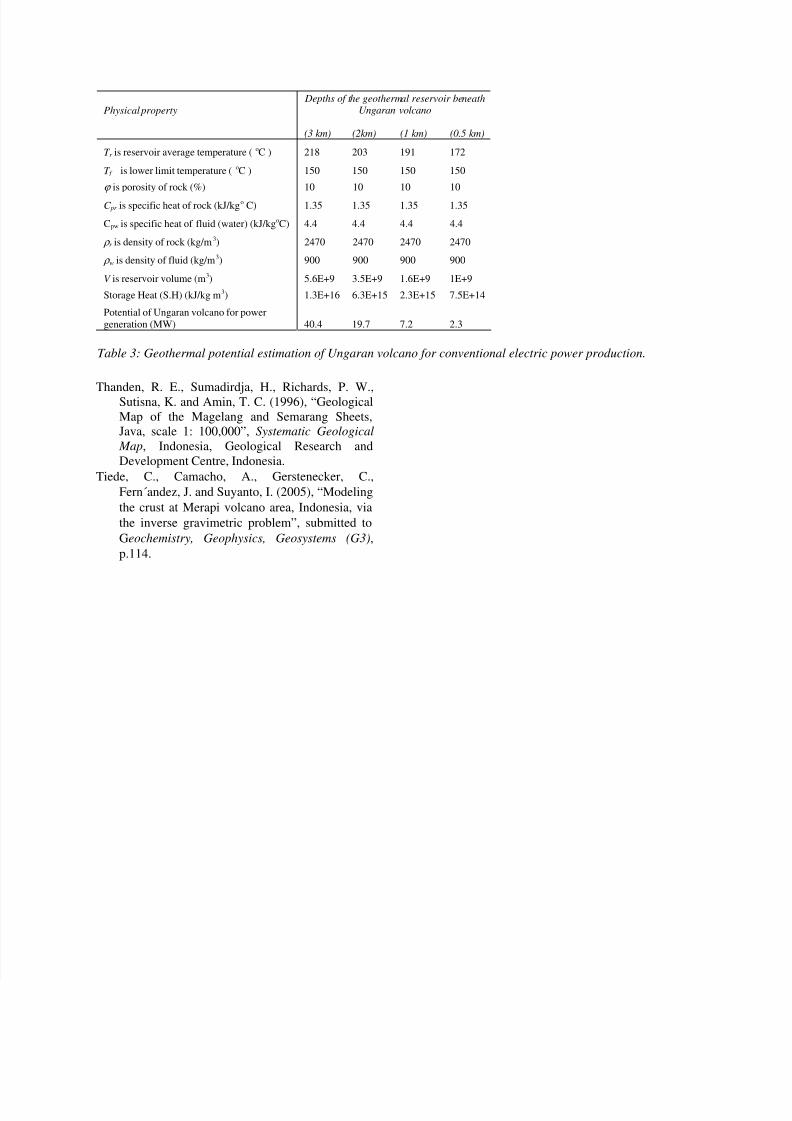
Transient state
The transient simulation model was constructed by
using the pressure and temperature distributions from
the quasi-steady state simulation as its initial
conditions. We employed the transient simulation, in
which the supply of geothermal fluid (temperature is
250oC
and enthalpy is 1085 kJ/kg) was assumed
beneath the collapsed wall corresponding to the
active seismic zone. Moreover, according to the
result of the seismic observation, we set high
permeability and high porosity to the layer 3 beneath
the collapsed wall area as shown also in Figure 4 and
the physical properties are shown also in Table 1.
The thermal evolution was calculated for up to
30,000 years as shown in south-north direction
(Figure 6). Up-flow of hot water occurs beneath the
collapsed wall area, then the rising fluids move
laterally and some portion of the fluid discharges at
the surface in Gedongsongo area.
Figure 5: Background temperature distribution and
mass flux patterns on the S-N slice No.11
calculated for past 150,000 years (steady
state). The meteoric water flow patterns
demonstrate the dominant downward flow.
7/25/2019 Assessment of Geothermal Potential at Ungaran Volcano, Indonesia
http://slidepdf.com/reader/full/assessment-of-geothermal-potential-at-ungaran-volcano-indonesia 4/6
Figure 6: The S-N slice No.11, temperature
distribution and mass flux pattern in
transient state calculated after 30,000 years.
The heat source beneath the collapsed wall
area, which mass flux is 250 kg/s and
enthalpy is 1085 kJ/kg. An up-flow of hot
water occurs beneath the collapsed wall
area (in the circle area) and some portion ofthe water discharges as the surface thermal
manifestations (in the square area).
This result has a good correlation with the SP
observation obtained in the study. Heat discharge rate
is a matching parameter in this numerical study. Total
heat discharge rate was calculated by adding the heat
discharge from hot springs and conduction as
illustrated by QTotal = Qhs+Qc. The heat discharge
from hot spring is expressed as Qhs = H x q x A
and the heat discharge from conduction is followed
as Qc = K x T ∇ x A, where Qhs is the heat
discharge rate from hot spring (W), Qc is the heat
discharge rate from conduction (W), H is the
enthalpy (kJ/kg), q is the mass flux (kg/m2 sec) and A
is the area of Gedongsongo of 6250 m2, K is thermal
conductivity of 2.6 W/mK, and T ∇ is near surface
temperature gradient at Gedongsongo area of 1.47oC/m. Table 2 shows the calculated heat discharge
rate from numerical simulations by fluid (hot spring)
at Gedongsongo area, while the calculate heat
discharged from conduction is 0.24 MW. Total heat
discharge rates produced by the heat source with
enthalpy of 1085 kJ/kg and mass flux between 230
kg/s up to 250 kg/s are 0.87 MW up to 1.67 MW,
respectively. This result agreed well with the
observe value of 1.25 MW.
ASSESSMENT OF GEOTHERMAL
POTENTIAL OF UNGARAN VOLCANO
In order to assess the geothermal potential of
Ungaran volcano for conventional electric power
production, we employed the limited temperature of
150oC and the performance of reservoir was assessed
for 30 years production. The geothermal potential is
estimate using the following formula (NEDO, 2005).
The stored heat (kJ) is expressed as SH = (T r -T f ) {(1-
ϕ ) C pr ρ r + ϕ C pw ρ w} V; the recovery heat (kJ)
obtained by HR = SH × RF and Output/hour = (HR ×
CE ) / ( Lf × PL). where T r is reservoir average
temperature (oC ), T f is lower limit temperature (
oC),
ϕ is porosity of rock (%), C pr is specific heat of rock(kJ/kg
oC), C pw is specific heat of fluid/water
(kJ/kgoC), ρ r is density of rock (kg/m
3), ρ w is density
of fluid (kg/m3), V is reservoir volume (m
3) which is
calculated by adding the volume of each block which
has the temperature of 150oC or over, while the
volume of each block is area x thickness, RF is
recovery rate, equivalent with 2.5 ×ϕ (%), CE is
conversion efficiency from heat to electricity (10%),
Lf is availability factor of plant (85%) and PL is
running period of plant (30 years). Unfortunately, the
exact location of the reservoir in the study area is not
clarified until now. Based on the result of the
simulation, we make four assumptions for thelocation of the reservoir. The thicknesses of the
reservoir are 0.5 km, 1 km, 2 km and 3 km beneath
mean sea level. The estimated potentials are 2.3 MW,
7.2 MW, 19.7MW and 40.4 MW, respectively. Table
3 shows the estimation of the potential of Ungaran
volcano for conventional electric power production.
From the above discussion, we estimated the region
where the temperature is higher than 150oC. If the
reservoir temperature is lower than 150oC, we
suppose the area is for a binary system and direct use
such as cold storage, space heating (building and
greenhouses), drying of agriculture product,
evaporation and canning of food, etc. Finally, weproposed a schematic geothermal model of Ungaran
volcano deduced from the result of numerical model
as presented in Figure 7.
CONCLUSION
We presented a numerical model of Ungaran volcano
based on numerical simulation. The background
temperature distributions and mass flux patterns were
Rock properties Value
1st layer
2nd layer
3rd layer
Porosity (%) 15 10 20
Permeability (m darcy) 20 2 100
Thermal conductivity (W/m K) 2.6 2.6 2.6
Specific heat (J/kg K) 1350 1350 1350
Density (kg/m3) 2390 2640 2390
Constant bottom heat flux(mW/m2) 120
Table 1: Rock properties of the model.
7/25/2019 Assessment of Geothermal Potential at Ungaran Volcano, Indonesia
http://slidepdf.com/reader/full/assessment-of-geothermal-potential-at-ungaran-volcano-indonesia 5/6
Figure 7: Proposed schematic hydrothermal fluid
flow model of Ungaran volcano deduced
from the numerical model.
calculated for 150,000 years to attain the quasi-steady
state. The meteoric water flow pattern demonstrates
predominant downward flow, with a mass flux value
of 10-8
g/cm2 sec to 10
-7 g/cm
2 sec. The thermal
evolution was calculated for up to 30,000 years. Up-
flow of hot water occurs beneath the collapsed wall
area, after that the geothermal fluids move laterally
and then some portion of the geothermal fluids
discharges at the surface in Gedongsongo fumarolic
area. Based on the numerical simulation model, the
geothermal potential of Ungaran volcano is estimated
at 2.3 MW to 40.4 MW depending on the assumed
thickness of the reservoir.
ACKNOWLEDGMENTS
This study supported by a Grant-in aid for Scientific
Research (B) No.17404024 from the Ministry of
Education, Culture, Sports, Science and Technology
of Japan, which acknowledged.
REFERENCES
Hayba, D.O. and Ingebritsen, S. E. (1994), “The
computer model HYDROTHERM, a three-
dimensional finite-difference model to simulate
ground-water flow and heat transport in the
temperature of 0 to 1,200oC”, Water-Resources
Investigations Report , USGS 94-4045.
Kohno, Y., Taguchi, S., Agung, H., Pri. U., Imai, A.,
and Watanabe, K. (2006), “Geological and
geochemical study on the Ungaran geothermal
field, Central Java, Indonesia: an implication in
genesis and nature of geothermal water and heat
source”, Proceedings of 4th
International
Workshop on Earth Science and Technology,
Fukuoka, pp. 19-28.
Nagao, T. and Uyeda, S. (1995), “Heat-flow
distribution in Southeast Asia with consideration
of volcanic heat”, Tectonophysics, 251, pp. 153-
159.
NEDO. (2005), “Report of geothermal developmentpromotion surveys No.C-2-1 in Obama area
(1st)”, pp. 113-146. (in Japanese),
Schwarzkopf , L., Schmincke, H.-U. and Cronin, S.J.
(1995), “A conceptual model for block-and-ash
flow basal avalanche transport and deposition
based on deposit architecture of 1998 and 1994
Merapi flows”, Journal Volcanology and
Geothermal Res., 139, pp. 117-134.
Setiawan, A. (2003), “Modeling of gravity changes
on Merapi volcano observed between 1997-
2000”. Doctoral Thesis, Darmstadt University,
Germany.
Setyawan, A., Ehara, S, Fujimitsu, Y., Nishijima, J.,
Fukuoka, K., and Saibi, H. (2008), “Integrated
geophysical surveys of Ungaran volcano:
understanding the hydrothermal system”, The 2nd
International Workshop and Conference on
Earth Resources Technology, Bangkok,
Thailand, pp.9-14.
Heat-source Gedongsongo area
Enthalpy Mass flux Enthalpy mass flux Area Heat discharge
kJ/kg kg/s kJ/kg kg/m2 sec m2 (MW)
1085 400 548.53 5.22E-04 6.25E+04 17.89
1085 375 548.53 4.57E-04 6.25E+04 15.65
1085 350 548.53 3.74E-04 6.25E+04 12.81
1085 345 548.53 3.57E-04 6.25E+04 12.22
1085 340 548.53 3.45E-04 6.25E+04 11.83
1085 335 548.53 3.23E-04 6.25E+04 11.07
1085 330 548.53 2.38E-04 6.25E+04 8.14
1085 325 548.53 2.21E-04 6.25E+04 7.58
1085 300 548.53 1.74E-04 6.25E+04 5.96
1085 250 548.53 4.16E-05 6.25E+04 1.43
1085 230 548.53 1.83E-05 6.25E+04 0.63
1085 225 548.53 1.37E-05 6.25E+04 0.47
1085 200 548.53 5.91E-06 6.25E+04 0.20
Table 2: Heat discharge rate in Gedongsongo area
calculated from the numerical simulations.
7/25/2019 Assessment of Geothermal Potential at Ungaran Volcano, Indonesia
http://slidepdf.com/reader/full/assessment-of-geothermal-potential-at-ungaran-volcano-indonesia 6/6
Thanden, R. E., Sumadirdja, H., Richards, P. W.,Sutisna, K. and Amin, T. C. (1996), “Geological
Map of the Magelang and Semarang Sheets,
Java, scale 1: 100,000”, Systematic Geological
Map, Indonesia, Geological Research and
Development Centre, Indonesia.
Tiede, C., Camacho, A., Gerstenecker, C.,
Fern´andez, J. and Suyanto, I. (2005), “Modeling
the crust at Merapi volcano area, Indonesia, via
the inverse gravimetric problem”, submitted to
Geochemistry, Geophysics, Geosystems (G3),
p.114.
Physical property
Depths of the geothermal reservoir beneathUngaran volcano
(3 km) (2km) (1 km) (0.5 km)
T r is reservoir average temperature ( oC ) 218 203 191 172
T f is lower limit temperature ( oC ) 150 150 150 150
ϕ is porosity of rock (%) 10 10 10 10
C pr is specific heat of rock (kJ/kgo C) 1.35 1.35 1.35 1.35
Cpw is specific heat of fluid (water) (kJ/kgoC) 4.4 4.4 4.4 4.4
ρ r is density of rock (kg/m3) 2470 2470 2470 2470
ρ w is density of fluid (kg/m3) 900 900 900 900
V is reservoir volume (m3) 5.6E+9 3.5E+9 1.6E+9 1E+9
Storage Heat (S.H) (kJ/kg m3) 1.3E+16 6.3E+15 2.3E+15 7.5E+14
Potential of Ungaran volcano for power
generation (MW) 40.4 19.7 7.2 2.3
Table 3: Geothermal potential estimation of Ungaran volcano for conventional electric power production.