Embed Size (px)
Citation preview
Environmental Engineering and Management Journal July 2015, Vol.14, No. 7, 1761-1770
http://omicron.ch.tuiasi.ro/EEMJ/
“Gheorghe Asachi” Technical University of Iasi, Romania
ASSESSMENT OF INDOOR POLLUTION IN A SCHOOL
ENVIRONMENT THROUGH BOTH PASSIVE
AND CONTINUOUS SAMPLINGS
Ivano Vassura1,2, Elisa Venturini1, Elena Bernardi2, Fabrizio Passarini1,2, Gaetano Settimo3
1University of Bologna, Interdepartmental Centre for Industry Research “Energy and Environment”,
22 via Angherà, I-47900 Rimini, Italy 2University of Bologna, Department of Industrial Chemistry “Toso Montanari”, 4 Viale Risorgimento, I-40146 Bologna, Italy
3Istituto Superiore di Sanità, Environment Department, 299 Viale Regina Elena, I-00161 Roma, Italy
Abstract The aim of this study is to assess indoor air quality in an educational institute located in a suburban area of the Po plain (Italy). Samplings are carried out in preschool and elementary school classrooms, and also in the garden of the institute, to have information on outdoor levels. The monitoring is performed to determine the most important indoor pollutants (i.e. volatile organic compounds (VOCs), carbonyls and NO2), by using diffusive passive samplers. Sampling in the classrooms is undertaken only during the lessons, in order to have the evaluation of student exposition to the indoor pollutant burden. To assess seasonal variation, two campaigns are performed, one in winter and the other in spring. Alternatively in the two classrooms, real-time samplers of total VOCs and some chemical-physic parameters, such as CO and CO2, are employed. Results show that the classrooms are characterized by low concentration of the pollutants monitored with diffusive samplers, lower than guideline (ex. WHO) and European legislation law limits. Only limonene shows concentrations higher than European schools mean values, and in elementary classroom they are higher. For the most of the analyzed compounds, there is a contribution of indoor source emissions, especially for aldehydes. Indoor emissions are similar in the monitored classrooms. Daily trends confirm that VOCs have mainly an indoor origin since they are similar to CO2 ones. However, on same days the contribution of outdoor sources is important. Furthermore, on-line monitored CO2 concentrations suggest that ventilation in the monitored rooms could be improved. Key words: children, formaldehyde, indoor air quality, on-line detectors, and volatile organic compounds Received: December, 2014; Revised final: June, 2015; Accepted: June, 2015
Author to whom all correspondence should be addressed: e-mail: [email protected]; Phone/Fax: +39 051 2093863
1. Introduction It is nowadays commonly defined as “indoor”
all not industrial life and working environments and in particular dwelling, recreation, work and transport places (Agreement, 2001; Fanger, 2006). Indoor pollutants may produce effects both individually and together with other factors, and cause a decrease in environmental comfort and health risk. Among chemical components usually found in indoor air,
some of the most important categories are volatile organic compounds (VOC, i.e. organic compounds with a boiling temperature between 50 °C and 260 °C) and carbonyl compounds (WHO, 1989). For some pollutants, which are present in indoor environment and for which scientific knowledge on effects on human health was judged well-defined, WHO settled guidelines for indoor air quality for European region. For carcinogenic pollutants, a unit risk for general population associated to their
Vassura et al./Environmental Engineering and Management Journal 14 (2015), 7, 1761-1770
1762
presence in the air is defined. The considered pollutants are: benzene, nitrogen dioxide, polycyclic aromatic hydrocarbons (especially benzo[a]pyrene), naphthalene, carbon monoxide, radon, trichloroethylene and tetrachloroethylene (WHO, 2010).
Priority ranking for indoor air pollutants was identified by European Commission INDEX project. Three groups were defined: group 1 - high priority chemicals, it encompasses formaldehyde, nitrogen dioxide, carbon monoxide, benzene and naphthalene; group 2 -second priority chemicals, acetaldehyde, o-, p- and m-xylene, toluene and styrene are included; group 3 - additional chemicals of interest, encompasses Ammonia, delta-Limonene, and alpha-Pinene (JRC, 2005; Koistinen et al., 2008).
In Europe, urban population spend on average 95-97% of its time in closed environment, 2.4% in means of transport and 1% outdoor (BBW, 1997). Since a great part of population spends its time in closed environment, indoor pollution exposition is prevalent compared to outdoor. For more vulnerable sections of population, such as children that spend the main part of their time at home or at school, indoor air pollutant exposition may lead to the occurrence of specific pathologies or to the worsening of preexisting (Franchi et al., 2006; Oliveira Fernandes et al., 2009).
On 2010, some Italian ministers and WHO representatives responsible for health and the environment declared that, among health challenges of our time, there are the health risks to children and other vulnerable groups posed by poor environmental, working and living conditions (especially the lack of water and sanitation) (WHO and Italian Ministers, 2010).
Usually, indoor VOC monitoring is performed by passive samplers (Geiss et al., 2011; Godoi et al., 2013; Pegas et al., 2011a, 2011b). In some studies, real-time, continuous monitors were also employed. These instruments are useful to understand the
temporal changes in actual indoor air quality (Hori et al., 2013). In several studies, they are employed to evaluate the emissions of a specific source (Halios et al., 2005; Su et al., 2007; Zhao et al., 2014), or short-term monitoring, not exceeding four days, were undertaken, in order to have spot information on indoor pollution (Hori et al., 2013; Ramos et al., 2014; Sarkhosh et al., 2012).
In other studies, longer monitoring was performed, but only on-line data were collected (Helmis et al., 2009). In this work, a more comprehensive study was performed.
The aim of this study is to assess indoor air quality in an educational institute. The monitoring was performed during several weeks, both in winter and in spring, to obtain a long-term overview of the indoor air quality in the institute (ISS, 2013). As well as seasonal, outdoor source influence was taken into account, by performing samplings also in the garden of the institute. Besides the common and widespread monitoring by passive samplers, real time monitors were employed.
2. Material and methods
2.1. Site description
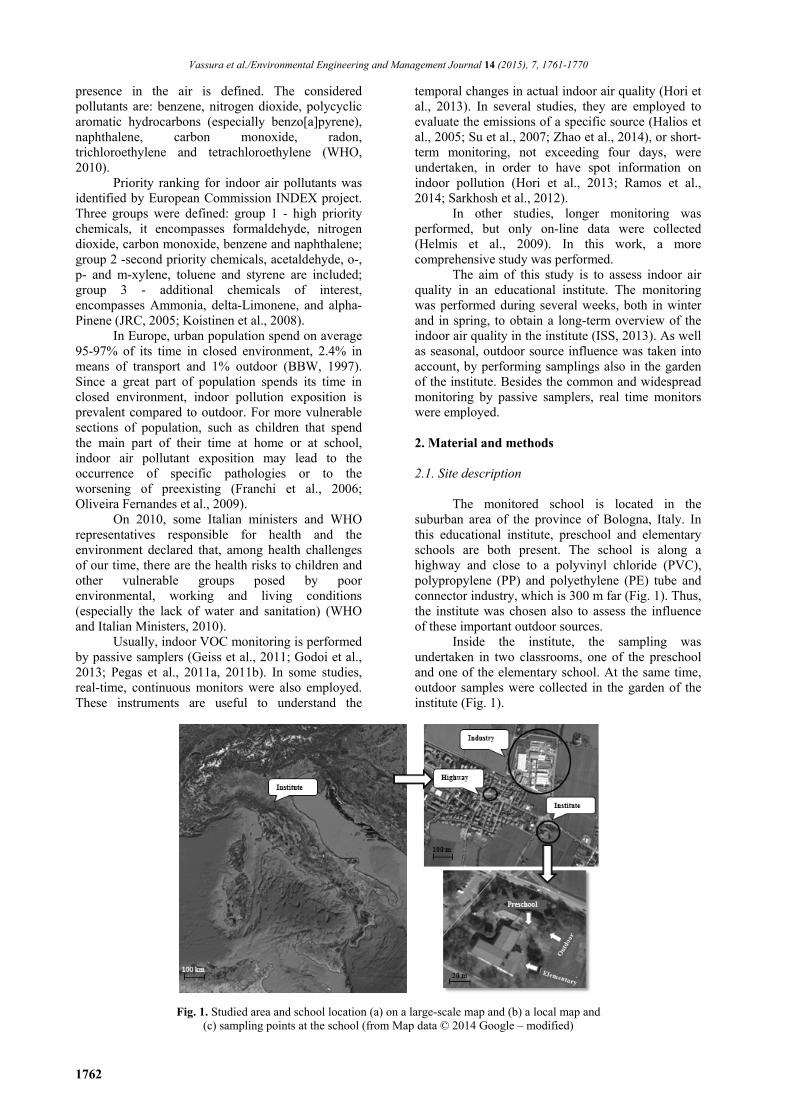
The monitored school is located in the suburban area of the province of Bologna, Italy. In this educational institute, preschool and elementary schools are both present. The school is along a highway and close to a polyvinyl chloride (PVC), polypropylene (PP) and polyethylene (PE) tube and connector industry, which is 300 m far (Fig. 1). Thus, the institute was chosen also to assess the influence of these important outdoor sources.
Inside the institute, the sampling was undertaken in two classrooms, one of the preschool and one of the elementary school. At the same time, outdoor samples were collected in the garden of the institute (Fig. 1).
Fig. 1. Studied area and school location (a) on a large-scale map and (b) a local map and (c) sampling points at the school (from Map data © 2014 Google – modified)
Assessment of indoor pollution in a school environment through both passive and continuous samplings
1763
Preschool class consists of 21 children, while
elementary one of 19 pupils. The furniture of both the classrooms is modern and bought more than two years ago. The rooms were painted more than 2 years ago by water tempera painting. Both the classrooms were used only for didactic scopes. At both the classrooms, windows were opened in the morning for the building ventilation before student arrival.
They were also kept opened when children were not in the classroom during the day, i.e. from 12:30 to 13:30 at the elementary classroom and from 11 to 12 and from 13:30 to 15:30 at the preschool classroom. Moreover, they were opened other times to the discretion of teachers, according to classroom temperature. 2.2. Sampling
Gas samples were collected with diffusion passive samplers (Radiello®, Fondazione Salvatore Maugeri, Padova, Italy). Three systems were used, each one with a cartridge specific for different pollutants: one for VOC, another for carbonyl compounds and the last one for NO2. The samplers were placed in the middle of the room, hanging from a thread 2 m from the floor. In this way, sampling did not interfere with the usual activity of the students and possible sampler tampering was avoided.
In order to obtain the exact assessment of mean weekly exposition, it is necessary to expose samplers not continuously, but only when students are in the classroom. Therefore, sampling in the classrooms was undertaken only during the lessons. Teachers exposed samplers in the morning when children arrived at school and they placed them in hermetically closed glass bins in the evening, at the end of the lessons. Samplers were thus exposed for about 8 hours a day, for five days a week (from Monday to Friday). On Friday evening, at the end of the weekly sampling, cartridges were collected and immediately carried to the laboratory, where they were stored at 4°C until analysis. At the same time as passive samplers and alternatively in the two classrooms, two portable continuous and real-time detectors, which allow obtaining high-resolution data, were employed. The total VOC concentration was measured using Cub (Ion Science Ltd), a photoionization detector (PID), which measures organic compound air concentrations. It employs a 10.6 eV lamp and it detects few hundreds volatile and aromatic organic compounds. It was calibrated
by the seller for isobutylene and all response factors are equivalent.
Some chemical-physic parameters, i.e. CO2, CO, humidity and temperature, were measured using Q-Trak. Sampler characteristics were reported in Table 1. Outdoor air was also monitored, by using the same passive samplers used for indoor air. They were continuously exposed from Monday morning to Friday evening. Two sampling campaigns were performed, the first in the late winter, the second in spring. Winter campaign lasted 4 weeks; it started on the 3rd of March and ended on 28th of March (w1, w2, w3 and w4), 2014. Spring campaign lasted 2 weeks, from 5th to 16th May, 2014 (w5 and w6). For each class, a daily diary was provided. In it, teachers wrote start and end exposition time of passive samplers, pupils in the classroom, particular activities entailed during the day and its time.
2.3. Analysis
For all three systems used, QA/QC was already widely studied and is reported in the web site of the diffusion passive samplers (http://www.radiello.it/ (in Italian)). 2.3.1. Volatile organic compounds (VOC)
In this study, benzene, trichloroethylene, toluene, tetrachloroethylene, p-xylene, ethyl-benzene, m-xylene, o-xylene and limonene were determined. Their sampling was carried out with charcoal based cartridges (530 ± 30 mg, 35-50 mesh) (Radiello code 130, Supelco). Extraction was carried out as indicated by Radiello manufacturer (Pegas et al., 2011a; 2011b). Samples where shacked with 2 mL of carbon disulfide (Sigma Aldrich, low benzene, ≥99.9%) with a rotator drive (Stuart Scientific), for 30 min. Before the extraction, the cartridge was spiked with internal standard 2-Fluorotoluene (Aldrich, ≥99%) (http://www.radiello.it/ (in Italian)).
Analysis was performed by GC-MS (Shimadzu 3400 GCMS-QP2010 Series). Separation was performed with a Zebron, Phenomenex ZB-5MS column (95% arylene dimetil- 5% diphenyl- polysiloxane, 30 m, 0.25 mm i.d., 0.25 µm film thickness) with a temperature program of 40°C for 9 minutes, from 40°C to 200°C at 12°C/min and from 200°C to 250°C at 50°C/min, with helium as carrier gas (purity: 100%). The AOC – 20i, Auto-Inject split/splitless injector was maintained at 250°C and operated under split conditions.
Table 1. Real-time detector characteristics
Sampler Parameter Sensor Measure range Resolution Response time (sec)
Time resolution (min)
Cub VOC Photoionization detector (PID)
1 ppb-5000 ppm 1 ppb 13 1
Q-Trak CO2 Non-dispersive infrared 0-5000 ppm 1 ppm 20 1 Q-Trak CO Electrochemical 0-500 ppm 0.1 ppm <60 1 Q-Trak Temperature Thermistor 0-60 °C 0.1 °C 30 1 Q-Trak Humidity Capacitive 5-95% rh 0.1% rh 20 1
Vassura et al./Environmental Engineering and Management Journal 14 (2015), 7, 1761-1770
1764
Data acquisition was performed in the single
ion mode (SIM). The SIM programme is reported in Table 2. VOCs were identified by both the mass spectrum and external standard tr. Quantification was performed by the internal standard method, by preparing solutions containing all the VOC (50 component indoor air standard, Supelco) with different concentrations and the internal standard.
2.3.2. Carbonyl compounds The carbonyl compounds determined were
formaldehyde, acetaldehyde, propionaldehyde, butyraldehyde, benzaldehyde, valeraldehyde and heaxaldehyde. Their sampling was done by Florisil® coated with 2,4-dinitrophenyl-hydrazine (2,4-DNPH) based cartridges (Radiello code 165, Supelco). Carbonyls react with 2,4-DNPH and form the corresponding 2,4-dinitrophenyl-hydrazone. Extraction was carried out as indicated by Radiello manufacturer (Pegas et al., 2011a, 2011b). Samples where shacked with 2 mL of acetonitrile (Sigma Aldrich, HPLC grade, ≥99.9%) with a rotator drive, for 30 min. The extract was then filtered by nylon filters (PHENEX, 0.2 µm, 15 mm, Phenomenex) (http://www.radiello.it). 2,4-dinitrophenyl-hydrazones were determined by HPLC with a UV-VIS detector (Agilent 1200 Series). They were separated on a reverse phase column, 4.6 mm x 150 mm, 5 μm, Agilent ZORBAX Eclipse XDB-C18.
The elution program consisted a 60 min gradient from a mixture water and acetonitrile (v/v: 80/20%) to 75% acetonitrile. The separation was performed with a constant flow rate of 1.5 mL min-1 at 25˚C. Different species were identified and measured by the external standard method, using solutions of carbonyl compounds (Supelco) with different concentrations. Excitation wavelength was 365 nm.
2.3.3. Nitrogen dioxide NO2 sampling was performed by cartridges
with steel grids impregnated with moist triethanolamine (TEA) (Radiello code 166, Supelco), which chemiadsorb NO2 as nitrite. The extraction was performed by adding 5 mL of bidistilled water to cartridge test tube. Samples were stirred for 30 minutes by rotatory stirrer, then the extract was separated. NO2
-was determined by ionic
chromatography couplet with a conductibility detector (Metrohom, 761 Compact IC), as reported in Venturini et al. (2013). 3. Results and discussion 3.1. Passive samplers
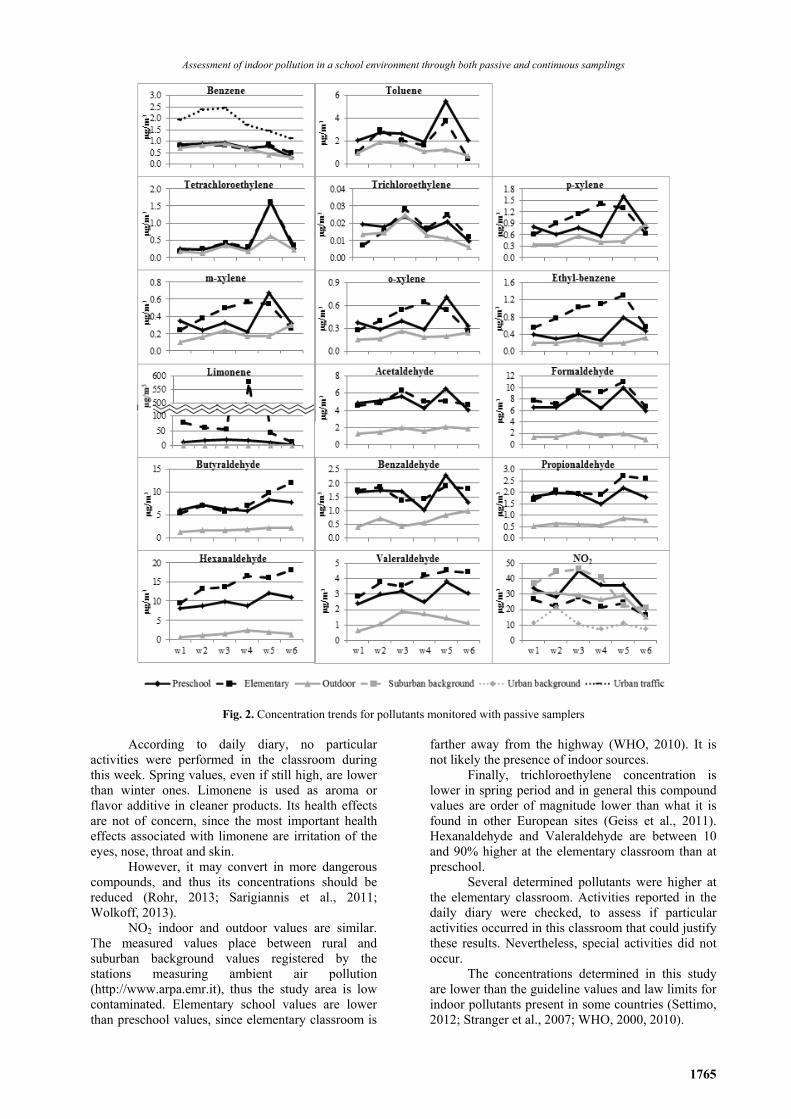
Results obtained for pollutants monitored with
passive samplers are reported in Fig. 2. In general, concentrations are low (Agreement, 2001; Franchi et al., 2006; WHO, 2010). For the most of the analyzed components, there is a contribution of indoor contamination. Nevertheless, except for limonene, all the determined VOCs show lower concentrations than European schools mean values (Geiss at al., 2011).
For high priority chemicals (INDEX definition, see chapter 1), benzene outdoor and indoor concentrations are similar. Spring values are lower, as it is in general found (Franchi et al., 2006; Schneider et al., 2001; WHO, 2010). The concentrations of this study were compared with the values registered by the stations measuring ambient air pollution. The siting of sampling points were located according to specific criteria, as indicated by directive 2008/50/EC (EC, 2008). The values determined in this study are about half of what is found at a Bologna traffic site (http://www.arpa.emr.it).
For formaldehyde, as well as for other aldehydes, there is an increase in indoor exposure compared to outdoor, since indoor concentrations are five times higher. Elementary school values are between 5 and 15% higher than preschool, except for w4 when elementary value is 40% higher than preschool one.
Among second priority chemicals, acetaldehyde outdoor concentration is higher than what is reported for other European sites (Geiss et al., 2011), while toluene and xylene values are particularly low. For additional chemicals of interest, limonene is the only component, as above mentioned, which shows concentrations higher than European schools mean values. Elementary school values are higher than preschool values. Particularly, elementary w4 sample shows high value.
Table 2. Ion programme for SIM determination
Time (min) Ions (m/z) Determined pollutant
2 78 Benzene 2.7 130-132-95 Trichloroethylene 4 91-92-65 Toluene
4.4 109-110-83 2-Fluorotoluene 5 166-164 Tetrachloroethylene
7.5 91-106-105 Ethyl-benzene, p-xylene, m-xylene, o-xylene 13 68-67-93 Limonene 15 43-57 Alkanes
Assessment of indoor pollution in a school environment through both passive and continuous samplings
1765
Fig. 2. Concentration trends for pollutants monitored with passive samplers
According to daily diary, no particular activities were performed in the classroom during this week. Spring values, even if still high, are lower than winter ones. Limonene is used as aroma or flavor additive in cleaner products. Its health effects are not of concern, since the most important health effects associated with limonene are irritation of the eyes, nose, throat and skin.
However, it may convert in more dangerous compounds, and thus its concentrations should be reduced (Rohr, 2013; Sarigiannis et al., 2011; Wolkoff, 2013).
NO2 indoor and outdoor values are similar. The measured values place between rural and suburban background values registered by the stations measuring ambient air pollution (http://www.arpa.emr.it), thus the study area is low contaminated. Elementary school values are lower than preschool values, since elementary classroom is
farther away from the highway (WHO, 2010). It is not likely the presence of indoor sources.
Finally, trichloroethylene concentration is lower in spring period and in general this compound values are order of magnitude lower than what it is found in other European sites (Geiss et al., 2011). Hexanaldehyde and Valeraldehyde are between 10 and 90% higher at the elementary classroom than at preschool.
Several determined pollutants were higher at the elementary classroom. Activities reported in the daily diary were checked, to assess if particular activities occurred in this classroom that could justify these results. Nevertheless, special activities did not occur.
The concentrations determined in this study are lower than the guideline values and law limits for indoor pollutants present in some countries (Settimo, 2012; Stranger et al., 2007; WHO, 2000, 2010).
Vassura et al./Environmental Engineering and Management Journal 14 (2015), 7, 1761-1770
1766
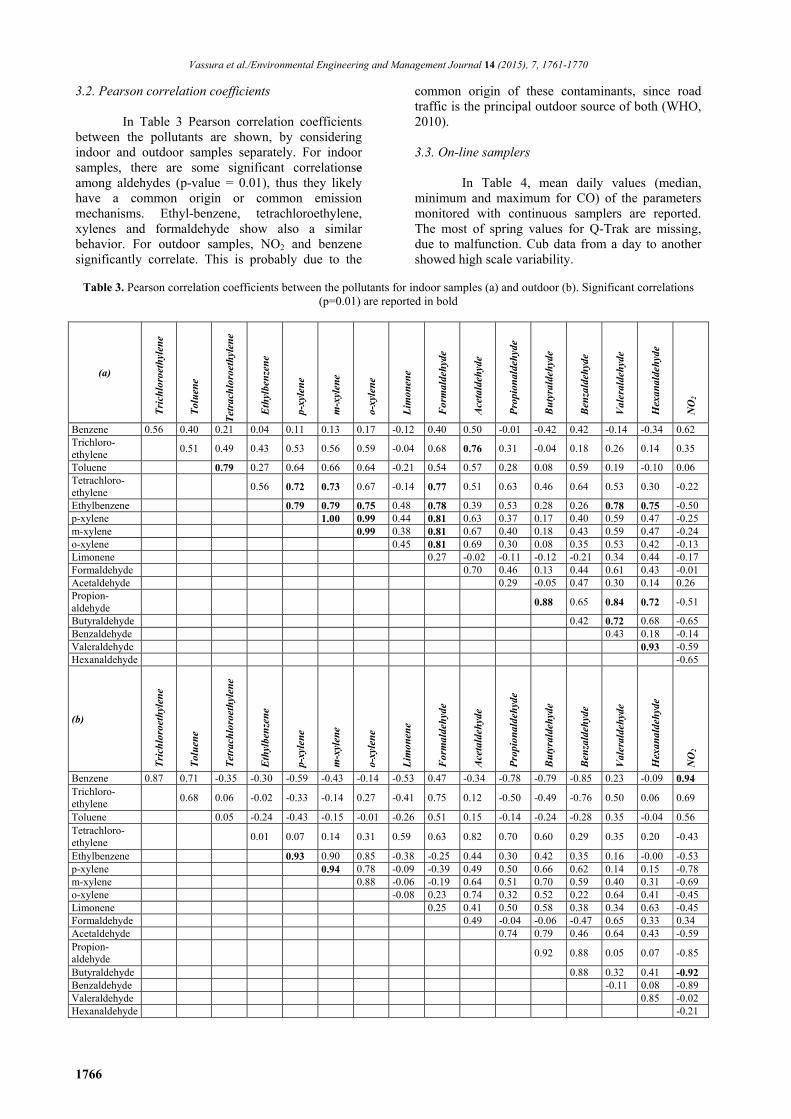
3.2. Pearson correlation coefficients
In Table 3 Pearson correlation coefficients between the pollutants are shown, by considering indoor and outdoor samples separately. For indoor samples, there are some significant correlationse among aldehydes (p-value = 0.01), thus they likely have a common origin or common emission mechanisms. Ethyl-benzene, tetrachloroethylene, xylenes and formaldehyde show also a similar behavior. For outdoor samples, NO2 and benzene significantly correlate. This is probably due to the
common origin of these contaminants, since road traffic is the principal outdoor source of both (WHO, 2010). 3.3. On-line samplers
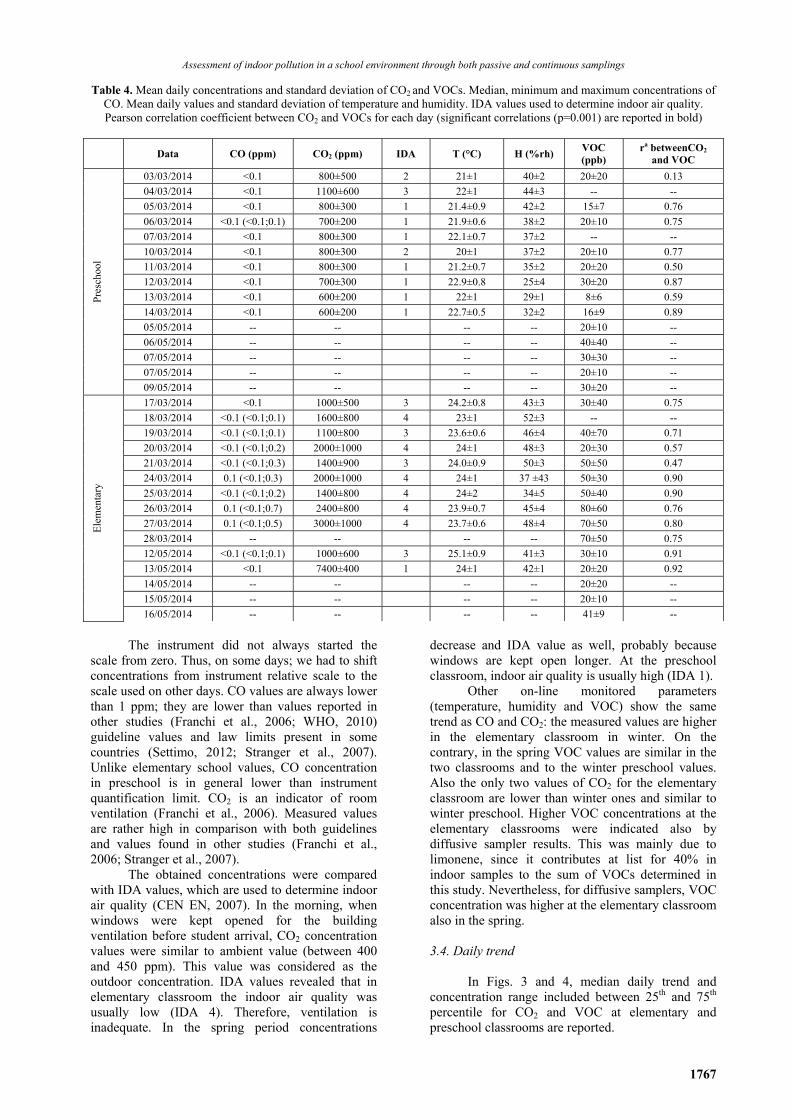
In Table 4, mean daily values (median,
minimum and maximum for CO) of the parameters monitored with continuous samplers are reported. The most of spring values for Q-Trak are missing, due to malfunction. Cub data from a day to another showed high scale variability.
Table 3. Pearson correlation coefficients between the pollutants for indoor samples (a) and outdoor (b). Significant correlations
(p=0.01) are reported in bold
(a)
Tri
chlo
roet
hyl
ene
Tol
uen
e
Tet
rach
loro
eth
ylen
e
Eth
ylbe
nze
ne
p-xy
len
e
m-x
ylen
e
o-xy
len
e
Lim
onen
e
For
mal
deh
yde
Ace
tald
ehyd
e
Pro
pion
alde
hyd
e
Bu
tyra
ldeh
yde
Ben
zald
ehyd
e
Val
eral
deh
yde
Hex
anal
deh
yde
NO
2
Benzene 0.56 0.40 0.21 0.04 0.11 0.13 0.17 -0.12 0.40 0.50 -0.01 -0.42 0.42 -0.14 -0.34 0.62 Trichloro-ethylene
0.51 0.49 0.43 0.53 0.56 0.59 -0.04 0.68 0.76 0.31 -0.04 0.18 0.26 0.14 0.35
Toluene 0.79 0.27 0.64 0.66 0.64 -0.21 0.54 0.57 0.28 0.08 0.59 0.19 -0.10 0.06 Tetrachloro-ethylene
0.56 0.72 0.73 0.67 -0.14 0.77 0.51 0.63 0.46 0.64 0.53 0.30 -0.22
Ethylbenzene 0.79 0.79 0.75 0.48 0.78 0.39 0.53 0.28 0.26 0.78 0.75 -0.50 p-xylene 1.00 0.99 0.44 0.81 0.63 0.37 0.17 0.40 0.59 0.47 -0.25 m-xylene 0.99 0.38 0.81 0.67 0.40 0.18 0.43 0.59 0.47 -0.24 o-xylene 0.45 0.81 0.69 0.30 0.08 0.35 0.53 0.42 -0.13 Limonene 0.27 -0.02 -0.11 -0.12 -0.21 0.34 0.44 -0.17 Formaldehyde 0.70 0.46 0.13 0.44 0.61 0.43 -0.01 Acetaldehyde 0.29 -0.05 0.47 0.30 0.14 0.26 Propion-aldehyde
0.88 0.65 0.84 0.72 -0.51
Butyraldehyde 0.42 0.72 0.68 -0.65 Benzaldehyde 0.43 0.18 -0.14 Valeraldehyde 0.93 -0.59 Hexanaldehyde -0.65
(b)
Tri
chlo
roet
hyl
ene
Tol
uen
e
Tet
rach
loro
eth
ylen
e
Eth
ylbe
nze
ne
p-xy
len
e
m-x
ylen
e
o-xy
len
e
Lim
onen
e
For
mal
deh
yde
Ace
tald
ehyd
e
Pro
pion
alde
hyd
e
Bu
tyra
ldeh
yde
Ben
zald
ehyd
e
Val
eral
deh
yde
Hex
anal
deh
yde
NO
2
Benzene 0.87 0.71 -0.35 -0.30 -0.59 -0.43 -0.14 -0.53 0.47 -0.34 -0.78 -0.79 -0.85 0.23 -0.09 0.94 Trichloro-ethylene
0.68 0.06 -0.02 -0.33 -0.14 0.27 -0.41 0.75 0.12 -0.50 -0.49 -0.76 0.50 0.06 0.69
Toluene 0.05 -0.24 -0.43 -0.15 -0.01 -0.26 0.51 0.15 -0.14 -0.24 -0.28 0.35 -0.04 0.56 Tetrachloro-ethylene
0.01 0.07 0.14 0.31 0.59 0.63 0.82 0.70 0.60 0.29 0.35 0.20 -0.43
Ethylbenzene 0.93 0.90 0.85 -0.38 -0.25 0.44 0.30 0.42 0.35 0.16 -0.00 -0.53 p-xylene 0.94 0.78 -0.09 -0.39 0.49 0.50 0.66 0.62 0.14 0.15 -0.78 m-xylene 0.88 -0.06 -0.19 0.64 0.51 0.70 0.59 0.40 0.31 -0.69 o-xylene -0.08 0.23 0.74 0.32 0.52 0.22 0.64 0.41 -0.45 Limonene 0.25 0.41 0.50 0.58 0.38 0.34 0.63 -0.45 Formaldehyde 0.49 -0.04 -0.06 -0.47 0.65 0.33 0.34 Acetaldehyde 0.74 0.79 0.46 0.64 0.43 -0.59 Propion-aldehyde
0.92 0.88 0.05 0.07 -0.85
Butyraldehyde 0.88 0.32 0.41 -0.92 Benzaldehyde -0.11 0.08 -0.89 Valeraldehyde 0.85 -0.02 Hexanaldehyde -0.21
Assessment of indoor pollution in a school environment through both passive and continuous samplings
1767
Table 4. Mean daily concentrations and standard deviation of CO2 and VOCs. Median, minimum and maximum concentrations of CO. Mean daily values and standard deviation of temperature and humidity. IDA values used to determine indoor air quality. Pearson correlation coefficient between CO2 and VOCs for each day (significant correlations (p=0.001) are reported in bold)
Data CO (ppm) CO2 (ppm) IDA T (°C) H (%rh) VOC (ppb)
ra betweenCO2 and VOC
03/03/2014 <0.1 800±500 2 21±1 40±2 20±20 0.13
04/03/2014 <0.1 1100±600 3 22±1 44±3 -- --
05/03/2014 <0.1 800±300 1 21.4±0.9 42±2 15±7 0.76
06/03/2014 <0.1 (<0.1;0.1) 700±200 1 21.9±0.6 38±2 20±10 0.75
07/03/2014 <0.1 800±300 1 22.1±0.7 37±2 -- --
10/03/2014 <0.1 800±300 2 20±1 37±2 20±10 0.77
11/03/2014 <0.1 800±300 1 21.2±0.7 35±2 20±20 0.50
12/03/2014 <0.1 700±300 1 22.9±0.8 25±4 30±20 0.87
13/03/2014 <0.1 600±200 1 22±1 29±1 8±6 0.59
14/03/2014 <0.1 600±200 1 22.7±0.5 32±2 16±9 0.89
05/05/2014 -- -- -- -- 20±10 --
06/05/2014 -- -- -- -- 40±40 --
07/05/2014 -- -- -- -- 30±30 --
07/05/2014 -- -- -- -- 20±10 --
Pre
scho
ol
09/05/2014 -- -- -- -- 30±20 --
17/03/2014 <0.1 1000±500 3 24.2±0.8 43±3 30±40 0.75
18/03/2014 <0.1 (<0.1;0.1) 1600±800 4 23±1 52±3 -- --
19/03/2014 <0.1 (<0.1;0.1) 1100±800 3 23.6±0.6 46±4 40±70 0.71
20/03/2014 <0.1 (<0.1;0.2) 2000±1000 4 24±1 48±3 20±30 0.57
21/03/2014 <0.1 (<0.1;0.3) 1400±900 3 24.0±0.9 50±3 50±50 0.47
24/03/2014 0.1 (<0.1;0.3) 2000±1000 4 24±1 37 ±43 50±30 0.90
25/03/2014 <0.1 (<0.1;0.2) 1400±800 4 24±2 34±5 50±40 0.90
26/03/2014 0.1 (<0.1;0.7) 2400±800 4 23.9±0.7 45±4 80±60 0.76
27/03/2014 0.1 (<0.1;0.5) 3000±1000 4 23.7±0.6 48±4 70±50 0.80
28/03/2014 -- -- -- -- 70±50 0.75
12/05/2014 <0.1 (<0.1;0.1) 1000±600 3 25.1±0.9 41±3 30±10 0.91
13/05/2014 <0.1 7400±400 1 24±1 42±1 20±20 0.92
14/05/2014 -- -- -- -- 20±20 --
15/05/2014 -- -- -- -- 20±10 --
Ele
men
tary
16/05/2014 -- -- -- -- 41±9 --
The instrument did not always started the
scale from zero. Thus, on some days; we had to shift concentrations from instrument relative scale to the scale used on other days. CO values are always lower than 1 ppm; they are lower than values reported in other studies (Franchi et al., 2006; WHO, 2010) guideline values and law limits present in some countries (Settimo, 2012; Stranger et al., 2007). Unlike elementary school values, CO concentration in preschool is in general lower than instrument quantification limit. CO2 is an indicator of room ventilation (Franchi et al., 2006). Measured values are rather high in comparison with both guidelines and values found in other studies (Franchi et al., 2006; Stranger et al., 2007).
The obtained concentrations were compared with IDA values, which are used to determine indoor air quality (CEN EN, 2007). In the morning, when windows were kept opened for the building ventilation before student arrival, CO2 concentration values were similar to ambient value (between 400 and 450 ppm). This value was considered as the outdoor concentration. IDA values revealed that in elementary classroom the indoor air quality was usually low (IDA 4). Therefore, ventilation is inadequate. In the spring period concentrations
decrease and IDA value as well, probably because windows are kept open longer. At the preschool classroom, indoor air quality is usually high (IDA 1).
Other on-line monitored parameters (temperature, humidity and VOC) show the same trend as CO and CO2: the measured values are higher in the elementary classroom in winter. On the contrary, in the spring VOC values are similar in the two classrooms and to the winter preschool values. Also the only two values of CO2 for the elementary classroom are lower than winter ones and similar to winter preschool. Higher VOC concentrations at the elementary classrooms were indicated also by diffusive sampler results. This was mainly due to limonene, since it contributes at list for 40% in indoor samples to the sum of VOCs determined in this study. Nevertheless, for diffusive samplers, VOC concentration was higher at the elementary classroom also in the spring. 3.4. Daily trend
In Figs. 3 and 4, median daily trend and concentration range included between 25th and 75th percentile for CO2 and VOC at elementary and preschool classrooms are reported.

Vassura et al./Environmental Engineering and Management Journal 14 (2015), 7, 1761-1770
1768
Fig. 3. Daily trends at preschool for CO2 (a) and VOCs (b): median (white line) and concentration range included between 25th and 75th percentile
Fig. 4. Daily trends at elementary school for CO2 (a) and VOCs (b): median (white line) and concentration range included between 25th and 75th percentile
They are clearly the same in the same
classroom. CO2 comes mainly from indoor, and thus also VOCs have mainly indoor sources. In fact, also mean daily value behavior for CO2 and VOCs is the same, i.e. higher values for the elementary classroom in winter. The main indoor origin for these pollutants is further demonstrated by examining more in details daily trend. In the morning, after window opening for the building ventilation before student arrival, concentrations are low, CO2 value is similar to ambient value (about 400 ppm). When students arrive, concentrations increase, more markedly at the elementary classroom. In both the classrooms, concentrations decrease when children are not present (between 12:30 and 13:30 at the elementary classroom and between 13:30 and 15:30 at preschool classroom) and air is changed.
The similarity between CO2 and VOC trends is confirmed by Pearson correlation coefficients (Table 4). All the correlations were significant, except for 3rd March. On this day, VOC concentration peaks are registered when CO2 concentration decreases. Thus, on 3rd March the contribution of VOC outdoor sources is important. Even though the coefficients are significant, on 13th, 20th and 21st March they are lower. Also on these days, there are VOC concentration peaks when CO2 concentration is low, and thus the contribution of outdoor sources.
4. Conclusions Diffusive passive sampler and continuous
detector use to evaluate IAQ provides complementary information that together can allow to identify possible critical elements. Passive sampler results of this study demonstrated that the classrooms are characterized by low pollutant concentration even if, for the most of the analyzed components, there is a contribution of indoor contamination. Daily trends confirm that VOCs have mainly an indoor origin.
The method applied demonstrated suitable. IAQ monitoring could be continued only by a PID. However, if an increase in concentration is detected, passive samplers are necessary to go deeper in the causes of the raising.
Acknowledgements Zola Predosa (BO, Italy) Municipality is sincerely acknowledged for funding this research project. Lab Service Analytica is sincerely thanked for its technical and equipment support to the research project. References Agreement, (2001), Agreement among Health Ministry,
regions and autonomous provinces of 27th November 2011, on the document regarding Guideline for health protection and promotion in indoor ambient, (in
Assessment of indoor pollution in a school environment through both passive and continuous samplings
1769
Italian), Official Journal of the Italian Republic, Ordinary Supplement 252, General series No 276.
BBW, (1997), Air Pollution Exposure Distributions of Adult Urban Populations in Europe EXPOLIS, Intermediate Scientific Report for the Federal Office for Education and Sciences, Basel, Switzerland, Project ENV4960202, On line at: http://cordis.europa.eu/project/rcn/32535_en.htmL.
CEN EN, (2007), Method EN 13779 - Ventilation for non-residential buildings – Performance requirements for ventilation and room-conditioning systems.
EC Directive, (2008), Directive 2008/50/EC of the European Parliament and of the Council of 21 May 2008 on ambient air quality and cleaner air for Europe, Official Journal of the European Union, L152/1, 11/06/2008, Brussels.
Fanger O.P., (2006), What is IAQ?, Indoor Air, 16, 328-334.
Franchi M., Carrer P., Kotzias D., Rameckers E.M.A.L., Seppӓnen O., van Bronswijk J.E.M.H., Viegi G., Gilder J.A., Valovirta E., (2006), Working towards healthy air in dwellings in Europe, Allergy, 61, 864-868.
Geiss O., Giannopoulos G., Tirendi S., Barrero-Moreno J., Larsen B.R., Kotzias D., (2011), The AIRMEX study - VOC measurements in public buildings and schools/kindergartens in eleven European cities: Statistical analysis of the data, Atmospheric Environment, 45, 3676-3684.
Godoi R.H.M., Godoi A.F.L, Gonçalves Junior S.J., Paralovo S.L., Borillo G.C., Gonçalves Gregório Barbosa C., Arantes M.G., Charello R.C., Rosário Filho N.A., Grassi M.T., Yamamoto C.I., Potgieter-Vermaak S., Rotondo G.G., De Wael K., van Grieken R., (2013), Healthy environment — indoor air quality of Brazilian elementary schools nearby petrochemical industry, Science of the Total Environment, 463–464, 639–646.
ISS, (2013), Volatile Organic compounds (VOC) monitoring strategies in indoor environment, ISTISAN report 13/04 (in Italian), On line at: http://www.iss.it/binary/iasa/cont/tredici4web.pdf.
Halios C.H., Assimakopoulos V.D., Helmis C.G., Flocas H.A., (2005), Investigating cigarette-smoke indoor pollution in a controlled environment, Science of the Total Environment, 337, 183– 190.
Helmis C.G., Assimakopoulos V.D. Flocas H.A., Stathopoulou O.I., Sgouros G., Hatzaki M., (2009), Indoor air quality assessment in the air traffic control tower of the Athens Airport, Greece, Environmental Monitoring and Assessment, 148, 47–60.
Hori H., Ishimatsu S., Fueta Y., Ishidao T., (2013), Evaluation of a real-time method for monitoring volatile organic compounds in indoor air in a Japanese university, Environmental Health and Preventive Medicine, 18, 285–292.
JRC, (2005), Critical Appraisal of the Setting and Implementation of Indoor Exposure Limits in the EU, Final Report of the INDEX Project, European Commission, Joint Research Centre, Institute for Health and Consumer Protection, Ispra (VA), Italy, On line at: http://ec.europa.eu/health/ph_projects/2002/pollution/fp_pollution_2002_frep_02.pdf.
Koistinen K., Kotzias D., Kephalopoulos S., Schlitt C., Carrer P., Jantunen M., Kirchner S., Mclaughlin J., Mølhave L., Fernandes E.O., Seifert B., (2008), The INDEX project: Executive summary of a European
Union project on indoor air pollutants, Allergy, 63, 810-819.
Oliveira Fernandes E., Jantunen M., Carrer P., Seppänen O., Harrison P., Kephalopoulos S., (2009), EnVIE Final Report. On line at: http://paginas.fe.up.pt/~envie/documents/finalreports/Final%20Reports%20Publishable/Publishable%20final%20activity%20report.pdf
Pegas P.N., Alves C.A., Evtyugina M.G., Nunes T., Cerqueira M., Franchi M., Pio C.A., Almeida S.M., Freitas M.C., (2011a), Indoor air quality in elementary schools of Lisbon in spring, Environmental Geochemical Health, 33, 455–468.
Pegas P.N., Alves C.A., Evtyugina M.G., Nunes T., Cerqueira M., Franchi M., Pio C.A., Almeida S.M., Cabo Verde S., Freitas M.C., (2011b), Seasonal evaluation of outdoor/indoor air quality in primary schools in Lisbon, Journal of Environmental Monitoring, 13, 657–667.
Ramos C.A., Wolterbeek H.T., Almeida S.M., (2014), Exposure to indoor air pollutants during physical activity in fitness centers, Building and Environment, 82, 349-360.
Rohr A.C., (2013), The Health Significance of Gas- and Particle-Phase Terpene Oxidation Products: A Review, Environment International, 60, 145-162.
Sarigiannis D.A., Karakitsios S.P., Gotti A., Liakos I.L., Katsoyiannis A., (2011), Exposure to major volatile organic compounds and carbonyls in European indoor environments and associated health risk, Environment International, 37, 743–765.
Sarkhosh M., Mahvi A.H., Zare M.R., Fakhri Y., Shamsolahi H.R., (2012), Indoor contaminants from Hardcopy Devices: Characteristics of VOCs in photocopy centers, Atmospheric Environment, 63, 307-312.
Schneider P., Gebefügi I., Richter K., Wölke G., Schnelle J., -Erich Wichmann H., Heinrich J., Inga Study Group, (2001), Indoor and outdoor BTX levels in German cities, The Science of the Total Environment, 267, 41-51.
Settimo G., (2012), Air quality in indoor ambient: new national and community orientation, (in Italian), Notiziario dell’Istituto Superiore di Sanità, 25, 7-10
Stranger M., Potgieter-Vermaak S.S., Van Grieken R., (2007), Comparative overview of indoor air quality in Antwerp, Belgium, Environment International, 33, 789–797.
Su H., Chao C., Chang H., Wu P., (2007), The effects of evaporating essential oils on indoor air quality, Atmospheric Environment, 41, 1230–1236.
Venturini E., Vassura I., Ferroni L., Raffo S., Beddows D.C.S., Harrison R.M., (2013), Bulk deposition close to a Municipal Solid Waste incinerator: One source among many, Science of the Total Environment, 456–457, 392–403.
WHO, (1989), Indoor air quality: organic pollutants, Report on a WHO Meeting, Berlin, 23-27 August 1987, EURO Reports and Studies 111, regional office for Europe, Copenhagen.
WHO, (2000), Air Quality Guidelines for Europe, Second Edition, European Series No. 91, Regional Office for Europe, Copenhagen, On line at: http://www.euro.who.int/__data/assets/pdf_file/0005/74732/E71922.pdf.
WHO, (2010), Guidelines for Indoor Air Quality: Selected Pollutants, Regional Office for Europe, The WHO European Centre for Environment and Health, Bonn, On line at:
Vassura et al./Environmental Engineering and Management Journal 14 (2015), 7, 1761-1770
1770
http://www.ncbi.nlm.nih.gov/books/NBK138705/pdf/Bookshelf_NBK138705.pdf.
WHO, Italian Ministers, (2010), Parma Declaration on Environment and Health, EUR/55934/5.1, Fifth Ministerial Conference on Environment and Health, Protecting children’s Health in a Changing Environment, On line at: http://www.euro.who.int/__data/assets/pdf_file/0011/78608/E93618.pdf?ua=1.
Wolkoff P., (2013), Indoor Air Pollutants in Office Environments: Assessment of Comfort, Health, and Performance, International Journal of Hygiene and Environmental Health, 216, 371-394.
Zhao Y., Li A., Gao R., Tao P., Shen J., (2014), Measurement of temperature, relative humidity and concentrations of CO, CO2 and TVOC during cooking typical Chinese dishes, Energy and Buildings, 69, 544–561.


![Index [] · Spray Slidy 11 TABLETENNISTABLES 12-16 TABLES Basic 13 Training Indoor 13 Progress Indoor 13 Challenge Indoor 13 Advance Indoor 13 Master Indoor 14 Club Indoor 14](https://img.pdfslide.net/doc/110x75/609ea898873dde113652cff3/index-spray-slidy-11-tabletennistables-12-16-tables-basic-13-training-indoor.jpg)