Embed Size (px)
Citation preview

ASSESSMENT OF MEASURES TO EASE PEDESTRIAN CONGESTION
Angela Lopez Halcrow Group LTD
This paper is based on the dissertation submitted by the author in partial fulfilment of the requirements of the degree of MSc(Eng) Transport Planning and Engineering at the University of Leeds. The research topic was suggested by Dr Paul Firmin. 1. INTRODUCTION The paper addresses the problem of pedestrian congestion on busy pavements. This research focuses on non conventional measures to improve the quality of pedestrian flow. These measures are based on the segregation of the pedestrian flow by speeds and directions and on the creation of wider spaces by relocating street furniture. Directional Lanes, Street Furniture Relocation and Fast/Slow Lane are the schemes selected for study. The objective of the paper is to assess the potential of these four schemes to improve the Level of Service a facility is offering. The methodology selected in order to fulfil the objective consists on the comparison of the Level of Service a congested facility is currently offering without any scheme to ease pedestrian congestion and in the hypothetical case that schemes were implemented. In order to work out the Level of Service, two well known methodologies have been used. These two methods, which take into account Physical and Environmental Factors, were originally designed to assess existing conditions of a facility. Therefore they needed to be adapted for the study of hypothetical conditions as well. The paper is structured as follows: key definitions and background information is given in Section 2. The study case is presented in Section 3. Level of Service in the existing literature is discussed in Section 4. The methodology chosen and the data collection exercise is explained in Section 5. Results are presented in Section 6. The paper concludes in Section 7. 2. PEDESTRIAN CONGESTION In engineering terms, pedestrian congestion is identified when a facility is operating over capacity. Capacity refers to the maximum possible ability to accommodate a flow (Pushkarev and Zupan, 1975). The Highway Capacity Manual (Transportation Research Board, 2000) takes capacity as 75 ped/min/m. The space available per pedestrian when the pavement is at capacity is 0.75m2, being the probability of conflict between
©Association for European Transport and contributors 2006

pedestrians very high. Therefore, operation at maximum capacity is undesirable. In practice, and in this paper, the term pedestrian congestion is used to describe those situations with heavy pedestrian traffic in which pedestrians can’t walk at their own pace. Characteristics of a congested flow are shuffling and dodging, the need to change trajectory and speed in order to avoid conflict and stop and start conditions. To improve the quality of pedestrian flow is not usually a main policy objective appearing as such in city council strategies. However, good flow conditions are a requirement for very common objectives like promoting walking, emphasise the role of walking as part of journeys by public transport, improve the walking environment, promote car free developments and promote public transport. There are a variety of measures available to improve the quality of pedestrian flow when a facility is congested. Of importance for this study are Pedestrian Space Management and Pedestrian Traffic Management measures. Pedestrian Space Management consists on the allocation of more space for pedestrians. It is popular in town centres and routes used by commuters. The measures available are: Pedestrianization, Temporal Street Closures (at lunch time, at Christmas, etc), Pavement Widening, and Street Furniture Relocation. Pedestrian Traffic Management consists in the more efficient use of the space available for pedestrians. It is used frequently indoors, specially in links between buildings and metro station corridors, and there are also some relevant examples on pavements. The measures available are:
- Directional lanes: existing in many station corridors and links between buildings, they have been also implemented on pavements in Sydney, Australia
- Stand to the right: on escalators in London tube stations, also exists as a recommendation for pedestrians in pavements (Morning Herald Tribune, Aus, 8 Feb 2003)
- Travelators: very common in airports and stations, they also exist in shopping centres and in links between large buildings. Modelling exercises (Bijelic, 2003) have shown their possible convenience on pavements
- Roundabouts: Helbing and Molnar (1997) found that the loss of efficiency occurring when two pedestrian flows cross each other can be reduced “by initialising roundabout traffic, that can be stabilized by planting a tree in the middle of the intersection, for example”. In computer simulations, this practise increased efficiency up to 13%
- Fast lane: this scheme was proposed for Oxford Street in London in December 2000. Apparently, the scheme was discussed and later rejected by Westminster City Council. The idea consisted in the implementation of a unidirectional fast lane on each of the pavements of Oxford Street, for pedestrians wishing to walk at a minimum speed of 3mph
©Association for European Transport and contributors 2006

3. STUDY CASE The schemes to ease pedestrian congestion selected for this study are shown in Figure 1. They are Directional Lanes, Street Furniture Relocation and Slow/Fast Lane. Regarding the location of the study case, the big example of crowded sidewalks in England is Oxford Street in London. A decision was made to carry out the study case there.
DIFFERENT LANES FOR DIFFERENT DIRECTIONS (existing policy in Sydney, Australia) consists in the
segregation of pedestrian flow in two lanes, one in each direction, following the "left is best" convention. It has the
potential to optimise the streaming self organisation pattern observed on crowded pavements and therefore to minimise the extra conflicts generated with bi-directional
traffic
STREET FURNITURE RELOCATION AND PROVISION OF DEDICATED BAYS FOR LEAFLET DISTRIBUTORS AND
MOBILE TRADERS (existing policy in Washington DC, USA and many other towns) has the potential to free space for walking which is currently being used for other purposes.
PROVISION OF A SEPARATED PATH FOR FASTER PEDESTRIANS LIKE COMMUTERS AND PEOPLE IN A HURRY (proposed for Oxford Street, London) has the
potential to achieve time savings for certain users but was regarded as a conflict generator instead of a remedy
against pavement ragefast lane
PROVISION OF A SEPARATED PATH FOR SLOWER PEDESTRIANS: MAP READERS, ELDERLY, GROUPS (non existent and defined for this dissertation as an alternative to the fast lane) could have the potential of allowing fast
pedestrians to walk at their own pace and at the same time provides a safer track for slow or more vulnerable people
Figure 1. Schemes to ease pedestrian congestion selected for the study case
©Association for European Transport and contributors 2006

With more than 9 million tourists a year and 60000 residents and commuters Oxford Street has very busy pavements. The predominant land use is commercial, especially clothes, which makes it one the busiest high streets in Europe. In addition to this, it is a cluster of media, advertising and cultural industries, including dozens of English schools. A decision was made to carry out the study there. Three locations in a representative section of the street were selected for the study case. That was considered necessary because of the complexity of Oxford Street. 4. EXISTING LITERATURE ABOUT LEVEL OF SERVICE (LOS) The term most commonly used in the literature to refer to the quality of a facility is the Level of Service. The Level of Service (LOS) concept was first developed for vehicular capacity studies connected with street and highway design and it was later adopted for pedestrian facilities. The LOS for pedestrians is defined by Gallin (2001) as “an overall measure of walking conditions on a route, path or facility. This is directly linked to factors that affect pedestrian mobility, comfort and safety. It reflects the pedestrians’ perceptions of the degree to which the facility is pedestrian friendly”. The two main criteria to evaluate the Level of Service on pavements were defined in the 1970s by Fruin(1971) and by Pushkarev and Zupan(1975). Both publications established 6 different service levels, based on speed, flow rates, space available per pedestrian, and the ability to manoeuvre without conflicts and changes in the walking speed, including the ability to cross or walk against the main stream and ability to pass other pedestrians. The Highway Capacity Manual (Transportation Research Board, 1985) explains that, in addition to the quantitative Level of Service criteria there are other “additional environmental factors which contribute to the walking experience, and therefore to the perceived level of service”. These environmental factors are: comfort, convenience, safety, security features and economy aspects. The Highway Capacity Manual (Transportation Research Board, 1985 and 2000) points out that “these environmental factors should be considered because they can greatly influence pedestrian activity”. However, is does not suggest any methodology to measure them. However, other researches have suggested different ways to assess the Environmental Level of Service, as a way to complement the information obtained by the quantitative analysis based on the physical factors. Sarkar (1995) makes a qualitative evaluation depending on the amenities offered by the facility, how well it blends with the architectural vocabulary of the area captures the spirit of the people and the city. Khisty (1994), proposes a methodology which results in a Level of Service of the facility as perceived by its users. On the other hand, a considerable number of papers can be found in the literature defining new ways to evaluate the Level of Service (rather than
©Association for European Transport and contributors 2006
complementing the classical way of measuring LOS based on physical factors). Most of them result in a 5 or 6 ranges scale, from A to E or F. Table 1 shows some of the LOS methodologies proposed in the literature.
Crossect Network Pavement Indoors Squares Intersect Bicycles Cars Physical Environm Location Delays
Fruin (1971)
Pushkarev and Zupan (1975)
Sarkar (1995)
Khisty (1994)
Gallin (2001)
Kansas City Walkability Plan
Walkinfo Association
Mori and Tsukaguchi(1987)
Muraleetharan (2000)
Dixon (1996)
Sarkar (1996)
Helbing and Molnar (1997)
Stonor, de Arruda Campos and Smith (2001)
Kaiser (1994) n/a n/a n/a n/a n/a n/a n/a n/a
Most important componentsFacility Includes interaction with car/bikesScale
Table 1: Different ways to assess the Pedestrian Level of Service
5. METHODOLOGY A decision was made to use the classical Level of Service defined by Fruin (1971) and updated by the Highway Capacity Manual (2000) and the evaluation of environmental factors proposed by Khisty (1994) designed to complement the former method. A description of the methodologies as well as the modifications made to adapt them to the study case are explained next. 5.1 Description of the Physical LOS The Highway Capacity Manual (Transportation Research Board, 2000) defines 6 ranges of Level of Service (from A to F), depending on the following variables: space available per pedestrian, flow rates and speeds. The main indicator, flow rate, is calculated using pedestrian counts in a given point of the pavement and effective width of the pavement in that point. Other indicators of the service level used in the Highway Capacity Manual (HCM) are the ability of the pedestrian to cross a pedestrian stream, the ability to maintain flow in the minor direction in opposition to a major pedestrian flow and the ability to pass other pedestrians. The HCM refers to them as “other significant indicators of the Level of Service” and it doesn’t explain any way to calculate or measure them, and neither do other researchers. The HCM makes a qualitative assessment of the difficulty of crossing a stream or overtaking others for different levels of space available per pedestrian. It also recognises that the values depend on the flow composition and on whether the stream is uni-directional or bi-directional.
©Association for European Transport and contributors 2006

Table 2 shows the HCM Level of Service scale (for more detailed description
Table 2: Level of Service in the Highway Cap
please refer to the original source).
acity Manual (Transportation Research Board, 2000)
.2 Adapting the Physical LOS to the study case: modifications needed
t conditions on Oxford Street, the HCM (2000)
a
nt for
CM suggests to count pedestrians for a 15
e recorded in locations 1, 2 and 3 at different times, in order to have a good picture of the pedestrian movement in the
LOS SPACE (m2/p) FLOW RATE (p/min/m) SPEED (m/s) CONFLICTS
A > 5.6 < 16 > 1.30 Pedestrians move in desired paths, walking speeds are freely selected and conflicts between pedestrians unlikely
B > 3.7 - 5.6 > 16 - 23 > 1.27 - 1.30There is enough space to select walking speeds, bypass other
pedestrians and to avoid crossing conflicts. Pedestrians begin to be aware of other pedestrians and to respond to their presence
when selecting a walking path
C > 2.2 - 3.7 > 23 - 33 > 1.22 - 1.27Space is sufficient for normal walking speeds, and for bypassing other pedestrians in primarily unidirectional streams. Reverse-
direction or crossing movements can cause minor conflicts, and speeds and flow are lower
D > 1.4 - 2.2 > 33 - 49 > 1.14 - 1.22Freedom to select individual walking speeds and to bypass other pedestrians is restricted. Crossing or reversing flow movements face a high probability of conflict, requiring frequent changes in
speed and position
E > 0.75 - 1.4 > 49 - 75 > 0.75 - 1.14Virtually all pedestrians restrict their normal walking speed, frecuently adjusting their gait. At the lower range, forward
movement is possible only by shuffling. Space is nor sufficient for passing slower pedestrians
F < 0.75 variable < 0.75All walking speeds are severely restricted, and forward progress is only made by shuffling. There is frequent, unavoidable contact
with other pedestrians.
5and data collection To evaluate currenmethodology was, overall, valid, but there was the need to change some of the values of pre-emption of walkway (needed to calculate the effective width of the pavement). In addition to this, the HCM proposed to calculate the effective width on a point of the pavement. It was decided that for this dissertation to calculate an average pavement width was more appropriate. Pictures taken and direct observation of the pavement during the datcollection exercise show that the effective width of the pavement varies with time. For example, newspaper stands were installed from 12pm. Similarly, leaflet distributors and human advertisements were working from lunchtime to at least 6pm. Surveyors, cleaning services, loading and unloading activities, etc, made the effective width of the pavement very changeable indeed. A decision was made to calculate the effective width of the pavememorning (7am-12 am) and rest of the day (12pm-7pm). Observation of the pedestrian movement allowed an update of the pre-emption of the sidewalk width and avoidance distances. Regarding the flow counts, the Hminute period. A decision to do smaller counts had to be made due to technical and time restrictions. Films of the pedestrian flow wer
©Association for European Transport and contributors 2006

whole road section during the day time. The videos last from 1 to 11 minutes and cover specially well location 1 which seemed the more complex in terms of pedestrian movement. Directional split, percentage of people walking alone or with someone else, percentage of people with some kind of mobility restriction and flow counts
offering
tudying also the
movement of shuffling or ther pedestrian or with an
- houlder’s crash or sides touch
or with an obstacle The aobviou trying to fit
to be complemented with the ty (1994) suggests the following
percentage of users
were extracted from the tapes. Also a conflict survey was carried on. Studying conflicts was considered necessary in order to compare the Level of Service the facility offers with the Level of Service the facility would beif the schemes were implemented. Due to the limited scope of this research, it was not possible to estimate the change in flow rates the schemes could introduce on Oxford Street. However, it was possible to assess qualitatively the effect the schemes could have on the indicator conflicts. In addition to this, Botma (1995) had studied the conflicts between pedestrians and bicycles and pointed out the importance of sconflicts among pedestrians. The following situations were considered conflicts:
- a situation in which a pedestrian makes adodging to avoid physical contact with anoobstacle a situation in which two pedestrians have undesired physical contact such as s
- a situation of obvious change of speed to avoid physical contact with other pedestrians or with an obstacle
- a situation in which a pedestrian is forced to move to the road to avoid physical contact with other pedestrians
s mple was composed of 81 conflicts surveyed in the three locations. All s conflicts in order of appearance were picked. Rather than
all the conflicts in a standard classification made in advance, all of them were described, to elaborate a typology based on those descriptions later on. A qualitative assessment of the potential of the schemes to avoid the conflicts observed was done later on. 5.3 Description of the Environmental LOS The LOS based on physical factors needsanalysis of various environmental factors. Khis(in alphabetical order): Attractiveness, Comfort, Convenience, Safety, Security, System Coherence and System Continuity. Table 3 shows the Environmental LOS, which results on a scale of 6 ranges, from A (5points) to E (0-1 point), depending on thesatisfied with the facility. The number of points given to each factor are then weighted with the relative importance of each factor to obtain the final LOS value.
©Association for European Transport and contributors 2006

Table 3: Environmental Level of Service in Khisty (1994)
LOS A greater or equal to 85% satisfied 5 points
LOS B greater or equal to 60% satisfied 4 points
LOS C greater or equal to 45% satisfied 3 points
LOS D greater or equal to 30% satisfied 2 points
LOS E greater or equal to 15% satisfied 1 points
LOS E less than 15% satisfied 0 points
To find out the relative importance of factors with respect to each other, Khisty (1994) opts for the constant-sum, paired comparison method, which is a systematic approach for determining the relative importance of a number of factors using group consensus. The method consists in the presentation to the respondents of all possible pair of factors. Each respondent is asked to distribute a constant bundle of values (in this case 10) between each pair of factors. If a respondent believes that, for example, Attractiveness is far more important that Comfort, a score of 8 for Attractiveness and a score of 2 for Convenience might be given by the respondent. If, on the contrary, the respondent finds that the 2 factors in the pair are equally important, 5 points might be given to each of them. The number of points given to each factor is then divided by the total points allocated to all pairs and so the relative importance of each factor with respect to the others is calculated. 5.4 Adapting the environmental LOS to the study case: modifications needed and data collection The application of the methodology required some modifications and also the design of a questionnaire. The first step to make the environmental LOS methodology suitable for the study was to find out whether the Environmental Factors selected by Khisty (1994) were appropriate or not for Oxford Street. A decision was made to remove System Continuity from the list because it had been found by Khisty (1994) the less important one. In addition to this, the elimination of one factor notably simplified the task for the respondent (from 21 to 15 possible combinations), an important point because the constant-sum, paired comparison exercise was expected to cause some fatigue in the respondents. Figure 2 shows the matrix of Environmental Factors designed for this research, how it was presented to respondents and how the points are allocated to find out the relative importance of each factor.
©Association for European Transport and contributors 2006

Figure 2: Ranking and weighting exercise to find out the relative importance of Environmental Factors
YOUR SCORE CHARACTERISTICS YOUR SCORE7 attractiveness 33 security 7
4 convenience 56 system coherence 5
4 safety 86 comfort 2
6 system coherence 74 comfort 3
6 safety 74 attractiveness 3
CHARACTERISTICS YOUR SCOREattractiveness
comfort46
securitysafety
safetyconvenience
55
4comfort
73
security 6
attractivenesssystem coherence
82
CHARACTERISTICSsecurity
convenience
convenience
safetysystem coherence
attractiveness
system coherencesecurity
comfortconvenience
4 6 3 3 3 19 0.127
6 6 2 4 3 21 0.140
4 4 2 3 5 18 0.120
7 8 8 5 6 34 0.227
7 6 7 5 6 31 0.207
7 7 5 4 4 27 0.1801.0
Security
System Coherence
Attractiveness
Comfort
Convenience
Safety
Attractiveness Comfort Convenience Safety SecuritySystem
Coherence
6 4 7 7 7
4 4 8 6 7
6 6 8 7 5
3 2 2 5 4
3 4 3 5 4
3 3 5 6 619 21 18 34 31 27
Regarding the presentation of the Environmental Factors to the respondents, a decision was made to define them in a easy and direct way. Definitions are shown in Figure 3
Figure 3: Definitions of Environmental Factors presented to respondents
ENVIRONMENTAL FACTOR MEANING OF THE FACTOR FOR THIS DISSERTATION
ATTRACTIVENESS a pleasant and interesting walking experience
COMFORT enough space to walk at own pace
CONVENIENCE good connexions and services
SAFETY conflicts with cars and with other pedestrians
SECURITY good lighting and police presence
SYSTEM COHERENCE orientation and easy navigation
©Association for European Transport and contributors 2006

The next point was how to ask people whether they were satisfied or not with the facility. As Khisty (1994) didn’t propose any specific way to capture this data, six multiple choice questions were designed, one for each Environmental Factor. The respondents were asked whether they were satisfied or not with each Environmental Factor in Oxford Street. To detect if the schemes would be able to improve the satisfaction of users, it was decided to ask if the level of satisfaction with respect to each Environmental Factor would go up, remain the same or go down if the schemes were implemented. Pictures were introduced illustrating the schemes so respondents could imagine how it could be. An example is given in Figure 4.
ATTRACTIVENESS up same downCOMFORT up same downCONVENIENCE up same downSAFETY up same downSECURITY up same downSYSTEM COHERENCE up same down
DIFFERENT LANES FOR DIFFERENT DIRECTIONS (existing
policy in Sydney, Australia)
PART 3: Imagine if the following facilities were installed in Oxford Street to ease pedestrian congestion, how would your level of satisfaction change with respect to each characteristic?
Figure 4: One of the questions to find out how the schemes might affect user’s satisfaction Additional questions about the respondent characteristics were also included in the questionnaire. This questions were about age, gender, familiarity with the area, trip purpose, type of walker (fast, slow), if the respondent was walking alone or with someone else, if the respondents had any mobility restriction and if the respondent felt annoyed because of conflicts with other pedestrians. 408 questionnaires were handed out in Oxford Street and 66 of them were returned completed, which makes a response rate of 16%
©Association for European Transport and contributors 2006
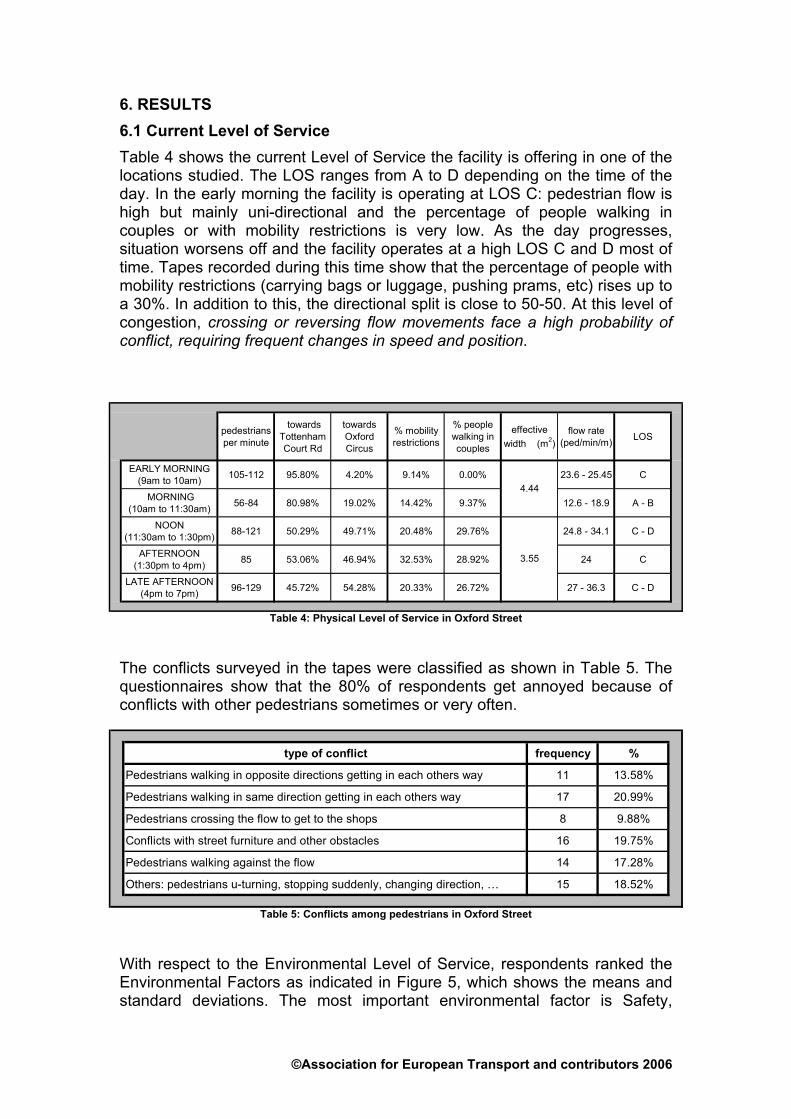
6. RESULTS 6.1 Current Level of Service Table 4 shows the current Level of Service the facility is offering in one of the locations studied. The LOS ranges from A to D depending on the time of the day. In the early morning the facility is operating at LOS C: pedestrian flow is high but mainly uni-directional and the percentage of people walking in couples or with mobility restrictions is very low. As the day progresses, situation worsens off and the facility operates at a high LOS C and D most of time. Tapes recorded during this time show that the percentage of people with mobility restrictions (carrying bags or luggage, pushing prams, etc) rises up to a 30%. In addition to this, the directional split is close to 50-50. At this level of congestion, crossing or reversing flow movements face a high probability of conflict, requiring frequent changes in speed and position.
Table 4: Physical Level of Service in Oxford Street
pedestrians per minute
towards Tottenham Court Rd
towards Oxford Circus
% mobility restrictions
% people walking in couples
effective width (m2)
flow rate (ped/min/m) LOS
EARLY MORNING (9am to 10am) 105-112 95.80% 4.20% 9.14% 0.00% 23.6 - 25.45 C
MORNING (10am to 11:30am) 56-84 80.98% 19.02% 14.42% 9.37% 12.6 - 18.9 A - B
NOON (11:30am to 1:30pm) 88-121 50.29% 49.71% 20.48% 29.76% 24.8 - 34.1 C - D
AFTERNOON (1:30pm to 4pm) 85 53.06% 46.94% 32.53% 28.92% 24 C
LATE AFTERNOON (4pm to 7pm) 96-129 45.72% 54.28% 20.33% 26.72% 27 - 36.3 C - D
4.44
3.55
The conflicts surveyed in the tapes were classified as shown in Table 5. The questionnaires show that the 80% of respondents get annoyed because of conflicts with other pedestrians sometimes or very often.
Table 5: Conflicts among pedestrians in Oxford Street
type of conflict frequency %
Pedestrians walking in opposite directions getting in each others way 11 13.58%
Pedestrians walking in same direction getting in each others way 17 20.99%
Pedestrians crossing the flow to get to the shops 8 9.88%
Conflicts with street furniture and other obstacles 16 19.75%
Pedestrians walking against the flow 14 17.28%
Others: pedestrians u-turning, stopping suddenly, changing direction, … 15 18.52%
With respect to the Environmental Level of Service, respondents ranked the Environmental Factors as indicated in Figure 5, which shows the means and standard deviations. The most important environmental factor is Safety,
©Association for European Transport and contributors 2006

followed by Security, Convenience, Comfort, System Coherence and Attractiveness. Further statistical analysis was carried out to find out if the average valuations given to each characteristic were significantly different. That was the case in all cases except for Comfort and Convenience, which are equally important for the respondents. Correlations were run between the variables to find out if respondents follow a pattern when giving values to the different environmental factors. Safety and Security were positively correlated between them, which means that respondents giving high values to Safety were more likely to give high values to Security as well.
0.000
0.050
0.100
0.150
0.200
0.250
SAFETY
SECURITY
CONVENIENCE
COMFORT
SYSTEM COHERENCE
ATTRACTIVENESS
Figure 5: Relative importance of Environmental Factors, means and standard deviations Regarding the satisfaction of users with the facility, 80% of users said to be satisfied with respect to Convenience and System Coherence, around half of the users said to be satisfied with Security and Attractiveness and just 20% with Safety and Comfort. Figure 6 shows the percentage of people satisfied or not with the different Environmental Factors. Further statistical analysis show that respondents are equally satisfied with Convenience and System Coherence, with Security and Attractiveness and with Security and Comfort. However, the number of respondents satisfied with these three pairs of variables are significantly different.
©Association for European Transport and contributors 2006

0%
10%
20%
30%
40%
50%
60%
70%
80%
90%
100%
CONVENIENCE SYSTEMCOHERENCE
SECURITY ATTRACTIVENESS SAFETY COMFORT
SATISFIED IT IS NOT TOO BAD NOT REALLY NOT SATISFIED
Figure 6: Percentage of people satisfied with each of the Environmental Factors in Oxford Street
Once the relative importance of each Environmental Factor and the level of satisfaction of the users with the facility has been found, the Environmental LOS can be calculated. Table 6 shows that The overall Environmental Level of Service for Oxford Street is between a C and a D, which means that more than 30% but less than 45% of respondents are satisfied with the facility.
ENVIRONMENTAL FACTOR % SATISFIED LOS POINTS RELATIVE IMPORTANCE TOTAL
ATTRACTIVENESS 53 C 3 0.136 0.408
COMFORT 18.2 E 1 0.163 0.163
CONVENIENCE 78.8 B 4 0.166 0.664
SAFETY 24.2 E 1 0.197 0.197
SECURITY 56.1 C 3 0.188 0.564
SYSTEM COHERENCE 72.7 B 4 0.149 0.596
2.592GRAND TOTAL
THE OVERALL ENVIRONMENTAL LEVEL OF SERVICE IS BETWEEN A "C" AND A "D"
Table 6: Environmental Level of Service in Oxford Street 6.2 Impact of the schemes on the Level of Service In order to find out the possible effect of the schemes on the Physical Level of Service, a qualitative assessment was made to see if the schemes had the
©Association for European Transport and contributors 2006

potential to avoid conflicts among pedestrians. Figure 7 shows that more that
If all the street furniture would be removed from the area, the
egarding thcluded in th each scheme
would produce in
d. The totals show that
Comfort. With respect to
one third of the conflicts couldn’t have been avoid with any of the schemes. On the other hand, Directional Lanes had the potential to avoid more than one fourth of the conflicts, while the segregation of flows by speeds could have the potential to reduce the conflicts by 20%. Street Furniture Relocation appears with a modest 17% of potential, but without considering its possible knock – on effects. Street Furniture Relocation has the obvious potential of freeing space and therefore to increment the pavement width. As an example, Location 1 will be examined: average effective width of the pavement during day time would go up from 3.55 m to 4.44 m. With the same volume of pedestrians, the undesirable LOS D would be avoided. fast/slow
Figure 6: Potential of each of the schemes to avoid conflicts
e Environmental Level of Service, a set of questions were e questionnaire about the possible changes that
street furniture
relocation17%
directional lanes28%
avoidable conflicts
35%
lane20%
not
Rin
each of the Environmental Factors. Figure 7 shows the number and the proportion of respondents saying that they would be more, same or less satisfied with respect to each Environmental Factor if the schemes were implementethe schemes which could make respondents feel more satisfied are Directional Lanes and Street Furniture Relocation. Focusing on each characteristic, Directional Lanes are the more powerful scheme to improve Attractiveness. Street Furniture Relocation is the best to improve satisfaction with respect to Security and Convenience, non significant differences were found among the schemes, which means that none of the schemes would make pedestrians feel more satisfied with this variable than the other three. Directional Lanes and Slow Lane would improve the perception of users with respect to Safety, while
©Association for European Transport and contributors 2006

Street Furniture Relocation and Directional Lanes would make the street easier to navigate.
DIRECTIONAL LANES
A TTR
224
26
19
43
47
55
34
145
28
47
23
15
10
22
27
4
1
10
0
0
12
0% 20% 40% 60% 80% 100%
TOTA L
SY S
SEC
SA F
CONV
COM
STREET FURNITURE RELOCATION
211
27
25
37
35
45
42
157
27
40
28
25
20
17
28
6
1
7
12
1
1
0% 20% 40% 60% 80% 100%
TOTA L
SY S
SEC
SA F
CONV
COM
A TTR
FAST LANE
156
17
12
28
40
38
21
208
38
51
32
23
24
40
32
3
4
5
6
3
11
0% 20% 40% 60% 80% 100%
TOTA L
SY S
SEC
SA F
CONV
COM
A TTR
SLOW LANE
183
20
10
41
40
45
27
186
41
54
22
22
17
30
27
4
4
9
5
2
3
0% 20% 40% 60% 80% 100%
TOTA L
SY S
SEC
SA F
CONV
COM
A TTR
MORE SAME LESS
Figure 7: Impact of the schemes on the Env ronmental Level of Service i
©Association for European Transport and contributors 2006

7. CONCLUSION
rrent conditions on Oxford Street show the quality of flow is poor and pedestrians are not satisfied with the facility. The schemes studied
, the good results obtained for Directional Lanes and Street Furniture
as observed
because of conflicts with other
Bibliography
December 2000) Pedestrians: Get in Lane (online). Available t: http://news.bbc.co.uk/1/hi/uk/1049698.stm
The study of the cu
have the potential of avoiding conflicts among pedestrians, which would improve the quality of flow. In addition to this, pedestrians said that the implementation of the schemes would make them feel more satisfied with the facility. That does not mean that the schemes would work wonderfully if implemented. HoweverRelocation deserve consideration in pedestrian environments in where other more conventional measures like pedestranisation and street closures are not an option. Dynamic simulation could give further evidence of the adequacy of each scheme for different flow compositions and directional split. With respect to the applied methodology, the constant sum paired comparison method gave interesting information but, on the other hand, it wthat some respondents didn’t understand the exercise, and for this reason only 66 of the 74 returned questionnaires could be used. A simple ranking exercise done before the constant sum paired comparison method would have made the task easier for respondents. Regarding the study of conflicts, the indicator was proven important when most respondents declared to get annoyedpedestrians. Further work would be recommendable in order to improve the data collection and to refine the proposed typology.
BBC NEWS (4a (24.04.04)
icycle Paths. Transportation Research Record 1502 TRB,
Pedestrian Level of Service (online). Procedures of Australia:
BIJELIC, I (2003) Modelling the Provision of Travelators in Busy City Centres ITS Dissertation BOTMA, H (1995) method to Determine Level of Service for Bicycle Paths and Pedestrian BNational Research Council, Washington D.C. pp 38-44 FRUIN, J (1987) Pedestrian and Planning Design Elevator World Inc, Alabama GALLIN, N (2001) Quantifying Pedestrian Friendliness – Guidelines for AssessingWalking the 21st Century – An International Walking Conference. Available at: http://www.dpi.wa.gov.au/walking/pdfs/A12.pdf (24.04.04) HELBING, D and MOLNAR, P (1997) Self-organization Phenomena in Pedestrian Crowds, in Self-organization of Complex Structures: from Individual to Collective Dynamics, Schweitzer, F (ed) pp 569-577
©Association for European Transport and contributors 2006

©Association for European Transport and contributors 2006
HOWITT, D and CRAMER, D (2001) A Guide to Computing Statistics with SPSS for Windows Prentice Hall KAISER, S.H. (1994) Urban Intersections that work: A new definition for Level of Service Transportation Research 1438 KANSAS CITY COUNCIL (n/a) Kansas City Walkability Plan (online). Available at: www.kcmo.org/planning.nsf/plnpres/ walkability?opendocument (24.04.04) KHISTY, C.J. (1994) Evaluation of Pedestrian Facilities – Beyond the Level of Service Concept. Transportation Research Record 1438. TRB, National Research Council, Washington D.C. pp 45-50 KOMANOFF, C (8 January 1998) Travel Time Impacts on Mayor Giuliani’s Midtown-Manhattan Crosswalks Barriers (online). Rightofway Pedestrian Association. Available at: www.rightofway.org/research/ckmidtwn.html MORNING HERALD TRIBUNE (8 February 2003) A wild sidewalk is all the city Footpath rage (online). Available at: http://www.smh.com.au/articles/2003/02/07/1044579933561.html (24.04.04) MORI, M and TSUKAGUCHI, H (1987) A New Method of Evaluation of Level of Service in Pedestrian Facilities Transportation Research A, Vol 21, N 3, pp 223-234 MURALEETHARAN, T (2000) A Study on Evaluation of Pedestrian Level of Service along Sidewalks and at Intersections Using Conjoint Analysis (online). Division of Urban and Environmental Engineering of Hokkaido University. Available at: j http://ws3-er.eng.hokudai.ac.jp/egpsee/presentation/Muralee.pdf (24.04.04) PUSHKAREV, B and ZUPAN, J (1975) Urban Spaces for Pedestrians. MIT Press, Cambridge, Mass SARKAR (1995) Determination of Service Levels for Pedestrians with European Examples. Transportation Research Record 1405, TRB, National Research Council, Washington D.C pp 35-42 STONOR, T, de ARRUDA CAMPOS, M, and SMITH, A (2001) Towards a Walkability Index Proceedings of Walk 21. 3rd International Conference TRANSPORTATION RESEARCH BOARD (1985) Highway Capacity Manual TRB Special Report 209, Washington D.C. National Research Council TRANSPORTATION RESEARCH BOARD (2000) Highway Capacity Manual National Research Council, Washington D.C. WALKINFO ASSOCIATION (n/a) Pedestrian Level of Service (online). Available at: http://www.bikelib.org/roads/blos/BPLOS_StLouis0603.pdf (24.04.04)