Embed Size (px)
Citation preview

10/17/2007 www.fpinnovations.ca 1
Assessment of Methods for the Measurement of Macrostickies in Recycled Pulps
Bruce Sitholé & Denise Filion

2
Outline
• Classification of stickies• Assessing quality of DIP• How are stickies measured• Evaluation of different methodologies
– Their merits and demerits

3
Classification of stickies
• Doshi and Dyer classified stickies by physical and chemical properties– Chemistry (PSA, hot melts, or both)– Screening (macro and micro)– Behaviour (viscoelastic and rigid)– External factors (primary and secondary)– Association (bound to fibres and free)– Compatibility (recycle-compatible & recycle-
incompatible)– Visibility (visible and sub-visible)
4
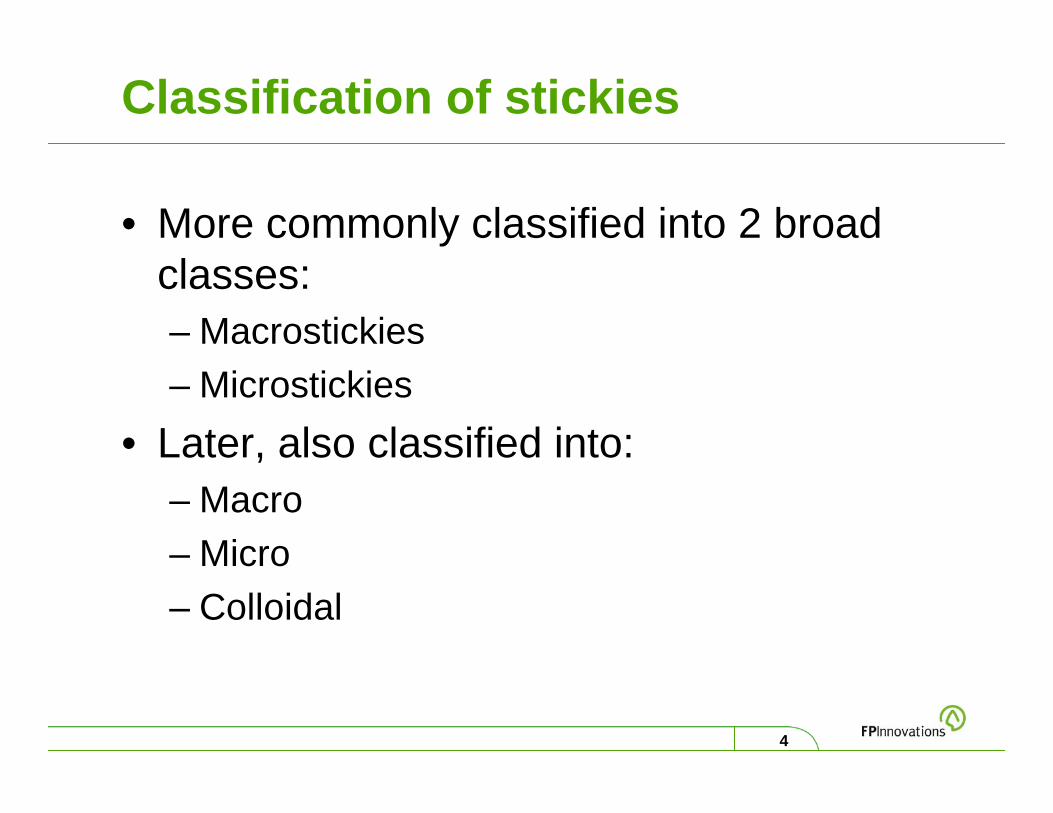
Classification of stickies
• More commonly classified into 2 broad classes:– Macrostickies– Microstickies
• Later, also classified into:– Macro– Micro– Colloidal

5
Classification of stickies
• Macrostickies– Solid particles resulting from incomplete
disintegration during repulping– Particle size exceeds 100 µm– Can be removed by coarse screening– Major sources
• Hot melts, PSAs

6
Classification of stickies
• Microstickies– Particles 100-1 µm range– Sources
• Small adhesives particles• Coating binders• Ink resins

7
Classification of stickies
• Colloidal– Particles below 1 µm– Particles of insoluble wood resin, SBR,
PVA, latexes, emulsified oils
8
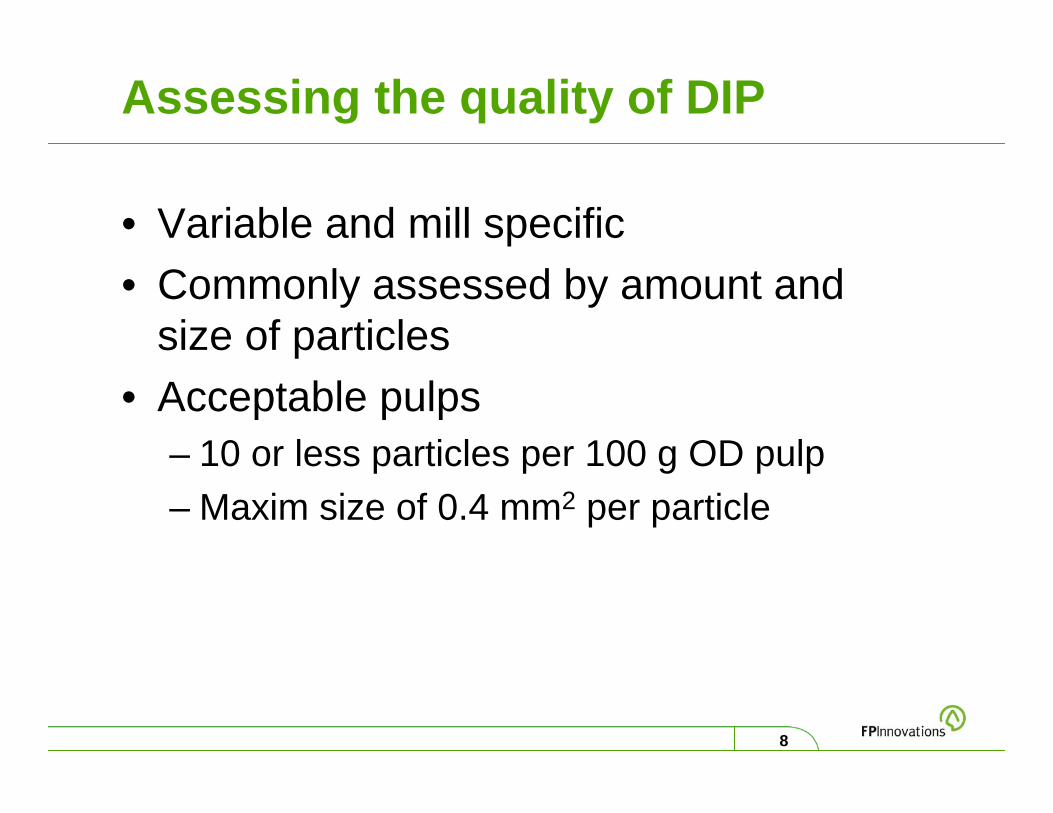
Assessing the quality of DIP
• Variable and mill specific• Commonly assessed by amount and
size of particles• Acceptable pulps
– 10 or less particles per 100 g OD pulp– Maxim size of 0.4 mm2 per particle
9
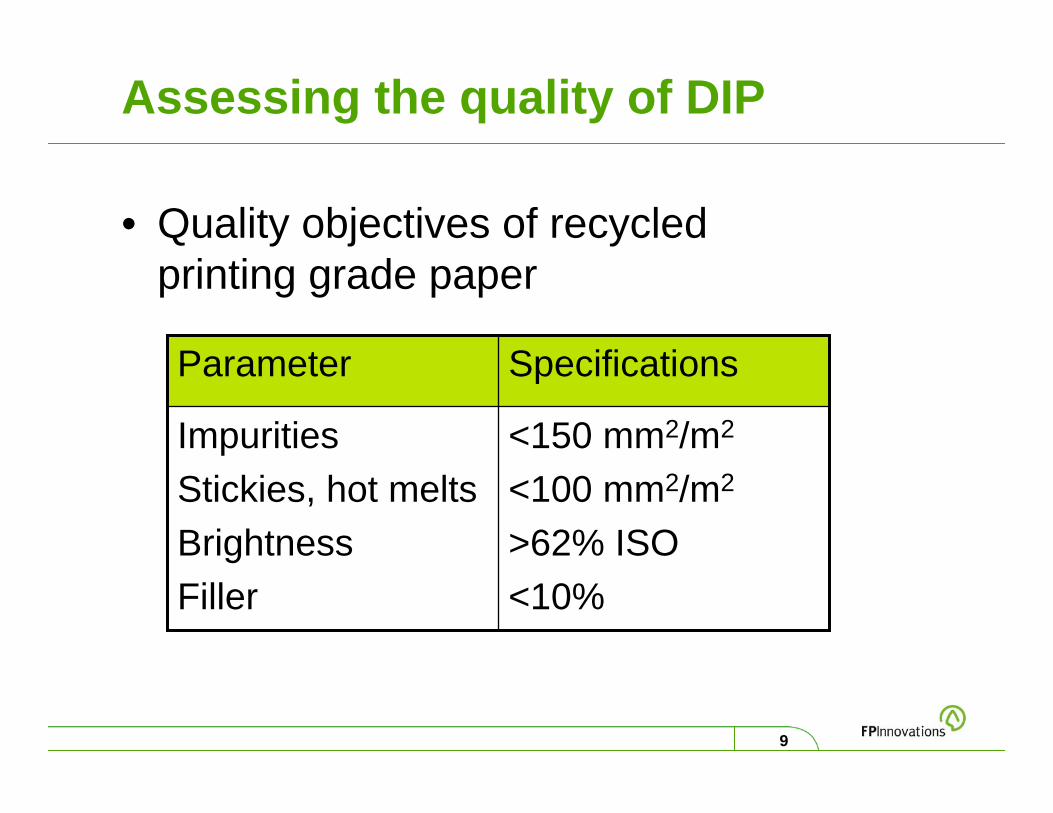
Assessing the quality of DIP
• Quality objectives of recycled printing grade paper
<150 mm2/m2
<100 mm2/m2
>62% ISO<10%
ImpuritiesStickies, hot meltsBrightnessFiller
SpecificationsParameter

10
Assessing the quality of DIP
• It is evident that macrostickies define the quality of DIP recycled printing papers
11
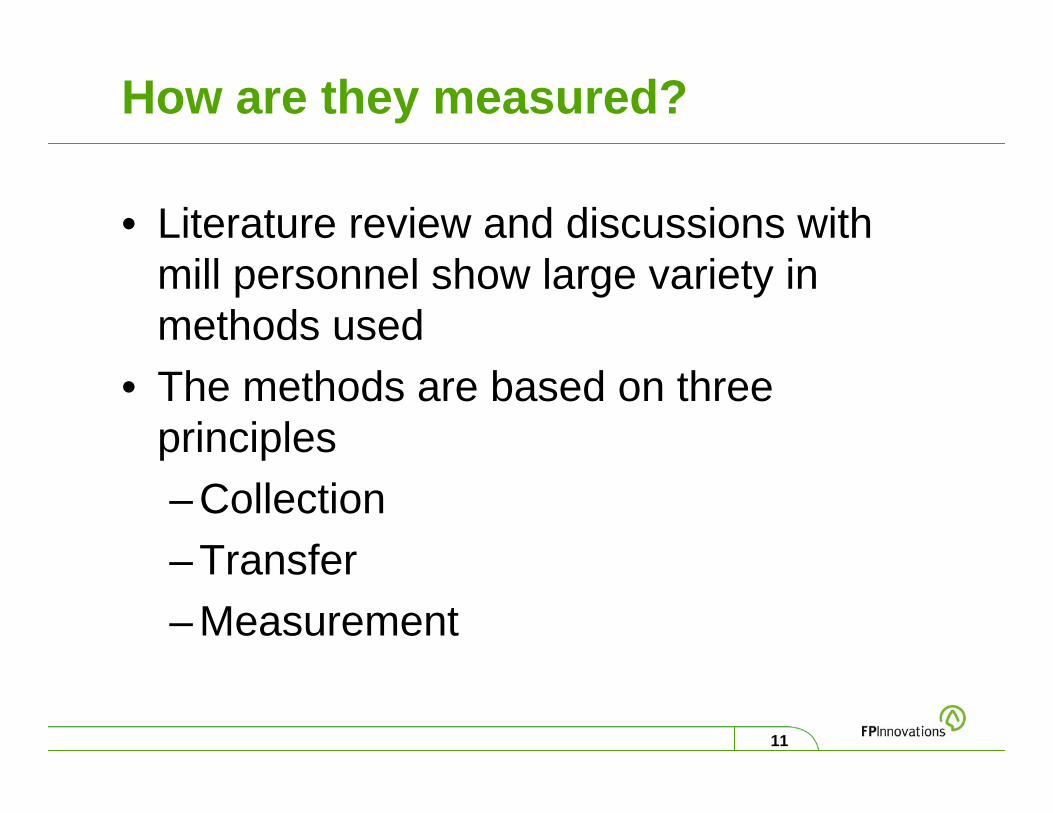
How are they measured?
• Literature review and discussions with mill personnel show large variety in methods used
• The methods are based on three principles– Collection– Transfer– Measurement

12
Measurement of stickiesPulp sample
Disintegration
Screening(150 or 100 µm)
Collect on filter paper or screen
Coating, pressure,temperature
Blotter, couch,brushing
Copy paper,laminator
Manual counting,Image analysis
Step 1: collection
Step 3: measurement
Step 2: transfer

13
Measurement of stickies
• Significant differences in the details of the three steps
• Therefore, we evaluated the pros and cons of the methods

14
Objective
• Evaluate the different methodologies• Recommend which one(s) to use for
evaluating the quality of recycled pulps

15
Previous work• Doshi et al (2003) compared four
methods for measuring macrostickies• Model and real samples were analysed
by 4 labs– Black ink method– INGEDE method– Enzyme digestion method– Blue dye method
• All methods used image analysis– Average # and size of contaminants

16
Previous work
• Conclusion– considerable variations in actual values
of stickies area reported by the participating groups
• Not surprising due to significant differences in the methods used to measure the concentration of macrostickies
– excellent linear correlation among all methods for both laboratory as well as mill samples

17
Previous work
• Conclusion– Any one of the methods was
suitable for monitoring stickies content
– But one could not compare actual values from the different labs as they may vary significantly

18
Our approach
• Samples analysed by the same personnel in one laboratory
• Helps in assessing the merits and demerits of the different methodologies

19
Samples
25 g OD
50 g OD
50 g OD
25g OD
ONP/magazine (70:30)
ONP (100%)
MOW
OCC
DIP
news
tissue
paperrecycled
board
Mill1
Mill2
Mill3
Mill4
Amount of sample
Fibre sourceType of mill
Site
20
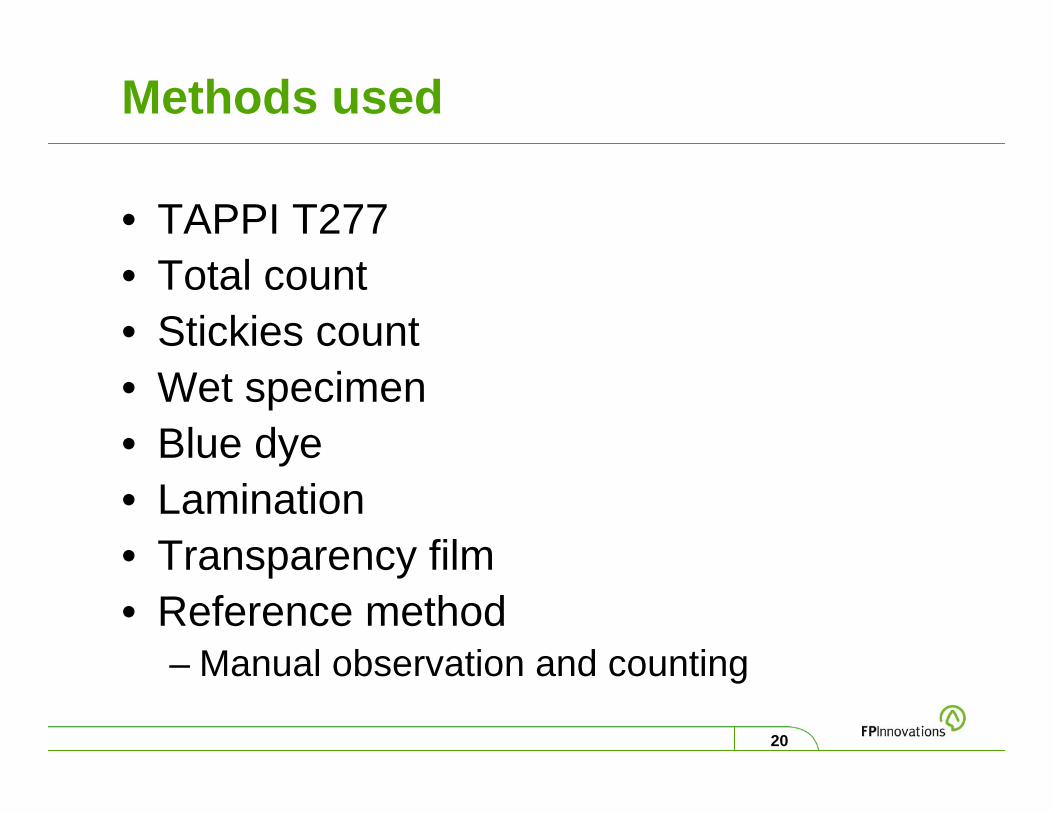
Methods used
• TAPPI T277• Total count• Stickies count• Wet specimen• Blue dye• Lamination• Transparency film• Reference method
– Manual observation and counting
21
Sample preparation
• Collection step– Pulmac Masterscreen

22
Analysis
Physical properties
Quantification
Scanner
Characterization of macrostickies
(tacky, gooey, powdery, etc)
(number/area of particles)

23
Methods used: TAPPI T277
• Collect rejects on a black filter paper• Place coated paper on top of the rejects• Sandwich filter paper and coated paper
between two blotters• Heat and press for 10 min • Wash to remove other material • Cover with silicon release paper: heat
and dry• this transfers the silicone onto the stickies to
make them more visible for image analysis.• Eliminate fibres prior to scanning and
image analysis.

24
Methods used: Total count• Collect rejects on white filter paper, dry
overnight at room temperature• Laminate filter paper • Scan and analyse by image analysis.

25
Methods used: Stickies count• Collect rejects on white filter paper• Place blotter on top, press with couch roll
and remove• Place second blotter on the rejects and
press with couch roll• Dry both blotters (with rejects) at 110oC for
exactly five minutes• Use paint brush to remove other materials• Place transparency film on top of each
blotter• Scane and analyse by image analysis

26
Methods used: Wet specimen
• A black palette with uniform flat surface• Wet specimen is rolled with a soft roller to
remove the air formed between it and the palette
• A shallow box with a transparent bottom that is placed on the image analysis glass

27
Methods used: Blue dye
• Disintegrate, 1.2 g handsheets• Couch, discard second wet blotter, replace
by a third one to protect the handsheet• Dry• Apply the blue dye to the backside of the
blotter• Evaporate heptane solvent in the dye • Peel dyed handsheet, scan, image
analysis
28
Methods used: Lamination
• Collect rejects on white filter paper• Dry• Place facedown on white copy paper• Place another copy paper on the filter
paper to make a protective pocket• Pass twice through a laminator at 125oC • Staple a transparency film onto the copy
paper with the contaminants • Scan, image analysis

29
Methods used: Transparency film
• Collect rejects onto a white filter paper• Place wet filter paper, stickies side down,
on image side transparency• Place blotter paper on top • Sandwich filter paper, transparency, and
blotter into paper folder• Pass sandwiched sheets, twice through
laminator set at 125oC• Remove blotter and filter paper, allow
transparency to air-dry• Protect transparency with another
transparency, scan, image analysis

30
Methods used: Reference method
• Collect rejects on a white filter paper• Place another filter paper on top of the
rejects• Dry by heating and pressing • Examine each filter paper under a low-
power stereo microscope with aid of a needle
• Manually count contaminants, classify into– the different classes (stickies, hot melts,
plastics, others.)

31
Evaluation of the different methods• To facilitate processing, a DIP sample was
first evaluated using all the methods• Three most promising ones were then
selected for further testing on the rest of the pulp samples

32
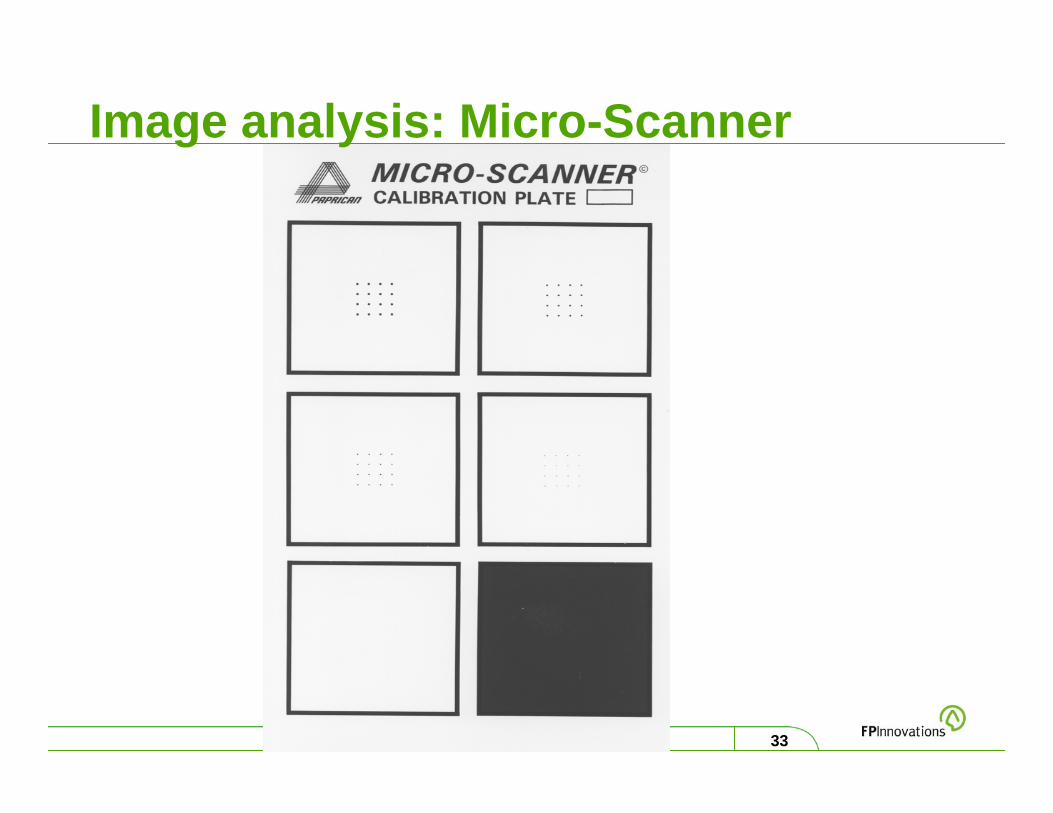
Image analysis• Software: Image-Pro Plus• Calibrated using image of ruler• Accuracy checked using calibration plate
(Micro-Scanner, Paprican)
33
Image analysis: Micro-Scanner

34
Results• Different scanners
815±0.28%
187.32±0.07%
834±0.52%
283.10±2.03%
841±0.86%
288.35±3.30%
Cleanerrejects
40±2.5%
8.98±0.28%
47±3.20%
13.09±1.74%
46±5.21%
13.03±2.23%
DIP
Number of
particles
Total surface
area, mm2
Number of
particles
Total surface
area, mm2
Number of
particles
Total surface
area, mm2
AGFA scannerHP scanner BHP scanner ASample

35
Results
0.66836831825Cleaner rejects
4.5494645DIP
% error10 scans5 scans1 scanNumber of particles
2.6284.23277.67269.62Cleaner rejects
1.713.4513.01213.01DIP
10 scans5 scans1 scan % errorTotal surface area, mm2Sample
• Reproducibility of scanning measurements

36
Results• Effect of location on the scanner
0.34842842837Cleaner rejects
4.5494647DIP
% errorbottommiddletopNumber of particles
2.6283.37282.55284.62Cleaner rejects
0.3913.2513.1513.18DIP
bottommiddletop % errorTotal surface area, mm2Sample
37
Results
• Reproducibility of the scanning measurements– Placement of sample on scanner does not
affect the data generated– Scanner generates very reproducible data
irrespective of the number of scans

38
Results: DIP sample
578 1279 332 108 1684 92 641 5790
200
400
600
800
1000
1200
1400
1600
1800
2000
2200
7000
8000
9000
Method 1 Method 2 Method 3 Method 4A Method 4B2 Method 5 Method 6 Method 7 Method 8
Are
a, m
m²/k
g
7716578 1279 332 108 1684 92 641 5790
200
400
600
800
1000
1200
1400
1600
1800
2000
2200
7000
8000
9000
Method 1 Method 2 Method 3 Method 4A Method 4B2 Method 5 Method 6 Method 7 Method 8
Are
a, m
m²/k
g
7716
3960 11248 1856 111480 976 38472 528 2690 46960
5000
10000
15000
20000
25000
30000
35000
40000
45000
50000
55000
60000
Method 1Voith
Method 2Total
Method 3BTB
Method 4A Method 4B2 Method 5Dye
Method 6Stone
Method 7Aquan-Yuen
Method 8 S+ HM
# pa
rticl
es p
er k
g
3960 11248 1856 111480 976 38472 528 2690 46960
5000
10000
15000
20000
25000
30000
35000
40000
45000
50000
55000
60000
Method 1Voith
Method 2Total
Method 3BTB
Method 4A Method 4B2 Method 5Dye
Method 6Stone
Method 7Aquan-Yuen
Method 8 S+ HM
# pa
rticl
es p
er k
g
Number
Area
39
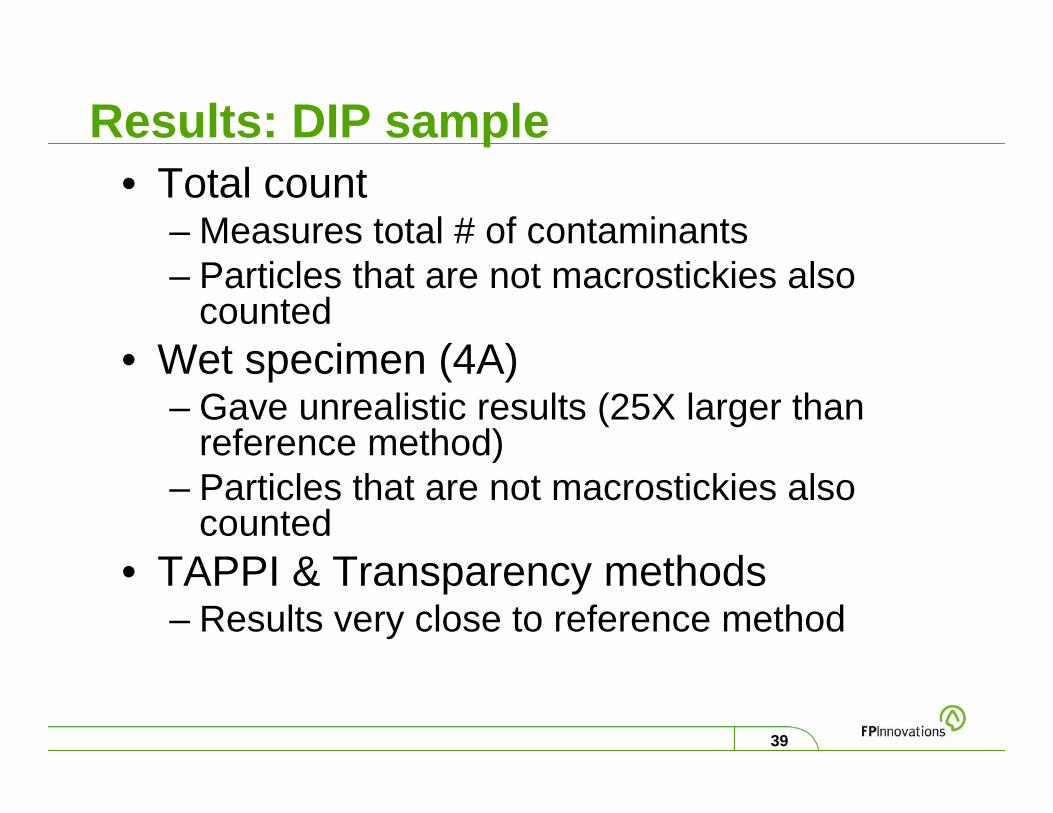
Results: DIP sample• Total count
– Measures total # of contaminants– Particles that are not macrostickies also
counted• Wet specimen (4A)
– Gave unrealistic results (25X larger than reference method)
– Particles that are not macrostickies also counted
• TAPPI & Transparency methods– Results very close to reference method

40
Results: further testing
0.5295028567Reference 18352820798Transparency10202817401Stickies count 16312413992TAPPI
% errorNumber% errorarea
Number of particles/kg
pulp
Total surface area of
contaminants, mm2/kg
Methods
• DIP sample
41
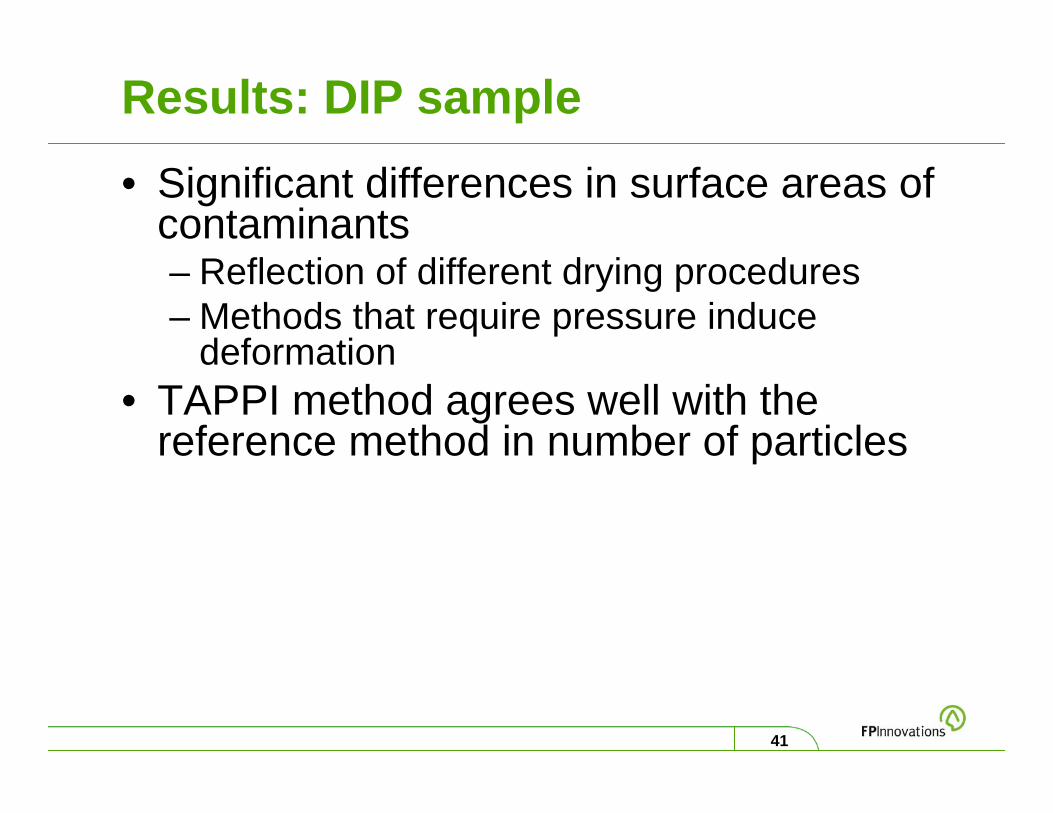
Results: DIP sample
• Significant differences in surface areas of contaminants– Reflection of different drying procedures– Methods that require pressure induce
deformation• TAPPI method agrees well with the
reference method in number of particles

42
Results: further testing
559103273Reference 14113611261Transparency22190825246Stickies count 214724291957TAPPI
% errorNumber% errorarea
Number of particles/kg pulp
Total surface area of
contaminants, mm2/kg
Methods
• Tissue sample

43
Results: tissue sample
• Stickies count and transparency methods– Best results in agreement with reference
method

44
Results: further testing
n/a26,120n/an/aReference 58169,0976442,954Transparency3843,6115271,779Stickies1525,160126,671TAPPI
% errorNumber% errorarea
Number of particles/kg pulp
Total surface area of contaminants,
mm2/kgMethods
• 100% OCC mill

45
Results: 100% OCC mill
• TAPPI method gives results similar to those of the reference method
46
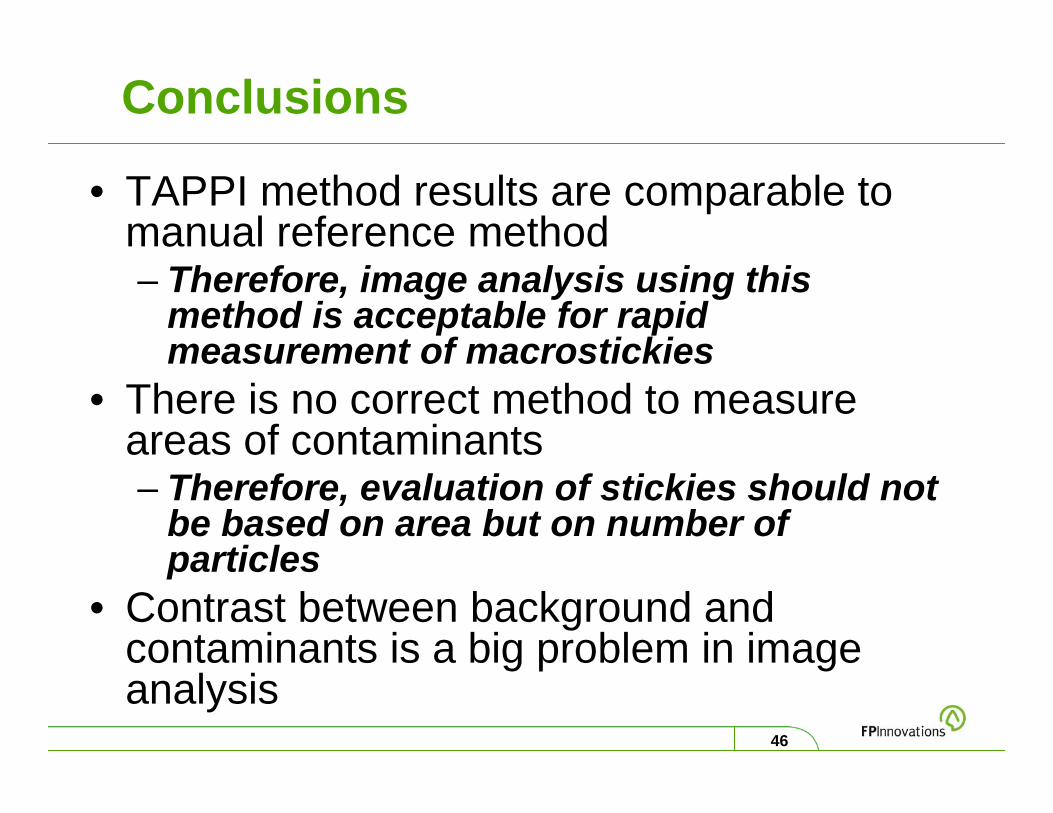
Conclusions
• TAPPI method results are comparable to manual reference method– Therefore, image analysis using this
method is acceptable for rapid measurement of macrostickies
• There is no correct method to measure areas of contaminants– Therefore, evaluation of stickies should not
be based on area but on number of particles
• Contrast between background and contaminants is a big problem in image analysis

47
Conclusions
• Image analysis does not work well on highly contaminated samples collected on 100 µ m screens– Particles hidden under fibres and shives– Best to use 150 µm screen
• If interested in evaluating contaminants, beside macrostickies, use Table X as a guide to method of choice.

48
Thank you for your attention!