Embed Size (px)
Citation preview

Assessment of Nonpoint Pollution in Washington State
August 2014 Publication No. 14-03-028
Publication and Contact Information This report is available on the Department of Ecology’s website at https://fortress.wa.gov/ecy/publications/SummaryPages/1403028.html The Activity Tracker Code for this study is 14-048. For more information contact: Publications Coordinator Environmental Assessment Program P.O. Box 47600, Olympia, WA 98504-7600 Phone: (360) 407-6764
Washington State Department of Ecology - www.ecy.wa.gov o Headquarters, Olympia (360) 407-6000 o Northwest Regional Office, Bellevue (425) 649-7000 o Southwest Regional Office, Olympia (360) 407-6300 o Central Regional Office, Yakima (509) 575-2490 o Eastern Regional Office, Spokane (509) 329-3400
Any use of product or firm names in this publication is for descriptive purposes only and does not imply endorsement by the author or the Department of Ecology.
If you need this document in a format for the visually impaired, call 360-407-6764.
Persons with hearing loss can call 711 for Washington Relay Service. Persons with a speech disability can call 877-833-6341.

Page 1
Assessment of Nonpoint Pollution in Washington State
by
Siana Wong and Paul Pickett
Environmental Assessment Program Washington State Department of Ecology
Olympia, Washington 98504-7710

Page 2
This page is purposely left blank

Page 3
Table of Contents
Page
List of Figures ................................................................................................................. 5
List of Tables .................................................................................................................. 7
Abstract ........................................................................................................................... 9
Acknowledgements ...................................................................................................... 10
Executive Summary ...................................................................................................... 11 Introduction ......................................................................................................... 11 Literature Summary ............................................................................................ 12 TMDL Load Allocations and GIS mapping ....................................................... 12 Section 319 Grants .............................................................................................. 13 Case Studies ........................................................................................................ 14 Discussion ........................................................................................................... 14 Conclusions and Recommendations ................................................................... 16
1. Introduction ............................................................................................................. 19 Problem Description ........................................................................................... 19 Study Objective and Approach ........................................................................... 19
2. Background on Nonpoint Pollution ......................................................................... 21 Definitions of Nonpoint Source Pollution .......................................................... 21 Nonpoint Source Pollution Guidance ................................................................. 22 Summary of Nonpoint Source Pollution Impacts and Sources ........................... 22
3. Literature Summary of Nonpoint Pollution Studies ............................................... 25 Objective ............................................................................................................. 25 Methods............................................................................................................... 25 Results ................................................................................................................. 25
4. TMDL Load Allocations ......................................................................................... 27 Objective ............................................................................................................. 27 Methods............................................................................................................... 27 Results ................................................................................................................. 28
5. GIS Land Use Analysis ........................................................................................... 35 Objectives ........................................................................................................... 35 Methods............................................................................................................... 35 Results ................................................................................................................. 37
6. Section 319 Grant Analysis ..................................................................................... 52 Methods............................................................................................................... 52 Results ................................................................................................................. 53
7. Case Studies ............................................................................................................. 60 Walla Walla Watershed, Eastern Region, WRIA 32 .......................................... 60
Watershed Description ................................................................................. 61 Water Quality Issues .................................................................................... 62
Page 4
Water Quality Improvement Project ............................................................ 62 Lower Yakima River Watershed, Central Region, WRIA 37 ............................ 65
Watershed Description ................................................................................. 66 Water Quality Issues .................................................................................... 68 Water Quality Improvement Project ............................................................ 68
Dungeness River Watershed and Dungeness Bay, Southwest Region, WRIA 18 ............................................................................................................. 71
Watershed Description ................................................................................. 72 Water Quality Issues .................................................................................... 73 Water Quality Improvement Project ............................................................ 73
Samish Bay Watershed, Northwest Region, WRIA 3 ........................................ 76 Watershed Description ................................................................................. 77 Water Quality Issues .................................................................................... 78 Water Quality Improvement Project ............................................................ 78
8. Synthesis and Discussion ........................................................................................ 83 Overview ............................................................................................................. 83 Agricultural Areas ............................................................................................... 84
Nonpoint versus Point Sources .................................................................... 84 Pollutants and Impacts ................................................................................. 84 Sources and Mechanisms ............................................................................. 85 Summary ...................................................................................................... 87
Urban and Residential Areas .............................................................................. 88 Nonpoint versus Point Sources .................................................................... 88 Pollutants and Impacts ................................................................................. 88 Sources and Mechanisms ............................................................................. 89
Hydromodification .............................................................................................. 93 Marinas and Recreational Boating ...................................................................... 95 Forested Areas .................................................................................................... 96 Atmospheric Deposition ..................................................................................... 98 Natural Sources and Other Sources .................................................................... 99 Seasonal Considerations ................................................................................... 100 Future Work ...................................................................................................... 100
Conclusions ................................................................................................................ 103
Recommendations ...................................................................................................... 104
References .................................................................................................................. 105 References Cited in the Text ............................................................................. 105 References from the Literature Database .......................................................... 109
Appendices ................................................................................................................. 116 Appendix A. Nonpoint Literature Database Description and Electronic Links ................................................................................................................. 117 Appendix B. List of Washington State TMDLs Reviewed ............................. 118 Appendix C. TMDL Database Description and Electronic Link ..................... 120 Appendix D. Glossary, Acronyms, and Abbreviations .................................... 121

Page 5
List of Figures Page
Figure 2.1. Top 10 sources of impairment in assessed rivers and streams as reported by the States. .................................................................................................. 24
Figure 4.1. Histogram plots showing the proportion of sites with load reduction targets by the amount of reduction needed to attain water quality standards ....................................................................................................... 32
Figure 4.2. Histogram plots showing the proportion of sites with bacteria load reduction targets by the amount of reduction needed to attain water quality targets ............................................................................................................. 33
Figure 4.3. Shade increase needed for water bodies with shade impairments, summarized by region. ................................................................................... 34
Figure 5.1. Workflow diagram used to explore land uses in association with nonpoint reduction targets. ............................................................................................ 36
Figure 5.2. Overview of nonpoint targets in Washington. ............................................... 38
Figure 5.3. Overview of shade targets in Washington. .................................................... 39
Figure 5.4. Locations of nonpoint targets in Ecology’s Central Region during the wet season. ............................................................................................................ 40
Figure 5.5. Locations of nonpoint targets in Ecology’s Central Region during the dry season. ............................................................................................................ 41
Figure 5.6. Locations of nonpoint targets in Ecology’s Eastern Region during the wet season. ............................................................................................................ 42
Figure 5.7. Locations of nonpoint targets in Ecology’s Eastern Region during the dry season. ............................................................................................................ 43
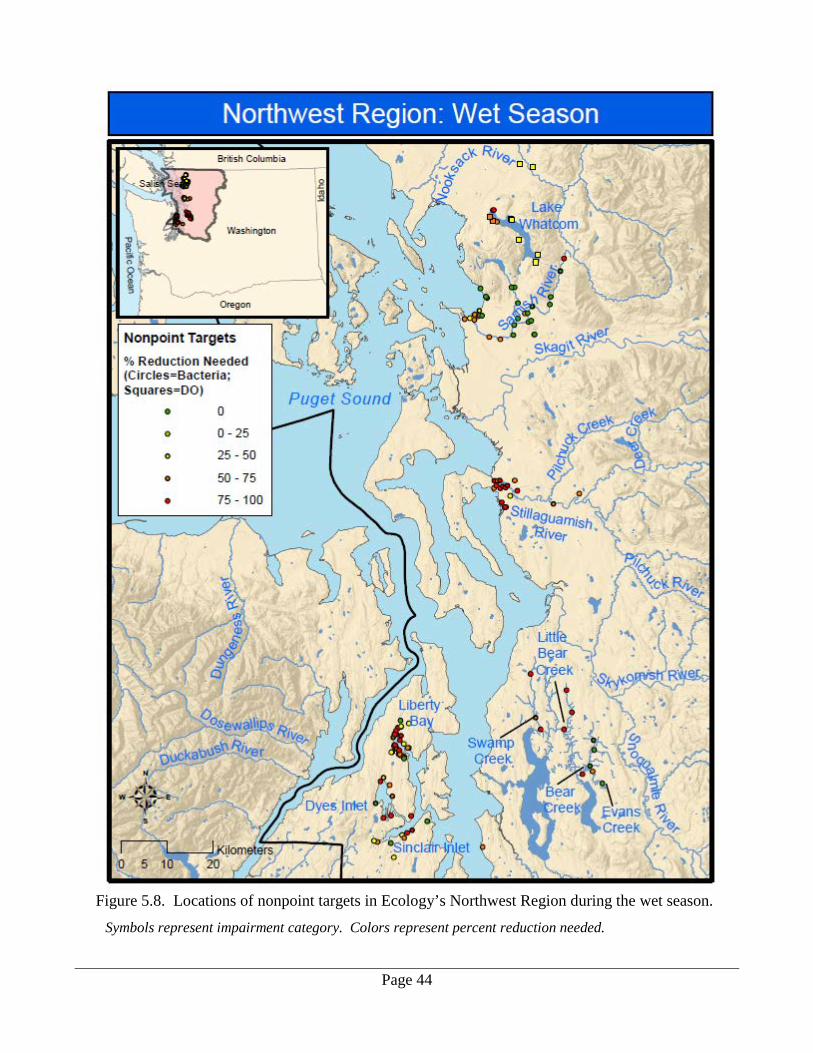
Figure 5.8. Locations of nonpoint targets in Ecology’s Northwest Region during the wet season. ..................................................................................................... 44
Figure 5.9. Locations of nonpoint targets in Ecology’s Northwest Region during the dry season. ..................................................................................................... 45
Figure 5.10. Locations of nonpoint targets in Ecology’s Southwest Region during the wet season. .................................................................................................... 46
Figure 5.11. Locations of nonpoint targets in Ecology’s Southwest Region during the dry season. .................................................................................................... 47
Figure 5.12. Relative general land use in watersheds of Ecology’s Central Region. ....... 48
Figure 5.13. Relative general land use in watersheds of Ecology’s Eastern Region. ...... 49
Figure 5.14. Relative general land use in watersheds of Ecology’s Northwest Region. .. 50
Figure 5.15. Relative general land use in watersheds of Ecology’s Southwest Region. .. 51
Figure 6.1. Percentage of Section 319-funded projects addressing NPS categories – statewide, Fiscal Years 2005–2013. ............................................................... 53
Page 6
Figure 6.2. Percentage of Section 319-funded projects addressing different categories of nonpoint source pollution – nationwide, Fiscal Years 2004–2010. ........... 54
Figure 6.3. Percentage of categories per Section 319-funded projects by category – statewide. ....................................................................................................... 55
Figure 6.4. Percentage of Section 319-funded projects addressing NPS categories – Central Region. .............................................................................................. 56
Figure 6.5. Percentage of categories addressed by each Section 319 grant-funded project, identified by WRIA – Central Region. ............................................. 56
Figure 6.6. Percentage of Section 319-funded projects addressing NPS categories – Eastern Region. .............................................................................................. 57
Figure 6.7. Percentage of categories addressed by each Section 319 grant-funded project, identified by WRIA – Eastern Region. ............................................. 57
Figure 6.8. Percentage of Section 319-funded projects addressing NPS categories – Northwest Region. ......................................................................................... 58
Figure 6.9. Percentage of categories addressed by each Section 319 grant-funded project, identified by WRIA – Northwest Region. ........................................ 58
Figure 6.10. Percentage of Section 319 grant-funded projects addressing NPS categories – Southwest Region. .................................................................... 59
Figure 6.11. Percentage of categories addressed by each Section 319-funded project, identified by WRIA – Southwest Region. .................................................... 59
Figure 7.1. Walla Walla River TMDL study area. ........................................................... 61
Figure 7.2. Source assessment of PCB and DDT loading in the Walla Walla watershed. ...................................................................................................... 64
Figure 7.3. Lower Yakima River TMDL study area. ....................................................... 67
Figure 7.4. Left panel: Median total suspended solids (TSS) loads in four irrigation waterways and the Yakima River during the 1997–2007 irrigation seasons. Right panel: Median turbidity in the Yakima River during the 1997–2007 irrigation seasons. ....................................................................... 70
Figure 7.5. Dungeness River watershed. .......................................................................... 72
Figure 7.6. Samish Bay watershed TMDL study area. ..................................................... 77
Figure 7.7. Estimated average annual loading from the tributaries to Samish Bay during the 2006-07 TMDL study. .................................................................. 79
Figure 8.1. Impervious cover in the Puget Sound region. ................................................ 90
Figure 8.2. Sensitive areas in nearshore areas of Puget Sound. ....................................... 95
Figure 8.3. Number of 2012 Category 5 listings by pollutant category. ........................ 101

Page 7
List of Tables Page
Table 4.1. Summary of TMDL reports by region and parameter addressed. ................... 28
Table 4.2. Summary of bacteria percent load reduction data collected from reviewed TMDL reports. ................................................................................................. 29
Table 4.3. Summary of turbidity load reduction data collected from reviewed TMDL reports. ............................................................................................................. 29
Table 4.4. Summary of dissolved oxygen, nutrient, and pH percent load reduction data collected from reviewed TMDL reports. ................................................. 30
Table 4.5. Summary of toxics nonpoint reduction data collected from reviewed TMDL reports. ................................................................................................. 30
Table 4.6. Summary of shade deficit data collected from reviewed TMDL reports. ....... 31
Table 7.1. Load allocations assigned by the Walla Walla TMDLs. ................................. 63
Table 7.2. Turbidity and DDT targets for the Lower Yakima River, tributaries, and irrigation waterways. ...................................................................................... 69
Table 7.3. Restoration targets and percent reductions needed to meet fecal coliform water quality standards at the Dungeness River and Bay sites. ...................... 74
Table 7.4. Load allocations and reductions required for fecal coliform in the Samish River and tributaries. ....................................................................................... 80
Table 7.5. Load allocations and reductions required for fecal coliform in tributaries to Samish Bay. ................................................................................................. 81
Table 8.1. Pollutant categories associated with nonpoint pollution from agricultural areas. ................................................................................................................ 84
Table 8.2. Literature from Washington relating to nonpoint pollution from agricultural areas. ................................................................................................................ 85
Table 8.3. Pollutant categories associated with nonpoint pollution from urban areas. .... 88
Table 8.4. Example of literature from Washington relating to nonpoint pollution from urban and residential areas. ..................................................................... 89
Table 8.5. Pollutant categories associated with nonpoint pollution from hydromodification. .......................................................................................... 94
Table 8.6. Examples of literature from Washington relating to nonpoint pollution from hydromodification. .................................................................................. 94
Table 8.7. Pollutant categories associated with nonpoint pollution from marine/boating areas. ....................................................................................... 96
Table 8.8. Example of literature from Washington on nonpoint pollution from marina/ boating areas. ................................................................................................... 96
Table 8.9. Pollutant categories associated with nonpoint pollution from forested areas. 97
Table 8.10. Examples of literature from Washington on nonpoint pollution from forested areas. ................................................................................................ 97

Page 8
Table 8.11. Pollutant categories associated with nonpoint pollution from atmospheric deposition. ..................................................................................................... 99
Table 8.12. Examples of literature from Washington relating to nonpoint pollution from atmospheric deposition. ........................................................................ 99

Page 9
Abstract The Washington State Department of Ecology (Ecology) is in the process of updating the document Washington's Water Quality Management Plan to Control Nonpoint Source Pollution. This document, also called the Nonpoint Plan, meets the requirements of Section 319 of the federal Clean Water Act and the Coastal Zone Act Reauthorization Amendments. To support development of the Nonpoint Plan, Ecology conducted a study of existing information regarding nonpoint source (NPS) pollution in Washington. The objective of this study was to research and document the current known extent of NPS pollution, evaluate the land uses and human activities that can generate NPS pollution, and find evidence of the linkage between land uses, human activities, and NPS pollution in Washington. To accomplish this, this study evaluated technical reports and other information sources produced since 2005. The study employed several distinct areas of research: • A review of existing U.S. Environmental Protection Agency guidance. • A review and summary of recent research on NPS pollution relevant to Washington State. • Compilation of calculated NPS load reduction targets in 49 Total Maximum Daily Load
(TMDL) studies conducted in Washington since 2005. • An exploratory analysis of TMDL load allocations and associated land uses using Geographic
Information Systems. • An evaluation of Section 319 grants used for NPS pollution control. • Four case studies in data-rich watersheds: Walla Walla River, Lower Yakima River, Dungeness
River and Bay, and Samish Bay. Results of these areas of analysis were synthesized to draw conclusions for different categories of nonpoint pollution sources, including agriculture, urban and residential areas, hydromodification, marinas and boating, forests, atmospheric deposition, and natural sources. The study found that NPS pollution sources are widespread in Washington and cause a variety of water pollution problems. Application of best management practices can help reduce these pollution impacts.

Page 10
Acknowledgements The authors of this report wish to thank the following people for their contributions to this study:
• John Eliasson, Stuart Glasoe, and Lynn Schneider, Washington State Department of Health
• Emily Derenne, Skagit County Public Works
• Curtis DeGasperi, King County
• Robert Black and Anthony Paulson, U.S. Geological Survey
• Washington State Department of Ecology staff: o Will Kendra – Overall project supervision
o Helen Bresler and Ben Rau – Water Quality Program clients
o Debby Sargeant – Technical peer review
o Dustin Bilhimer, Michael Kuttel, Jr., and Ralph Svrjcek – Water Quality Program Regional Staff review
o Jean Maust – Project Work Plan and Report formatting and editing
o Joan LeTourneau – Project Report formatting and editing
o Kyle Graunke – Original project lead
o Others who provided data and information:
Pat Bailey Kurt Baumgarten Gregory Bohn Scott Collyard Deborah Cornett Karol Erickson Alissa Ferrell Michael Hepp Steve Hood Amy Jankowiak William Kammin Mak Kaufman Ken Koch Andrew Kolosseus Teizeen Mohamedali Laurie Morgan Dale Norton Marc Pacifico Sheila Pendleton-Orme
Mindy Roberts Donna Smith Maylee Stevenson Nancy Winters Biniam Zelelow

Page 11
Executive Summary
Introduction Pollutants that contaminate water are classified into two categories:
• Point source pollution describes pollutant sources that are regulated under the federal National Pollutant Discharge Elimination System (NPDES) permit program.
• Nonpoint source (NPS) pollution refers to all other pollutant sources that are not regulated by a permit. These are sometimes described as diffuse sources, although at times they can be concentrated into discharges through pipes. NPS pollution generally results from land runoff, direct release, precipitation, atmospheric deposition, drainage, seepage, or hydrologic modification.
The federal NPDES program has been in place for over 40 years, and great advances have been made in controlling point sources. However, reducing NPS pollution continues to be a challenge. To address this challenge, the Washington State Department of Ecology (Ecology) periodically develops and publishes its Nonpoint Plan, whose official name is Washington's Water Quality Management Plan to Control Nonpoint Source Pollution. The Nonpoint Plan meets the requirements of the federal Clean Water Act and Coastal Zone Management Act. Ecology last published its Nonpoint Plan in 2005 and is currently developing a new Nonpoint Plan that will take a fresh look at Washington State’s NPS pollution issues and solutions. To support an updated Nonpoint Plan, Ecology conducted a study of the State’s NPS pollution problem based on recent studies and research. The objective of this study was to summarize and characterize the State’s NPS pollution. This report attempts to answer the question: What kind of NPS pollution problems exist in Washington, as shown by our studies of pollution sources and by the results of the work to fix the problems? The most recent available data and information relevant to NPS pollution in Washington were gathered and synthesized for this assessment. The study focused primarily on information collected since 2005. However, it also included older scientific literature that is still relevant and case studies for watersheds where NPS pollution cleanup began before 2005 but is still continuing. NPS pollution is a globally recognized problem. Extensive guidance is available at the national level from the U.S. Environmental Protection Agency (EPA) and other resources. EPA reports NPS pollution in several categories: • Resource Extraction and Abandoned Mine Drainage • Agriculture • Forestry • Hydromodification1 • Marinas and Boating • Roads, Highways, and Bridges • Urban Areas 1 See glossary in Appendix D for a definition.

Page 12
• Wetland and Riparian Management • Natural and Wildlife Sources • Atmospheric Deposition Under Section 303(d) of the Clean Water Act, water bodies that are not meeting state water quality standards are listed as impaired. Nationwide, the most common causes of impairment are: • Pathogens • Toxic metals • Nutrients • Organic enrichment/oxygen depletion • Sediment and turbidity • PCBs, pesticides, and other toxic organic compounds • pH • Temperature Nationally, EPA identifies agriculture and hydromodification as the most common sources of impairment.
Literature Summary As part of this study, over 100 documents and sources were reviewed from federal, state, and academic literature. Short annotations were provided for 45 references. Major studies that documented water quality problems caused in part by nonpoint pollution in Washington included the following topics: • Nitrogen loading/low dissolved oxygen in Puget Sound. • Toxic chemical loading in Puget Sound. • Nitrate contamination of groundwater. • Mercury trend monitoring in lakes. • Pesticide loading in agricultural areas. • Targeted monitoring/research in bacteria-impaired waters.
TMDL Load Allocations and GIS mapping A Total Maximum Daily Load (TMDL) study determines a water body’s loading capacity, which is the amount of a given pollutant that a water body can receive and still meet water quality standards. Portions of the receiving water’s loading capacity are assigned to a particular source in either of two categories: • If the pollutant comes from a discrete (point) source subject to a National Pollutant Discharge
Elimination System (NPDES) permit, such as a municipal or industrial facility’s discharge pipe, that facility’s share of the loading capacity is called a wasteload allocation.
• The cumulative share of nonpoint source pollutant not subject to an NPDES permit is included in the load allocation.

Page 13
A TMDL is the sum of the wasteload and load allocations, any margin of safety, and any reserve capacity, which must be equal to or less than the loading capacity. Therefore, TMDL development includes the identification and quantification of NPS pollution. Most TMDLs also provide target NPS pollutant load reductions from observed conditions needed to meet the load allocation. Ecology collected data from 49 TMDL reports published 2005 and later. From these reports, 550 records with NPS load reduction data were found. In addition, shade reduction information from temperature TMDLs was obtained. Of the non-temperature studies, the majority addressed bacteria impairment, while 2 addressed turbidity, 5 addressed toxics, and 7 addressed dissolved oxygen, pH, or nutrient impairments. Of the sites with identified target reductions, over one-third of all targets required more than 50% reduction during the wet season, while about one-half of all targets required more than 50% reduction during the dry season. Temperature TMDLs found widespread and significant shade deficits. The proportion of load reductions from different parameters varied by region, but overall NPS pollution was identified in all regions of the state, and large reductions were required in almost all locations. TMDL Load Allocation targets were mapped with Geographic Information Systems (GIS) and superimposed on land-use maps. The percent of various land-use categories in catchments holding the compliance point were calculated. This exercise demonstrated the unique combinations of land uses associated with impairments. In general, watersheds with nonpoint impairments east of the Cascades tended to show larger areas of agriculture, while areas in the central Puget Sound region showed larger areas of urban land use. However, specific watersheds had their own footprint of land uses and NPS pollutant reduction targets.
Section 319 Grants As part of EPA’s Nonpoint Source Management Program, EPA provides Section 319 grant funding, which in Washington is distributed by Ecology. A total of 109 projects that had funded best management practices (BMPs) to control NPS pollution since 2005 were reviewed to assess the nonpoint sources that applicants identified. Over three-quarters of projects addressed agricultural sources, while over one-half addressed hydromodification. About one quarter of the projects addressed urban and stormwater sources, and the remaining sources were addressed by a smaller fraction of projects. The predominance of agriculture sources is consistent with Section 319 grants nationwide, although nationally, urban sources are the second most common and hydromodification the third. Regionally, agriculture and hydromodification receive the most funding across the state, although urban sources represent a higher fraction of funding for the central and north Puget Sound regions.

Page 14
Case Studies Four case studies were reviewed to illustrate the identification and quantification on NPS pollution, and the implementation of BMPs to achieve NPS load reductions. The evaluated watersheds were: • Walla Walla River • Lower Yakima River • Dungeness River and Bay • Samish Bay In the Walla Walla, Ecology completed TMDL studies in 2006 and 2007 to address impairments for temperature, dissolved oxygen, pesticides, PCBs, and fecal coliform bacteria. Contributing land uses include agriculture, forestry, and urban and residential areas. Nonpoint sources included reduced stream shade, altered channel morphology, high nutrient loads, soil erosion, livestock and manure application, septic systems, and urban and residential runoff. BMPs included riparian restoration, erosion control, fencing and off-stream water sources, and education and outreach. In the Lower Yakima River, Ecology completed a TMDL study in 1998, and conducted effectiveness monitoring in 2006 and 2009. Nonpoint pollutant sources included sediment and pesticides from erosive agricultural practices. Pesticide loading was predominantly from historic applications of chemicals now mostly banned and was associated with sediment loading from irrigation practices. BMPs included replacing furrow and rill irrigation with sprinklers and drip irrigation, constructing settling ponds and vegetative buffers, lining and piping irrigation ditches and drains, and practicing other erosion control methods. In the Dungeness River and Bay, tributaries were listed as impaired for bacteria. Because of high bacteria levels, the Bay was closed to shellfish harvest in the 1990s. Ecology completed TMDL studies in 2004 and distributed multiple grants for BMP implementation. Bacteria sources included failing septic systems, domestic pet waste, and livestock and other animal waste. BMPs included decommissioning septic systems, individual on-farm BMPs, piping irrigation ditches, installing pet waste stations, and education and outreach. Samish Bay was closed to shellfish harvest due to bacterial contamination in 1994 and again in 2003 and 2008. Ecology completed a TMDL study in 2009. Contributing land uses included residential, agricultural, and marinas/boating areas. Sources included waterfowl and wildlife, failing septic systems, livestock, domestic pet waste, and human waste from boating and other recreation. BMPs included septic inspections and compliance, fencing and off-stream water facilities, pet waste stations, and public toilet facilities.
Discussion The results of this study’s analysis were summarized and characterized using seven nonpoint source categories. Results show that nonpoint pollution sources cause water quality impairment widely in Washington. However, different regions of the state may experience unique conditions of impaired water quality, including different proportions of land-use activities that contribute to nonpoint pollution problems.

Page 15
NPS pollution categories associated with agricultural areas included bacteria, sediment, pesticides, nutrients and other impairments of dissolved oxygen and pH, and loss of riparian shade. Features of agricultural activities that can impact water quality—when improperly or insufficiently managed—include runoff from livestock operations or direct access of livestock to waterways, runoff from manure and nutrient application to fields, erosion and runoff from irrigated and dryland agricultural fields; and erosion and runoff of legacy pesticides. In general, livestock and manure management problems occur statewide. Pollutants from field crops are also found statewide, although higher precipitation west of the Cascade Mountains contributes to stormwater runoff problems. Irrigation of erosive soils can contribute to runoff of sediments and legacy pesticides. Nitrate contamination of groundwater can occur where agricultural practices release nitrates to the soil over vulnerable sub-surface hydrogeology. Ecology over the last few years has expanded the regulation of urban stormwater sources under NPDES permits. However, large areas of urban and residential development are still sources of NPS pollution, especially in the Puget Sound region, but potentially anywhere residential development exists. Urban stormwater can contribute bacteria, sediments, toxic chemicals, nutrients, and petroleum hydrocarbons. Categories of urban and residential sources include impervious surfaces and transportation systems, onsite septic systems, landscaping, construction, and domestic animals. Hydromodification is widespread in Washington State and can both generate pollutants and directly impact aquatic habitat. Types of hydromodification include: dams and weirs; channelization, bank armoring, and levees; bank excavation and loss of riparian vegetation; and streambank and shoreline erosion. Hydromodification can affect a variety of pollutants: loss of riparian shade; sediment and turbidity from erosion; and pollutants carried by overland flow due to the loss of riparian buffer areas. Marinas and boating can produce intense NPS pollution in localized areas. Some marinas may be covered by Boatyard or Municipal Stormwater NPDES General Permits, but widespread NPS pollution sources can still occur. These can be particularly concentrated in popular boating areas and on summer holiday weekends. Pollutants can include: bacteria from direct sewage discharge; toxics from paints, solvents, lubricants, and sealers; nutrients from sewage and cleaning; and petroleum hydrocarbons from engine and bilge water. Forests cover about one-half of Washington’s land area, and these areas are particularly significant for salmonids and other aquatic life. NPS pollutants from forest practices can result from hydrologic modification and loss of riparian vegetation and can include sediment and nutrients. The state’s Forest Practice Rules are the principal mechanism for preventing NPS pollution from forest practices. However, pollutants may still be discharged from unregulated forest activities and from forest conversion. Atmospheric deposition is another potential source of nonpoint pollution. Nutrients and toxics are the most common pollutants, and generally occur from burning or wind-borne soil erosion. Although sources may originate from within Washington State, regional and global sources can reach the state at times.

Page 16
Natural sources also affect water quality, through natural geologic instability, geomorphology, and wildlife and waterfowl. Natural is defined in the water quality standards as “water quality that was present before any human-caused pollution.” Natural sources may be difficult to distinguish, especially where human actions have worsened a natural condition. However, studies have identified natural sources in a variety of situations, such as high summer temperatures, erosion, nitrogen fixation, or natural wildfowl concentrations. TMDL analyses take natural conditions into account and allow for small human contributions that do not significantly add to degradation of water quality. Washington’s 2012 303(d) list shows over 2,600 impairments of water criteria. Most of these listings are for temperature, bacteria, dissolved oxygen, and pH. Nutrients, toxics, and sediments are also represented. Historically TMDL studies have found that NPS pollution often represents a significant proportion of loading contributing to impairments. Anecdotal information from experienced Ecology staff suggests that past TMDLs may have been more focused on point sources, meaning that future TMDLs are likely to represent impairments with similar or greater contributions from nonpoint sources. Therefore, it is likely that these listings represent a large future workload for NPS pollution control.
Conclusions and Recommendations Through multiple lines of analysis, this study has documented the prevalence and characteristics of NPS pollution. Although progress has been made to reduce NPS pollution, the problem is still widespread. NPS pollution is continuing to endanger our public health, natural resources, and aquatic ecosystems. A variety of land uses and human activities are increasing sediment, bacteria, nutrients, temperature, and toxic compounds; decreasing dissolved oxygen; and driving pH outside a safe range. Nonpoint pollution has been documented to occur from agricultural activities, urban and residential development, and hydromodification. Marinas and boating areas, forest practices, and atmospheric deposition can also be significant sources in areas of intense activity or sensitive receiving waters. The major nonpoint issues in Washington State include:
• Temperature problems, sediment erosion, and nutrient and pesticide loading from irrigated and dryland agricultural activities.
• Elevated bacteria levels in rivers and streams and in coastal nearshore areas from mixed land-use activities, including livestock, manure spreading, onsite septic systems, domestic animals, and birds and other wildlife.
• Contaminants associated with urban development, which creates diverse pollution impacts, especially in the Puget Sound region during the wet season. Most categories of contaminants can be present, including bacteria, nutrients, toxic compounds, and sediment.
• Temperature and sediment problems from hydromodification and forest activities, both high up in the watershed and in lowland areas. These can harm freshwater salmonid habitat.
• Nitrate contamination of groundwater from agricultural-related activities.

Page 17
Recommendations from this study include:
• Improve the identification, quantification, and prioritization of nonpoint sources as part of TMDLs.
• Explore GIS techniques that link land uses and BMPs to pollutant sources.
• Consider improving reporting under state and federal grants to provide more accurate and consistent information about nonpoint sources.
• Consider improving the tracking of water quality enforcement actions to categorize permit-related or nonpoint sources.
• Continue studying the effectiveness of TMDLs and BMP implementation in controlling nonpoint pollution.
• Provide clearer and more organized and centralized guidance on BMPs to address land-use activities and pollutant sources found in Washington.
• Explore improving communication with the public and regulated community about NPS pollution.

Page 18
This page is purposely left blank

Page 19
1. Introduction
Problem Description In 2000, the Washington State Department of Ecology (Ecology) developed a Water Quality Management Plan (Nonpoint Plan) as part of the agency’s work to control nonpoint source (NPS) pollution. The purpose of this plan is to protect our natural resources from nonpoint pollution by identifying and proposing strategies to reduce Washington’s nonpoint pollution sources. The plan meets the state’s requirement to have nonpoint pollution control plans under (1) the federal Coastal Zone Management Act for the National Oceanic and Atmospheric Administration (NOAA) and (2) Section 319 of the federal Clean Water Act for the U.S. Environmental Protection Agency (EPA). The Nonpoint Plan was last updated in 2005 (Ecology 2005). Ecology plans to issue a new Nonpoint Plan which will take a fresh look at the state’s NPS pollution issues and solutions. To support developing an updated Nonpoint Plan, Ecology’s Water Quality Program requested a study that describes the state’s nonpoint pollution problem based on recent nonpoint studies and research. The Water Quality Program submitted a work request to Ecology’s Environmental Assessment Program to conduct this study. This report presents the results of that study.
Study Objective and Approach The objective of this study was to provide a detailed report summarizing and characterizing the state’s nonpoint pollution to support the updated Nonpoint Plan. This report attempts to answer the question: What kind of NPS pollution problems exist in Washington, as shown by our studies of pollution sources and by the results of the work to fix the problems? To meet this objective, this study researched and documented: • Existing guidance and research about nonpoint sources nationally and in Washington. • Studies and monitoring that have identified and quantified the current known extent and amount
of NPS pollution. Total Maximum Daily Load (TMDL) studies were the major sources for this information.
• Land uses and human activities that can generate nonpoint pollution. • The linkage between land uses, human activities, and NPS pollution in Washington. • Best management practices (BMPs) that have been shown to reduce NPS pollution. The most recent available information relevant to NPS pollution in Washington were gathered and synthesized for this assessment. Because the last Nonpoint Plan was published in 2005, this study focused primarily on synthesizing scientific data and information collected since 2005. Although the literature search focused on recent studies, the study included scientific literature on NPS pollution published before 2005 that was considered especially relevant. Also, several case studies were evaluated for watersheds where nonpoint pollution cleanup began before 2005 but is still continuing.

Page 20
To understand sources of nonpoint pollution, it helps to see them as part of a chain of actions:
1. Problem identification: Water bodies with pollution problems are identified, either by measurements of contaminant levels or by the observed impacts on natural resources such as salmon or shellfish.
2. Source identification: Nonpoint pollution sources are identified through scientific study and field investigation.
3. BMP implementation: Infrastructure, processes, and plans are put in place to reduce NPS pollution, often through federal and state loans and grants.
4. Effectiveness monitoring: The success of BMPs is evaluated by studies of BMPs, the quality of affected water bodies, or the health of the affected natural resources.
This chain of actions allows us to identify the causes of an NPS pollution problem if we see the impact, identify the sources, apply corrective actions, and see improvement from the corrective actions. This report is organized to present several areas of analysis, and then synthesize the results into overall conclusions and recommendations: • Chapter 2: A definition of NPS pollution and how EPA addresses the problem nationally. • Chapter 3: Literature that describes NPS pollution in Washington. • Chapter 4: Levels of NPS pollution loading quantified by TMDL studies. • Chapter 5: Geography of NPS pollution allocations in TMDL studies and the land uses
associated with those allocations. • Chapter 6: Sources of NPS pollution identified for BMP implementation through Section 319
grants awarded by Ecology. • Chapter 7: Case studies for four watersheds that have been the long-term focus of NPS pollution
studies and BMP implementation. These studies demonstrate in greater detail the linkages from nonpoint source identification to quantification to BMP implementation.
• Chapter 8: Synthesis of the areas of analysis, organized by the most prevalent land uses and human activities.
Several areas were analyzed but not included in this report: • Ecology’s Enforcement Docket was reviewed to evaluate enforcement of Nonpoint Source
Pollution. The Docket is not categorized by point/nonpoint or by type of source. Therefore, an accurate analysis was not possible within the scope of this project.
• Other grants that address NPS pollution besides Section 319 grants were evaluated. However, those grants did not clearly categorize grant projects by land use or potential sources, which precluded a thorough and accurate analysis.
• More complex methods of GIS analysis were investigated, but limitation of the available geodatabases and time for this study prevented further work.

Page 21
2. Background on Nonpoint Pollution
Definitions of Nonpoint Source Pollution Nonpoint source pollution is a globally recognized problem. The United Nations Environmental Program (UNEP 2008) defines NPS as:
Pollution sources which are diffuse and do not have a single point of origin or are not introduced into a receiving stream from a specific outlet. The commonly used categories for non-point sources are: agriculture, forestry, urban, mining, construction, dams and channels, land disposal, and saltwater intrusion.
One example of the global attention to NPS pollution is the guidance, Control of water pollution from agriculture, published by the Food and Agriculture Organization of the United Nations (FAO 1996). In the United States, the term nonpoint is part of the federal Clean Water Act. EPA provides the following definition2:
Nonpoint source pollution generally results from land runoff, precipitation, atmospheric deposition, drainage, seepage or hydrologic modification. The term "nonpoint source" is defined to mean any source of water pollution that does not meet the legal definition of "point source" in section 502(14) of the Clean Water Act…Unlike pollution from industrial and sewage treatment plants, nonpoint source (NPS) pollution comes from many diffuse sources.
EPA provides examples of nonpoint pollution:
• Excess fertilizers, herbicides, and insecticides from agricultural lands and residential areas. • Oil, grease, and toxic chemicals from urban runoff and energy production. • Sediment from improperly managed construction sites, crop and forest lands, and eroding
streambanks. • Salt from irrigation practices and acid drainage from abandoned mines. • Bacteria and nutrients from livestock, pet wastes, and faulty septic systems. • Atmospheric deposition and hydromodification. NOAA has applied the EPA definition of NPS pollution to their Coastal Nonpoint Pollution Control Program as part of the Coastal Zone Act Reauthorization Amendments (CZARA).3
2 http://water.epa.gov/polwaste/nps/whatis.cfm 3 http://coastalmanagement.noaa.gov/nonpoint/welcome.html

Page 22
Nonpoint Source Pollution Guidance Numerous documents that demonstrate the importance of NPS pollution are available nationally. EPA provides extensive guidance on NPS pollution control. These documents address sources such as marinas and recreational boating, agriculture, forestry, urban areas, and hydromodification (http://water.epa.gov/polwaste/nps/guidance.cfm). Other national resources for NPS pollution control include:
• Guidance for implementing NPS controls under CZARA (http://coastalmanagement.noaa.gov/nonpoint/guide.html).
• Guidance for monitoring NPS pollution (http://water.epa.gov/polwaste/nps/pubs.cfm#monitoring and http://water.epa.gov/type/watersheds/monitoring/).
• Other EPA publications on NPS pollution (http://water.epa.gov/polwaste/nps/pubs.cfm).
• EPA’s Nonpoint Source News-Notes bulletin, which has been published since 1989 (http://water.epa.gov/polwaste/nps/outreach/NewsNotes_index.cfm).
• EPA’s NPSINFO e-Forum Resource Center (http://water.epa.gov/polwaste/nps/outreach/npsinfo_index.cfm).
• North Carolina State University Water Quality Group (www.bae.ncsu.edu/programs/extension/wqg/).
Summary of Nonpoint Source Pollution Impacts and Sources EPA has identified eight categories of NPS pollution4:
• Abandoned Mine Drainage o Acid mine drainage (the most prevalent) o Alkaline mine drainage (this typically occurs when calcite or dolomite is present) o Metal mine drainage (high levels of lead or other metals)
• Agriculture o Poorly located or managed animal feeding operations o Overgrazing o Plowing too often or at the wrong time o Improper, excessive, or poorly timed application of pesticides, irrigation water, and fertilizer
• Forestry o Removal of streamside vegetation o Road construction and use (the primary source of sediment pollution) o Timber harvesting o Mechanical preparation for the planting of trees
4 http://water.epa.gov/polwaste/nps/categories.cfm

Page 23
• Hydromodification and Habitat Alteration o Channelization and channel modification o Dams o Streambank and shoreline erosion
• Marinas and Boating o Boat cleaning o Fueling operations o Marine sewage discharge o Stormwater runoff from parking lots and hull maintenance and repair areas
• Roads, Highways, and Bridges o Polluted runoff o Construction o Sediment, heavy metals, oils, and other toxic substances and debris
• Urban Areas o Hydrologic alteration o Sediment o Oil, grease, and toxic chemicals from motor vehicles o Pesticides and nutrients from lawns and gardens o Viruses, bacteria, and nutrients from pet waste and failing septic systems o Road salts o Heavy metals from roof shingles, motor vehicles, and other sources o Thermal pollution from dark, impervious surfaces such as streets and rooftops
• Wetland and Riparian Management o Natural filters of nonpoint source pollutants, including sediment, nutrients, pathogens, and
metals, between uplands and adjacent water bodies Under Section 303(d) of the Clean Water Act, water bodies that are not meeting state water quality standards are listed as impaired. Nationwide, the most common causes of impairment are: • Pathogens • Toxic metals • Nutrients • Organic enrichment/oxygen depletion • Sediment and turbidity • Polychlorinated biphenyls (PCBs), pesticides, and other toxic organic compounds • pH • Temperature Understanding the nation-wide distribution of NPS pollution provides some context for evaluating NPS pollution in Washington State. Figure 2.1 shows the top 10 sources of impairment identified by the States in the 2004 National Water Quality Inventory: Report to Congress (EPA 2009). The most widespread sources of impairment were agriculture and hydromodification.

Page 24
Similarly, in an earlier Water Quality Inventory, EPA identified agriculture as a major source of NPS pollution5:
In the 2000 National Water Quality Inventory, states reported that agricultural nonpoint source (NPS) pollution was the leading source of water quality impacts on surveyed rivers and lakes, the second largest source of impairments to wetlands, and a major contributor to contamination of surveyed estuaries and ground water.
EPA guidance and data demonstrate the awareness at the national level that NPS pollution is a serious and widespread problem. However, NPS pollution problems and solutions vary widely across the United States. NPS pollution problems in Washington State have their unique characteristics, shaped by our economy and environment. Extensive information about these problems is available from numerous studies and through the analysis of existing data. These will be explored in the rest of this report.
Figure 2.1. Top 10 sources of impairment in assessed rivers and streams as reported by the States.
Figure source: EPA (2009).
5 http://water.epa.gov/polwaste/nps/agriculture.cfm
Page 25
3. Literature Summary of Nonpoint Pollution Studies
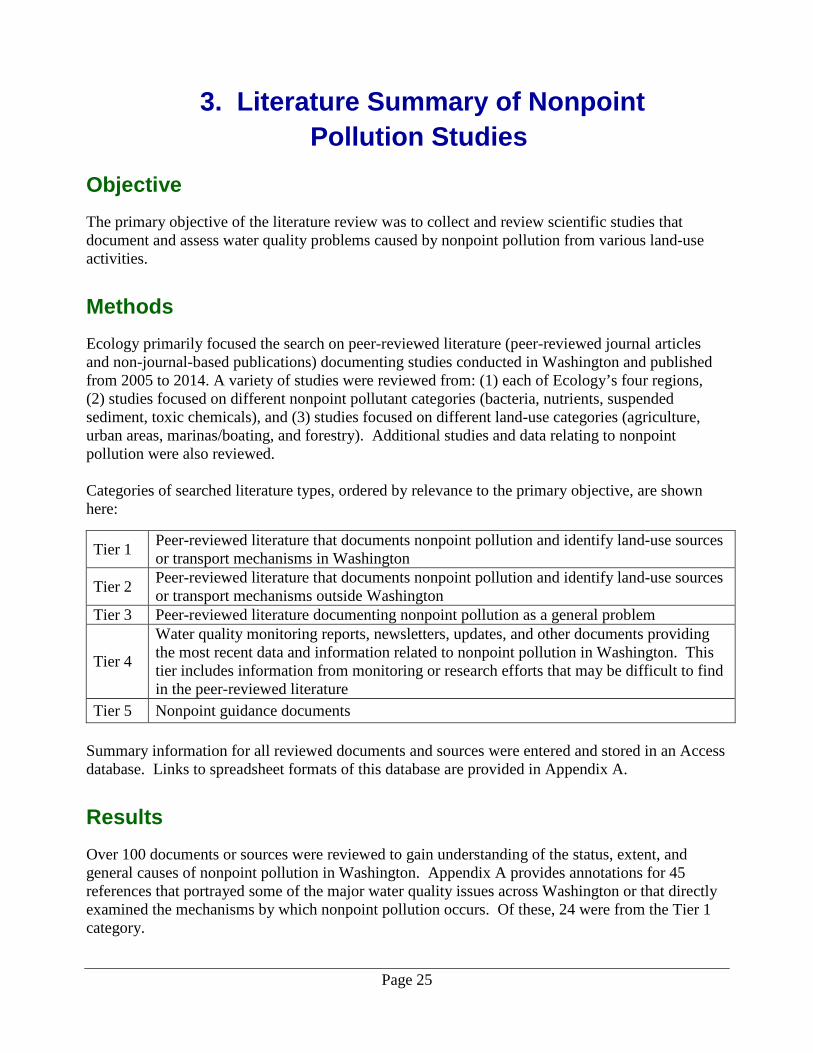
Objective The primary objective of the literature review was to collect and review scientific studies that document and assess water quality problems caused by nonpoint pollution from various land-use activities.
Methods Ecology primarily focused the search on peer-reviewed literature (peer-reviewed journal articles and non-journal-based publications) documenting studies conducted in Washington and published from 2005 to 2014. A variety of studies were reviewed from: (1) each of Ecology’s four regions, (2) studies focused on different nonpoint pollutant categories (bacteria, nutrients, suspended sediment, toxic chemicals), and (3) studies focused on different land-use categories (agriculture, urban areas, marinas/boating, and forestry). Additional studies and data relating to nonpoint pollution were also reviewed. Categories of searched literature types, ordered by relevance to the primary objective, are shown here:
Tier 1 Peer-reviewed literature that documents nonpoint pollution and identify land-use sources or transport mechanisms in Washington
Tier 2 Peer-reviewed literature that documents nonpoint pollution and identify land-use sources or transport mechanisms outside Washington
Tier 3 Peer-reviewed literature documenting nonpoint pollution as a general problem
Tier 4
Water quality monitoring reports, newsletters, updates, and other documents providing the most recent data and information related to nonpoint pollution in Washington. This tier includes information from monitoring or research efforts that may be difficult to find in the peer-reviewed literature
Tier 5 Nonpoint guidance documents Summary information for all reviewed documents and sources were entered and stored in an Access database. Links to spreadsheet formats of this database are provided in Appendix A.
Results Over 100 documents or sources were reviewed to gain understanding of the status, extent, and general causes of nonpoint pollution in Washington. Appendix A provides annotations for 45 references that portrayed some of the major water quality issues across Washington or that directly examined the mechanisms by which nonpoint pollution occurs. Of these, 24 were from the Tier 1 category.

Page 26
A sample of our literature sources from the peer-reviewed literature include: • Ecology publications (48 references). • Academic peer-reviewed journal articles (34). • U.S. Geological Survey (USGS) publications (14). • U.S. Government Accountability Office (GAO) reports (2). • Puget Sound Partnership studies (2). • Washington State County monitoring reports (2). • Washington State Tribal monitoring reports (2). • EPA nonpoint guidance (1). • Pew Oceans Commission report (1). Major studies that documented water quality problems caused in part by nonpoint pollution in Washington included the following topics: • Nitrogen loading/low dissolved oxygen in Puget Sound. • Toxic chemical loading in Puget Sound. • Nitrate contamination of groundwater. • Mercury trend monitoring in lakes. • Pesticide loading in agricultural areas. • Targeted monitoring/research in bacteria-impaired waters. Chapter 8 of this report is used to assess and synthesize the wealth of information provided from the literature review in conjunction with findings from other tracks of this study.

Page 27
4. TMDL Load Allocations
Objective During TMDL development, a load capacity is typically determined for the assessed water. This value represents “the greatest amount of a pollutant that a water can assimilate and still meet water quality standards”6. The load capacity is allocated among point and nonpoint sources. The point source contribution to the load capacity is the wasteload allocation. The nonpoint source contribution to the load capacity is the load allocation. Load allocations are often expressed in terms of the amount (%) of pollutant reduction needed for the assessed water to attain water quality standards. The objective of this track was to synthesize and assess load allocation data from TMDL submittal reports published from 2005 through the present. These data have been collected and quantified in a systematic manner through the TMDL process and provide quantitative information regarding the recent known status and extent of nonpoint pollution across Washington. These data do not reflect the entire extent of nonpoint pollution in Washington, only the extent to which nonpoint pollution has been identified and quantified through the TMDL process during the period of 2005 through the present.
Methods A list of TMDLs approved by EPA and published in 2005 or later is shown in Appendix B. Information collected from each report was entered into a TMDL database created for this project. A link to the spreadsheet format of this database and a description of the information collected is provided in Appendix C. The collected information was informally verified to ensure the following was as accurate as possible:
• Data entry (no entry errors). • Distinction between “0” and “NA” load allocation and percent reduction values. • Percent reduction data collected were reflective of nonpoint sources (distinguishable from
wasteload and total percent reduction values). • Critical condition for each record. • Latitude-Longitude/site locations for each record.
During TMDL development, seasonal variations and critical conditions are taken into consideration to ensure that water quality is protected during the most vulnerable conditions7. In cases where water quality impairment varies with season, different load allocations may be assigned under different seasonal conditions. For this project, load allocation and percent reduction data were grouped by their corresponding critical condition. Because critical condition information was
6 http://water.epa.gov/lawsregs/lawsguidance/cwa/tmdl/glossary.cfm#l 7 http://water.epa.gov/lawsregs/lawsguidance/cwa/tmdl/decapd.cfm

Page 28
sometimes reported differently among TMDL reports, this information was binned into two categories: Wet Season (November–June) and Dry Season (July–October). Load allocation data were summarized in units of percent reduction needed to eliminate nonpoint pollution at that site. Percent reduction data were summarized by Ecology’s four regions, impairment category, and critical condition. Definitions are shown here:
Reduction > 0 Impaired
Reduction = 0 Not impaired (no reduction needed)
Reduction = NA (-) No nonpoint reduction data were reported or calculated
N Number of sites with a true reduction value (non-NA value)
% Sites impaired Proportion of sites that were impaired. Calculated as: [Sites impaired] = N – [Number of non-impaired sites] / N * 100
Min, Med, Max Summary statistics (minimum, median, and maximum values) of site percent reductions for each major water body. Excludes sites that were not impaired
Results Data were collected from 49 TMDL reports published in 2005 or later (Table 4.1). Excluding temperature data, 640 records—sites where a load allocation was established—were synthesized from the 49 reports. Of the 640 records, 550 records contained percent load reduction data (the data type summarized in this study), and 601 records contained latitude-longitude data, which were used to map the load reduction data. Data collected from the TMDL reports are summarized by impairment category, region, and critical condition (Tables 4.2 through 4.6).
Table 4.1. Summary of TMDL reports by region and parameter addressed.
Region TOTAL Bacteria
Dissolved Oxygen,
Nutrients, pH Toxics Turbidity Temperature2
Number of TMDL reports reviewed1
Central 9 3 2 3 0 2 Eastern 15 7 3 2 2 6 Northwest 16 9 2 0 0 7 Southwest 9 7 0 0 0 4
Total 49 26 7 5 2 19
Number of records (sites with established allocation or reduction values)
Central 102 46 13 43 0 - Eastern 261 185 11 29 36 - Northwest 160 139 21 0 0 - Southwest 117 117 0 0 0 -
Total 640 487 45 72 36 - 1Many TMDL reports were multi-parameter, so the number of addressed parameters may not add up to total. 2Shade allocation data are not summarized in this table.

Page 29
Table 4.2. Summary of bacteria percent load reduction data collected from reviewed TMDL reports.
Dashes indicate NA values (percent load reduction data were not reported or calculated). N= Number of sites with a true reduction value (non-NA value)
Table 4.3. Summary of turbidity load reduction data collected from reviewed TMDL reports. N= Number of sites with a true reduction value (non-NA value)
N % Sites Impaired Min Med Max N % Sites Impaired Min Med MaxCentral 45 Wenatchee River Basin 28 21 52 79 94 28 100 6 66 98Central 39 Wilson Creek 17 0 0 0 0 17 100 59 75 84Eastern 52 Colville National Forest 19 0 0 0 0 19 68 6 48 74Eastern 56 Hangman (Latah) Creek Watershed 24 88 10 65 92 24 92 10 66 92Eastern 55 Little Spokane River - - - - - 30 77 5 70 95Eastern 34 Palouse River 28 39 19 52 73 28 57 38 76 94Eastern 34 Palouse River, North Fork 14 50 21 47 79 14 29 36 76 92Eastern 34 Palouse River, South Fork 44 82 4 59 99 42 69 14 80 96Eastern 32 Walla Walla River 25 48 21 46 86 26 92 6 53 94Northwest 8 Bear-Evans Watershed 6 100 14 53 88 6 100 57 77 91Northwest 9 Fauntleroy Creek 1 100 - 48 - 1 100 0 80 -Northwest 1 Lake Whatcom 11 73 20 67 92 11 100 37 75 96Northwest 15 Liberty Bay Watershed 31 84 3 64 99 31 94 50 83 98Northwest 8 Little Bear Creek 3 100 88 89 91 3 100 95 95 97Northwest 3 Samish Bay 32 34 39 72 91 32 81 18 73 95Northwest 15 Sinclair and Dyes Inlets 17 82 25 73 93 17 59 34 60 97Northwest 5 Stillaguamish River 19 100 36 87 99 33 0 0 0 0Northwest 8 Swamp Creek 3 100 68 84 85 3 100 78 92 96Southwest 10 Clarks Creek 9 78 18 57 95 9 78 18 57 95Southwest 13 Henderson Inlet Watershed 28 71 10 59 96 28 57 2 46 95Southwest 11 Nisqually River Basin 34 76 9 43 94 34 76 9 50 94Southwest 14 Oakland Bay and Hammersley Inlet 9 0 0 0 0 9 100 36 72 93Southwest 10 Puyallup River Watershed 14 64 16 58 98 14 86 20 70 98Southwest 14 Totten, Eld, and Little Skookum Inlets 12 0 0 0 0 12 100 35 73 99Southwest 24 Willapa River 11 100 17 46 81 11 100 17 46 81
439 58 482 74
Percent Reduction NeededWet Season Dry Season
TOTAL
Region WRIA Water Body
N% Sites
Impaired Min Med Max N% Sites
Impaired Min Med Max
Eastern 56 Hangman (Latah) Creek Watershed
8 100 8 16 26 8 100 8 16 26
Eastern 55 Little Spokane River 21 100 10 60 95 28 0 0 0 029 100 36 22TOTAL
Region WRIA Water Body
Percent Reduction NeededWet Season Dry Season

Page 30
Table 4.4. Summary of dissolved oxygen, nutrient, and pH percent load reduction data collected from reviewed TMDL reports. Dashes indicate NA values (percent load reduction data were not reported or calculated). N= Number of sites with a true reduction value (non-NA value)
Table 4.5. Summary of toxics nonpoint reduction data collected from reviewed TMDL reports. N= Number of sites with a true reduction value (non-NA value)
* Mission Creek nonpoint reduction value includes reserve capacity
N% Sites
Impaired Min Med Max N% Sites
Impaired Min Med MaxCentral 45 Wenatchee River Basin 17 76 10 50 85 17 76 10 50 85Eastern 57 Newman Lake 1 100 - 42 - 1 100 - 42 -Eastern 54 Spokane River 3 100 20 36 40 3 100 26 50 50Eastern 32 Walla Walla River - - - - - 4 100 22 68 99Northwest 1 Lake Whatcom 13 100 2 26 71 13 100 2 26 71
34 88 38 89TOTAL
Region WRIA Water Body
Percent Reduction NeededWet Season Dry Season
N% Sites
Impaired Min Med MaxCentral 47 Chelan Lake 13 77 42 88 97Central 45 Mission Creek 5 80 69 95 98Central 49 Okanogan River 25 80 33 100 100Eastern 32 Walla Walla River 12 75 74 84 97Eastern 34 Palouse River 4 75 23 41 71
59 78TOTAL
Region WRIA Water Body
Percent Reduction NeededAnnual

Page 31
Table 4.6. Summary of shade deficit data collected from reviewed TMDL reports. Table does not include temperature TMDLs based on shade curve.
Region WRIA Water Body Stream Name Shade Deficit (%)
Min Med Max Central 38 Upper Naches River and Cowiche Creek Upper Naches River 1.78 13.67 21.40 Central 45 Wenatchee River Icicle Creek 9.48 20.42 63.17 Central 45 Wenatchee River Mission Creek 0.00 20.67 61.24 Central 45 Wenatchee River Nason Creek 0.58 28.24 71.27 Central 45 Wenatchee River Peshastin Creek 0.00 10.67 25.40 Central 45 Wenatchee River Wenatchee River -0.05 1.79 14.61 Eastern 32 Walla Walla River Mill Creek 0.00 22.00 53.00 Eastern 32 Walla Walla River Touchet River 4.00 36.00 72.00 Eastern 34 Palouse River Palouse River 0.00 9.00 26.00 Eastern 35 Tucannon River and Pataha Creek Pataha Creek -3.01 19.34 44.17 Eastern 35 Tucannon River and Pataha Creek Tucannon River 0.04 18.89 42.98 Eastern 55 Little Spokane River Little Spokane River 0.00 49.50 88.45 Eastern 56 Hangman (Latah) Creek Hangman Creek 7.23 26.82 42.92 Northwest 1 Whatcom Creek Whatcom Creek - - - Northwest 3 Lower Skagit River Carpenter Creek 4.00 66.90 78.90 Northwest 3 Lower Skagit River East Fork Nookachamps 38.70 45.05 52.00 Northwest 3 Lower Skagit River Fisher Creek 4.00 11.35 13.20 Northwest 3 Lower Skagit River Hansen Creek 24.00 35.20 43.50 Northwest 3 Lower Skagit River Lake Creek 3.60 13.85 75.50 Northwest 3 Lower Skagit River Nookachamps Creek 11.00 53.90 62.80 Northwest 5 Stillaguamish River Deer Creek 14.48 25.42 53.70 Northwest 5 Stillaguamish River North Fork Stillaguamish 0.00 22.06 58.57 Northwest 5 Stillaguamish River Pilchuck Creek 0.00 38.44 57.88 Northwest 5 Stillaguamish River South Fork Stillaguamish 4.82 24.80 61.76 Northwest 5 Stillaguamish River South Slough 11.70 23.23 46.50 Northwest 5 Stillaguamish River Stillaguamish River 2.62 16.40 52.08 Northwest 7 Snoqualmie River Snoqualmie River 10.52 24.74 44.45 Northwest 8 Bear-Evans Watershed Bear Creek 12.00 40.00 76.00 Northwest 8 Bear-Evans Watershed Cottage Lake Creek 20.00 34.00 65.00 Northwest 8 Bear-Evans Watershed Evans Creek 17.00 50.00 71.00 Northwest 9 Green River Green River 12.00 33.00 53.00 Northwest 9 Newaukum Creek Newaukum Creek 10.00 32.80 63.40 Southwest 13 Henderson Inlet Woodland Creek 0.00 8.00 79.00 Southwest 14 Totten, Eld, and Little Skookum Inlets Skookum Creek 5.00 40.00 50.00 Southwest 24 Willapa River Fork Creek 1.77 16.99 46.04 Southwest 24 Willapa River Willapa River 0.00 57.95 96.10
WRIA = Water Resource Inventory Area

Page 32
Bacteria impairment was a focus in 26 of the 49 TMDL reports occurring in all four regions, and the majority of records concerned bacteria (487 of 640 records; Table 4.1). Thus, the majority of percent reduction data addressed in our synthesis of TMDL reports concerned bacteria. The two turbidity TMDLs were from the Eastern region, and the five toxic chemical TMDLs were from the Central and Eastern regions. Phosphorus reduction was identified in the TMDL studies as the primary means for addressing impairments for the seven TMDLs addressing dissolved oxygen, nutrients, or pH. At a statewide level, load reductions were needed during both the wet and dry critical seasons for all impairment categories (Tables 4.2 through 4.5). For the amount of nonpoint reduction needed to attain water quality targets, over one-third of all targets required more than 50% reduction during the wet season; about one-half of all targets required more than 50% reduction during the dry season. When grouped by region, a similar outcome emerged: a large proportion of targets needed more than 50% reduction during both the wet and dry seasons (Figure 4.1).
Figure 4.1. Histogram plots showing the proportion of sites with load reduction targets (y axis) by the amount of reduction needed to attain water quality standards (x axis). Data are grouped by critical period and region. All impairment categories are included. Left-most bars represent no reduction needed.

Page 33
In the Central and Eastern Regions, the amount of bacteria reductions needed was greater during the dry season than during the wet season (Figure 4.2). In the Northwest and Southwest Regions, the amount of bacteria reductions needed was similar in the wet and dry seasons.
Figure 4.2. Histogram plots showing the proportion of sites with bacteria load reduction targets (y axis) by the amount of reduction needed to attain water quality targets (x axis). Data are grouped by critical period and region. Left-most bars represent no reduction needed. As for temperature, the Northwest Region had the greatest number of water bodies needing shade improvements (Table 4.6; Figure 4.3). In the Eastern Region, the Little Spokane and Touchet Rivers needed the greatest shade improvements. In the Southwest Region, the Willapa River needed the greatest shade improvements. The amount of load reductions needed is generally dependent on local watershed and site-specific characteristics, which are beyond the scope of this TMDL data synthesis. In addition, any evaluations are limited to the scope of TMDLs reviewed. This exercise does demonstrate, however, that in the 49 reviewed TMDLs, nonpoint sources of pollution were identified in all regions of the state. Additionally, where impairment was found to be caused by nonpoint sources, pollutant reductions greater than 50% were often needed to meet water quality targets.

Page 34
Figure 4.3. Shade increase needed for water bodies with shade impairments, summarized by region. Each point represents a single shade increase target.
Page 35
5. GIS Land Use Analysis
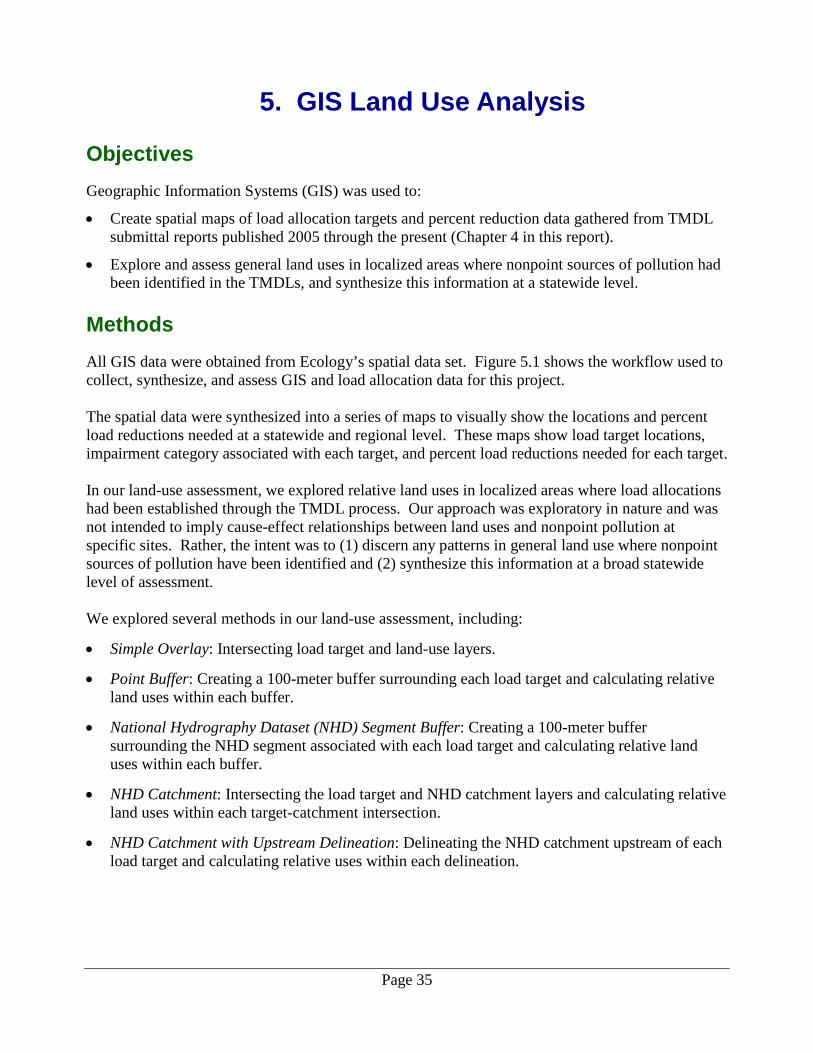
Objectives Geographic Information Systems (GIS) was used to:
• Create spatial maps of load allocation targets and percent reduction data gathered from TMDL submittal reports published 2005 through the present (Chapter 4 in this report).
• Explore and assess general land uses in localized areas where nonpoint sources of pollution had been identified in the TMDLs, and synthesize this information at a statewide level.
Methods All GIS data were obtained from Ecology’s spatial data set. Figure 5.1 shows the workflow used to collect, synthesize, and assess GIS and load allocation data for this project. The spatial data were synthesized into a series of maps to visually show the locations and percent load reductions needed at a statewide and regional level. These maps show load target locations, impairment category associated with each target, and percent load reductions needed for each target. In our land-use assessment, we explored relative land uses in localized areas where load allocations had been established through the TMDL process. Our approach was exploratory in nature and was not intended to imply cause-effect relationships between land uses and nonpoint pollution at specific sites. Rather, the intent was to (1) discern any patterns in general land use where nonpoint sources of pollution have been identified and (2) synthesize this information at a broad statewide level of assessment. We explored several methods in our land-use assessment, including:
• Simple Overlay: Intersecting load target and land-use layers.
• Point Buffer: Creating a 100-meter buffer surrounding each load target and calculating relative land uses within each buffer.
• National Hydrography Dataset (NHD) Segment Buffer: Creating a 100-meter buffer surrounding the NHD segment associated with each load target and calculating relative land uses within each buffer.
• NHD Catchment: Intersecting the load target and NHD catchment layers and calculating relative land uses within each target-catchment intersection.
• NHD Catchment with Upstream Delineation: Delineating the NHD catchment upstream of each load target and calculating relative uses within each delineation.

Page 36
Figure 5.1. Workflow diagram used to explore land uses in association with nonpoint reduction targets. EIM=Environmental Information Management database For our assessment, we used method 4 (NHD Catchment) because it provided balance between an oversimplified level of analysis (methods 1–3) and a more complex level of analysis in which additional time may be needed to research and refine a methodology (method 5). Limitations of our land-use assessment include: • Different sizes of catchments. • Arbitrary location of load allocation target points within intersecting catchments. • Multiple targets with one catchment, in some cases. • High number of land uses that were defined as Uncategorized in the land-use data set.

Page 37
Results Maps in Figures 5.2–5.11 show nonpoint target locations in the watersheds addressed by the TMDL studies, both statewide and by region. The maps also show the percent load reductions needed by critical period and impairment category. Relative land uses for the nonpoint target locations are shown in Figures 5.12–5.15. In the Eastern Region, nonpoint target locations were surrounded predominantly by agricultural land uses, particularly in the Hangman Creek and Walla Walla River watersheds (Figure 5.13). In the Little Spokane River watershed, land uses surrounding nonpoint target locations were more mixed, with greater percentages of residential land uses and developed areas lower in the Little Spokane River watershed, and agricultural land uses more prevalent in the Dragoon Creek and Deadman Creek subwatersheds (Joy and Jones 2012). In other regions, land uses surrounding nonpoint target locations appeared to be less dominated by a single land use within and among watersheds. For example, in the Northwest Region, relative land uses surrounding Lake Whatcom nonpoint target locations were dominated by forested and residential areas (Figure 5.14). In the Samish Bay and Stillaguamish River watersheds, agriculture comprised a greater percentage of relative land use compared to the other watersheds assessed; however, residential and open areas still made up a large portion of relative land use in these watersheds. In the Southwest Region, nonpoint target locations were surrounded by large portions of forested and residential land uses (Figure 5.15). In the Central Region, land uses were largely residential and commercial; however, in the Okanagan River watershed, agricultural areas made up a larger portion of relative land use (Figure 5.12).

Page 38
Figure 5.2. Overview of nonpoint targets in Washington. Data were obtained from TMDLs published from 2005 to the present.

Page 39
Figure 5.3. Overview of shade targets in Washington. Data were obtained from TMDLs published from 2005 to the present.

Page 40
Figure 5.4. Locations of nonpoint targets in Ecology’s Central Region during the wet season. Symbols represent impairment category. Colors represent percent reduction needed.

Page 41
Figure 5.5. Locations of nonpoint targets in Ecology’s Central Region during the dry season. Symbols represent impairment category. Colors represent percent reduction needed.

Page 42
Figure 5.6. Locations of nonpoint targets in Ecology’s Eastern Region during the wet season. Symbols represent impairment category. Colors represent percent reduction needed. Targets for toxic impairments (black triangles) were not categorized by percent reduction needed.
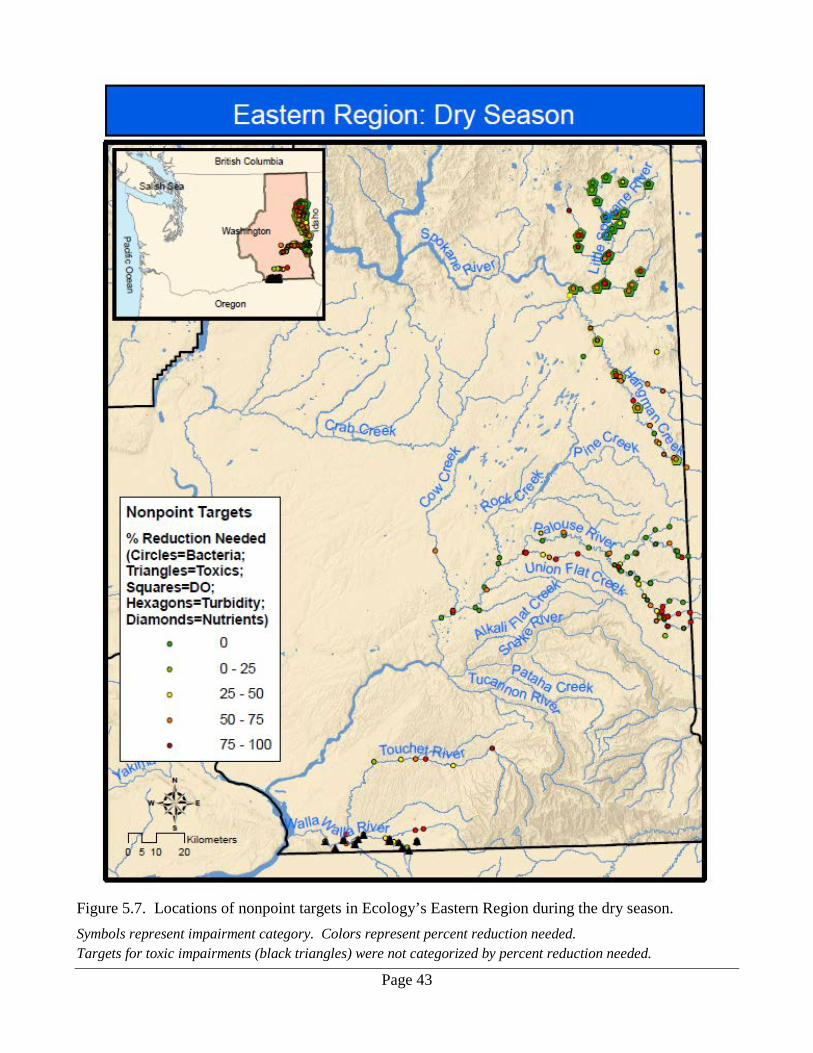
Page 43
Figure 5.7. Locations of nonpoint targets in Ecology’s Eastern Region during the dry season. Symbols represent impairment category. Colors represent percent reduction needed. Targets for toxic impairments (black triangles) were not categorized by percent reduction needed.
Page 44
Figure 5.8. Locations of nonpoint targets in Ecology’s Northwest Region during the wet season.
Symbols represent impairment category. Colors represent percent reduction needed.

Page 45
Figure 5.9. Locations of nonpoint targets in Ecology’s Northwest Region during the dry season. Symbols represent impairment category. Colors represent percent reduction needed.

Page 46
Figure 5.10. Locations of nonpoint targets in Ecology’s Southwest Region during the wet season.
Symbols represent impairment category. Colors represent percent reduction needed.
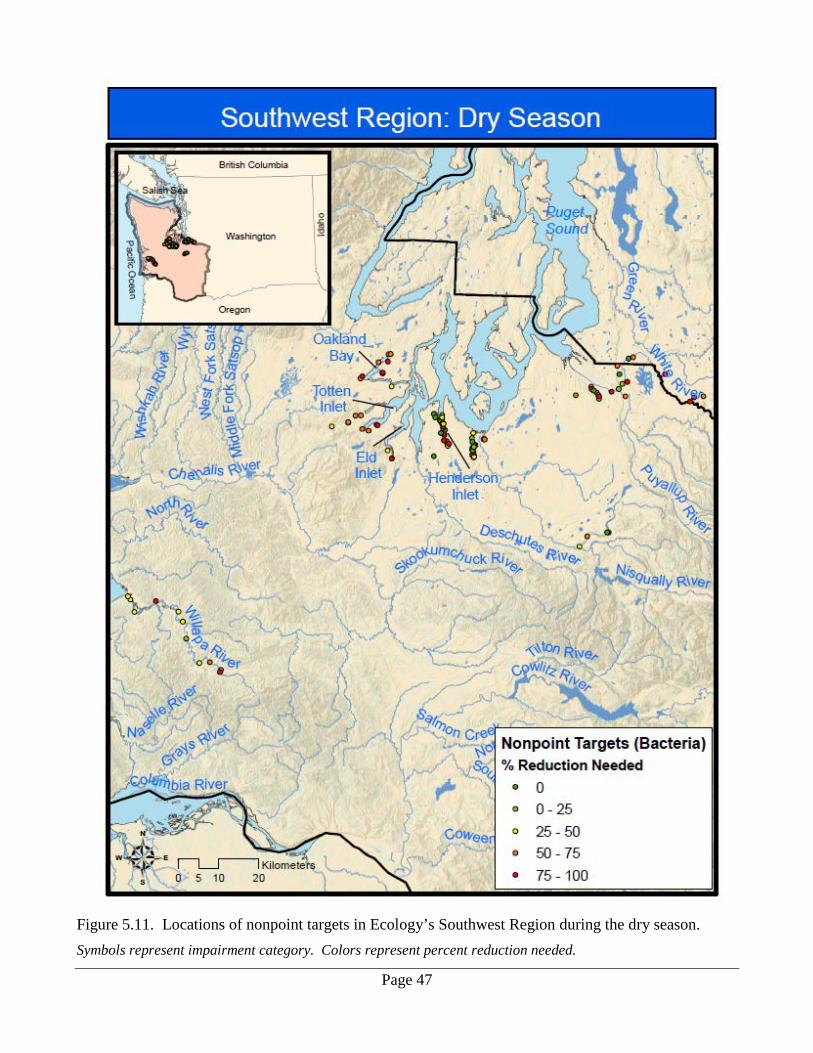
Page 47
Figure 5.11. Locations of nonpoint targets in Ecology’s Southwest Region during the dry season. Symbols represent impairment category. Colors represent percent reduction needed.

Page 48
Figure 5.12. Relative general land use in watersheds of Ecology’s Central Region. Each horizontal bar represents the relative land uses of the subcatchment in which a single load allocation was established in the respective TMDL study.
* Load allocations were established in the Wilson Creek TMDL study. Although land uses were classified as “Uncategorized” in this GIS analysis, the watershed as a whole has been described as mostly agricultural, with additional residential, urban, forest, and shrub steppe land use/land cover (Bohn and Creech 2013).
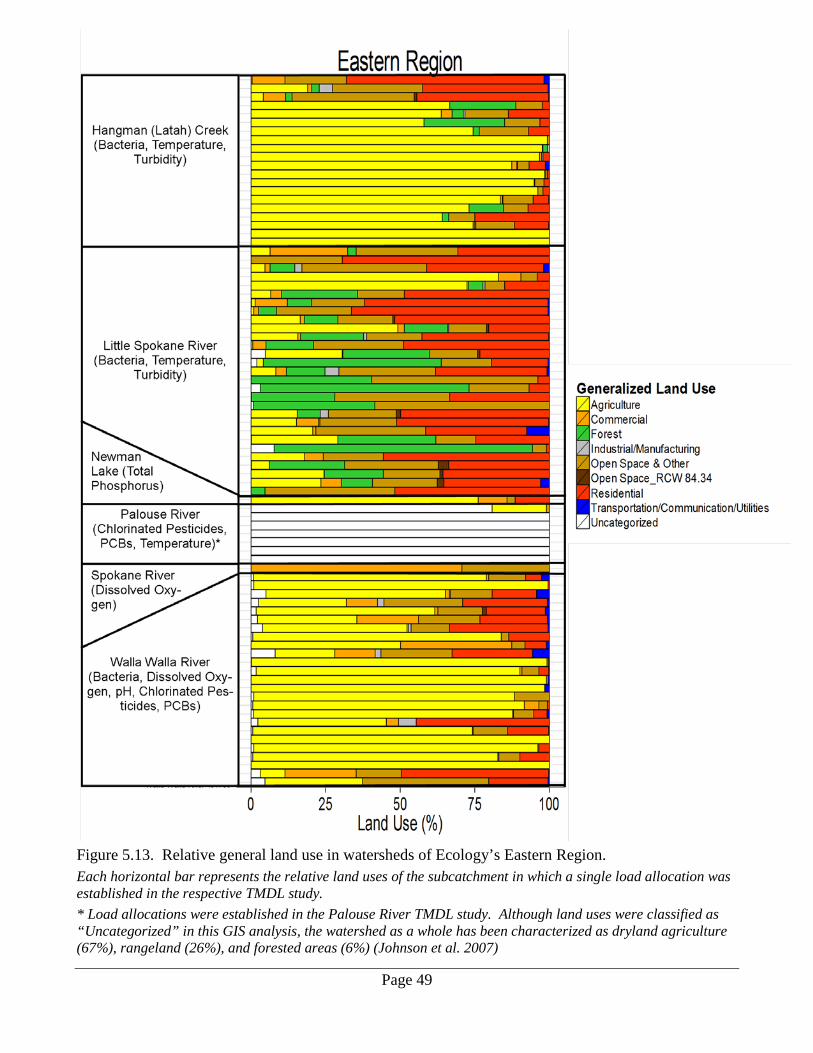
Page 49
Figure 5.13. Relative general land use in watersheds of Ecology’s Eastern Region. Each horizontal bar represents the relative land uses of the subcatchment in which a single load allocation was established in the respective TMDL study. * Load allocations were established in the Palouse River TMDL study. Although land uses were classified as “Uncategorized” in this GIS analysis, the watershed as a whole has been characterized as dryland agriculture (67%), rangeland (26%), and forested areas (6%) (Johnson et al. 2007)

Page 50
Figure 5.14. Relative general land use in watersheds of Ecology’s Northwest Region. Each horizontal bar represents the relative land uses of the subcatchment in which a single load allocation was established in the respective TMDL study.
* Load allocations were established in the Bear-Evans and Fauntleroy Creek TMDL studies. Although land uses in both watersheds were classified as “Uncategorized” in this GIS analysis, the Bear-Evans watershed as a whole has been described as a mixture of forest (54%), residential (30%), agricultural (11%), and commercial/ industrial (4%) based on late 1990s satellite imagery (Lee 2008). The Fauntleroy Creek watershed has been described as largely urbanized.
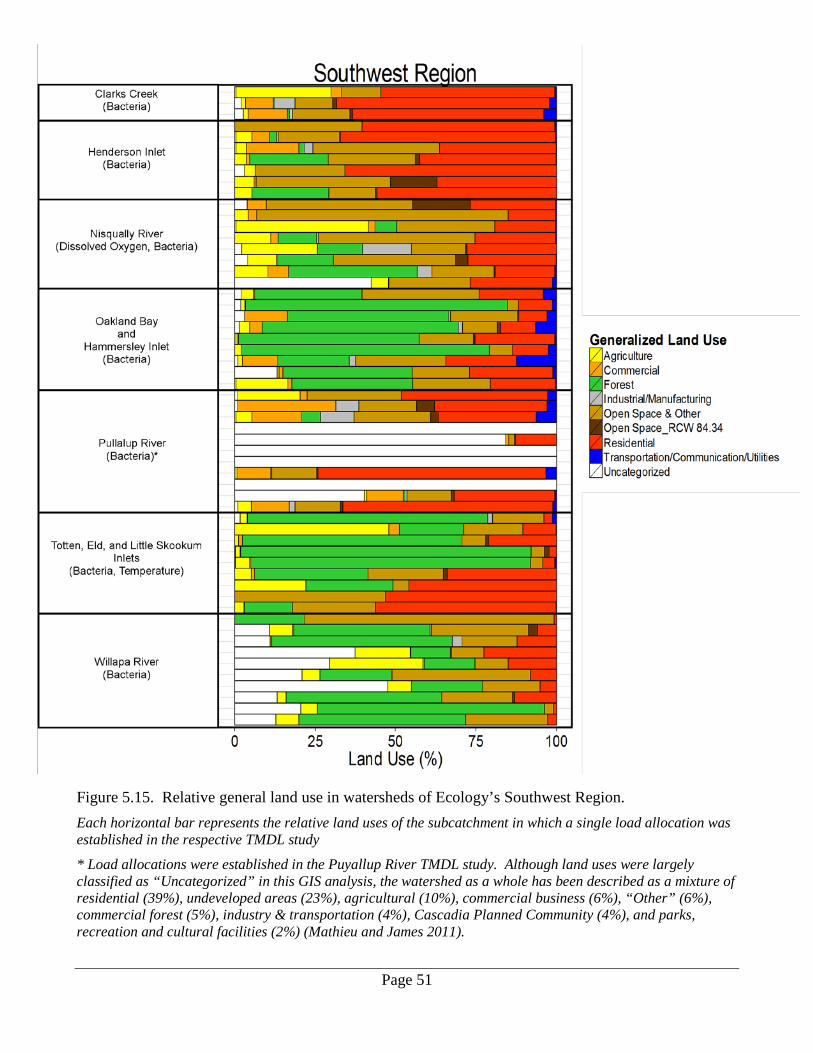
Page 51
Figure 5.15. Relative general land use in watersheds of Ecology’s Southwest Region. Each horizontal bar represents the relative land uses of the subcatchment in which a single load allocation was established in the respective TMDL study
* Load allocations were established in the Puyallup River TMDL study. Although land uses were largely classified as “Uncategorized” in this GIS analysis, the watershed as a whole has been described as a mixture of residential (39%), undeveloped areas (23%), agricultural (10%), commercial business (6%), “Other” (6%), commercial forest (5%), industry & transportation (4%), Cascadia Planned Community (4%), and parks, recreation and cultural facilities (2%) (Mathieu and James 2011).

Page 52
6. Section 319 Grant Analysis
Methods Section 319 of the federal Clean Water Act established the Nonpoint Source Management Program8. As part of that program, federal funds are provided for grants to support the control of NPS pollution. Ecology distributes Section 319 grants in the state, and often matches them through the state’s Centennial Grant program. This program is one of the primary methods of funding the implementation of BMPs to control NPS pollution. EPA maintains a Grants Reporting and Tracking System (GRTS), which provides background information on 319 grants (EPA 2011a). For this study, Ecology Grants Management staff provided a list of Section 319 and matching Centennial funded nonpoint projects that had BMP implementation and/or load reduction data (a total of 109 projects). For each project, the location (Water Resource Inventory Area [WRIA] and Ecology region) and the NPS Category of Pollution were obtained from GRTS. The Category of Pollution is self-reported by the grant applicant. For this analysis the following pollution categories were used:
Report Abbreviation GRTS Full Name
Agriculture Agriculture Hydromod Hydromodification Urban/SW Urban Runoff/Stormwater Animal Feed Animal Feeding Operations Land Disposal Land Disposal/Storage/Treatment Landscaping Turf Management Construction Construction Silviculture Silviculture Other Other NPS Pollution Other Historical Pollutants Other Marinas and Recreational Boating
Although other grants also fund BMPs and other activities to reduce NPS pollution, the reporting system for the Section 319 grants lends itself to categorization. Other grant programs do not currently describe the type of project in a format that is easily sorted and counted.
8 http://water.epa.gov/polwaste/nps/cwact.cfm
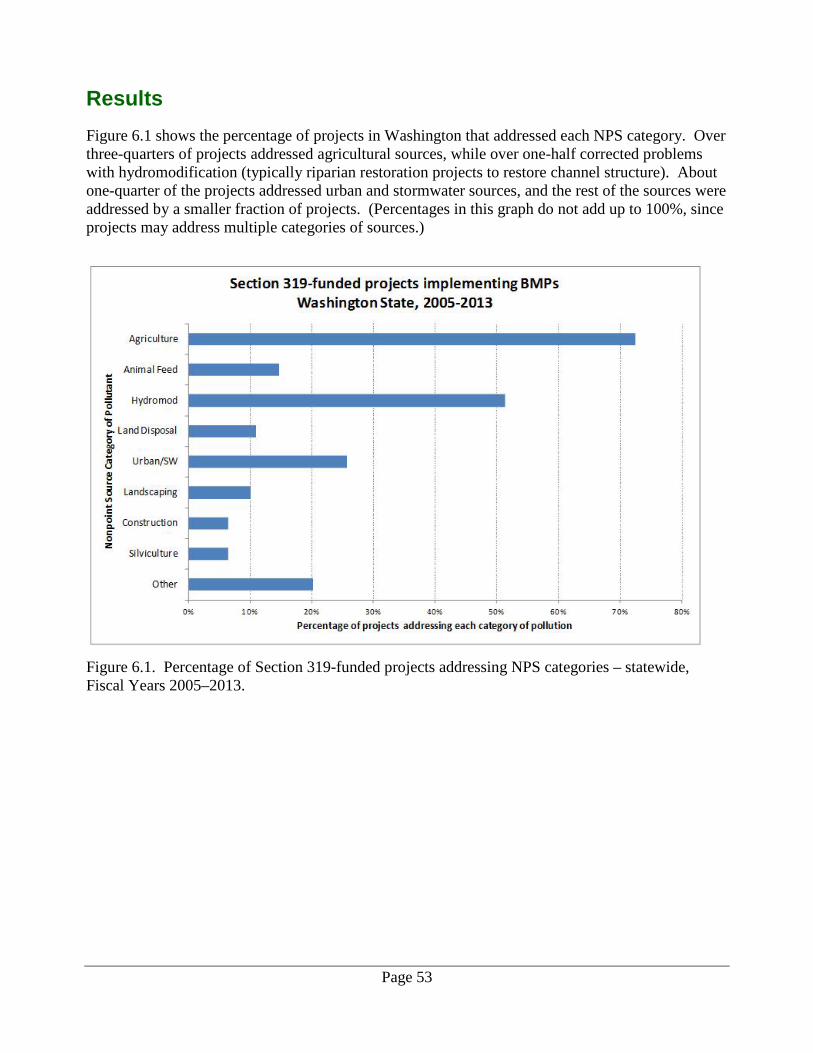
Page 53
Results Figure 6.1 shows the percentage of projects in Washington that addressed each NPS category. Over three-quarters of projects addressed agricultural sources, while over one-half corrected problems with hydromodification (typically riparian restoration projects to restore channel structure). About one-quarter of the projects addressed urban and stormwater sources, and the rest of the sources were addressed by a smaller fraction of projects. (Percentages in this graph do not add up to 100%, since projects may address multiple categories of sources.)
Figure 6.1. Percentage of Section 319-funded projects addressing NPS categories – statewide, Fiscal Years 2005–2013.

Page 54
A GAO study reported similar data on a national basis (GAO 2012). Figure 6.2 is a copy of a graph from that report. Agricultural sources, urban/stormwater runoff, and hydromodification were addressed by the most projects. Compared to this nationwide summary, Washington’s funding for different sources show slightly different proportions. This probably reflects the fact that the dominant problems and priorities for funding may vary from state to state. But nevertheless, this summary indicates the prevalence of these sources as contributors to NPS pollution.
Figure 6.2. Percentage of Section 319-funded projects addressing different categories of nonpoint source pollution – nationwide, Fiscal Years 2004–2010.

Page 55
Figure 6.3 shows the distribution of projects in a different way. Figures 6.1 and 6.2 (and similar graphs that follow) show the number of projects that address each category. Therefore, projects may be counted several times if they address several categories. For Figure 6.3, the percentages of the categories in each project (as shown in the vertical bar graphs that follow) are averaged across the state. The result is a statewide average for the distribution of sources in all projects, which together will add up to 100%. As an example, over 70% of projects in Washington address agricultural nonpoint pollution sources (Figure 6.1), while 46% of project funding, on average, addresses agriculture sources (Figure 6.3).
Figure 6.3. Percentage of categories per Section 319-funded projects by category – statewide. Across the state, about one-half of Section 319 grant funding goes to agricultural best management practices (counting agriculture and animal feed together). About another one-quarter of the funding addresses hydromodification. About another 15% goes to activities in residential and urban areas that are outside stormwater NPDES coverage. These include correcting land disposal problems (fixing failing septic systems for example) and BMPs for urban runoff/stormwater, landscaping, and construction. Again, this in part reflects how Ecology prioritizes nonpoint funding, but it also indicates the needs that local partners identified. Figures 6.4 through 6.11 show similar information by region. The sources addressed most commonly in the Central Region are hydromodification, followed by agriculture (Figures 6.4 and 6.5). Agriculture is identified most often for grants in the Eastern and Southwest Regions, with hydromodification the second-most common in both regions (Figures 6.6, 6.7, 6.10, and 6.11). In the Northwest Region, sources are a mix of agriculture, hydromodification, and urban/residential sources (Figures 6.8 and 6.9).
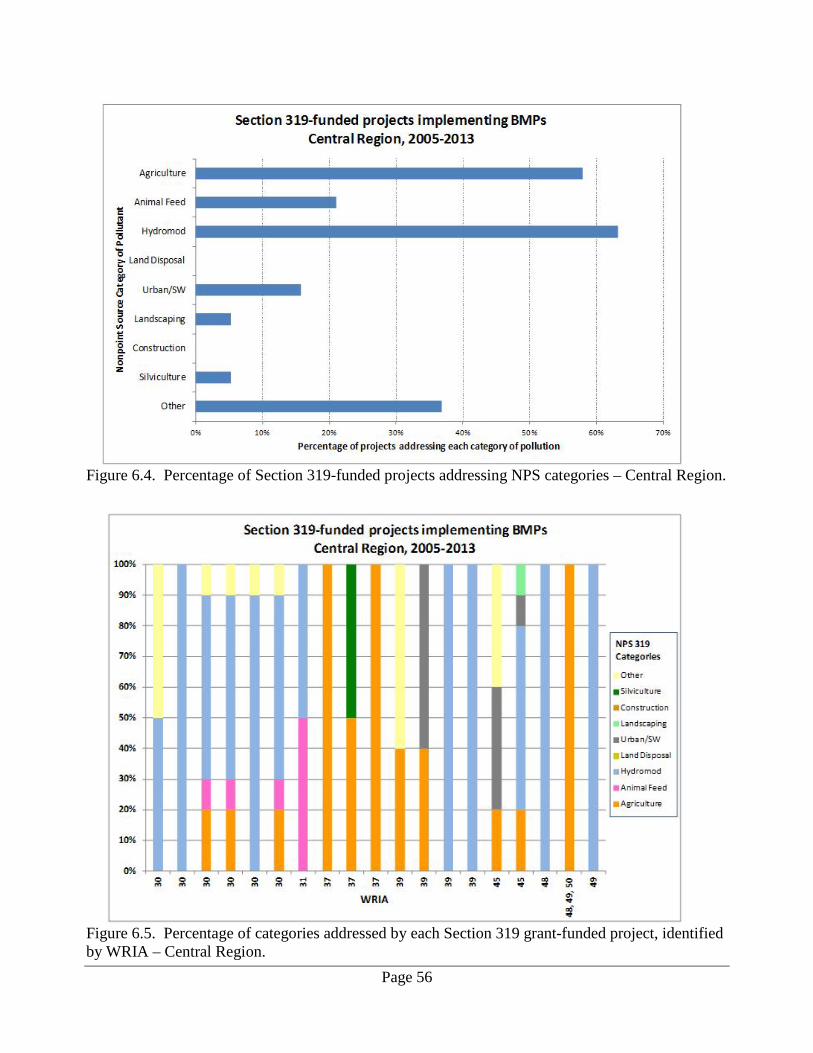
Page 56
Figure 6.4. Percentage of Section 319-funded projects addressing NPS categories – Central Region.
Figure 6.5. Percentage of categories addressed by each Section 319 grant-funded project, identified by WRIA – Central Region.

Page 57
Figure 6.6. Percentage of Section 319-funded projects addressing NPS categories – Eastern Region.
Figure 6.7. Percentage of categories addressed by each Section 319 grant-funded project, identified by WRIA – Eastern Region.

Page 58
Figure 6.8. Percentage of Section 319-funded projects addressing NPS categories – Northwest Region.
Figure 6.9. Percentage of categories addressed by each Section 319 grant-funded project, identified by WRIA – Northwest Region.

Page 59
Figure 6.10. Percentage of Section 319 grant-funded projects addressing NPS categories – Southwest Region.
Figure 6.11. Percentage of categories addressed by each Section 319-funded project, identified by WRIA – Southwest Region.

Page 60
7. Case Studies
Walla Walla Watershed, Eastern Region, WRIA 32 Timeline Summary:
1990s Bull trout and summer steelhead listed as threatened under the Endangered Species Act (ESA).
2006 Department of Health issues fish consumption advisory for Northern pikeminnow and carp in the Walla Walla watershed owing to elevated PCB levels.
2006–2007 Ecology completes TMDL studies for temperature, chlorinated pesticides and PCBs, fecal coliform, and pH and dissolved oxygen for the Walla Walla watershed.
2009 Walla Walla Watershed Management Partnership is established under Revised Code of Washington Section 90.92 as a 10-year pilot program to locally manage water issues in the Walla Walla watershed.
Issues Summary:
Pollutant Category Land Use Category Nonpoint Source BMP
Water Temperature (Shade)
• Mixed (Agriculture, Forestry, Urban, Residential)
• Reduced stream shade • Altered channel morphology via
sedimentation and human modifications
• Reduced summer flows
• Restore riparian vegetation
• Reduce sediment erosion
Dissolved Oxygen and pH
• Mixed (Agriculture, Forestry, Urban, Residential)
• High nutrient loads • High water temperatures • Low summer flows
• Increase shade and reduce nutrient loads
Pesticides and PCBs • Agriculture • Soil erosion from unprotected
fields/erosive irrigation practices • Reduce sediment erosion
Fecal Coliform
• Agriculture • Urban/Residential
• Livestock • Manure application • Human waste- onsite septic systems • Urban and residential runoff • Subsurface contamination
• Install riparian fencing • Install off-stream water
facilities • Education and outreach

Page 61
Watershed Description
The Walla Walla watershed is located in Walla Walla and Columbia Counties in southeastern Washington (Figure 7.1). The headwaters begin in Oregon and flow westward for about 61 miles, eventually draining into the Columbia River. Major tributaries to the Walla Walla River include Touchet River, Dry Creek, Pine Creek, and Mill Creek. The entire drainage basin covers about 1,760 square miles, of which roughly two-thirds lie in Washington.
Figure 7.1. Walla Walla River TMDL study area.

Page 62
The area is characterized by hot and arid summers and cold, wetter winters. Water in the area is heavily managed for irrigation and flood control, and summer flows are greatly reduced during the dry season. Population is mostly concentrated in the watershed’s few urban areas, which include the cities of Walla Walla, College Place, Dayton, Prescott, Touchet, and Waitsburg. Soils consist predominantly of loess. About 91% of the land is privately owned with agriculture as the dominant land use (Hashim and Stalmaster 2004, as cited in Gray et al. 2006). Wheat, pasture, potatoes, alfalfa seed, and hay make up the largest percentage of irrigated crops, and pasture makes up about one-fourth of irrigated land in the Walla Walla watershed within Washington boundaries (Gray et al. 2006).
Water Quality Issues
Stream reaches within the Walla Walla watershed have been placed on the 303(d) list of impaired waters for violations of multiple parameters, including water temperature, fecal coliform, pH, dissolved oxygen, pesticides, and PCBs. Many of these parameters are ecologically interrelated, such that impairment caused by one pollutant may be directly or indirectly associated with other pollutants. Water quality issues in the watershed are also generally related to water quantity issues, particularly during the low-flow summer periods (Joy et al. 2007). Both water quality and quantity issues in the watershed affect critical habitat conditions for threatened bull trout and steelhead.
Water Quality Improvement Project
Total Maximum Daily Load Study
Four TMDL studies for water temperature, fecal coliform, pH/dissolved oxygen, and pesticides/ PCBs were completed and approved in 2006–2007. The four TMDL studies provided the groundwork for establishing pollutant load allocations, which were summarized in Baldwin et al. (2008) (Table 7.1). Fecal coliform in the Mill Creek, Touchet River, and Walla Walla River watersheds was found to be predominantly from nonpoint sources, including inadequate livestock practices, failing onsite septic systems, urban and residential runoff, and subsurface contamination. Fecal coliform loads were generally higher during the wet season from March through June, and fecal coliform concentrations were generally higher during the dry season from June through September (Joy et al. 2006). Instream temperatures did not meet water quality standards primarily during the hottest months of July and August. The mechanisms contributing to high instream temperatures include lack of riparian shade along impaired reaches, reduced summers flows, and high sediment loads (Baldwin and Stohr 2007). Land-use activities that commonly drive these mechanisms are those that remove or destroy riparian vegetation, inefficiently consume water, and deliver excessive sediments from upstream. Problems with pH and dissolved oxygen occurred mainly during May through October, with 34 of 54 sites exceeding pH standards and 17 sites failing dissolved oxygen standards (Joy et al. 2007). Conditions of low dissolved oxygen and high pH were associated with high levels of primary productivity, which are generally stimulated by excess nutrient loads, high instream temperatures,

Page 63
and increased light reaching the stream. However, the study also reported high natural background levels of phosphorus concentrations and pH in the headwaters of the Touchet River and Mill Creek.
Table 7.1. Load allocations assigned by the Walla Walla TMDLs. Table source: Baldwin et al. (2008).

Page 64
The primary sources of pesticide and PCB loadings were nonpoint in nature, with known human sources from wastewater treatment plants (WWTPs) accounting for less than 5% of the loading in the Walla Walla watershed (D. Norton, Department of Ecology, personal communication; Figure 7.2). Soil erosion from agricultural and urban areas was determined to be the primary nonpoint source and mechanism of pesticide and PCB loading (Gray et al. 2006). Although the use of most chlorinated pesticides and PCBs was banned in the U.S. in the 1970s and 1980s, effects from their earlier applications remain in the environment. Turbidity and total suspended solids (TSS) were used as indicators of pesticides and PCBs because turbidity and TSS levels are typically highly correlated with pesticide levels and the former could more easily be translated into controllable land-use practices.
Figure 7.2. Source assessment of PCB and DDT loading in the Walla Walla watershed.
Data source: Johnson et al. (2004). Figure source: D. Norton, Department of Ecology.
Best Management Practice (BMP) and Effectiveness Monitoring Efforts
Ecology developed a single water quality implementation plan for the Walla Walla watershed to synthesize information from the four separate TMDLs and provide BMP recommendations that address multiple impairments (Baldwin et al. 2008). Because of the interrelatedness of water quality issues, individual BMPs may address multiple water quality impairments. For example, restoring riparian vegetation buffers restores multiple riparian-stream functions, including increased effective shade; stabilized streambanks to reduce erosion of sediments, nutrients, and pesticides/PCBs into the streams; and increased stream habitat complexity and structure for fish and other wildlife. Implementation of BMPs in the Walla Walla watershed have largely focused on restoration and protection of riparian areas including revegetating riparian areas in agricultural and urban settings, installing fencing to exclude livestock from waterways, providing off-stream watering sources for livestock, and education/outreach. Many of these projects have been implemented by local

Page 65
conservation districts and other entities through Clean Water Act Section 319 grants (EPA 2011a). The Conservation Reserve Enhancement Program (CREP) has largely worked with landowners to plant a mixture of native trees, shrubs, and grasses in riparian areas on private properties within the Walla Walla watershed. As of December 2013, over 230 miles of riparian buffers have been planted through CREP and other programs in the Walla Walla Watershed (M. Kuttel, Washington State Department of Ecology, personal communication). Ecology is currently planning an effectiveness monitoring study for the Walla Walla watershed to begin in 2014, which will assess the effectiveness of water quality improvement efforts in the watershed.
Lower Yakima River Watershed, Central Region, WRIA 37
Timeline Summary:
1970–1980s Early water quality studies conducted in the Yakima basin (e.g., Boucher 1975, CH2M Hill 1975, Boucher and Fretwell 1982)
1993 Department of Health issues advisory about consuming large quantities of fish
1997 Roza-Sunnyside Board of Joint Control adopts local water quality policy to address water quality issues in irrigation waterways
1998 Ecology completes TMDL study for suspended sediment in the Lower Yakima River
2006 Ecology completes effectiveness monitoring study for the Lower Yakima River (Coffin et al. 2006)
2009 Roza-Sunnyside Board of Joint Control completes water quality monitoring study (Zuroske 2009)
Issues Summary:
Pollutant Category
Land Use Category Nonpoint Source BMP
Suspended Sediment Agriculture
• Soil erosion caused by furrow/rill irrigation
• High sediment loads in irrigation ditches
• Install sprinkler or drip irrigation systems • Pipe irrigation ditches and drains • Construct settling ponds • Install vegetated buffers • Apply Polyacrylamide flocculant
Pesticides Agriculture • Legacy pollutants from
historic applications on agricultural lands
• BMPs that address suspended sediments

Page 66
Watershed Description
The Yakima River originates in the central Cascades in south-central Washington, flowing southeast for about 200 miles before emptying into the Columbia River (Figure 7.3). The basin is divided into the Upper and Lower Yakima River basins. The basin lies within Yakima and Benton Counties and the Yakama Indian Reservation. The area is characterized by an arid climate with average annual rainfall less than 20 inches per year (Joy and Patterson 1997). Many smaller tributaries to the Yakima River go dry in the summer (Molenaar 1985, as cited in Joy and Patterson 1997). Fine-grained soils in the area are highly vulnerable to erosion. The Lower Yakima River basin outside of the urban area is sparsely populated. The lower basin is one of the most heavily irrigated and agriculturally diverse areas in the U.S., with 50–100% of waters from the Naches and Upper Yakima Rivers diverted for irrigation and hydropower during the irrigation season (Molenaar 1985, as cited in Joy and Patterson 1997). The Yakima River supports a key salmon fishery that is important to subsistence and recreational fishers.

Page 67
Figure 7.3. Lower Yakima River TMDL study area.

Page 68
Water Quality Issues
Sediment erosion and pesticide loading from irrigated agriculture has long been recognized as a water quality issue in the area. During a typical irrigation season, an estimated 300 tons of sediment per day is eroded into the Lower Yakima River (Joy and Patterson 1997). The most evident sign of sediment-impacted waters is muddy and turbid waters at the downstream end of tributaries and irrigation returns. Because pesticides bind to soil particles, the issues of soil erosion and pesticide loading are related. Organochlorine compounds such as dichlorodiphenyltrichloroethane (DDT), dieldrin, and endosulfan were used extensively in the past to improve crop yields in the Yakima Valley. Compounds such as DDT and dieldrin have been banned for use in the U.S. since the 1970s and 1980s because their toxic effects on birds, wildlife, and humans have become recognized. Yet, they are among the most frequently detected pesticides in the waters, sediments, and biota within the Yakima Valley, owing to their persistent and bioaccumulative characteristics (Joy and Patterson 1997). Resident fish in the Yakima Valley have been found to contain some of the highest concentrations of DDT in the U.S. (Rinella et al. 1993). The mainstem Yakima River, several tributaries, and irrigation returns have been placed on the 303(d) list of impaired waters for violations of turbidity, suspended sediment, and multiple pesticides. Impacted beneficial uses include domestic water supplies, primary and secondary contact recreation, and aesthetic enjoyment of fish and wildlife.
Water Quality Improvement Project
Total Maximum Daily Load Study
A TMDL study for suspended sediment and DDT was implemented in 1994 and 1995 and completed in 1998 with the goal of meeting turbidity and suspended sediment targets by 2017 (Joy and Patterson 1997, Ecology 1998). Five-year interim targets were established to evaluate progress in meeting the 2017 targets (Table 7.2). The TMDL focused on controlling suspended sediment erosion from agricultural lands during the irrigation season, which would presumably reduce turbidity levels and DDT loads. The TMDL study found a high correlation between turbidity and TSS and between TSS and DDT, concluding that reducing TSS loads could effectively reduce both turbidity and DDT loads. The highest TSS and turbidity levels were observed in April through June, when high streamflows contributed to soil erosion from unprotected fields. Several irrigation drains and tributaries, including Moxee Drain, Granger Drain, Sulphur Creek, and Spring Creek, were determined to contribute most to sediment loading and high turbidity levels in the Lower Yakima River. The study found that point sources and non-agricultural nonpoint sources did not significantly contribute to TSS and DDT water quality problems in the Lower Yakima River basin during the irrigation season.

Page 69
Table 7.2. Turbidity and DDT targets for the Lower Yakima River, tributaries, and irrigation waterways. Turbidity targets are in units of Nephelometric Turbidity Units (NTU). RM = River Mile. Source: Joy and Patterson (1997).
5-Year Turbidity Targets (2003)
<5 NTU increase: Mainstem Yakima River between Yakima River-Naches River confluence (RM 116) and Van Geisan Road Bridge (RM 8.4)
25 NTU based on 90th percentile criterion: Tributaries and drain mouths, including Moxee Drain, Granger Drain, Sulphur Creek, and Spring Creek
10-Year Turbidity Targets (2007)
<5 NTU increase: Mainstem Yakima River between Yakima River-Naches River confluence (RM 116) and the Kiona Gauge (RM 30)
25 NTU based on 90th percentile criterion: Tributaries and drain mouths, including Moxee Drain, Granger Drain, Sulphur Creek, and Spring Creek
15-Year DDT Target (2012)
1 ng/L DDT chronic aquatic toxicity criterion: All tributaries, drains, and the mainstem Yakima River
20-Year DDT Target (2017)
DDT human health criteria for fish and water: All tributaries, drains, and the mainstem Yakima River
Best Management Practice (BMP) and Effectiveness Monitoring Efforts
The BMPs recommended in the Summary Implementation Plan largely focused on activities that encouraged or helped growers to reduce soil erosion from fields (Ecology 1998). According to the Reporting and Tracking System, Section 319 grants have been used by local conservation districts and other entities to implement projects that include: • Conversion of furrow/rill irrigation systems to sprinkler or drip systems that are less susceptible
to soil erosion. • Piping of irrigation ditches and drains. • Construction of settling ponds and vegetated filter strips. • Uses of Polyacrylamide (PAM), a polymer commonly used as a flocculant in water treatment. • Restoration of riparian areas. • Monitoring of water quality. • Education/outreach. In 1997, the Roza-Sunnyside Board of Joint Control (RSBJC)—a partnership formed in 1996 between two major irrigation districts in the Yakima Valley—adopted a locally-supported water quality policy. The policy requires each irrigated property to meet a specified turbidity target. If targets are not met, the landowner must submit and implement a short-term and long-term water quality plan or face restrictions on delivery services. The RSBJC developed a water quality improvement program that includes long-term sampling of irrigation waterways to monitor compliance.

Page 70
Overall, effectiveness monitoring studies showed reductions in turbidity and TSS in the Lower Yakima River and in irrigation waterways, compared to historic levels in the mid-1990s (Coffin et al. 2006; Zuroske 2009). For example, during the 1997 irrigation season, the median TSS load of the four waterways was around 254 tons per day; during the 2001–2007 irrigation season, the median TSS load of the four waterways were less than 50 tons per day (Figure 7.4). However, the studies also concluded that more work was still needed to attain turbidity and TSS water quality targets at some sampled locations in the Lower Yakima and to sustain improvements that had been made.
Figure 7.4. Left panel: Median total suspended solids (TSS) loads in four irrigation waterways and the Yakima River during the 1997–2007 irrigation seasons. Right panel: Median turbidity in the Yakima River during the 1997–2007 irrigation seasons. Figure source: Zuroske (2009).

Page 71
Dungeness River Watershed and Dungeness Bay, Southwest Region, WRIA 18
Timeline Summary:
1991 Concerns about bacterial contamination in Dungeness Bay noted by Clallam County
1996 Matriotti Creek placed on the 303(d) list of impaired waters for violations of fecal coliform standards
1997 Department of Health reports increasing fecal coliform levels in Dungeness Bay
1997–1999 Jamestown S’Klallam Tribe, Clallam County, and Ecology conduct water quality monitoring
2000 Department of Health closes 300 acres to shellfish harvest, due to elevated fecal coliform levels
2001 Department of Health closes additional 100 acres to shellfish harvest
2002 Ecology completes bacteria TMDL study for Dungeness River watershed
2003 Department of Health conditionally reopens parts of Dungeness Bay to shellfish harvest, with open period from February through October and closure from November through January
2004 Ecology completes bacteria TMDL study for Dungeness Bay
2010 The Cadmus Group (2010) completes effectiveness monitoring study for the Dungeness River watershed and Bay
2011 For first time in 10 years, Department of Health conditionally reopens 500 acres in Dungeness Bay to shellfish harvest, with open period from February through October and closure from November through January
Issues Summary:
Pollutant Category Land Use Category Nonpoint
Source BMP
Fecal Coliform Bacteria
Urban/Residential • Human waste-
onsite septic systems
• Decommission onsite septic systems • Provide public education/training to
conduct onsite septic inspections
Urban/Residential • Domestic pet waste
• Install pet waste stations • Public education and outreach
Agriculture • Livestock • Individual on-farm BMPs
Rural/Residential/ Agriculture • Game farm • Pipe irrigation ditches

Page 72
Watershed Description
Located in Clallam County at the northern end of the Olympic Peninsula, the Dungeness River originates in the Olympic Mountains and flows for about 30 miles before emptying into Dungeness Bay (Figure 7.5). The river drains about 172,000 acres of land, with the upper two-thirds of the watershed lying within the Olympic National Forest and Olympic National Park, and the lower one-third flowing through mostly private land (Hempleman and Sargeant 2002).
Figure 7.5. Dungeness River watershed. Figure source: Jamestown S’Klallam Tribe (2009).
The area experiences mild climate and is situated in a rain shadow of the Olympic Mountains. Peak flows occur in June after snowmelt, and in November through February during the rainy season. Lowland tributaries to the Dungeness River include Matriotti and Hurd Creeks, and other tributaries to the Bay include Meadowbrook and Cooper Creeks. The Lower Dungeness River basin includes a mix of residential, commercial, and agricultural land uses. Agricultural areas are extensively irrigated during the dry season to support crops. Land use has become increasingly residential as the area has experienced rapid population growth (Sargeant

Page 73
2002). In Clallam County, population has grown by about 11% over a 10-year period from 2000 through 20109.
The Dungeness Bay provides important salt marsh habitat for fish and wildlife, and supports important commercial, subsistence, and recreational shellfish and fish harvest, including crabs, oysters, and clams as well as salmon and bottomfish.
Water Quality Issues
Concerns about bacterial contamination in the Dungeness Bay have been noted since at least the early 1990s (Clallam County 1993, as cited in Sargeant 2002). Matriotti Creek was placed on the 303(d) list for impaired waters in 1996 for violations of the fecal coliform standard, and additional listings ensued in later years. Also, based on National Shellfish Program Sanitation Requirement water quality standards, the Washington State Department of Health in the 1990s closed economically important shellfish harvest areas in Dungeness Bay due to fecal coliform violations. In response to the bacterial contamination problem, water quality monitoring by various local agencies and organizations including Clallam County, Jamestown S’Klallam Tribe, and Ecology was initiated, and a Water Quality Improvement Project was established for the Dungeness River watershed and Bay.
Water Quality Improvement Project
Total Maximum Daily Load Study
A TMDL study was conducted to evaluate fecal coliform contamination in freshwater areas of the Lower Dungeness River basin (Sargeant 2002). A separate TMDL study was conducted for Dungeness Bay to assess whether load allocations determined for the Lower Dungeness River were sufficient to protect shellfish (Sargeant 2004). Both studies concluded that the sources of elevated fecal coliform levels were predominantly nonpoint (there are no permitted point sources in the watershed), and that the overall fecal coliform problem appeared to be attributable to multiple nonpoint sources. These included failing onsite septic systems (the primary sewage disposal system used in residential and commercial areas within this watershed), livestock and pet waste, and wildlife. Stormwater runoff and irrigation return were identified as major conveyances of fecal coliform loads. The 2002 TMDL study pinpointed major nonpoint sources on stream reaches to likely land-use activities during different times of the year (Sargeant 2002). The priority areas identified as major nonpoint source contributors included Matriotti Creek, Meadowbrook Creek and Slough, and Golden Sands (Table 7.3). A game farm was identified as a large nonpoint source to Matriotti Creek, and the Clallam Conservation District has worked with the landowner to install BMPs (Sargeant 2002).
9 http://quickfacts.census.gov/qfd/states/53/53009.html

Page 74
Table 7.3. Restoration targets and percent reductions needed to meet fecal coliform water quality standards at the Dungeness River and Bay sites. Sources: Sargeant (2002 and 2004).
Seasonality was also found to be an important factor affecting fecal coliform loads in the watershed. For example, higher concentrations and loads were found during the irrigation season (April through September) than in the wet season (November through February) at most study sites. However, high loads were also observed during the wet season, such as in the lower reaches of the Dungeness River. In the Inner Dungeness Bay, Rensel (2003) concluded that major sources of fecal coliform loads were marine water (a mixture of Strait of Juan de Fuca waters, reflux of Inner Bay and river waters, and wildlife inputs from Outer Bay), wild birds in the Inner Bay, Dungeness River discharges, irrigation ditches directed into the Inner Bay, and Inner Bay seals. The Dungeness River watershed and Dungeness Bay TMDL studies formed the basis for establishing fecal coliform load allocations (Table 7.5) and prioritizing actions for cleanup.
Best Management Practice (BMP) and Effectiveness Monitoring Efforts
Many local entities in the Lower Dungeness River watershed and Bay have been involved in the implementation of BMPs to address multiple nonpoint sources of fecal coliform pollution. Through Section 319 grants, BMP projects have been awarded to address fecal coliform pollution from onsite septic systems, domestic animals/pet waste, livestock waste, stormwater, and irrigation ditches, as well as to provide education/outreach and conduct research and monitoring to identify pollution sources in the Dungeness River watershed and Bay (EPA 2011a).
Location Site
StudyFecal Coliform
Geometric Mean Value
Study 90th Percentile
TargetFecal Coliform
Geometric Mean Value
Target Fecal Coliform
90th Percentile
Percent Reduction Required
Dungeness River RM0.1 15 47 13 43 9Meadowbrook Creek CM0.2 33 243 14 100 59Cooper Creek 49 140 35 100 28Golden Sands Slough 109 565 19 100 82Irrigation Ditch 1 150 273 100 182 33Irrigation Ditch 2 153 1281 24 200 84Dungeness RM 0.1 15 47 13 43 9Residual– Reach RM 0.1 to 0.3 - - 0 0 -Dungeness RM 0.3 13 61 9 43 29Dungeness RM 0.8 17 81 9 43 47Irrigation Ditch at Dungeness RM 1.0 83 239 60 170 29Matriotti Creek 279 783 60 170 78Hurd Creek 12 100 12 100 0Dungeness RM 3.2 6 28 6 28 03.2–Convergence zone (Nov-Feb) 16 122 - 43 654.1–West inner bay (Nov-Feb) 24 64 - 14 412–River mouth (Mar-Jul) 20 107 - 43 60Dungeness RM 0.1 (Mar-Jul) 13 80 - 43 46Ditch #1 69 702 - 100 86Ditch #2 111 805 - 100 88Ditch #3 80 622 - 100 84Ditch #4 78 2879 - 100 97Ditch #5 18 149 - 100 33Ditch #7 98 1874 - 100 95
Tributaries to Dungeness Bay
Dungeness River and Tributaries
Dungeness Bay Marine Sites and Dungeness River during Critical Period
Inner Dungeness Bay Ditches
( ) ( )

Page 75
Effectiveness monitoring has been conducted to determine if BMP implementation efforts have overall improved fecal coliform conditions in the watershed (Woodruff et al. 2009b, The Cadmus Group 2010). The Cadmus Group (2010) found that improvements (lower fecal coliform levels in 2009 compared to 1999 levels) had been made over the last decade. In contrast, Woodruff et al. (2009b) found no improvements in bacterial water quality over the past decade. Both studies, however, indicated that more efforts were needed to improve water quality and meet bacteria reduction targets, especially considering the watershed’s rapid population growth and potential increases in the number of onsite septic systems and impervious surfaces. In 2011, the State Department of Health conditionally reopened 500 acres in Dungeness Bay to shellfish harvest, as a result of improved bacteria conditions based on monitoring data.

Page 76
Samish Bay Watershed, Northwest Region, WRIA 3
Timeline Summary:
1994 Department of Health closes parts of Samish Bay to shellfish harvest because of gastrointestinal illness outbreak related to consumption of Samish Bay shellfish
1998 Failing onsite septic systems in Edison and Blanchard are repaired/replaced, leading to improved water quality. Department of Health reopens small parts of Samish Bay to shellfish harvest
2003 Department of Health closes parts of Samish Bay to shellfish harvest because of gastrointestinal illness outbreak related to consumption of Samish Bay oysters
2006 Ecology initiates TMDL study for fecal coliform
2008 Department of Health temporarily closes parts of Samish Bay to shellfish harvest due to rain events leading to high fecal coliform counts in the Samish River
2008–2009 Ecology completes TMDL Study
2009 Numerous stakeholder groups (government, business, and non-profit) initiate a coordinated effort to improve water quality conditions in the Samish Basin, forming the Clean Samish Initiative
2010 The Clean Samish Initiation is awarded EPA funds for a Pollution Correction and Identification project, which includes water quality monitoring, education and outreach, inspections, and technical assistance to landowners
Issues Summary:
Pollutant Category
Land Use Category Nonpoint Source BMP
Fecal Coliform Bacteria
Rural/Residential • Human waste- onsite septic systems
• Conduct inspections / enforce compliance
Agriculture • Livestock • Install off-stream water
facilities • Install riparian fencing
Urban/Residential • Domestic pet waste • Install pet waste stations
Urban/Marinas and Boating
• Human waste- recreational areas • Install public toilet facilities

Page 77
Watershed Description
Located in Skagit and Whatcom Counties in northwestern Washington, Samish Bay is shallow and heavily influenced by freshwater inputs (Figure 7.6). The Samish River is the largest tributary to the Bay, contributing about 83% of freshwater inputs into the Bay (Swanson 2008). Historically, lower parts of the Samish River were tidally influenced wetlands. Today, much of the Bay and mainstem Samish River has been heavily diked and drained for flood protection and conversion to agriculture. Population density in the Samish watershed is generally low. Upper portions of the watershed are predominantly forested (about 80%), whereas lower portions are predominantly agricultural (75%) (Swanson 2008).
Figure 7.6. Samish Bay watershed TMDL study area.

Page 78
Water Quality Issues
Water quality improvement efforts in the Samish watershed have largely been centered on reducing high levels of fecal coliform, for which several stream reaches of the watershed were placed on the 303(d) list of impaired waters in 1996. The efforts have been motivated by adverse impacts to economically important shellfish harvest areas in Samish Bay. In 1993 and 2004, gastrointestinal illness outbreaks related to consumption of contaminated shellfish from Samish Bay led to the closures of economically important shellfish harvest areas in parts of the Bay. Although most fecal coliform bacteria are not harmful, their presence is used as an indicator for the presence of disease-carrying pathogens (for example, microorganisms that cause gastrointestinal illnesses). Early successes in addressing bacterial pollution from nonpoint sources were apparent in 1998 after failing onsite septic systems were repaired or replaced. In Edison, onsite septic systems were replaced by a new community wastewater treatment system. Subsequent water quality improvements led to reopening of small parts of the Bay to shellfish harvest. However, continued high bacteria levels and subsequent shellfish harvest closures in parts of the Bay led to increased efforts to clean up the watershed. Water quality monitoring conducted during 2000 to 2003 showed that fecal coliform levels did not meet water quality standards throughout the Samish watershed (Haley 2004, as cited in Swanson 2008). The extent and magnitude of water quality problems throughout the entire watershed is supported by a nutrient loading study of Puget Sound watersheds, which singled out the Samish River as having high nutrient loads (inorganic nitrogen and total phosphorus) relative to other Puget Sound rivers (Embrey and Inkpen 1998). The findings are relevant because many land-use activities that contribute high nutrient loads also contribute high fecal coliform loads.
Water Quality Improvement Project
TMDL Study
A TMDL study was conducted in 2006–2007 to evaluate fecal coliform conditions in the watershed and establish targets to bring bacteria-impaired waters into compliance with water quality standards (Swanson 2008). Thirty-three fixed sites were sampled twice per month during the 2006–2007 sampling period. The study found that the geographic extent of fecal coliform violations within the watershed was broader than the 2004 303(d) listings, and that the sources were nonpoint in nature. As detailed in Lawrence (2009), potential significant sources in this watershed included: • Insufficient manure management. • Livestock access to streams and ditches. • Failing onsite septic systems in residential and business areas. • Waterfowl and other wildlife. • Domestic pets and non-commercial farm animals. • Human sources by recreational users, due to a lack of toilet facilities in popular recreational
areas (e.g., areas used by hunters, anglers, boaters, and other recreationalists).

Page 79
Although non-migratory and migratory birds have a large visible presence in the Lower Samish watershed, the study concluded that birds were unlikely to be major contributors of fecal coliform loads. Rather, the Samish River—which contributed about 70% of the total load—was the major contributor of downstream fecal coliform (Figure 7.7). However, it was noted that birds and other wildlife may congregate in areas such as open crop fields and, as such, contribute locally to elevated counts (Swanson 2008).
Figure 7.7. Estimated average annual loading from the tributaries to Samish Bay during the 2006-07 TMDL study. Figure source: Swanson (2008). The study also found that fecal coliform concentrations and loads varied with the season, and along an increasing gradient from upstream to downstream. The highest concentrations were observed during the dry season from about July through October, when loads and stream discharges were low. Low concentrations were observed during the wet season from about November through June, when loads were highest (Swanson 2008). Findings based on geographical and seasonal data provided the basis for establishing load allocations and reductions for fecal coliform (Tables 7.4 and 7.5). The load reductions needed for specific reaches in the watershed ranged widely from 18 to 95%, with the greatest reductions generally needed in the lower parts of the Samish River and in tributaries to the Samish River.
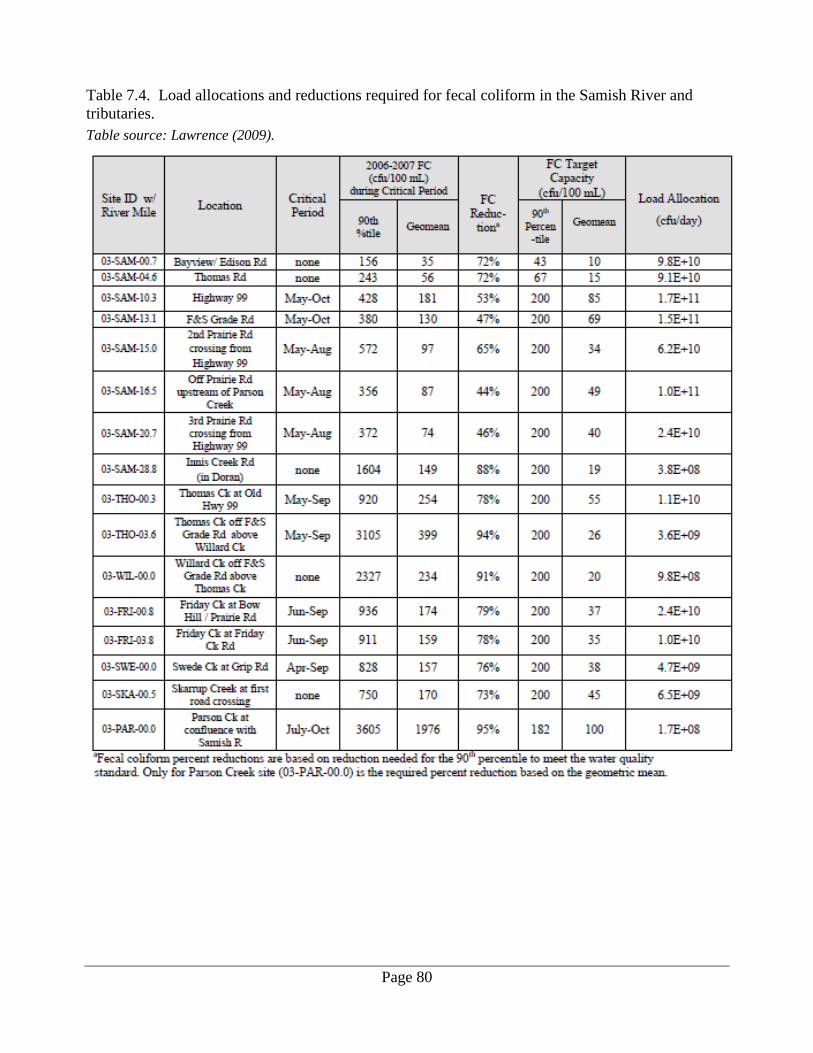
Page 80
Table 7.4. Load allocations and reductions required for fecal coliform in the Samish River and tributaries. Table source: Lawrence (2009).

Page 81
Table 7.5. Load allocations and reductions required for fecal coliform in tributaries to Samish Bay.
Table source: Lawrence (2009).
Best Management Practice (BMP) and Effectiveness Monitoring Efforts
Many of the efforts to improve bacteria conditions in the Samish watershed have been coordinated by the Clean Samish Initiative—a partnership of more than 20 organizations, agencies, and businesses—since its founding in 2009. Through the Clean Samish Initiative and Section 319 grants, BMP projects have been implemented to address multiple nonpoint sources of fecal coliform (EPA 2011a) , including: • Inspecting onsite septic systems. • Installing pet waste stations and portable toilets throughout the watershed. • Installing off-stream watering facilities for livestock. • Installing riparian fencing. • Monitoring and researching to identify pollution sources. • Education/outreach about water quality issues in the Samish watershed. Long-term water quality monitoring by the Skagit County Monitoring Program has continued to show that fecal coliform levels in the Samish River watershed do not meet water quality standards at many sampled locations (Skagit County Public Works 2013). Skagit County Monitoring Program’s storm sampling has also shown that bacterial water quality worsens after heavy rainfall

Page 82
events. These problems have resulted in the temporary closures of shellfish harvest areas in parts of Samish Bay after heavy rainfall events. Microbial source tracking studies by EPA and Oregon State University showed that multiple sources spread throughout the watershed—including humans, birds, and ruminants (cows, elk, and deer)—contribute to fecal coliform levels (EPA 2011b; Oregon State University 2011). The source tracking studies provide additional evidence regarding nonpoint pollution in the Samish watershed. However, quantification of all nonpoint sources to determine their relative contributions in the watershed will require additional work.

Page 83
8. Synthesis and Discussion
Overview Data were assembled from multiple sources with the study objectives of researching the known status, extent, and causes of nonpoint pollution in Washington. Steps in the assessment process consisted of:
• Reviewing EPA guidance. • Conducting a literature review of nonpoint-related studies. • Compiling and evaluating data from TMDL reports in Washington published in 2005 or later. • Assessing general land uses surrounding areas where pollution caused by nonpoint sources has
been identified and quantified through the TMDL process. • Analyzing Section 319 grant-funded BMP implementation projects. • Developing case studies from each of Ecology’s four regions in Washington. The nonpoint pollution problem in Washington was characterized by general land use/nonpoint source category, using specific examples from our assessment. For this study, nonpoint source categories are: • Agricultural Areas • Urban and Residential Areas • Marinas and Recreational Boating • Forested Areas • Hydromodification • Atmospheric Deposition • Natural/Background Sources
This analysis shows that nonpoint pollution sources impair water quality widely throughout Washington. However, different regions of the state may experience unique conditions of impaired water quality, including different proportions of various land-use activities that contribute to nonpoint pollution problems. At large spatial scales, the relative importance of different nonpoint pollutants, sources, and transport mechanisms is largely influenced by regional characteristics across the state, including climate, land cover, geology, soils, and human population. At smaller spatial scales, water quality issues caused by nonpoint pollution are ultimately influenced by watershed-level and site-specific characteristics, including specific land-use activities and land-use changes, human population pressures, surface and subsurface hydrology, and local topography.
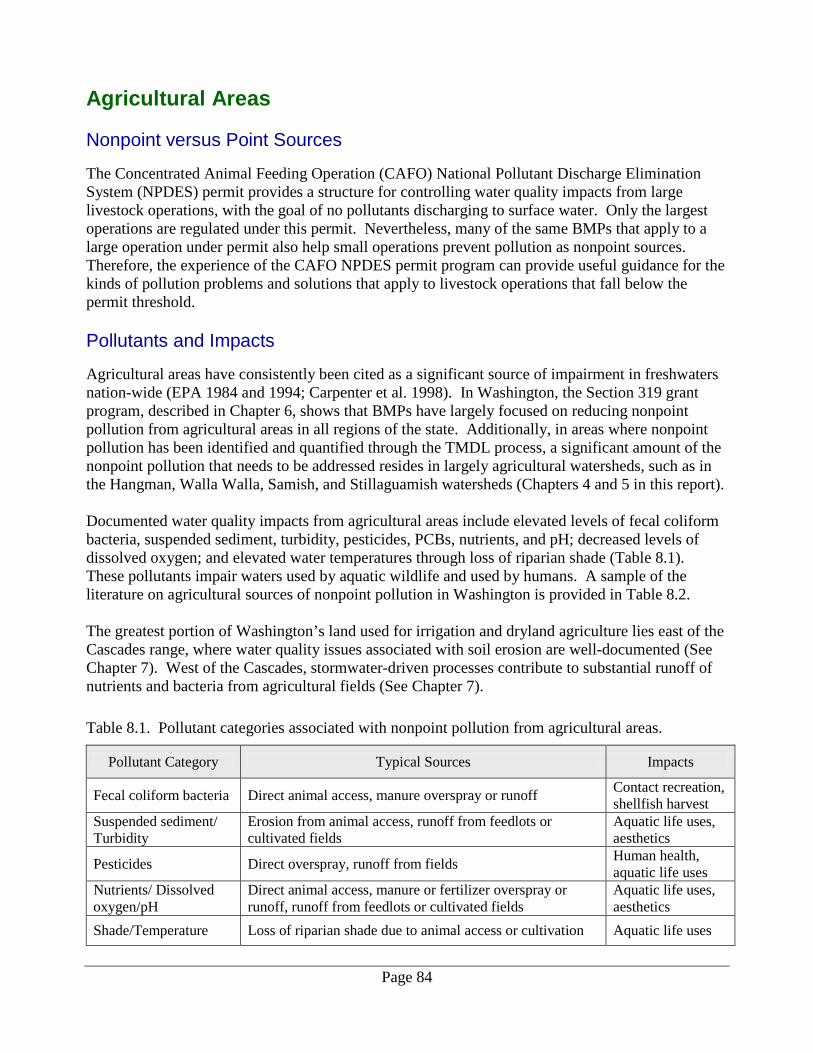
Page 84
Agricultural Areas
Nonpoint versus Point Sources
The Concentrated Animal Feeding Operation (CAFO) National Pollutant Discharge Elimination System (NPDES) permit provides a structure for controlling water quality impacts from large livestock operations, with the goal of no pollutants discharging to surface water. Only the largest operations are regulated under this permit. Nevertheless, many of the same BMPs that apply to a large operation under permit also help small operations prevent pollution as nonpoint sources. Therefore, the experience of the CAFO NPDES permit program can provide useful guidance for the kinds of pollution problems and solutions that apply to livestock operations that fall below the permit threshold.
Pollutants and Impacts
Agricultural areas have consistently been cited as a significant source of impairment in freshwaters nation-wide (EPA 1984 and 1994; Carpenter et al. 1998). In Washington, the Section 319 grant program, described in Chapter 6, shows that BMPs have largely focused on reducing nonpoint pollution from agricultural areas in all regions of the state. Additionally, in areas where nonpoint pollution has been identified and quantified through the TMDL process, a significant amount of the nonpoint pollution that needs to be addressed resides in largely agricultural watersheds, such as in the Hangman, Walla Walla, Samish, and Stillaguamish watersheds (Chapters 4 and 5 in this report). Documented water quality impacts from agricultural areas include elevated levels of fecal coliform bacteria, suspended sediment, turbidity, pesticides, PCBs, nutrients, and pH; decreased levels of dissolved oxygen; and elevated water temperatures through loss of riparian shade (Table 8.1). These pollutants impair waters used by aquatic wildlife and used by humans. A sample of the literature on agricultural sources of nonpoint pollution in Washington is provided in Table 8.2. The greatest portion of Washington’s land used for irrigation and dryland agriculture lies east of the Cascades range, where water quality issues associated with soil erosion are well-documented (See Chapter 7). West of the Cascades, stormwater-driven processes contribute to substantial runoff of nutrients and bacteria from agricultural fields (See Chapter 7).
Table 8.1. Pollutant categories associated with nonpoint pollution from agricultural areas.
Pollutant Category Typical Sources Impacts
Fecal coliform bacteria Direct animal access, manure overspray or runoff Contact recreation, shellfish harvest
Suspended sediment/ Turbidity
Erosion from animal access, runoff from feedlots or cultivated fields
Aquatic life uses, aesthetics
Pesticides Direct overspray, runoff from fields Human health, aquatic life uses
Nutrients/ Dissolved oxygen/pH
Direct animal access, manure or fertilizer overspray or runoff, runoff from feedlots or cultivated fields
Aquatic life uses, aesthetics
Shade/Temperature Loss of riparian shade due to animal access or cultivation Aquatic life uses

Page 85
Table 8.2. Literature from Washington relating to nonpoint pollution from agricultural areas.
References Region Pollutant Category Key Finding
Embrey (1992) Central Bacteria Probable sources are livestock on rangeland and beef/dairy operations, animal waste disposal operations, irrigation return flows
USGS (2009) Central Pesticides, Nitrate Elevated nitrate largely influenced by irrigation practices that affect surface-subsurface hydrology
Wagner et al. (2006) Eastern Pesticides Types of pesticides found in irrigation returns
overall dependent on crop type Almasri and Kaluarachchi (2004)
Northwest Nitrate Dairy manure is the main source of nitrate. Other sources include fertilizers and atmospheric deposition
Carruthers (2012) Northwest Nutrients, Bacteria, Turbidity/Suspended Sediments
Higher fecal coliform and turbidity and lower dissolved oxygen downstream of agricultural areas
Carey and Harrison (2014) Northwest Nitrogen
Elevated nitrate in groundwater with higher rates of N-fertilizer application and improper timing of manure application to fields
Collyard (2010) Southwest Bacteria Probable sources related to livestock and riparian areas (lack of riparian vegetation and lack of stream fencing)
National Monitoring Program (2011)
Southwest Bacteria Main sources are inadequate livestock practices and onsite septic systems
Sources and Mechanisms
Livestock
A common major water quality issue among all regions of the state is the case in which livestock have direct access to streams and creeks. This may arise in pastures where waterways are left unprotected by fencing (inadequate or no fencing, or improperly managed or maintained fencing), combined with a lack of off-stream water sources for livestock (Sheffield et al. 1997). Where livestock have direct access to waterways, water quality is adversely affected by direct inputs of manure, which increase bacteria and nutrient levels in the surface waters on-site and downstream. In cases where riparian vegetation is left unprotected from trampling and overgrazing by livestock, increases in water temperature, turbidity/suspended sediments, nutrients, and bacteria and decreases in dissolved oxygen and altered pH values are often observed (Sheffield et al. 1997; Belsky et al. 1999). This process may be exacerbated during storm events. Areas such as the Walla Walla and Samish Bay watersheds have largely focused on agricultural BMPs that involve installing fences, providing off-stream water sources, and restoring riparian vegetation in areas with livestock (Chapter 7, Walla Walla and Samish Bay sections in this report).

Page 86
Manure Application to Fields
Manure spreading is a common practice used to supply nutrients to croplands. However, water quality may be adversely affected by the rate, timing, and location of applications. For example, recent research showed that the rate and timing of manure applications on grass fields were the prevailing factors affecting nitrate levels in the underlying Sumas-Blaine aquifer (Carey and Harrison 2014). Applications too close to waterways, during the rainy season, or on flooded fields also create conditions in which irrigation ditches and runoff contain elevated fecal coliform (e.g., See Improving Water Quality in the Samish10).
Irrigation Agriculture
Common irrigation practices in Washington include surface irrigation such as furrow and rill irrigation, as well as sprinkler and drip irrigation. Without adequate BMPs, furrow and rill irrigation are generally more susceptible to the erosion and transport of topsoil. Soil erosion from irrigated agriculture has most often impacted water quality in watersheds within the Central and Eastern Regions of the state. In the Lower Yakima River basin, for example, erosion from furrow and rill irrigation has impaired water quality for suspended sediment and turbidity (Chapter 7, Lower Yakima River section). In addition, suspended sediment levels have often been correlated with pesticide levels in surface waters because organochlorine compounds tend to bind strongly to sediment particles. Thus, in agricultural areas where organochlorine compounds have been used extensively as pesticides in the past, such as in the Lower Yakima, sediment loading and pesticide loading in surface waters are often associated. Current BMPs to address water quality issues in the Lower Yakima River basin have included conversion of furrow and rill irrigation systems to sprinkler or drip systems, piping of irrigation ditches and drains, construction of settling ponds, installation of vegetated buffers, and application of a polyacrylamide flocculant. The success of these measures has been demonstrated by decreasing turbidity levels in the Yakima River (Chapter 7, Lower Yakima River section).
Dryland Agriculture
Typical crops grown in non-irrigated (dryland) agriculture systems of Washington include varieties of wheat, barley, and lentils. In these systems, crops rely directly on rainfall. Nonpoint pollution from dryland agricultural areas may result from soil erosion from unprotected fields (for example, with insufficient crop cover during fallow periods, conventional-till practices, or cultivation on highly erosive steep slopes). For example, in sediment-impaired waters of the Hangman and Palouse watersheds, conventional-till agriculture has accounted for the primary source of sediment erosion into surface waters, especially during the storm season (Joy et al. 2009). In these areas, conservation practices such as direct seeding may help to reduce soil loss from fields and improve water quality (See Direct seed benefits observed in recent evaluation11).
10 https://fortress.wa.gov/ecy/publications/publications/0710083.pdf 11 www.ecy.wa.gov/news/2012/155.html

Page 87
Nutrient Fertilizer Application to Fields
Excess nitrogen and phosphorus from over-fertilized fields enter surface waters as stormwater runoff (Ongley 1996). The most common impact that excess nutrients have on aquatic ecosystems occurs through the process of eutrophication (Carpenter et al. 1998). In this process, excess nutrients spur algal growth, creating conditions of elevated pH, low dissolved oxygen (as the excess algae decompose), and, in some cases, nuisance or toxic algae blooms. These conditions impair water quality for aquatic and other wildlife uses, and human uses. Because nitrates are characteristically more mobile in the soil and groundwater, leaching of nitrates into the groundwater has also been an issue (Almasri and Kaluarachchi 2004). In these situations, water quality standards for groundwater and drinking water may be violated. The principal impact from elevated nitrate in groundwater is increased risk of methemoglobinemia or blue baby syndrome, although it can contribute to other health problems as well12.
Legacy Pesticides
In some areas of the state, organochlorine compounds, including DDT, chlordanes, toxaphene, aldrin, dieldrin, and endrin, and endosulfan, were used extensively as pesticides in agricultural areas. Since the 1970s, many of these compounds have been banned for use in the U.S. or are being phased out of production and use as their toxic health effects have become known. Despite the bans, these compounds persist in the environment for decades, owing to the chemical properties that make these compounds difficult to break down. In the Central and Eastern Regions of the state, elevated levels of legacy pesticides in the surface waters have been associated with sediment erosion from agricultural areas (Chapter 7, Walla Walla and Lower Yakima River sections). Many of these compounds bioaccumulate and biomagnify in fish, birds, and other wildlife. In the Yakima Valley, for example, resident fish contain some of the highest DDT concentrations in the U.S. (Rinella et al. 1993; Chapter 7).
Summary
In Washington:
• Agriculture comprises a large portion of the total land area east of the Cascades in Central and Eastern Regions. In these regions, the principal water quality issues are temperature, sediment, nutrients, and pesticide loading.
• In western regions, higher amounts of precipitation lead to more chronic stormwater issues during the wet season.
• Inadequate irrigation practices on erosive soils can contribute to runoff of sediment and legacy pesticides to waterways.
• Livestock access to streams and manure management are common issues to all regions. • Nitrate contamination of groundwater is an issue in the Northwest and Central Regions.
Regional and site-specific agricultural practices and surface-subsurface hydrology are key factors that affect nitrate levels and transport through surface waters and ground waters.
12 www.doh.wa.gov/CommunityandEnvironment/DrinkingWater/Contaminants/Nitrate.aspx

Page 88
Urban and Residential Areas
Nonpoint versus Point Sources
During the last ten years, Ecology has developed and issued a variety of NPDES permits for stormwater in urban, industrial, and residential areas, including permits for municipal sources, industrial sources, construction, and highways. Federal and state regulations specify the areas and activities covered under a permit and, therefore, considered point sources. Permits generally address larger sources, defined by population or acreage for example. Therefore, there are still numerous nonpoint stormwater sources. The principles addressed by the stormwater permits and supporting guidance manuals also apply to nonpoint sources of stormwater. The difference is primarily a matter of magnitude and regulatory jurisdiction.
Pollutants and Impacts
Urban (including commercial, industrial, and residential) areas and non-urban residential areas have long been recognized as one of the top sources of nonpoint pollution across the U.S. (EPA 1984; Carpenter et al. 1988). A mix of land use and human activities typically contribute to overall nonpoint pollution issues in urbanized watersheds and make specific sources difficult to trace. The key transport mechanism involved is stormwater runoff from impervious surfaces, although direct dumping and hydromodification also contribute. The most common pollutants associated with nonpoint pollution in urban areas are fecal coliform, toxic chemicals, suspended sediment and turbidity, and nutrients (Table 8.3). In Washington, studies of nonpoint pollution in urban areas have largely focused on the Northwest Region, particularly in Puget Sound (Table 8.4), but nonpoint issues may occur in any urbanizing area of the state (Chapter 6 in this report).
Table 8.3. Pollutant categories associated with nonpoint pollution from urban areas.
Pollutant Category Typical Sources Impacts
Fecal coliform bacteria Failing or inadequate onsite sewage disposal, pet waste, urban wildlife
Contact recreation, shellfish harvest
Suspended sediment/ Turbidity Erosion from construction or landscaping, road runoff Aquatic life uses,
aesthetics Toxic chemicals (heavy metals, pesticides)
Landscaping chemicals, road runoff, commercial or industrial spills
Human health, aquatic life uses
Nutrients/Dissolved oxygen/pH
Landscaping chemicals, road runoff, commercial or industrial spills, pets, and urban wildlife
Aquatic life uses, aesthetics
Petroleum hydrocarbons Road runoff, commercial or industrial spills Aquatic life uses, aesthetics

Page 89
Table 8.4. Example of literature from Washington relating to nonpoint pollution from urban and residential areas.
References Region Pollutant Category Key Finding
May and Cullinan (2005)
Northwest (Puget Sound) Bacteria
Multiple sources of fecal coliform including failing onsite septic systems, old/failing sewer infrastructure, stormwater runoff, livestock and pet waste, illegal discharges from boats and marinas. Alternatives to “end of pipe” approaches are needed.
EnviroVision Corporation et al. (2008)
Northwest (Puget Sound)
Toxic Chemicals
Residential areas generally contributed the greatest loads because they occupied the greatest land area; commercial and industrial sources and highways had the highest unit area loading rates.
Mohamedali et al. (2011)
Northwest (Puget Sound) Nitrogen
Point (WWTP1) and nonpoint (rivers) sources both contribute significantly to dissolved inorganic nitrogen loading, with WWTP loads more important in summer and river loads exhibiting seasonal variation (greater in fall/winter).
Norton et al. (2011)
Northwest (Puget Sound)
Toxic Chemicals
Contaminants in surface runoff identified as largest contributor of most metal constituents to Puget Sound.
Pearson et al. (2011)
Northwest (Puget Sound) Multiple Urban/Residential development consistently ranked as significant
threat in Puget Sound/Georgia Basin region.
Adams (2013) Southwest Multiple
Main water quality stressors in a small watershed are likely due to urbanization in lower reaches (riparian and channel alteration, stormwater runoff).
1Wastewater treatment plant
Sources and Mechanisms
Urban and Residential Development: Impervious Surfaces and Population Growth
The amount of impervious surfaces in a watershed has long been used as an indicator of stream health and is itself a major contributor to the environmental impacts of urbanization (Klein 1979; Arnold and Gibbons 1996; Beach 2002; Gergel et al. 2002). Impervious surfaces, which prevent the percolation of rainfall, include roads, parking lots, sidewalks, driveways, and roofs built using manufactured materials, as well as compacted soils and bedrock. Stormwater-driven processes that carry pollutants into surface waters are exacerbated in watersheds with high amounts of impervious cover. In addition, changes in hydrology—especially increases in the flashiness of flow—cause erosion, pollutant transport, and degradation of the aquatic habitat. Research over the past 30 years has shown that where imperviousness exceeds about 10% of total watershed area, the watershed’s streams and rivers become degraded (Beach 2002; Booth et al. 2002). In Washington, the Puget Sound region provides the best illustration of land-use change where rapid population growth and urbanization have led to the conversion of forested areas to residential, commercial, and industrial lands. Land-use changes have included substantial increases in total imperviousness, forest loss and fragmentation, and increased road density. These changes are all land use-related factors contributing to water quality issues in Puget Sound (Figure 8.1; Alberti and Bidwell 2005; May and Cullinan 2005). Pollution in urbanized areas of the Puget Sound region is largely driven by polluted stormwater runoff from impervious surfaces. For example, in an urbanizing Puget Sound watershed, May and Cullinan (2005) observed positive correlation between fecal coliform levels (and resulting water quality violations) and the amount of imperviousness in subwatersheds. In other recent Puget Sound studies, stormwater runoff has consistently been

Page 90
identified as the main pollution transport mechanism (Herrera Environmental Consultants 2011; Norton et al. 2011; Pearson et al. 2011; Paulson et al. 2012a).
Figure 8.1. Impervious cover in the Puget Sound region. Figure source: Northwest Indian Fisheries Commission (2012).
An assessment of Section 319 grant-funded projects shows that, relative to other regions of the state, a high proportion (>50%) of projects in Ecology’s Northwest Region are geared toward addressing urban/stormwater issues (Chapter 6 in this report). This is consistent with almost half of the state’s population living in the seven Northwest Region counties. Lake Whatcom, Bear-Evans, and Henderson Inlet watersheds are examples of watersheds currently experiencing rapid population growth and increasing urban and residential development. TMDL studies developed in these watersheds address urban nonpoint pollution sources that contribute to bacteria, total phosphorus, temperature, and dissolved oxygen impairments (Chapter 4).

Page 91
Onsite Septic Systems
In 2007, an estimated 20% of all residential households in the U.S. relied on onsite septic systems that are not served by municipal wastewater systems13. In Washington, a 1990 U.S. Census survey estimated that 31% of households used onsite septic systems14. Based on the same survey data, an estimated 25,000 new systems are installed each year in Washington15. The U.S. Census Bureau has since discontinued this survey; however, the most recent estimate of septic system use in Washington is around 950,000 systems, which includes roughly 600,000 systems in the Puget Sound region (S. Glasoe, Washington State Department of Health, personal communication). Onsite septic system failure is a common problem in watersheds across the U.S. According to Swann (2001), septic system failure may occur in several ways: • Hydraulic failure (hydraulic overloading or clogging of the drainfield or distribution system). • Subsurface plumes (as sewage moves beyond the drainfield/distribution system via soil cracks
or pores). • Treatment failure (mobile nitrate is leached into groundwater because nitrogen is not chemically
reduced in the system).
Although the typical lifespan of a septic system is about 12–20 years, an EPA 2000 nationwide survey indicated that more than half are over 30 years old and that at least 10% have experienced failure (Swann 2001). The definition of septic system failure is interpreted differently among states. In Washington, septic system failure occurs if the system poses a clear public health hazard. Based on this definition, one study estimated that about 1 in 3 septic systems in Washington have experienced failure (Nelson et al. 1999, as cited in EPA 2002). Onsite septic system failure can adversely impact water quality by increasing levels of fecal coliform and dissolved inorganic nitrogen in surface water and groundwater. In the Dungeness watershed in the Southwest Region, bacteria impairment of surface water has resulted in the closure of economically important shellfish harvest beds (Chapter 7, Dungeness section). Bacterial impairment was attributed to multiple nonpoint sources (including onsite septic systems). However, the primary sewage disposal system in residential areas of this watershed is onsite septic systems, and they are a known controllable nonpoint source. As such, much effort in the Dungeness watershed has been placed in repairing, replacing, or decommissioning failing onsite septic systems. According to the TMDLs completed 2005 or later, failing onsite septic systems are suspected to be contributing to bacterial impairment in several urban watersheds, including the Bear-Evans, Henderson Inlet, and Liberty Bay watersheds. Many of the failing septic system problems are associated with older or poorly maintained systems. However, many watersheds are experiencing population growth and residential development, such as areas in the growth fringe around Puget Sound. Here, potential increases in the number of onsite septic systems associated with development outside the sewered urban areas may magnify the issue or hamper efforts to address existing problems of poorly designed or insufficiently maintained systems. 13 http://water.epa.gov/aboutow/owm/upload/2009_06_22_septics_septic_systems_factsheet.pdf 14 www.census.gov/hhes/www/housing/census/historic/sewage.html 15 www.nesc.wvu.edu/septic_idb/washington.htm#septicstats

Page 92
Transportation Systems
Nonpoint and point source pollution from transportation systems comes through runoff from roads, highways, and bridges. Pollutant contributions include:
• Deposition of vehicle exhaust • Petroleum hydrocarbons from vehicle fluids • Heavy metals (copper and zinc) from vehicle brake pads and tire wear (Whiley 2011) • Spills and drippage • De-icing or anti-icing agents • Bacteria in road runoff
A series of studies comprising the Puget Sound Toxics Loading Study have investigated the sources and types of toxic chemicals contributing to pollution of Puget Sound waters (EnviroVision Corporation 2008; Herrera Environmental Consultants 2011). Recent results indicated that, of the types of chemicals sampled, oil and grease and petroleum hydrocarbons accounted for the greatest mass loading to Puget Sound16. However, toxic metals and hydrocarbons from roadways often have had a negative impact disproportionate to their loading, due to chronic or acute effects on salmon and other aquatic species.
Landscaping and Lawn Care
Nutrient fertilizers and pesticides used on lawns, gardens, and landscaping in urban areas may contribute to nonpoint pollution. Excess nutrients from fertilizers may run off into lakes or streams and fuel the growth of algae, which then creates conditions of low dissolved oxygen in water as excess algae decompose. The largely residential Lake Whatcom watershed is a recent example of where problems have been recognized and protective measures have been put in place (Chapter 4). Concerns about increased phosphorus levels and decreased dissolved oxygen are being addressed in a TMDL nearing completion. Also, concerns about nuisance cyanobacteria that clog the drinking water systems in the lake have helped spur county and city ordinances to ban the use of phosphorus-containing lawn fertilizers. In addition, common lawn and garden pesticides that can harm ESA-listed salmon are now banned in some areas. Many residential activities, such as gardening and lawn care, affect local water quality.
Construction Activities
Construction activities within urban areas contribute to nonpoint pollution when runoff from construction areas carries these pollutants into surface waters: • Sediment • Paints and sealers • Concrete • Petroleum products
16 https://fortress.wa.gov/ecy/publications/publications/1103025.pdf

Page 93
Construction activities that may affect water quality include: • Clearing the land and removing vegetation • Exposing sediments during excavation • Compacting soils with heavy machinery and equipment
BMPs implemented for construction activities do not account for a large portion of Section 319 grant-funded projects in Washington; however, they do occur in all regions except Central Region (Chapter 6).
Domestic Animal Waste
Domestic animals, including hobby and game farm animals and dogs, can contribute to elevated levels of fecal coliform in surface water. This can include runoff from confined animal areas, dumping of animal waste, and pet defecation in areas of concentrated pet populations or recreation. In one TMDL case study, the Dungeness watershed, water quality sampling showed that a game farm was contributing substantially to elevated fecal coliform loads (Chapter 7, Dungeness section). Although multiple sources of bacterial nonpoint pollution were suspected in the Dungeness watershed, on-the-ground observations of considerable mismanaged pet waste have led to efforts to clean up known controllable sources. Efforts have included establishing a pet waste management program to install pet waste stations in high-use areas and providing public education and outreach.
Rooftops
Recent investigations in the Puget Sound region have shown that roofs contribute to runoff of heavy metals including zinc, copper, and arsenic (Herrera Environmental Consultants 2011). The type of roof material is an important factor in the constituent and amounts of pollutant runoff (Winters and Graunke 2014).
Hydromodification Hydromodification, a category found widely in EPA NPS guidance, addresses a variety of impacts, ranging from large dams to development in riparian zones. Typical forms of hydromodification include: • Dams and weirs forming reservoirs or ponded areas • Channelized streams • Bank armoring and levees • Bank excavation and removal of riparian vegetation • Streambank and shoreline erosion This category overlaps with many of the other categories, since agriculture, urban and residential development, and forestry can affect riparian zones. However, many hydromodification impacts occur directly from channel modification or from activities on vacant or open space lands. In general, the term “hydromodification” used in this context refers to modifications to the geomorphological channel structure that impair water quality or aquatic habitat. Restoration

Page 94
activities addressing hydromodification may involve a channel “remodification” to restore ecological function. Hydromodification can directly impact aquatic habitat and, as such, can be considered pollution under the Clean Water Act. However, it can also result in secondary impacts to other water quality parameters, such as those described in Table 8.5 and cited in literature such as those listed in Table 8.6. The critical aspects of hydromodification are that: • It can affect any kind of water body – marine, river, stream, lake, or wetland. • It can be associated with almost any kind of land use or human activity. • It impacts the aquatic ecosystem physically, through loss of habitat and ecosystem function. • It also impacts the aquatic ecosystem through the discharge of contaminants from construction,
building materials, erosion, and the lack of a riparian vegetated buffer to prevent the transport of contaminants from overland flow.
Table 8.5. Pollutant categories associated with nonpoint pollution from hydromodification.
Pollutant Category Typical sources Impacts
Temperature Loss of riparian canopy, changes in channel morphology, changes in surface water-groundwater interactions Aquatic life uses
Suspended sediment/ Turbidity Erosion, alteration of transport and deposition dynamics Aquatic life uses
Bacteria, Nutrients/ Dissolved oxygen/pH, Pesticides
Loss of the riparian buffer Aquatic life uses, human health, aesthetics
Table 8.6. Examples of literature from Washington relating to nonpoint pollution from hydromodification.
References Region Pollutant Category Key Finding
Wissmar (2004) Central Turbidity/Suspended
Sediments, Temperature
Management actions should encourage the connectivity of reaches and habitats and maintenance of riparian and fluvial functions
Kahler et al. (2000) Northwest
Toxic Metals And Organic Compounds, Pesticides, Fertilizers, Turbidity/ Suspended Sediments,
Bulkheads, piers, and other overwater structures can increase contaminant levels from construction, treatment of materials, erosion, and overland flow from the nearshore
Northwest Indian Fisheries Commission (2012)
Northwest, Southwest
Turbidity/Suspended Sediments, Bacteria, Nutrients/Dissolved Oxygen/Ph, Pesticides
Shoreline modifications cause erosion, increased water temperatures, and the transport of contaminants

Page 95
Marinas and Recreational Boating Although generally a less pervasive nonpoint issue compared to agriculture and urban/residential areas, the impacts of NPS pollution from marinas and recreational boating can be important in our coastal areas. This is especially true in Puget Sound waters that are poorly flushed and mixed and that contain economically important fish and shellfish areas, marine protected areas, aquatic reserves, and public beaches (Figure 8.2). Proactive measures to help protect water quality in Puget Sound include considerations for a no discharge zone in Puget Sound, which would prohibit any sewage discharges from boats into Puget Sound (Herrera Environmental Consultants, Inc. 2014).
Figure 8.2. Sensitive areas in nearshore areas of Puget Sound. Figure source: Herrera Environmental Consultants, Inc., in Puget Sound No Discharge Zone.
The main pollutants involved are shown in Table 8.7. An example of the literature describing impacts from marine activities is provided in Table 8.8. The specific activities that can lead to nonpoint pollution include: • Direct sewage discharge (bacteria and nutrients) • Oil and fuel spills and drippings (petroleum hydrocarbons) • Antifouling paints used on hulls to prevent attachment of organisms (toxic chemicals,
esp. copper)

Page 96
• Detergents used for cleaning boats (nutrients) • Marina construction activities (sediments) Table 8.7. Pollutant categories associated with nonpoint pollution from marine/boating areas.
Pollutant Category Typical sources Impacts
Fecal coliform bacteria Direct sewage discharge Contact recreation, shellfish harvest
Toxic chemicals (heavy metals, organic toxics)
Anti-fouling paint, solvents, sealers, lubricants
Human health, aquatic life uses
Nutrients from soaps and detergents Direct sewage discharge, boat cleaning Aquatic life uses, aesthetics
Petroleum hydrocarbons Engine fueling and operation, bilge water
Human health, aquatic life uses, aesthetics
Table 8.8. Example of literature from Washington on nonpoint pollution from marina/ boating areas.
References Region Pollutant Category Key Finding
Johnson 2007
Northwest (Puget Sound)
Heavy metals (copper)
Copper concentrations did not meet acute and chronic water quality criteria in inner portions of two Puget Sound marinas, with higher outer marina concentrations during an ebb tide; no evidence of seasonal variation.
Forested Areas About half of Washington’s 43 million acres of land area is forested (Campbell et al. 2010). Accordingly, forest activities that affect water quality in rivers and streams are especially important in Washington. The most significant potential impacts of forest practices are to economically and culturally important anadromous and resident fishes, which require cold and clean waters to thrive. Eight species of salmonids—including all five Pacific salmon—need fresh water, sometimes travelling hundreds of miles during their freshwater migration. Six of the eight (bull trout, Chinook, chum, coho, sockeye, and steelhead) are listed as threatened or endangered under the Endangered Species Act. While multiple human activities affect salmonids at different stages of their life history, human forest activities and their impacts to water quality have undoubtedly played a role in the decline of salmonids in Washington (Northwest Indian Fisheries Commission 2012). The State Department of Natural Resources oversees Washington State’s Forest Practice Rules, which set standards for forest activities that affect water quality and other natural resources. This is the primary mechanism for managing water quality in commercially-owned forests. Most of the impacts described in this section have been addressed by Forest Practice Rules. However, other forested areas may have small acreage, non-commercial, open space, residential, or agricultural uses.
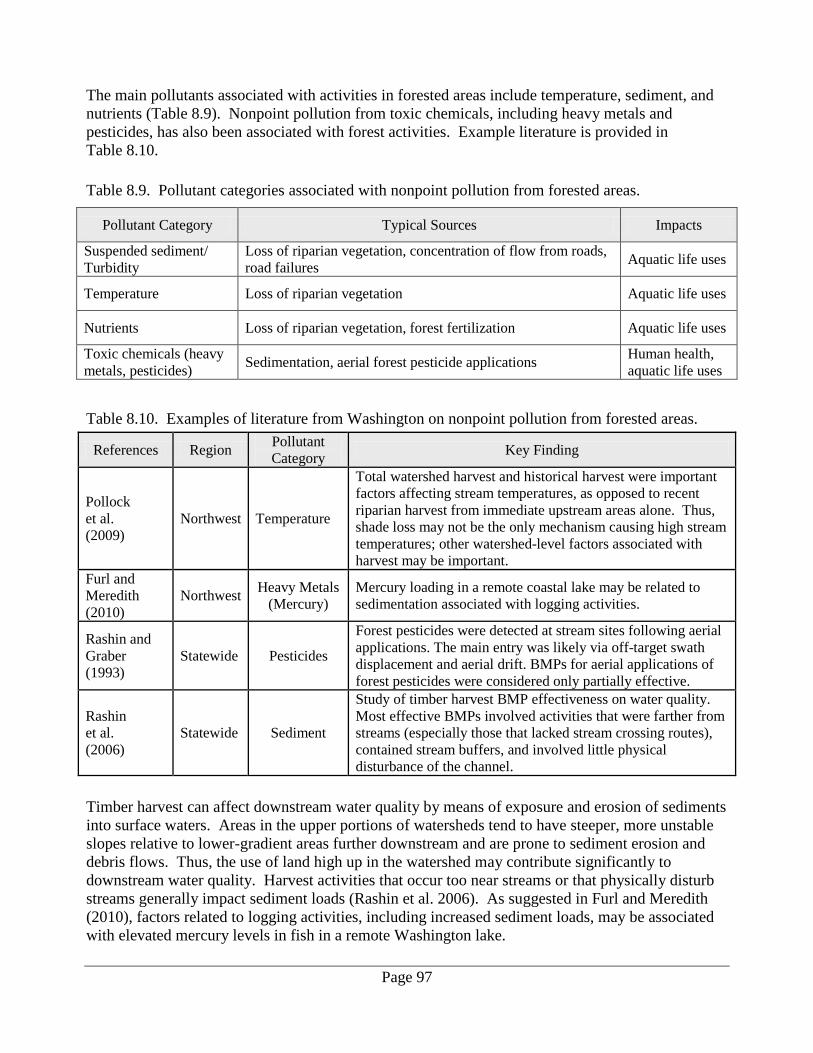
Page 97
The main pollutants associated with activities in forested areas include temperature, sediment, and nutrients (Table 8.9). Nonpoint pollution from toxic chemicals, including heavy metals and pesticides, has also been associated with forest activities. Example literature is provided in Table 8.10.
Table 8.9. Pollutant categories associated with nonpoint pollution from forested areas.
Pollutant Category Typical Sources Impacts
Suspended sediment/ Turbidity
Loss of riparian vegetation, concentration of flow from roads, road failures Aquatic life uses
Temperature Loss of riparian vegetation Aquatic life uses
Nutrients Loss of riparian vegetation, forest fertilization Aquatic life uses
Toxic chemicals (heavy metals, pesticides) Sedimentation, aerial forest pesticide applications Human health,
aquatic life uses
Table 8.10. Examples of literature from Washington on nonpoint pollution from forested areas.
References Region Pollutant Category Key Finding
Pollock et al. (2009)
Northwest Temperature
Total watershed harvest and historical harvest were important factors affecting stream temperatures, as opposed to recent riparian harvest from immediate upstream areas alone. Thus, shade loss may not be the only mechanism causing high stream temperatures; other watershed-level factors associated with harvest may be important.
Furl and Meredith (2010)
Northwest Heavy Metals (Mercury)
Mercury loading in a remote coastal lake may be related to sedimentation associated with logging activities.
Rashin and Graber (1993)
Statewide Pesticides
Forest pesticides were detected at stream sites following aerial applications. The main entry was likely via off-target swath displacement and aerial drift. BMPs for aerial applications of forest pesticides were considered only partially effective.
Rashin et al. (2006)
Statewide Sediment
Study of timber harvest BMP effectiveness on water quality. Most effective BMPs involved activities that were farther from streams (especially those that lacked stream crossing routes), contained stream buffers, and involved little physical disturbance of the channel.
Timber harvest can affect downstream water quality by means of exposure and erosion of sediments into surface waters. Areas in the upper portions of watersheds tend to have steeper, more unstable slopes relative to lower-gradient areas further downstream and are prone to sediment erosion and debris flows. Thus, the use of land high up in the watershed may contribute significantly to downstream water quality. Harvest activities that occur too near streams or that physically disturb streams generally impact sediment loads (Rashin et al. 2006). As suggested in Furl and Meredith (2010), factors related to logging activities, including increased sediment loads, may be associated with elevated mercury levels in fish in a remote Washington lake.
Page 98
The loss of shade through removal of streamside canopy is a well-established mechanism leading to elevated stream temperatures (Wissmar 2004). Other riparian functions and watershed characteristics, including streambank stability, filtration, and surface water-groundwater connectivity can affect stream temperatures (Wissmar 2004). One study found that watershed-level and historic timber harvest activities affected stream temperatures and concluded that sediment transport from upstream, channel shallowing and widening, and loss of large woody debris and surface-groundwater exchange were important factors affecting temperatures (Pollock et al. 2009). High densities of roads, poor construction practices, and lack of maintenance of forest roads have a large impact on water quality (Cederholm et al. 1980; Northwest Indian Fisheries Commission 2012). Road activities can increase sedimentation through: • Soil compaction • Increased runoff from impervious surface road surfaces • Road, culvert, or sidecast failures
Atmospheric Deposition Atmospheric deposition of nitrogen, sulfur, mercury, and toxic compounds such as PCBs and dioxins in surface waters occurs from the fallout of atmospheric emissions of nitrogen oxides, sulfur dioxides, ammonia, mercury, and toxic compounds (Tables 8.11 & 8.12). Fallout may occur as wet deposition, in which emissions react with water vapor in the air and fall as precipitation (e.g., nitric and sulfuric acids—acid rain), or as dry deposition in which emissions fall in gaseous or particulate form. Data for atmospheric deposition are collected by the National Atmospheric Deposition Program17. Emission sources include industrial facilities, vehicle exhaust, and agricultural-related activities (Clow and Campbell 2008), as well as volatilization or open burning of PCB/dioxin-laden materials. Surface water deposition from atmospheric emissions have been found to occur at local, regional, and global scales (Clow and Campbell 2008; Paulson and Norton 2008; Johnson et al. 2010; Johnson et al. 2013). These studies show that the impacts of atmospheric deposition can include increased acidity of surface waters from acid rain, increased dissolved inorganic nitrogen, and increased mercury, PCB, and dioxin levels in fish. Several TMDLs for nutrient-poor, high quality lakes (e.g., Lake Chelan and Whatcom Lake) have shown that atmospheric deposition can be a significant source of phosphorus. Relative to other sources in human-dominated systems, atmospheric deposition typically accounts for a small portion of the load into surface waters (e.g., Mohamedali et al. 2011c). However, the impacts to surface waters in more remote and pristine systems are amplified because these areas are more sensitive to environmental change (Rogora et al. 2006).
17 http://nadp.sws.uiuc.edu/

Page 99
Table 8.11. Pollutant categories associated with nonpoint pollution from atmospheric deposition.
Pollutant Category Typical Sources Impacts
Nitrogen (ammonia, nitrate), Phosphorus, Sulfur dioxide
Vehicle, agricultural, and industrial emissions, wind-borne erosion Aquatic life uses
Mercury Mining, coal burning Human health, aquatic life uses
PCBs, Dioxin, Furans Backyard burning of pollutant-laden trash, volatilization from soils or water Human health, aquatic life uses
Table 8.12. Examples of literature from Washington relating to nonpoint pollution from atmospheric deposition.
References Region Pollutant Category Key Finding
Paulson and Norton (2008)
Northwest Heavy Metals (Mercury)
Deposition from global sources is the likely cause of mercury loading in upper sediments of a freshwater lake, rather than local emissions from a chloro-alkali plant.
Johnson et al. (2013) Eastern
Heavy Metals (Lead, Zinc, Arsenic, Cadmium, Antimony, Mercury)
Transboundary atmospheric deposition from Trail Smelter in British Columbia is a likely source of mercury loading in lakes and wetlands in the Upper Columbia River basin.
Johnson et al. (2010) Statewide PCB, Dioxin
Identification of background (atmospheric) levels of PCB and dioxin compounds in fish and water bodies across WA State. Does not meet human health criteria in some cases.
Natural Sources and Other Sources The state water quality standards define natural conditions as “water quality that was present before any human-caused pollution.” Water quality may be affected by natural sources in addition to human-related sources. For example, birds and wildlife may contribute to locally elevated levels of fecal coliform bacteria in areas where these animals tend to congregate. In coastal areas, this may include seasonal congregations of waterfowl and marine mammals (Chapter 7, Dungeness and Samish sections). In some cases, human activities that attract birds and wildlife may increase the contributions of fecal coliform from the animals (e.g., crop fields that attract birds, feeding birds and wildlife, exposing food and garbage). In these cases, animal sources are not necessarily natural. Natural sources of phosphorus can include weathering of parent geologic materials with naturally high phosphorus content. In coastal rivers, nitrogen-fixing red alder trees may be large contributors to total nitrogen (Wise and Johnson 2011). Sediment resuspension can account for elevated levels of bacteria and other pollutants in the water column overlying sediments with a built-up reservoir of pollutants (Ahmed and Wagner 2008; Jolley et al. 2008; Mathieu 2011). This occurs when activities that disturb the sediments cause the

Page 100
resuspension of sediment-bound pollutants (e.g., wind and currents in coastal areas, livestock, bank erosion in streams, and storm events). Natural sources are typically difficult to separate from human-related sources. Human activities may attract wildlife by providing food or shelter. Geologic instability may be worsened by land-use activities. Clearly, some environmental conditions, such as wetlands, lakes, and estuaries, may be natural features that have always supported wildlife. In the TMDL studies done in Washington, values above criteria under natural conditions are often found for temperature and dissolved oxygen (usually in late summer) and for turbidity (after rain events). However, very few TMDLs have found natural sources to cause increases in bacteria above criteria. Nonetheless, if a TMDL finds natural conditions above criteria, the standards provide mechanisms to ensure that human pollution does not significantly contribute to further degradation of water quality.
Seasonal Considerations Factors related to seasonality (e.g., storm events, streamflows, temperatures) were part of the discussion in much of the nonpoint literature and in the TMDL studies. Stormwater-driven nonpoint pollution is characteristically more of an issue during the wet season. In some cases, the greatest pollutant loads occur during the first major storm event (first flush) when stormwater runoff carries pollutants that have been built up on surfaces during the dry season. In areas that receive high precipitation (e.g., west of the Cascades) and experience chronic sources of nonpoint pollution, stormwater runoff tends to be more problematic. The Samish Bay and Stillaguamish River watersheds in the Northwest Region are examples where fecal coliform loads have been exacerbated after storm events. This study’s TMDL assessments showed that load reductions were required during both the wet and dry seasons. In many cases, the load reductions needed at a given site were greater during the dry season, suggesting nonpoint pollution was not always driven by stormwater runoff processes. The exact reasons are difficult to interpret without delving into location-specific characteristics for each site. The literature review suggests that bacterial impairments during the dry season may occur by means of livestock that have access to streams, excess manure application, failing onsite septic systems, point sources, summertime congregations of birds and wildlife, and low-flow concentration from all sources (Almasri and Kaluarachchi 2004; Bell-McKinnon 2008). Regardless of season, the BMPs needed to address nonpoint issues are generally applicable year-round.
Future Work Washington State’s Water Quality Assessment provides the basis for determining which lakes and rivers meet water quality standards. Category 5 waters—also known as the Clean Water Act Section 303(d) list—are those that require a TMDL or water quality improvement project. The 2012 Water Quality Assessment consisted of 3,672 Category 5 listings. Considering only water criteria, the total number of listings is 2,626 (not including one Water Column Bioassay). This represents 61 WRIAs and 970 uniquely named water bodies. Temperature, bacteria, and dissolved oxygen are the primary pollutant categories (Figure 8.3).

Page 101
Figure 8.3. Number of 2012 Category 5 listings by pollutant category. Includes only listings for water medium.
While both point and nonpoint sources contribute to water quality impairments, the Water Quality Assessment provides the scope of future work for waters affected by NPS pollution. Our assessment of recently developed TMDLs demonstrates that nonpoint sources accounted for a large portion of target pollutant reductions needed to meet water quality standards (Chapter 4 in this report). This report does not assess the relative importance of point vs. nonpoint sources contributing to impairment for the 2012 Category 5 listings. However, it is likely that the contribution of nonpoint sources to Category 5 listings which represent future TMDLs is as least similar to the proportion of nonpoint sources found in past TMDLs. (Experienced staff believe that past TMDLs have focused on point sources, and the remaining listings may disproportionately represent nonpoint sources.) Therefore, nonpoint sources probably comprise a large portion of the pollution causing water quality impairments that have not yet been addressed. This study’s nonpoint assessment also confirms that much work remains to address existing water quality issues and also to sustain improvements previously made (Chapter 7, Lower Yakima, Dungeness, and Samish sections). Multiple land uses contribute to nonpoint pollution that causes elevated levels of fecal coliform, toxic chemicals, temperature, sediment, and nutrients in surface waters. In the western regions, mixed-use watersheds are a common characteristic in which a wide variety of land-use activities (agricultural, urban, forestry, marinas and boating activities) influence

Page 102
overall water quality issues. As such, BMP education and compliance addressing all the relevant land-use activities are needed. Regional differences in the magnitude and extent of various nonpoint sources should also be recognized. For example, agricultural areas largely dominate the landscape in the central and eastern regions and are especially prone to issues with temperature, sediment, and pesticide loading into surface waters. In the Puget Sound region, chronic water quality problems associated with stormwater runoff arise from higher amounts of rainfall and increased imperviousness associated with urban development. In addition, mixed urban land use activities create diverse pollution impacts that include elevated levels of toxic chemicals, bacteria, nutrients, and sediment in surface waters. Projects to identify, quantify, and implement BMPs for NPS pollution must fundamentally take into account regional and local attributes.

Page 103
Conclusions Nationwide, the nonpoint pollution problem has been documented and assessed since at least the 1980s and is still a pervasive water quality problem. The same is true in Washington: nonpoint source (NPS) pollution has been a significant problem in the past and continues to be prevalent across the state. This study has documented these problems through the analysis of:
• Over 40 documents or sources pertaining to nonpoint pollution. • A total of 49 Total Maximum Daily Load (TMDL) reports published from 2005 through 2013. • GIS spatial maps of land use and TMDL nonpoint source pollutant load allocations. • Over 100 Section 319 grants to correct NPS pollution problems. • Four case studies of intensively studied watersheds. Specific water quality issues and impacts from nonpoint pollution have characteristics that are unique to Washington. The magnitude, types, and sources of water quality impairment depend largely on regional and watershed-specific characteristics. The major nonpoint issues in Washington include:
• Temperature problems, sediment erosion, and nutrient and pesticide loading from irrigated and dryland agricultural activities.
• Elevated bacteria levels in rivers and streams and in coastal nearshore areas from mixed land-use activities, including livestock, manure spreading, onsite septic systems, domestic animals, and birds and wildlife. The contamination and closure of shellfish harvest areas is a major impact. Stormwater runoff during the wet season is especially problematic, but dry season contamination is also common.
• Contaminants associated with urban development, especially in the Puget Sound region. High population densities, shoreline development, forest loss, and increased imperviousness create diverse pollution impacts. Stormwater runoff during the wet season is especially problematic. Most categories of contaminants can be present, including bacteria, nutrients, toxic compounds, and sediment.
• Temperature and sediment problems from hydromodification and forest activities, both high up in the watershed and in lowland areas. These activities can cause major impacts to freshwater salmonid habitat.
• In general, hydromodification which can reduce riparian buffers and increase pollutant runoff to receiving waters.
• Nitrate contamination of groundwater from agricultural-related activities.

Page 104
Recommendations Recommendations from this study include:
• Improve the identification, quantification, and prioritization of nonpoint sources as part of developing load allocations and implementation in a TMDL.
• Explore ways to obtain more detailed GIS land-use information and techniques to link that information to pollutant sources and best management practices (BMPs).
• Consider improving reporting under state and federal grants to provide more accurate and consistent information about the nonpoint sources being addressed.
• Consider improving the tracking of water quality enforcement actions to categorize activities as permit-related (under permit or needing a permit) or nonpoint source.
• Continue studying the effectiveness of TMDL and of BMP implementation in controlling the most common and significant sources of nonpoint pollution.
• Provide clearer and more organized and centralized guidance on the toolbox of specific BMPs that match the range of land-use activities and pollutant sources found in Washington.
• Explore ways to improve and present information to the public and the regulated community about the causes and solutions to NPS pollution problems.

Page 105
References
References Cited in the Text Most citations in the text are in this section, but some are in the following section, References from the Literature Database.
Baldwin, K. and A. Stohr. 2007. Walla Walla Watershed Temperature Total Maximum Daily Load: Water Quality Improvement Report. Publication No. 07-10-030, Washington State Department of Ecology. https://fortress.wa.gov/ecy/publications/SummaryPages/0710030.html
Baldwin, K., D. Gray, and J. Jones. 2008. Walla Walla Watershed PCBs, Chlorinated Pesticides, Fecal Coliform, Temperature, pH, and Dissolved Oxygen Total Maximum Daily Load: Water Quality Implementation Plan. Publication No. 08-10-094, Washington State Department of Ecology. https://fortress.wa.gov/ecy/publications/SummaryPages/0810094.html Bohn, G. and J. Creech. 2013. Wilson Creek Sub-Basin Bacteria Total Maximum Daily Load: First Water Quality Post TMDL Monitoring Report. Publication No. 13-10-043, Washington State Department of Ecology. https://fortress.wa.gov/ecy/publications/publications/1310043.pdf Boucher, P.R. 1975. Sediment Transport by Irrigation Return Flows in Four Small Drains within the DID-18 Drainage of the Sulphur Creek Basin, Yakima County, Washington, April 1979 to October 1981. Water Resources Investigations Report 83-4167, U.S. Geological Survey, Tacoma, WA. http://pubs.usgs.gov/wri/1983/4167/report.pdf Boucher, P.R. and M.O. Fretwell. 1982. Irrigation-water Quality in the Sulphur Creek Basin, Yakima and Benton Counties, Washington, April 1976 through March 1977. U.S. Geological Survey Open File Report 81-1008. Tacoma, WA. http://pubs.er.usgs.gov/publication/ofr811008 CH2M Hill. 1975. Characterization of present water-quality conditions in the Yakima Basin. Report to the Washington State Department of Ecology. Technical Bulletin 10. Olympia, WA. Coffin, C., R. Plotnikoff, and R. Anderson. 2006. Lower Yakima River Suspended Sediment Total Maximum Daily Load: Effectiveness Monitoring Report. Publication No. 06-03-014, Washington State Department of Ecology. https://fortress.wa.gov/ecy/publications/SummaryPages/0603014.html Ecology. 1998. Lower Yakima River Suspended Sediment TMDL. Publication No. 98-10-202, Washington State Department of Ecology. https://fortress.wa.gov/ecy/publications/SummaryPages/9810202.html Ecology. 2005. Washington’s Water Quality Management Plan to Control Nonpoint Sources of Pollution - FINAL. Publication No. 05-10-027, Washington State Department of Ecology. https://fortress.wa.gov/ecy/publications/summarypages/0510027.html

Page 106
Embrey, S.S. and E.L. Inkpen. 1998. Nutrient transport in rivers of the Puget Sound Basin, Washington 1980-1993. U.S. Geological Survey Water-Resources Investigation Report 97-4270. http://pubs.usgs.gov/wri/1997/4270/report.pdf EPA. 2002. Onsite wastewater treatment systems manual. U.S. Environmental Protection Agency. http://water.epa.gov/aboutow/owm/upload/2004_07_07_septics_septic_2002_osdm_all.pdf EPA. 2009. National Water Quality Inventory: Report to Congress – 2004 Reporting Cycle. EPA 841-R-08-001, Office of Water, U.S. Environmental Protection Agency. http://water.epa.gov/lawsregs/guidance/cwa/305b/upload/2009_05_20_305b_2004report_report2004pt3.pdf EPA. 2011a. Grants Reporting and Tracking System – GRTS. http://iaspub.epa.gov/apex/grts/f?p=GRTS:199 EPA. 2011b. Memorandum: Preliminary report for the Samish Watershed Microbial Source Tracking (MST) Project. U.S. Environmental Protection Agency. www.skagitcounty.net/PublicWorksCleanWater/Documents/EPA%20MST%20report%20091111.pdf FAO. 1996. Control of water pollution from agriculture – FAO irrigation and drainage paper 55. Food and Agriculture Organization of the United Nations, Rome, Italy. GAO. 2012. Nonpoint Source Water Pollution – Greater Oversight and Additional Data Needed for Key EPA Water Program. Publication No. GAO-12-335, U.S. Government Accountability Office, Washington DC. www.gao.gov/assets/600/591303.pdf
Gray, D., K. Baldwin, and A. Johnson. 2005 (2006). Walla Walla River Chlorinated Pesticides and PCBs Total Maximum Daily Load (Water Cleanup Plan): Submittal Report. Publication No. 05-10-079, Washington State Department of Ecology. https://fortress.wa.gov/ecy/publications/SummaryPages/0510079.html Hempleman, C. and D. Sargeant. 2002. Water Cleanup Plan for Bacteria in the Lower Dungeness Watershed -- Total Maximum Daily Load (TMDL) Submittal Report. Publication No. 02-10-015, Washington State Department of Ecology. https://fortress.wa.gov/ecy/publications/SummaryPages/0210015.html Jamestown S’Klallam Tribe. 2009. Dungeness River Targeted Watershed Initiative Final Report. www.jamestowntribe.org/programs/nrs/TWG_Final%20Report-compressed.pdf
Johnson, A., B. Era-Miller, R. Coots, and S. Golding. 2004. A Total Maximum Daily Load Evaluation for Chlorinated Pesticides and PCBs in the Walla Walla River. Publication No. 04-03-032, Washington State Department of Ecology. https://fortress.wa.gov/ecy/publications/SummaryPages/0403032.html

Page 107
Johnson, A., E. Snouwaert, K. Kinney, and B. Era-Miller. 2007. Palouse River Chlorinated Pesticide and PCB Total Maximum Daily Load: Water Quality Improvement Report and Implementation Plan. Publication No. 07-03-018, Washington State Department of Ecology. https://fortress.wa.gov/ecy/publications/SummaryPages/0703018.html Joy, J. and B. Patterson. 1997. A Suspended Sediment and DDT Total Maximum Daily Load Evaluation Report for the Yakima River. Publication No. 97-321, Washington State Department of Ecology. https://fortress.wa.gov/ecy/publications/SummaryPages/97321.html
Joy, J., T. Swanson, D. Gray, J. Jones, and K. Baldwin. 2006. Walla Walla River Basin Fecal Coliform Bacteria Total Maximum Daily Load: Water Quality Improvement Report. Publication No. 06-10-074, Washington State Department of Ecology. https://fortress.wa.gov/ecy/publications/SummaryPages/0610074.html
Joy, J., G. Pelletier, and K. Baldwin. 2007. Walla Walla River Basin pH and Dissolved Oxygen Total Maximum Daily Load Study: Water Quality Improvement Report. Publication No. 07-03-010, Washington State Department of Ecology. https://fortress.wa.gov/ecy/publications/SummaryPages/0703010.html
Joy, J. and J. Jones. 2012. Little Spokane River Watershed Fecal Coliform Bacteria, Temperature, and Turbidity Total Maximum Daily Load: Water Quality Improvement Report. Publication No. 11-10-075, Washington State Department of Ecology. https://fortress.wa.gov/ecy/publications/publications/1110075.pdf Lawrence, S. 2009. Samish Bay Watershed Fecal Coliform Bacteria Total Maximum Daily Load - Volume 2. Publication No. 09-10-019, Washington State Department of Ecology. https://fortress.wa.gov/ecy/publications/SummaryPages/0910019.html Lee, S. 2008. Bear-Evans Watershed FC TMDL: WQ Improvement Report. Publication No. 08-10-026, Washington State Department of Ecology. https://fortress.wa.gov/ecy/publications/SummaryPages/0810026.html Mathieu, N. and C. James. 2011. Wilson Creek Sub-Basin Bacteria Total Maximum Daily Load (Water Cleanup Plan): Submittal Report. Publication No. 11-10-040, Washington State Department of Ecology. https://fortress.wa.gov/ecy/publications/publications/1110040.pdf Oregon State University. 2011. Molecular Source Tracking Report for Skagit County, Washington. www.skagitcounty.net/PublicWorksCleanWater/Documents/OSU%20MST%20Report%20091111.pdf Rensel, J.E. 2003. Dungeness Bay Bathymetry, Circulation and Fecal Coliform Studies: Phase 2. www.jamestowntribe.org/programs/nrs/2-DungenessBayCircStudy.pdf Rinella, J.F., P.A. Hamilton, S.W. McKenzie. 1993. Persistence of the DDT pesticide in the Yakima River Basin, Washington, USGS Circular: 1090, U.S. Geological Survey. http://pubs.usgs.gov/circ/1993/1090/report.pdf

Page 108
Sargeant, D. 2002. Dungeness River and Matriotti Creek Fecal Coliform Bacteria Total Maximum Daily Load Study. Publication No. 02-03-014, Washington State Department of Ecology. https://fortress.wa.gov/ecy/publications/SummaryPages/0203014.html Sargeant, D. 2004. Dungeness Bay Fecal Coliform Bacteria Total Maximum Daily Load Study. Publication No. 04-03-012, Washington State Department of Ecology. https://fortress.wa.gov/ecy/publications/SummaryPages/0403012.html Skagit County Public Works. 2013. Skagit County Monitoring Program Annual Report - 2012 Water Year (October 2011 – September 2012). www.skagitcounty.net/PublicWorksSurfaceWaterManagement/Documents/2012%20Annual%20Report/2012%20Annual%20Report%20Final.pdf Swanson, T. 2008. Samish Bay Fecal Coliform Bacteria Total Maximum Daily Load: Volume 1, Water Quality Study Findings. Publication No. 08-03-029, Washington State Department of Ecology. https://fortress.wa.gov/ecy/publications/SummaryPages/0803029.html The Cadmus Group. 2010. Dungeness Bay and Dungeness River Watershed Fecal Coliform Total Maximum Daily Load: Water Quality Effectiveness Monitoring Report. Publication No. 10-03-32, Washington State Department of Ecology. https://fortress.wa.gov/ecy/publications/SummaryPages/1003032.html UNEP. 2008. Water Quality for Ecosystem and Human Health, 2nd Edition. United Nations Environment Programme Global Environment Monitoring System (GEMS)/Water Programme, Burlington, Ontario, Canada. Woodruff, D.L., N.K Sather, V.I. Cullinan, and S.L. Sargeant. 2009a. Microbial Source Tracking in the Dungeness Watershed, Washington. Battelle, Richland, WA. www.jamestowntribe.org/programs/nrs/FinalMicrobialSourceTracking_000.pdf Woodruff, D.L., V.I. Cullinan, and J.M. Brandenberger. 2009b. Effectiveness Monitoring of Fecal Coliform Bacteria and Nutrients in the Dungeness Watershed, Washington. Battelle, Richland, WA. www.jamestowntribe.org/programs/nrs/FINAL_EM_RPT(Oct_09)v_2.pdf Zuroske, M., 2009. Water Quality Conditions in Irrigation Waterways within the Roza and Sunnyside Valley Irrigation Districts, Lower Yakima Valley, Washington, 1997-2008. Roza-Sunnyside Board of Joint Control. www.svid.org/images/WQ%20Conditions%20in%20Irrigation%20waterwaysReportFinal.pdf

Page 109
References from the Literature Database This includes the complete list of references compiled as part of the nonpoint literature review (Chapter 3). The list includes references from the peer-reviewed literature, and from secondary sources (e.g., Ecology focus sheets, relevant news articles), but does not include any websites visited.
Author (Publication Year) Title
Adams (2013) Stressor Identification for Peabody Creek (Port Angeles)
Ahmed and Wagner (2008) Oakland Bay, Hammersley Inlet, and Selected Tributaries Fecal Coliform Total Maximum Daily Load, Water Quality Improvement Report and Implementation Plan
Alberti and Bidwell (2005) Assessing the Impacts of Urbanization on Shellfish Growing Areas in Puget Sound
Almasri and Kaluarachchi (2004)
Implications of On-Ground Nitrogen Loading and Soil Transformations on Ground Water Quality Management
Anderson and Newell (2013) Copper in Surface Waters from Urban and Agricultural Watersheds: A Cooperative Study by the Washington State Departments of Ecology and Agriculture
Arnold and Gibbons (1996) Impervious Surface Coverage: The Emergence of a Key Environmental indicator
Bannermanan (2012) Challenges of Achieving Watershed Goals in a Changing Agricultural Environment (Article in Watershed Science Bulletin, Vol 3, Issue 2)
Batts and Seiders (2003) Totten and Eld Inlets Clean Water Projects: Final Report
Beach (2002) Coastal Sprawl: The Effects of Urban Design on Aquatic Ecosystems in the United States
Bell-McKinnon (2008) High Summer Bacteria Concentrations in Streams
Belsky et al. (1999) Survey of Livestock Influences on Stream and Riparian Ecosystems in the Western United States
Beutel et al. (2009) Nitrate Removal in Surface-Flow Constructed Wetlands Treating Dilute Agricultural Runoff in the Lower Yakima Basin, Washington
Beutel et al. (2013) Fecal Coliform Removal in a Lightly Loaded Surface-Flow Constructed Treatment Wetland Polishing Agricultural Runoff
Boistad and Swank (1997) Cumulative Impacts of Land Use on Water Quality in a Southern Appalachian Watershed
Bookter and Mathieu (2013) PBT Trend Monitoring: Measuring Lead in Suspended Particulate Matter, 2012 Results
Booth et al. (2002) Forest Cover, Impervious-Surface Area, and the Mitigation of Stormwater Impacts
Cahoon et al. (2007) Is There a Relationship Between Phosphorus and Fecal Microbes in Aquatic Sediments?
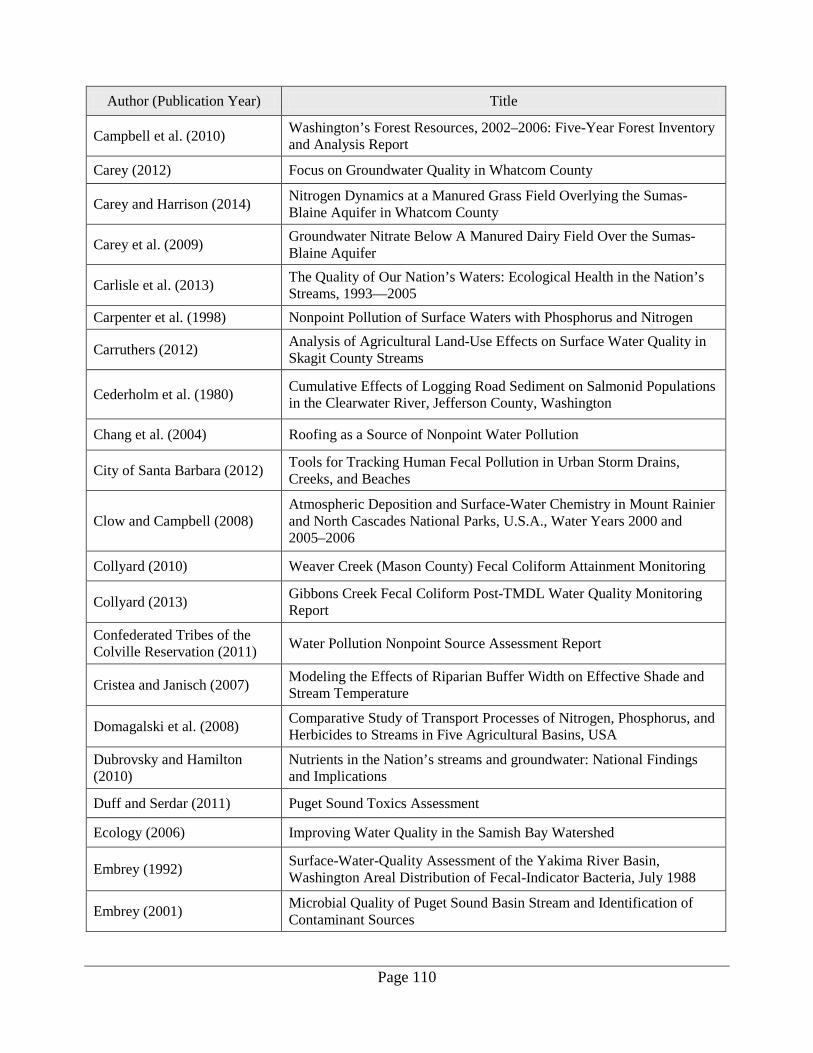
Page 110
Author (Publication Year) Title
Campbell et al. (2010) Washington’s Forest Resources, 2002–2006: Five-Year Forest Inventory and Analysis Report
Carey (2012) Focus on Groundwater Quality in Whatcom County
Carey and Harrison (2014) Nitrogen Dynamics at a Manured Grass Field Overlying the Sumas-Blaine Aquifer in Whatcom County
Carey et al. (2009) Groundwater Nitrate Below A Manured Dairy Field Over the Sumas-Blaine Aquifer
Carlisle et al. (2013) The Quality of Our Nation’s Waters: Ecological Health in the Nation’s Streams, 1993—2005
Carpenter et al. (1998) Nonpoint Pollution of Surface Waters with Phosphorus and Nitrogen
Carruthers (2012) Analysis of Agricultural Land-Use Effects on Surface Water Quality in Skagit County Streams
Cederholm et al. (1980) Cumulative Effects of Logging Road Sediment on Salmonid Populations in the Clearwater River, Jefferson County, Washington
Chang et al. (2004) Roofing as a Source of Nonpoint Water Pollution
City of Santa Barbara (2012) Tools for Tracking Human Fecal Pollution in Urban Storm Drains, Creeks, and Beaches
Clow and Campbell (2008) Atmospheric Deposition and Surface-Water Chemistry in Mount Rainier and North Cascades National Parks, U.S.A., Water Years 2000 and 2005–2006
Collyard (2010) Weaver Creek (Mason County) Fecal Coliform Attainment Monitoring
Collyard (2013) Gibbons Creek Fecal Coliform Post-TMDL Water Quality Monitoring Report
Confederated Tribes of the Colville Reservation (2011) Water Pollution Nonpoint Source Assessment Report
Cristea and Janisch (2007) Modeling the Effects of Riparian Buffer Width on Effective Shade and Stream Temperature
Domagalski et al. (2008) Comparative Study of Transport Processes of Nitrogen, Phosphorus, and Herbicides to Streams in Five Agricultural Basins, USA
Dubrovsky and Hamilton (2010)
Nutrients in the Nation’s streams and groundwater: National Findings and Implications
Duff and Serdar (2011) Puget Sound Toxics Assessment
Ecology (2006) Improving Water Quality in the Samish Bay Watershed
Embrey (1992) Surface-Water-Quality Assessment of the Yakima River Basin, Washington Areal Distribution of Fecal-Indicator Bacteria, July 1988
Embrey (2001) Microbial Quality of Puget Sound Basin Stream and Identification of Contaminant Sources

Page 111
Author (Publication Year) Title
EnviroVision Corporation (2008)
Control of Toxic Chemicals in Puget Sound: Phase 2: Improved Estimates of Loadings from Surface Runoff and Roadways
EPA (1984) Report to Congress: Nonpoint Source Pollution in the U.S.
EPA (1994) National Water Quality Inventory: 1992 Report to Congress
EPA (2001-2009) EPA Guidance for Controlling Nonpoint Source Pollution
Era-Miller et al. (2010) General Characterization of PCBs in South Lake Washington Sediments
Furl and Meredith (2009) Measuring Mercury Trends in Freshwater Fish in Washington State: 2008 Sampling Results
Furl and Meredith (2010) Land-Use Effects on Export and Retention of Mercury in the Lake Ozette Watershed
Furl and Meredith (2011)
Mercury Accumulation in Sediment Cores from Three Washington State Lakes: Evidence for Local Deposition from a Coal-Fired Power Plant. Journal article in the Archives of Environmental Contamination and Toxicology
Furl et al. (2009) Mercury Sources to Lake Ozette and Lake Dickey: Highly Contaminated Remote Coastal Lakes, Washington State, USA
GAO (2012) GAO Assessment of Nonpoint Pollution Program
GAO (2013) Clean Water Act: Changes Needed If Key EPA Program Is to Help Fulfill the Nation’s Water Quality Goals
Gergel et al. (2002) Landscape Indicators of Human Impacts to Riverine Systems
Goonetilleke et al. (2005) Understanding the Role of Land Use in Urban Stormwater Quality Management
Graczyk et al. (2003) Effects of Best-Management Practices in the Black Earth Creek Priority Watershed, Wisconsin, 1984–98
Hallock (2007) Efficiency of Urban Stormwater Best Management Practices: A Literature Review
Harmel et al. (2006) Compilation of Measured Nutrient Load Data for Agricultural Land Uses in the United States
Herrera Environmental Consultants, Inc. (2011)
Control of Toxic Chemicals in Puget Sound: Phase 3 Data and Load Estimates
Herrera Environmental Consultants, Inc. (2014)
Draft Petition to Designate the Waters of Puget Sound as a No Discharge Zone
Howard (2014) Mississippi Basin Water Quality Declining Despite Conservation
Howarth et al. (2002) Sources of Nutrient Pollution to Coastal Waters in the United States: Implications for Achieving Coastal Water Quality Goals
Johnson (2007) Dissolved Copper Concentrations in Two Puget Sound Marinas
Johnson et al. (2006) Chemical Characterization of Stormwater Runoff from Three Puget Sound Boatyards

Page 112
Author (Publication Year) Title
Johnson et al. (2010) An Assessment of the PCB and Dioxin Background in Washington Freshwater Fish, with Recommendations for Prioritizing 303(d) Listings
Johnson et al. (2012) Toxaphene: Improved Recognition in Washington Streams, Rivers, and Lakes
Johnson et al. (2013) Metal Concentrations in Sediments of Lakes and Wetlands in the Upper Columbia River Watershed: Lead, Zinc, Arsenic, Cadmium, Antimony, and Mercury
Jolley et al. (2008) Relationships Between Land Uses and Indicator Bacteria in a Riverine Environment
Jones and Roberts (1998) Shallow Ground-Water Quality Beneath Row Crops and Orchards in the Columbia Basin Irrigation Project Area, Washington
Joy et al. (2009) Hangman (Latah) Creek Watershed Fecal Coliform, Temperature, and Turbidity Total Maximum Daily Load: Water Quality Improvement Report
Kahler et al. (2000) A Summary of the Effects of Bulkheads, Piers, and Other Artificial Structures and Shorezone Development on ESA-listed Salmonids in Lakes
Kallestad (2009) Monitoring Riparian Buffer Functions to Reduce Non-Point Pollution in Pierce County, Clarks Creek, Puyallup
Klein (1979) Urbanization and Stream Quality Impairment
Lawrence and Sweringen (2007)
Improving Water Quality in the Samish: Getting the manure out of streams and shellfish beds
Lubliner (2009) PBDE and Dioxin/Furans in Spokane Stormwater
Marti (2005) Assessment of Surface Water and Groundwater Interchange in the Walla Walla River Watershed
Mathieu (2011) Phase 2: High Summer Bacteria Concentrations in South Puget Sound Streams
Mathieu et al. (2013) Spatial Trends and Factors Affecting Mercury Bioaccumulation in Freshwater Fishes of Washington State, USA
May and Cullinan (2005) An Analysis of Microbial Pollution in the Sinclair-Dyes Inlet Watershed
Mitchell (1996) Our Polluted Runoff
Mohamedali et al. (2011a) South Puget Sound Nitrogen Loading: Magnitudes and Sources
Mohamedali et al. (2011b) Puget Sound Nutrient Loading: Sources and Magnitudes
Mohamedali et al. (2011c) Puget Sound Dissolved Oxygen Model: Nutrient Load Summary for 1999-2008
National Monitoring Program (2011) Totten and Eld Inlet Section 319 National Monitoring Program Project
Nikolaidis et al. (1998) Non-linear Response of a Mixed Land Use Watershed to Nitrogen Loading

Page 113
Author (Publication Year) Title
Northwest Indian Fisheries Commission (2012) 2012 State of Our Watersheds Report
Norton et al. (2011) Control of Toxic Chemicals in Puget Sound Assessment of Selected Toxic Chemicals in the Puget Sound Basin, 2007-2011
Oberrecht (2002) Nonpoint Source Pollution and Pacific Northwest Estuaries
Ongley (1996) Control of Water Pollution from Agriculture - FAO Irrigation and Drainage Paper 55
Onwumere (2007) Willapa River Fecal Coliform Bacteria Verification Study: Water Quality Monitoring Report
Parish and Rhinehart (2008) Beef Cattle Water Requirements and Source Management
Partridge et al. (2009) Urban Waters Initiative, 2007: Sediment Quality in Elliott Bay
Partridge et al. (2010) Urban Waters Initiative, 2008: Sediment Quality in Commencement Bay
Partridge et al. (2013) Sediment Quality in Central Puget Sound, Changes over a Ten-Year Period
Paulson and Norton (2008) Mercury Sedimentation in Lakes in Western Whatcom County, Washington, USA and its Relation to Local Industrial and Municipal Atmospheric Sources
Paulson et al. (2012)
Control of Toxic Chemicals in Puget Sound: Assessment of Selected Toxic Chemicals in the Puget Sound Basin, 2007-2011 - Addendum No. 1: Evaluation of Fate and Transport Mechanisms for Primary Releases of Copper, PCBs, and PBDES
Pearson et al. (2011) Puget Sound Science Update: Chapter 3. Impacts of Natural Events and Human Activities on the Ecosystem
Pollock et al. (2009) Stream Temperature Relationships to Forest Harvest in Western Washington
Preston et al. (2011) Factors Affecting Stream Nutrient Loads: A Synthesis of Regional Sparrow Model Results for the Continental United States
Puckett et al. (2008) Transport and Fate of Nitrate at the Ground-Water/Surface-Water Interface
Puget Sound Partnership (2013)
2013 State of the Sound: A Biennial Report on the Recovery of Puget Sound
Rashin and Graber (1993) Effectiveness of Best Management Practices for Aerial Application of Forest Pesticides
Rashin et al. (2006) Effectiveness of Timber Harvest Practices for Controlling Sediment Related Water Quality Impacts. Article in Journal of the American Water Resources Association, October 2006, p. 1307-1327
Redding (2008) Nitrate Trends in the Central Sumas-Blaine Surficial Aquifer
Ripa et al. (2006) Agricultural Land Use and Best Management Practices to Control Nonpoint Water Pollution
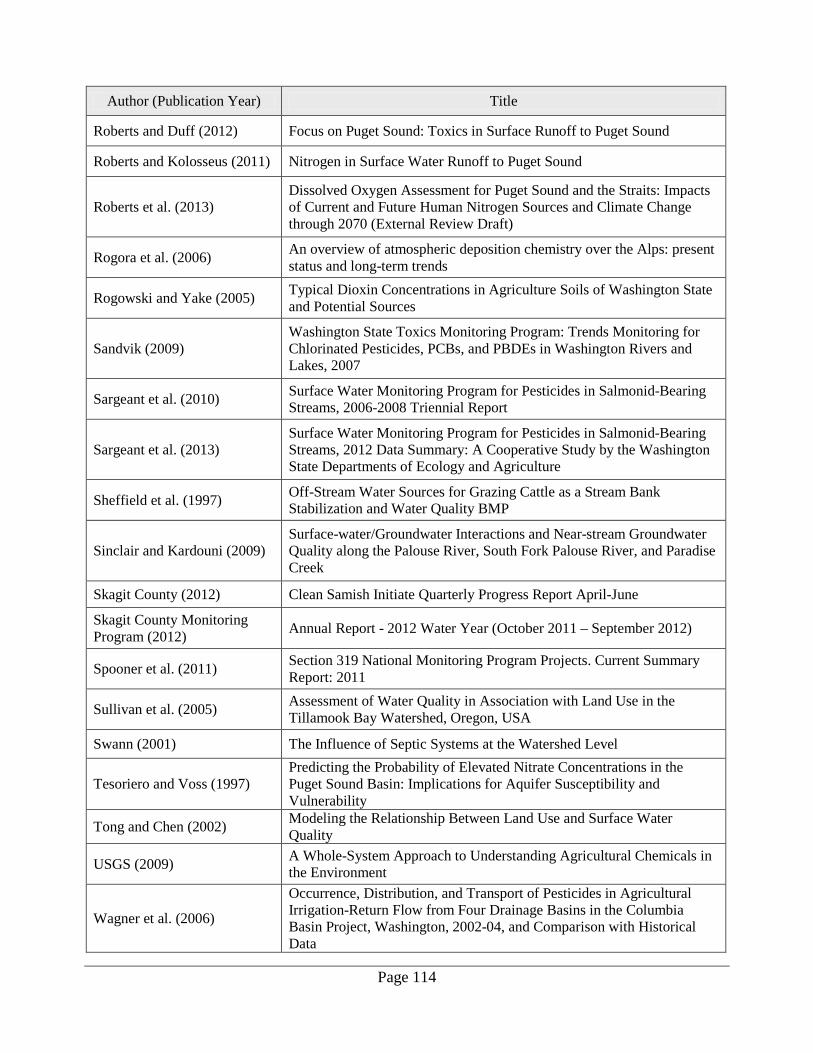
Page 114
Author (Publication Year) Title
Roberts and Duff (2012) Focus on Puget Sound: Toxics in Surface Runoff to Puget Sound
Roberts and Kolosseus (2011) Nitrogen in Surface Water Runoff to Puget Sound
Roberts et al. (2013) Dissolved Oxygen Assessment for Puget Sound and the Straits: Impacts of Current and Future Human Nitrogen Sources and Climate Change through 2070 (External Review Draft)
Rogora et al. (2006) An overview of atmospheric deposition chemistry over the Alps: present status and long-term trends
Rogowski and Yake (2005) Typical Dioxin Concentrations in Agriculture Soils of Washington State and Potential Sources
Sandvik (2009) Washington State Toxics Monitoring Program: Trends Monitoring for Chlorinated Pesticides, PCBs, and PBDEs in Washington Rivers and Lakes, 2007
Sargeant et al. (2010) Surface Water Monitoring Program for Pesticides in Salmonid-Bearing Streams, 2006-2008 Triennial Report
Sargeant et al. (2013) Surface Water Monitoring Program for Pesticides in Salmonid-Bearing Streams, 2012 Data Summary: A Cooperative Study by the Washington State Departments of Ecology and Agriculture
Sheffield et al. (1997) Off-Stream Water Sources for Grazing Cattle as a Stream Bank Stabilization and Water Quality BMP
Sinclair and Kardouni (2009) Surface-water/Groundwater Interactions and Near-stream Groundwater Quality along the Palouse River, South Fork Palouse River, and Paradise Creek
Skagit County (2012) Clean Samish Initiate Quarterly Progress Report April-June
Skagit County Monitoring Program (2012) Annual Report - 2012 Water Year (October 2011 – September 2012)
Spooner et al. (2011) Section 319 National Monitoring Program Projects. Current Summary Report: 2011
Sullivan et al. (2005) Assessment of Water Quality in Association with Land Use in the Tillamook Bay Watershed, Oregon, USA
Swann (2001) The Influence of Septic Systems at the Watershed Level
Tesoriero and Voss (1997) Predicting the Probability of Elevated Nitrate Concentrations in the Puget Sound Basin: Implications for Aquifer Susceptibility and Vulnerability
Tong and Chen (2002) Modeling the Relationship Between Land Use and Surface Water Quality
USGS (2009) A Whole-System Approach to Understanding Agricultural Chemicals in the Environment
Wagner et al. (2006)
Occurrence, Distribution, and Transport of Pesticides in Agricultural Irrigation-Return Flow from Four Drainage Basins in the Columbia Basin Project, Washington, 2002-04, and Comparison with Historical Data

Page 115
Author (Publication Year) Title
Ward (2008) Puyallup and White Rivers Dissolved Oxygen and Temperature Data Summary Report
Washington State Department of Agriculture (2011) Washington Dairies and Digesters
Weakland et al. (2010) Sediment Quality in Bellingham Bay, 2010
Whatcom Clean Water Program (2013)
Whatcom Clean Water Program Quarterly Progress Report October – December 2013
Whatcom County Public Works (2013)
Whatcom County 2012 Water Quality Report and Priority Areas: Fecal Coliform in Coastal Drainages
Whiley (2011) Copper and Zinc Loading Associated with Automotive Brake-Pad and Tire Wear
Winters and Graunke (2014) Roofing Materials Assessment: Investigation of Toxic Chemicals in Roof Runoff
Wise and Johnson (2011) Surface-Water Nutrient Conditions and Sources in the United States Pacific Northwest
Wise et al. (2007) Nutrient and Suspended-Sediment Transport and Trends in the Columbia River and Puget Sound Basins, 1993–2003
Wissmar (2004) Riparian Corridors of Eastern Oregon and Washington: Functions and Sustainability Along Lowland-Arid to Mountain Gradients
Wittman et al. (2013) Evaluation of Land Use and Water Quality in an Agricultural Watershed in the USA Indicates Multiple Sources of Bacterial Impairment

Page 116
Appendices

Page 117
Appendix A. Nonpoint Literature Database Description and Electronic Links Literature and other references compiled during the nonpoint literature review were entered into and stored in an Access database. Spreadsheet formats of the database can be obtained from the following links:
Nonpoint Project References.xlsx Nonpoint Project Reference Summaries.xlsx Note: for final publication, these links will go to files on the Ecology website. The database is an organized compilation of references collected during the literature review (see Section 3). Short annotations are provided for a subset of the literature resources.
Notes: Not all references are strictly nonpoint-focused (e.g., some are water quality/watershed assessment reports); however, all of the references were reviewed to gain better understanding of the status of water quality in Washington State and the nonpoint contributions to pollution. The annotations provided are general descriptions of the main purpose, methods, and findings based on the authors’ of this study (Nonpoint Assessment) interpretation in relevance to assessing the status and causes of nonpoint pollution. The literature records were organized by the following: • Author (Year) • Title • Agency/Organization conducting the study* • Source Type: Academic, Gray, Miscellaneous, or Guidance document ∗ • Ecology Region • Pollutant Focus [if the study focused on a specific pollutant] * • Land Use Focus [if the study focused on a specific land use category/activity] * • Nonpoint Linkages [if linkages between land use and nonpoint pollution were found] * • Tier [See Section 2 for description of tiers] • Summary Included [checkbox of records with short annotations]
∗ This information is not included in the “Nonpoint Project References” table.

Page 118
Appendix B. List of Washington State TMDLs Reviewed
Table B-1. A list of TMDL studies published 2005–2014 from which load allocation and percent reduction data were collected. Source: http://aww.ecology/programs/wq/tmdls/tmdls-approved_count.html
Region WRIA Total Maximum Daily Load Study Publication Date
Publication No.
Central 38 Upper Naches River and Cowiche Creek Temperature 2010 10-10-068
Central 39 Wilson Creek Sub-Basin Bacteria 2005 05-10-041
Central 39 Selah Ditch Multiparameter 2006 06-10-040
Central 45 Wenatchee River Watershed (WRIA 45) Fecal Coliform Bacteria 2007 07-10-009
Central 45 Wenatchee River Watershed Temperature 2007 07-10-045
Central 45 Wenatchee River Watershed Dissolved Oxygen and pH 2008 (2009) 08-10-062
Central 47 Colville National Forest Temperature, Bacteria, and pH 2005 05-10-047
Central 47 Lake Chelan Watershed DDT and PCB 2006 06-10-022
Central 49 Lower Okanogan River Basin DDT and PCBs 2004 (2005) 04-10-043
Eastern 32 Walla Walla River Chlorinated Pesticides and PCBs 2005 05-10-079
Eastern 32 Walla Walla River Basin Fecal Coliform Bacteria 2006 06-10-074
Eastern 32 Walla Walla Watershed Temperature 2007 07-10-030
Eastern 32 Walla Walla River Basin pH and Dissolved Oxygen 2007 07-03-010
Eastern 34 North Fork Palouse River Fecal Coliform 2005 04-10-067
Eastern 34 Palouse River Chlorinated Pesticide and PCB 2007 07-03-018
Eastern 34 South Fork Palouse River Fecal Coliform Bacteria 2009 09-10-060
Eastern 34 Palouse River Fecal Coliform Bacteria 2010 10-10-067
Eastern 34 Palouse Temperature 2013 13-10-020
Eastern 35 Tucannon River and Pataha Creek Temperature 2010 10-10-019
Eastern 41 Mission Creek Watershed DDT 2007 7-10-046
Eastern 54 Spokane River and Lake Spokane Dissolved Oxygen 2007 (2010) 07-10-073
Eastern 55 Little Spokane River Watershed Fecal Coliform Bacteria, Temperature, and Turbidity 2012 11-10-075
Eastern 56 Hangman (Latah) Creek Watershed Fecal Coliform, Temperature, and Turbidity 2009 09-10-030
Eastern 57 Newman Lake Total Phosphorus 2006 (2007) 06-10-045
Northwest 1 Whatcom, Squalicum, and Padden Creeks Temperature 2011 11-10-019
Northwest 1 Lake Whatcom Watershed Total Phosphorus and Bacteria 2013 13-10-012
Northwest 3 Samish Bay Fecal Coliform Bacteria 2008 08-03-029
Northwest 3 Lower Skagit River Tributaries Temperature 2008 08-10-020
Northwest 5 Stillaguamish River Watershed Fecal Coliform, Dissolved Oxygen, pH, Arsenic, and Mercury 2005 05-10-044
Northwest 5 Stillaguamish River Watershed Temperature 2006 6-10-057
Northwest 7 Snoqualmie River Basin Temperature 2011 11-10-041
Northwest 8 Little Bear Creek Water Cleanup Plan for Fecal Coliform Bacteria 2005 05-10-034
Northwest 8 Swamp Creek Fecal Coliform Bacteria 2006 06-10-021

Page 119
Region WRIA Total Maximum Daily Load Study Publication Date
Publication No.
Northwest 8 Bear-Evans Watershed FC 2008 08-10-026
Northwest 8 Bear-Evans Watershed Temperature 2008 08-10-058
Northwest 9 Fauntleroy Creek Fecal Coliform 2007 07-10-037
Northwest 9 Green River Temperature 2011 11-10-046
Northwest 9 Newaukum Creek Temperature 2011 11-10-047
Southwest 10 Clarks Creek Watershed Fecal Coliform 2007 07-10-110
Southwest 10 Puyallup River Watershed Fecal Coliform 2011 11-10-040
Southwest 11 Nisqually River Basin Fecal Coliform Bacteria and Dissolved Oxygen 2005 05-03-002
Southwest 13 Henderson Inlet Watershed Fecal Coliform Bacteria, Dissolved Oxygen, pH, and Temperature 2006 06-03-012
Southwest 14 Oakland Bay, Hammersley Inlet, & Selected Tributaries Fecal Coliform Bacteria 2011 11-10-039
Northwest 15 Sinclair and Dyes Inlets Fecal Coliform Bacteria 2012 11-10-051
Northwest 15 Liberty Bay Watershed Fecal Coliform Bacteria 2013 13-10-014
Southwest 24 Willapa River Watershed Temperature 2005 05-10-073
Southwest 24 Willapa River Fecal Coliform Bacteria 2007 07-03-021
Southwest 28 Salmon Creek Temperature 2011 11-10-044
Southwest 13,14 Tributaries to Totten, Eld, and Little Skookum Inlets - Fecal Coliform Bacteria and Temperature 2006 06-03-007

Page 120
Appendix C. TMDL Database Description and Electronic Link
Data and information collected from TMDL reports published 2005–2014 were entered and stored in an Access database created for this project. The spreadsheet format of TMDL database is provided in the link below. Note: Temperature TMDLs were not entered into this database.
Nonpoint Project-TMDL Data.xlsx Note: for final publication, this link will go to files on the Ecology website. Table C-1. A description of information collected from each TMDL report published 2005-2014.
Information Collected Description
Region Ecology Region: Central, Eastern, Northwest, Southwest WRIA Water Resource Inventory Area Water Body Name Major water body for which TMDL was developed
Tributary Tributary within each major water body Reach Reach or site within each tributary Unique ID* Unique identifier used for data management purposes
EIM Location ID
Name of site found in Ecology’s Environmental Information Management (EIM) database. In some cases, the sites described in the report were not found in EIM. If no EIM match was found, the value was left blank. If a close match was found, the EIM site was verified (if possible) and entered into the database, and a record note was added.
Latitude and Longitude
Coordinate data not included in reports were obtained from EIM or from TMDL authors if possible. Coordinate data were not entered if sites matched with existing TMDL Footprint GIS layer. For some records, coordinate data could not be obtained
Impairment Category General impairment category for each pollutant
Pollutant Pollutant addressed
Critical Period
Critical period for each record in which allocations and reductions were assigned. For this project, critical period was binned into two categories: Wet (Nov-Jun) and Dry (Jul-Oct). If no critical period was assigned, or if the critical period was reported as annual, allocation and reduction data were entered identically for both wet and dry critical periods.
Load Allocation, Wet
Load allocation during the wet critical period. Load allocation = "0" means no impairment. Load allocation = "-" means reduction values were not reported or calculated.
Load Allocation, Dry
Load allocation during the dry critical period. Load allocation = "0" means no impairment. Load allocation = "-" means reduction values were not reported or calculated.
Load Allocation Units Measurement units for load allocation
Reduction, Wet Nonpoint source reduction (%) required to achieve water quality standards during the wet critical period. Reduction value = "0" means no impairment. Reduction value = "NA" means reduction values were not reported or calculated.
Reduction, Dry Nonpoint source reduction (%) required to achieve water quality standards during the dry critical period. Reduction value = "0" means no impairment. Reduction value = "NA" means reduction values were not reported or calculated.
Reduction Units Units for reduction values Footprint Match*
Field used for data management purposes only. Indicates if records from this project match existing TMDL Footprint GIS layer.
Record Notes* Any comments for records *This information is not included the Nonpoint Project- TMDL Data table.

Page 121
Appendix D. Glossary, Acronyms, and Abbreviations Glossary Best Management Practices (BMPs): Physical, structural, or operational practices that, when used singularly or in combination, prevent or reduce pollutant discharges.
Clean Water Act: A federal act passed in 1972 that contains provisions to restore and maintain the quality of the nation’s waters. Section 303(d) of the Clean Water Act establishes the TMDL program.
Coastal Zone Act Reauthorization Amendments (CZARA): 1990 amendments to the Coastal Zone Management Act that, under Section 6217, established the Coastal Nonpoint Pollution Control Program.
Critical Condition: When the physical, chemical, and biological characteristics of the receiving water environment interact with the effluent to produce the greatest potential adverse impact on aquatic biota and existing or designated water uses.
Critical Period: See Critical Condition.
Dissolved Oxygen (DO): A measure of the amount of oxygen dissolved in water.
Effective Shade: Fraction of the total solar radiation heat energy that is prevented from reaching the surface of the water, for example due to topography or vegetation.
Fecal Coliform: That portion of the coliform group of bacteria which is present in intestinal tracts and feces of warm-blooded animals as detected by the product of acid or gas from lactose in a suitable culture medium within 24 hours at 44.5 plus or minus 0.2 degrees Celsius. Fecal coliform bacteria are “indicator” organisms that suggest the possible presence of disease-causing organisms. Concentrations are measured in colony forming units per 100 milliliters of water (cfu/100 mL).
Flocculant: (also known as flocculating agents or flocking agents) chemicals that cause suspended particles in liquids to aggregate or gather together.
Geometric Mean: A mathematical expression of the central tendency (an average) of multiple sample values. A geometric mean, unlike an arithmetic mean, tends to dampen the effect of very high or low values, which might bias the mean if a straight average (arithmetic mean) were calculated. This is helpful when analyzing bacteria concentrations, because levels may vary anywhere from 10 to 10,000 fold over a given period. The calculation is performed by either: (1) taking the nth root of a product of n factors, or (2) taking the antilogarithm of the arithmetic mean of the logarithms of the individual values.
Grants Reporting and Tracking System (GRTS): Primary tool for management and oversight of the EPA’s Nonpoint Source (NPS) Pollution Control Program.
Hydromodification: Alteration of the hydrologic characteristics of coastal and non-coastal waters, which in turn could cause degradation of water resources. Hydromodication activities include channelization and channel modification, dams, and streambank and shoreline erosion.

Page 122
Load Allocation: The portion of a receiving water's load capacity attributed to the existing or future nonpoint sources of pollution and natural background sources.
Load Capacity: The greatest amount of pollutant that a receiving water can assimilate and still meet water quality standards.
Load Reduction: The amount of pollutant, measured as mass, removed or reduced from a discharge source, resulting in a lower mass of pollutant discharged.
National Pollutant Discharge Elimination System (NPDES): National program for issuing, modifying, revoking and reissuing, terminating, monitoring, and enforcing permits, and imposing and enforcing pretreatment requirements under the Clean Water Act. The NPDES program regulates discharges from wastewater treatment plants, large factories, and other facilities that use, process, and discharge water back into lakes, streams, rivers, bays, and oceans.
Nonpoint Source (NPS): Pollution that enters any waters of the state from any dispersed land-based or water-based activities, including but not limited to atmospheric deposition, surface-water runoff from agricultural lands, urban areas, or forest lands, subsurface or underground sources, or discharges from boats or marine vessels not otherwise regulated under the NPDES program. Generally, any unconfined and diffuse source of contamination. Legally, any source of water pollution that does not meet the legal definition of “point source” in Section 502(14) of the Clean Water Act.
Onsite Septic System: Type of sewage treatment and disposal system that is not on a public sewer line.
Parameter: Water quality constituent being measured (analyte). A physical, chemical, or biological property whose values determine environmental characteristics or behavior.
Pathogen: Disease-causing microorganisms such as bacteria, protozoa, and viruses.
pH: A measure of the acidity or alkalinity of water. A low pH value (0 to 7) indicates that an acidic condition is present, while a high pH (7 to 14) indicates a basic or alkaline condition. A pH of 7 is considered to be neutral. Since the pH scale is logarithmic, a water sample with a pH of 8 is ten times more basic than one with a pH of 7.
Point Source: Sources of pollution that discharge at a specific location from pipes, outfalls, and conveyance channels to a surface water. Examples of point source discharges include municipal wastewater treatment plants, municipal stormwater systems, industrial waste treatment facilities, and construction sites that clear more than 5 acres of land.
Pollution: Contamination or other alteration of the physical, chemical, or biological properties of any waters of the state. This includes change in temperature, taste, color, turbidity, or odor of the waters. It also includes discharge of any liquid, gaseous, solid, radioactive, or other substance into any waters of the state. This definition assumes that these changes will, or are likely to, create a nuisance or render such waters harmful, detrimental, or injurious to (1) public health, safety, or welfare, or (2) domestic, commercial, industrial, agricultural, recreational, or other legitimate beneficial uses, or (3) livestock, wild animals, birds, fish, or other aquatic life.

Page 123
Riparian: Relating to the banks along a natural course of water.
Salmonid: Fish that belong to the family Salmonidae. Species of salmon, trout, or char.
Section 319 of the Clean Water Act: Section of the federal Clean Water Act that established the Nonpoint Source Management Program. Enacted under the 1987 Clean Water Act amendments.
Sidecast: During the construction of a logging road, the pushing of waste soil and debris over the downhill side.
Stormwater: The portion of precipitation that does not naturally percolate into the ground or evaporate but instead runs off roads, pavement, and roofs during rainfall or snow melt. Stormwater can also come from hard or saturated grass surfaces such as lawns, pastures, and playfields, and from gravel roads and parking lots.
Total Maximum Daily Load (TMDL): Water cleanup plan. A distribution of a substance in a water body designed to protect it from not meeting (exceeding) water quality standards. A TMDL is equal to the sum of all of the following: (1) individual wasteload allocations for point sources, (2) load allocations for nonpoint sources, (3) the contribution of natural sources, and (4) a Margin of Safety to allow for uncertainty in the wasteload determination. A reserve for future growth is also generally provided.
Total Suspended Solids (TSS): Solid particles that are suspended in water. Often used as a measurement of turbidity.
Turbidity: Measurement of water cloudiness. Higher turbidity levels indicate cloudier waters.
Wasteload Allocation: The portion of a receiving water's load capacity that is allocated to one of its existing or future point sources of pollution (e.g., permitted wastewater treatment facilities).
Watershed: A drainage area or basin in which all land and water areas drain or flow toward a central collector such as a stream, river, or lake at a lower elevation.
303(d) list: Section 303(d) of the federal Clean Water Act requires Washington State to periodically prepare a list of all surface waters in the state for which beneficial uses of the water – such as for drinking, recreation, aquatic habitat, and industrial use – are impaired by pollutants. These are water quality-limited estuaries, lakes, and streams that fall short of state surface water quality standards and are not expected to improve within the next two years.
90th percentile: A statistical number obtained from a distribution of a data set, above which 10% of the data exists and below which 90% of the data exists.
Acronyms and Abbreviations BMP Best Management Practices CAFO Concentrated Animal Feeding Operation CZARA Coastal Zone Act Reauthorization Amendments DDT Dichlorodiphenyltrichloroethane DO Dissolved Oxygen Ecology Washington State Department of Ecology

Page 124
EIM Environmental Information Management database EPA U.S. Environmental Protection Agency ESA Endangered Species Act FAO Food and Agriculture Organization GAO U.S. Government Accountability Office GIS Geographic Information Systems GRTS Grants Reporting and Tracking System NA Not applicable NHD National Hydrography Dataset NOAA National Oceanic and Atmospheric Administration NPDES National Pollutant Discharge Elimination System NPS Nonpoint Source PBDE Polybrominated diphenyl ethers PBT Persistent, Bioaccumulative, and Toxic substance PCB Polychlorinated biphenyl RM River Mile TMDL Total Maximum Daily Load TSS Total Suspended Solids USGS U.S. Geological Survey WRIA Water Resource Inventory Area WWTP Wastewater Treatment Plant