Embed Size (px)
Citation preview

Assessment of OMI near-UV aerosol opticaldepth over landChangwoo Ahn1, Omar Torres2, and Hiren Jethva3
1Science Systems and Applications, Inc., Lanham, Maryland, USA, 2NASA Goddard Space Flight Center, Greenbelt, Maryland,USA, 3Universities Space Research Association, Columbia, Maryland, USA
Abstract This is the first comprehensive assessment of the aerosol optical depth (AOD) product retrievedfrom the near-UV observations by the Ozone Monitoring Instrument (OMI) onboard the Aura satellite. TheOMI-retrieved AOD by the UV aerosol algorithm (OMAERUV version 1.4.2) was evaluated using collocatedAerosol Robotic Network (AERONET) level 2.0 direct Sun AOD measurements over 8 years (2005–2012).A time series analysis of collocated satellite and ground-based AOD observations over 8 years shows nodiscernible drift in OMI’s calibration. A rigorous validation analysis over 4 years (2005–2008) was carried out at44 globally distributed AERONET land sites. The chosen locations are representative of major aerosol typessuch as smoke from biomass burning or wildfires, desert mineral dust, and urban/industrial pollutants.Correlation coefficient (ρ) values of 0.75 or better were obtained at 50% of the sites with about 33% of thesites in the analysis reporting regression line slope values larger than 0.70 but always less than unity. Thecombined AERONET-OMAERUV analysis of the 44 sites yielded a ρ of 0.81, slope of 0.79, y intercept of 0.10,and 65% OMAERUV AOD falling within the expected uncertainty range (largest of 30% or 0.1) at 440 nm.The most accurate OMAERUV retrievals are reported over northern Africa locations where the predominantaerosol type is desert dust and cloud presence is less frequent. Reliable retrievals were documented at manysites characterized by urban-type aerosols with low to moderate AOD values, concentrated in the boundarylayer. These results confirm that the near-UV observations are sensitive to the entire aerosol column. Asimultaneous comparison of OMAERUV, Moderate Resolution Imaging Spectroradiometer (MODIS) DeepBlue, and Multiangle Imaging Spectroradiometer (MISR) AOD retrievals to AERONET measurements was alsocarried out to evaluate the OMAERUV accuracy in relation to those of the standard aerosol satellite products.The outcome of the comparison indicates that OMAERUV, MODIS Deep Blue, and MISR retrieval accuracies inarid and semiarid environments are statistically comparable.
1. Introduction
Reliable information of global aerosol optical properties from satellites is critical for climate studies and forthe assessment of aerosol transport models. The accurate characterization of the aerosol load is also requiredfor trace gas remote sensing and air quality applications [Al-Saadi et al., 2005; Kinne et al., 2006; Leitão et al.,2010; Ridley et al., 2012; van Donkelaar et al., 2010; Wang and Christopher, 2003; Zhang et al., 2008]. Modernspaceborne aerosol sensing instruments such as the Moderate Resolution Imaging Spectroradiometer(MODIS), the Multiangle Imaging Spectroradiometer (MISR), the Polarization and Directionality of the EarthReflectances (POLDER), and the Cloud-Aerosol Lidar with Orthogonal Polarization (CALIOP) probe theatmosphere with the purpose of characterizing aerosol physical properties and amounts. This is accom-plished by the use of multiwavelength (MODIS), multiangle (MISR), and polarization (POLDER) observationsand retrieval algorithms. Based on the measurements by these sensors, a great progress has been made overthe last decade in the understanding of the global aerosol distribution, aerosol sources, and the impact ofatmospheric particulates on the Earth’s radiation budget [Deuzé et al., 2001; Kaufman et al., 1997; Martonchiket al., 1998;Winker et al., 2006; Xu et al., 2013; Zhang and Christopher, 2003]. With each sensor having its ownstrengths and limitations when retrieving aerosol properties, multiple sensor observations are highlyrecommended in order to complement the limitations and increase synergy effects [King et al., 1999;Schoeberl et al., 2006; Stephens et al., 2002]. To this end, the Ozone Monitoring Instrument (OMI) onboard theEOS-Aura satellite, part of the A-train satellite constellation [Levelt et al., 2006; Stephens et al., 2002], has theunique advantage of providing information on aerosol optical properties by making use of the large sensi-tivity to aerosol absorption in the near-ultraviolet (UV) spectral region. Another important advantage is the
AHN ET AL. ©2014. The Authors. 2457
PUBLICATIONSJournal of Geophysical Research: Atmospheres
RESEARCH ARTICLE10.1002/2013JD020188
Key Points:• OMI AOD is comparable with AERONET,MODISDeep Blue, andMISR AOD values
• Adequate sensitivity of UV remote sens-ing to aerosols in the boundary layer
Correspondence to:C. Ahn,[email protected]
Citation:Ahn, C., O. Torres, and H. Jethva (2014),Assessment of OMI near-UV aerosol op-tical depth over land, J. Geophys. Res.Atmos., 119, 2457–2473, doi:10.1002/2013JD020188.
Received 23 MAY 2013Accepted 18 JAN 2014Accepted article online 23 JAN 2014Published online 7 MAR 2014
This is an open access article under theterms of the Creative CommonsAttribution-NonCommercial-NoDerivsLicense, which permits use and distri-bution in any medium, provided theoriginal work is properly cited, the use isnon-commercial and no modificationsor adaptations are made.
https://ntrs.nasa.gov/search.jsp?R=20150008249 2020-05-30T07:45:55+00:00Z

low near-UV surface albedo at all terrestrial surfaces which reduces the error associated with land surfacereflectance characterization.
In spite of the 13 × 24 km2 coarse sensor footprint designed for the monitoring of atmospheric trace gascomposition using hyperspectral measurements, the OMI observations in the near UV (354 and 388 nm) canbe used to retrieve aerosol optical depth and single-scattering albedo under cloud-free conditions. TheOMI aerosol retrieval capability draws on heritage from the Total Ozone Mapping Spectrometer series ofinstruments [Torres et al., 1998, 2002a]. Two aerosol algorithms are applied to the OMI observations: amultiwavelength inversion (OMAERO) and a two near-UV channel (OMAERUV). The OMAERO algorithm,developed and maintained by the Royal Netherlands Meteorological Institute (KNMI), uses a spectral fittingmethod described by Torres et al. [2007]. The OMAERUV algorithm produces the absorbing aerosol index,aerosol extinction optical depth (AOD), aerosol absorption optical depth (AAOD), and single-scatteringalbedo (SSA) from the observations at 354 and 388 nm [Torres et al., 2007, 2013]. The focus of this paper isthe assessment of OMAERUV AOD retrievals.
The OMI AOD and SSA retrievals by the initial OMAERUV algorithm have been previously evaluated with
AERONET (Aerosol Robotic Network) observations [Torres et al., 2007]. The OMI AOD retrievals were also
compared to MODIS andMISR observations [Ahn et al., 2008] showing agreement in terms of seasonal annual
cycles over most of the major emission sources of carbonaceous aerosols from biomass burning and mineral
dust from deserts. However, the magnitude of OMI AOD after accounting for differences in reporting wave-
length was generally higher than those of MODIS and MISR.
Since those early evaluations, OMI calibration has been updated [Dobber et al., 2008], and important algo-rithm improvements have been implemented in OMAERUV [Torres et al., 2013]. The carbonaceous aerosolmodel was replaced with a new model that accounts for the presence of organic carbon as an importantabsorbing agent of aerosols generated by biomass burning and wildfires [Jethva and Torres, 2011]. Otherimprovements include the development of a CALIOP-based aerosol layer height climatology and the use ofAtmospheric Infrared Sounder carbon monoxide real-time observations to distinguish smoke from dust-typeaerosols [Torres et al., 2013]. A detailed description of these upgrades and other algorithm modifications isgiven by Torres et al. [2013].
The preliminary evaluations of OMAERUV’s performance after these upgrades have been documented.The CALIOP-derived climatology of aerosol layer height improved the retrieval performances in the rangeof 5–20% [Torres et al., 2013] in terms of the expected uncertainty envelope (0.1 or ±30%). A significant im-provement in the AOD retrieval performance over South America was reported by Jethva and Torres [2011]after accounting for the spectral dependence of carbonaceous aerosol absorption properties in the forwardcalculations used in the lookup tables.
In this paper, we carry out a more extensive evaluation of OMAERUV AOD by comparing to ground-basedobservations as well as to other satellite AOD products over land.
The aim of this paper is to document the improvements of the OMAERUV AOD product (version 1.4.2) bydirect evaluation using space and time-collocated comparisons to independent AOD data sets such as theAerosol Robotic Network as well as the Aqua-MODIS Deep Blue (MODIS DB) and Terra-MISR AOD products.
A general description of the data sets in the comparative analysis and a detailed discussion of the spatial andtemporal collocation of satellite and ground-based observations are presented in section 2. In section 3, wefirst examine the OMAERUV AOD record over the full complete 8 years of OMI operation (2005–2012) toassess the long-term stability of the satellite observations. This is done by comparing the daily AOD valuesfrom the OMI observations to the AERONET level 2.0 AOD data at five selected sites. A more comprehensiveevaluation is then carried out at 44 AERONET sites over 4 years (2005–2008). In section 4, we further assess theOMI AOD retrievals in 2007 over desert areas by comparisons with other satellite products reporting AODover bright land surfaces including the MODIS DB, MISR, and OMAERO AOD products. This is the first time thetwo OMI aerosol algorithms are intercompared. All the satellite retrievals in this analysis are independentlyvalidated using AERONET observations, and the resulting statistics are intercompared. This intersatelliteanalysis is carried out primarily over northern Africa including the Saharan desert and Sahel regions wherelarge-scale dust storm and smoke from biomass burning events typically take place under favorable cloud-free conditions. The final section provides a summary of results and discusses future work.
Journal of Geophysical Research: Atmospheres 10.1002/2013JD020188
AHN ET AL. ©2014. The Authors. 2458

2. Data Sets and Methodology2.1. OMAERUV Data
The OMAERUV level 2 daily files are available at the Goddard Earth Sciences Data and Information ServicesCenter (GES DISC) site (http://disc.sci.gsfc.nasa.gov/Aura/data-holdings/OMI/omaeruv_v003.shtml). Theretrieved values of AOD, AAOD, and SSA are reported at 388 nm. Similar values are also reported at 354 and500 nm by conversion from the 388 nm retrieval. The wavelength conversions from 388 nm to 354 and500 nm are done using the spectral dependence associated with the assumed aerosol particle size distri-bution and retrieved absorption information [Torres et al., 2007; Jethva and Torres, 2011].
The final quality flag parameter in the OMAERUV level 2 files is a quality assurance (QA) flag that indicates thelevel of confidence on the retrieved parameters with regard to the interference of subpixel size cloud pres-ence. Best retrievals, i.e., minimally affected by subpixel cloud contamination, have a QA flag of 0 and aredeemed suitable for scientific use.
The OMI has undergone an instrumental problem, the so-called “row anomaly,” since mid-2007, and this hasaffected almost half of the 60 rows in a cross-track directionwith unpredictable patterns, depending on seasonsand latitudes up to present (2013). With our best knowledge, these affected rows have been flagged and filteredout before making comparisons in this study. A more detailed description of the OMI row anomaly is availableat http://www.knmi.nl/omi/research/product/rowanomaly-background.php
2.2. AERONET Data
The AERONET project [Holben et al., 1998] is a robotic network of globally distributed ground-based CimelSun photometers. The sensors are automatically operated to measure solar irradiance and sky radiances inorder to provide quality-assured aerosol optical properties needed for validation of satellite retrievals andassessment of model calculations. Standard AODs from the direct Sun measurements are available nominallyat 340, 380, 440, 500, 675, 870, and 1020 nm. The calibration of the AERONET Sun photometers is maintainedregularly by comparing the well-calibrated reference Cimel instruments at the Goddard Space Flight Centerwith the Langley method used at the Mauna Loa Observatory in Hawaii.
2.3. Other Satellite Data Sets
MISR measures the upwelling short-wave radiance at the top of the atmosphere in four spectral bandscentered at 446, 558, 672, and 866 nm. Measurements are obtained at each of nine view angles along the
Figure 1. Global locations of the selected 44 AERONET sites used for comparisons with OMI AOD. Colors indicate the per-cent (Q) of daily OMI-matched AOD values falling within the uncertainty envelope of ±30% or 0.1 AOD (green circle:Q≥ 70%, blue circle: 60%≤Q< 70%, pink circle: 50%≤Q< 60%, and red circle: Q< 50%) in scatterplots (see details in text).The site ID numbers are roughly arranged from the north to the south and from the west to the east directions for con-venience. The site names and geolocations for each site ID are shown in Table 1.
Journal of Geophysical Research: Atmospheres 10.1002/2013JD020188
AHN ET AL. ©2014. The Authors. 2459
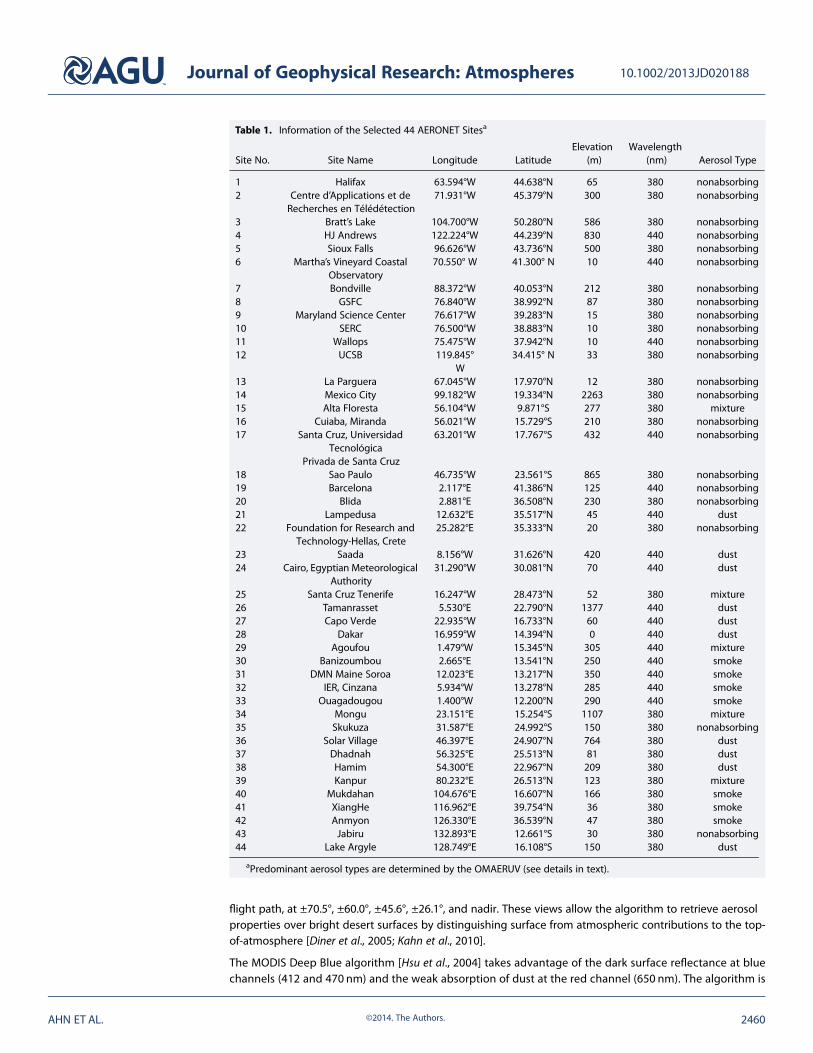
flight path, at ±70.5°, ±60.0°, ±45.6°, ±26.1°, and nadir. These views allow the algorithm to retrieve aerosolproperties over bright desert surfaces by distinguishing surface from atmospheric contributions to the top-of-atmosphere [Diner et al., 2005; Kahn et al., 2010].
The MODIS Deep Blue algorithm [Hsu et al., 2004] takes advantage of the dark surface reflectance at bluechannels (412 and 470 nm) and the weak absorption of dust at the red channel (650 nm). The algorithm is
Table 1. Information of the Selected 44 AERONET Sitesa
Site No. Site Name Longitude LatitudeElevation
(m)Wavelength
(nm) Aerosol Type
1 Halifax 63.594°W 44.638°N 65 380 nonabsorbing2 Centre d’Applications et de
Recherches en Télédétection71.931°W 45.379°N 300 380 nonabsorbing
3 Bratt’s Lake 104.700°W 50.280°N 586 380 nonabsorbing4 HJ Andrews 122.224°W 44.239°N 830 440 nonabsorbing5 Sioux Falls 96.626°W 43.736°N 500 380 nonabsorbing6 Martha’s Vineyard Coastal
Observatory70.550° W 41.300° N 10 440 nonabsorbing
7 Bondville 88.372°W 40.053°N 212 380 nonabsorbing8 GSFC 76.840°W 38.992°N 87 380 nonabsorbing9 Maryland Science Center 76.617°W 39.283°N 15 380 nonabsorbing10 SERC 76.500°W 38.883°N 10 380 nonabsorbing11 Wallops 75.475°W 37.942°N 10 440 nonabsorbing12 UCSB 119.845°
W34.415° N 33 380 nonabsorbing
13 La Parguera 67.045°W 17.970°N 12 380 nonabsorbing14 Mexico City 99.182°W 19.334°N 2263 380 nonabsorbing15 Alta Floresta 56.104°W 9.871°S 277 380 mixture16 Cuiaba, Miranda 56.021°W 15.729°S 210 380 nonabsorbing17 Santa Cruz, Universidad
TecnológicaPrivada de Santa Cruz
63.201°W 17.767°S 432 440 nonabsorbing
18 Sao Paulo 46.735°W 23.561°S 865 380 nonabsorbing19 Barcelona 2.117°E 41.386°N 125 440 nonabsorbing20 Blida 2.881°E 36.508°N 230 380 nonabsorbing21 Lampedusa 12.632°E 35.517°N 45 440 dust22 Foundation for Research and
Technology-Hellas, Crete25.282°E 35.333°N 20 380 nonabsorbing
23 Saada 8.156°W 31.626°N 420 440 dust24 Cairo, Egyptian Meteorological
Authority31.290°W 30.081°N 70 440 dust
25 Santa Cruz Tenerife 16.247°W 28.473°N 52 380 mixture26 Tamanrasset 5.530°E 22.790°N 1377 440 dust27 Capo Verde 22.935°W 16.733°N 60 440 dust28 Dakar 16.959°W 14.394°N 0 440 dust29 Agoufou 1.479°W 15.345°N 305 440 mixture30 Banizoumbou 2.665°E 13.541°N 250 440 smoke31 DMN Maine Soroa 12.023°E 13.217°N 350 440 smoke32 IER, Cinzana 5.934°W 13.278°N 285 440 smoke33 Ouagadougou 1.400°W 12.200°N 290 440 smoke34 Mongu 23.151°E 15.254°S 1107 380 mixture35 Skukuza 31.587°E 24.992°S 150 380 nonabsorbing36 Solar Village 46.397°E 24.907°N 764 380 dust37 Dhadnah 56.325°E 25.513°N 81 380 dust38 Hamim 54.300°E 22.967°N 209 380 dust39 Kanpur 80.232°E 26.513°N 123 380 mixture40 Mukdahan 104.676°E 16.607°N 166 380 smoke41 XiangHe 116.962°E 39.754°N 36 380 smoke42 Anmyon 126.330°E 36.539°N 47 380 smoke43 Jabiru 132.893°E 12.661°S 30 380 nonabsorbing44 Lake Argyle 128.749°E 16.108°S 150 380 dust
aPredominant aerosol types are determined by the OMAERUV (see details in text).
Journal of Geophysical Research: Atmospheres 10.1002/2013JD020188
AHN ET AL. ©2014. The Authors. 2460

especially designed to provide AOD over the bright surfaces including desert areas for which the MODISstandard dark land target aerosol algorithm fails to retrieve reliable aerosol products [Kaufman et al., 1997;Chu et al., 2002; Levy et al., 2010]. With enough cross-track swath coverage (2330 km) comparable to that ofOMI (2600 km), this product is useful for comparison with OMI AOD, especially over desert areas where notonly the most intense dust storms usually take place but have limited observations and retrievals.
The OMAERO multiwavelength algorithm is based on the spectral information in the near UV and thevisible of 14 wavelength bands, which are about 1 nm wide and are located at 342.5, 367.0, 376.5, 388.0,399.5, 406.0, 416.0, 425.5, 436.5, 442.0, 451.5, 463.0, and 477.0 nm. The precision in the retrieved AOD isgiven in terms of the retrieval error of the nonlinear fitting routine; the QA flags however are not provided(OMAERO Readme file available at http://disc.sci.gsfc.nasa.gov/Aura/data-holdings/OMI/omaero_v003.shtml). The OMAERO algorithm uses no external constraints on aerosol plume height and aerosol type. Thederived spectral aerosol optical depth however depends strongly on these parameters which are providedwith the best fitting aerosol type [Torres et al., 2007].
Level 2 files and related documents for AOD products from other satellite-borne sensors are available from theNASA data centers as follows: the level 1 and Atmosphere Archive and Distribution System site (http://ladsweb.nascom.nasa.gov/data/search.html) for the Aqua/MODIS Deep Blue AOD product (collection 5.1; MYD04_L2),designated asMODIS DB in this study, the Langley Atmospheric Science Data Center site (http://eosweb.larc.nasa.gov/PRODOCS/misr/table_misr.html) for the Terra MISR AOD product (version 22), and the GES DISC (http://disc.sci.gsfc.nasa.gov/Aura/data-holdings/OMI/omaero_v003.shtml) for the OMAERO AOD product version 1.2.3.1.
2.4. OMAERUV-AERONET Collocation
The OMI AOD values with a QA flag of 0 were collocated in space and time with AERONET version 2.0 level 2.0
(cloud screened and calibrated) direct Sunmeasurements. The comparative analysis was carried over a 4 year
period from 2005 to 2008 at the 44 AERONET sites. These locations and detailed information of the sites are in
Figure 1 and Table 1.
Figure 2. Pie charts of three aerosol types identified from the OMI overpass data at the selected 12 AERONET sites for4 years (2005–2008). Each aerosol type is shown as red (smoke), blue (dust), and gray color (nonabsorbing aerosols).
Journal of Geophysical Research: Atmospheres 10.1002/2013JD020188
AHN ET AL. ©2014. The Authors. 2461

The site selection criteria take into account the regionally dominant aerosol type as well as the availability ofmultiyear records. This will adequately evaluate the algorithm capability of capturing both the seasonal andinterannual variability. The predominant aerosol type in Table 1 was determined from the statistics of thethree aerosol types (i.e., smoke, dust, and urban/industrial) used in OMAERUV [Torres et al., 2007]. Examples ofthe observed statistics are shown in Figure 2 for some of the selected sites. The occurrence of absorbingaerosols (i.e., dust and smoke) is generally seasonal. The predominant aerosol type is determined based onthe following criteria: (i) nonabsorbing aerosol site when urban/industrial aerosols are present over 70% ofthe time and (ii) dust or smoke sites when either dust or smoke has a frequency of occurrence larger than40%. All other instances of aerosol occurrence are labeled as a mixture in Table 1.
Figure 3. (a) AOD time series plot over the five sites for 8 years (2005–2012). Red open circles are daily OMI AOD values corre-sponding to those from AERONET (blue solid circles). (b) Time series of AOD differences (OMI-AERONET) for 8 years (2005–2012).
Journal of Geophysical Research: Atmospheres 10.1002/2013JD020188
AHN ET AL. ©2014. The Authors. 2462

At sites where AERONET reports measurements at 380 nm, the satellite 388 nm retrieval was directlycompared to the 380 nm surface observation. Over those locations where 380 nm measurements arenot available, the comparison was made at the shortest available wavelength, generally 440 nm. TheOMI 440 nm AOD was obtained by linearly interpolating between the OMAERUV reported 388 and
Table 2. Summary Statistics of OMI AOD Versus AERONET AOD Over 4 Years (2005–2008)a
Site No. N avg± (SE) SDEV2 SDEV1 Q RMSE y intercept Slope ρ
(a) Sites with 380nm35 338 0.08 (0.01) 0.12 0.20 80.18 0.11 0.08 0.74 0.8210 132 0.06 (0.01) 0.10 0.15 80.3 0.09 0.04 0.80 0.8020 326 0.11 (0.01) 0.12 0.20 60.74 0.11 0.01 0.73 0.799 234 0.06 (0.01) 0.09 0.13 83.33 0.08 0.04 0.83 0.798 294 0.07 (0.01) 0.10 0.15 81.3 0.09 0.06 0.73 0.7739 193 0.21 (0.02) 0.25 0.32 53.37 0.25 0.01 0.85 0.7515 106 0.15 (0.02) 0.18 0.42 61.32 0.17 0.12 0.92 0.9141 314 0.15 (0.01) 0.22 0.45 65.61 0.17 0.09 0.67 0.8716 161 0.15 (0.02) 0.22 0.37 57.76 0.16 0.12 0.59 0.8040 133 0.20 (0.02) 0.23 0.36 49.62 0.16 0.13 0.52 0.7842 71 0.15 (0.03) 0.24 0.36 71.83 0.17 0.14 0.54 0.7534 146 0.14 (0.02) 0.21 0.30 56.16 0.15 0.10 0.55 0.7444 543 0.08 (0.01) 0.11 0.14 78.64 0.11 0.07 0.75 0.7012 205 0.07 (0.01) 0.10 0.13 73.66 0.09 0.08 0.61 0.681 158 0.11 (0.01) 0.12 0.12 59.5 0.12 0.11 0.86 0.677 183 0.09 (0.01) 0.10 0.12 68.85 0.09 0.10 0.68 0.6618 101 0.13 (0.02) 0.17 0.23 53.47 0.13 0.12 0.50 0.662 94 0.11 (0.01) 0.13 0.13 62.77 0.13 0.10 0.82 0.6438 255 0.15 (0.01) 0.18 0.19 50.98 0.17 0.18 0.72 0.6343 253 0.12 (0.01) 0.16 0.13 62.05 0.15 0.09 0.93 0.6222 309 0.10 (0.01) 0.13 0.14 66.02 0.12 0.08 0.71 0.6136 461 0.31 (0.01) 0.20 0.19 17.79 0.19 0.38 0.76 0.613 190 0.11 (0.01) 0.13 0.13 59.47 0.12 0.13 0.69 0.6013 158 0.16 (0.01) 0.17 0.14 44.3 0.17 0.17 0.79 0.575 244 0.09 (0.01) 0.12 0.11 72.13 0.11 0.10 0.69 0.5714 90 0.22 (0.03) 0.30 0.33 47.78 0.20 0.30 0.33 0.4825 72 0.18 (0.03) 0.23 0.20 48.61 0.21 0.24 0.49 0.4237 342 0.27 (0.01) 0.26 0.22 33.04 0.24 0.45 0.48 0.41Total 6106 0.05 (0.003) 0.20 0.27 60.74 0.18 0.12 0.73 0.73
(b) Sites with 440nm26 401 0.08 (0.01) 0.09 0.2 73.07 0.08 0.08 0.76 0.8811 294 0.06 (0.00) 0.08 0.14 88.10 0.07 0.04 0.73 0.8323 204 0.11 (0.01) 0.12 0.14 55.88 0.12 0.08 0.99 0.7729 470 0.15 (0.01) 0.21 0.42 62.34 0.18 0.15 0.77 0.8730 406 0.15 (0.01) 0.22 0.42 63.05 0.20 0.17 0.77 0.8632 462 0.15 (0.01) 0.19 0.32 61.90 0.18 0.15 0.82 0.8331 286 0.14 (0.01) 0.16 0.24 55.94 0.16 0.11 0.87 0.8028 381 0.12 (0.01) 0.17 0.28 68.77 0.15 0.14 0.73 0.8017 19 0.22 (0.07) 0.30 0.52 52.63 0.15 0.21 0.48 0.8633 109 0.16 (0.03) 0.29 0.55 65.14 0.21 0.21 0.64 0.8619 367 0.08 (0.01) 0.10 0.11 73.57 0.10 0.06 0.71 0.6221 17 0.13 (0.05) 0.18 0.16 64.71 0.18 0.05 0.87 0.606 47 0.08 (0.02) 0.11 0.11 74.47 0.10 0.10 0.72 0.6027 131 0.22 (0.03) 0.31 0.27 50.38 0.30 0.21 0.74 0.554 248 0.07 (0.01) 0.08 0.08 77.02 0.08 0.09 0.58 0.5124 59 0.16 (0.03) 0.22 0.17 52.54 0.18 0.28 0.33 0.30Total 3901 0.04 (0.003) 0.17 0.33 66.85 0.16 0.10 0.82 0.86
aN represents the total number of daily coincident AOD data, avg is the mean absolute difference between OMI andAERONET, SE is the standard error ( SDEV2
� ffiffiffiffiffiffiffiffiffiffiffiffiffiffiffiffiffiN � 1
p), SDEV2 is the standard deviation of OMI and AERONET AOD,
SDEV1 is the standard deviation of AERONETAOD, andQ is the percent of OMI AOD data fallingwithin uncertainty envelopeof ±30% or 0.1 AOD from AERONET observations. The results from a linear regression fit are also summarized as the root-mean-square error, the y intercept, the slope, and the correlation coefficient (ρ).
Journal of Geophysical Research: Atmospheres 10.1002/2013JD020188
AHN ET AL. ©2014. The Authors. 2463

500 nm values. The AERONET wavelength used for the comparison is listed in Table 1. The OMI AODretrievals within a radius of 40 km of the AERONET site and within a ±10min window of the satellite overpass[Christopher and Wang, 2004] were averaged after excluding those measurements with standard deviationlarger than 0.3 with the purpose of excluding possible remaining cloud contamination effects. The resultingOMI AOD average values are then compared with the time-averaged Sun photometer measurements.
3. OMAERUV Validation Analysis3.1. Sensor Stability
The long-term stability of the sensor was examined by analyzing daily OMI-AERONET matchups over the fulleight complete years of the OMI sensor operation (2005–2012) at the five AERONET sites. The AOD time seriesplot (Figure 3a) over the five sites (Goddard Space Flight Center (GSFC), Alta Floresta, Dakar, Institut D’EconomieRural (IER),Cinzana, and XiangHe) for 8 years (2005–2012) shows correlation coefficients between 0.77 and 0.90.In addition, the time series plot (Figure 3b) of the difference of AOD (OMI-AERONET) shows that, although thenoise level is high at some locations, no temporal trend is apparent at any of the five sites. This result in-dicates the absence of any discernible instrumental drift. This analysis supports the conclusion that themethod of rejecting the data affected by the row anomaly since 2007 (discussed in section 2.1) successfullyremoves the faulty measurements without obvious alteration of the quality of the derived product.
3.2. Validation Results
Table 2 summarizes the statistics associated with the validation analysis at the 44 AERONET sites inTable 1. In addition to the linear fit statistics (i.e., RMSE, y intercept, slope, and correlation coefficient (ρ)),
Figure 4. AOD comparisons between OMI and AERONET in 2005–2008 at 12 sites. The linear fit is shown as a thick line and the dashed lines indicate the uncertaintyenvelope of ±30% or 0.1 AOD. The dotted line denotes the 1-to-1 line (see text for details). The colors indicate one of the three predominant aerosol types identifiedby the OMAERUV algorithm: smoke (red), dust (blue), and urban/industrial (gray).
Journal of Geophysical Research: Atmospheres 10.1002/2013JD020188
AHN ET AL. ©2014. The Authors. 2464

the statistical metrics in Table 2 includethe mean absolute difference (avg), thestandard deviation (SDEV2), the stan-dard error (SE) between OMI andAERONET, and the percent (Q) of OMIretrievals within the range of expecteduncertainty which is the combined ef-fect of all possible error sources. Thecombined uncertainty in the derivedAOD from the major error sources in thenear-UV algorithm (subpixel cloud con-tamination, aerosol layer height, andsurface albedo) is the largest of 0.1 or30% [Torres et al., 1998, 2002b]. Theseadditional statistics provide an insight ofthe overall variability of the AOD, andthey are less affected by the extremeoutliers than the linear fit-derivedquantities, especially when the totalnumber of daily pairs (N) is small.
To facilitate the discussion, the data inTable 2 are presented in two groupsaccording to the wavelength of theAERONET observation. The top group (28sites) includes those locations whereground-based observations at 380 nm areavailable, and therefore, a direct compari-son with the satellite observation waspossible. The second group (16 stations)lists the siteswhere 380nmmeasurementswere not available, and therefore, the OMIAOD was converted to the shortest avail-able AERONET wavelength (generally440 nm) for the comparison. The tabulatedresults in both groups have been sorted interms of the best resulting combination ofρ and slope. The row at the bottom of eachtabulation shows the statistics for the twogroups of sites. The better statistical met-rics of the 440nm group are a reflection ofthe more suitable observing conditions (i.e., low subpixel cloud contamination) sincemost sites in this group are located in aridand semiarid environments. The followingdiscussion of results refers to the totality ofthe observing sites. Correlation coeffi-
cients range between 0.3 and 0.91 with values larger than 0.7 at half of the sites sampled. At eight sites (4, 5, 13,14, 24, 25, 27, and 37), typically urban and coastal locations, the reported correlation coefficient is lower than 0.6.The main reasons for the low correlation are the combined effect of surface albedo characterization (see dis-cussion below on y intercept), cloud contamination, and possibly aerosol model representation.
The resulting slope is lower than unity in all the 44 cases, indicating an overall tendency of the algorithm tounderestimate rather than overestimate the atmospheric aerosol load. The y intercept of the regression linearfit varies between 0.01 at Site 39 (Kanpur, India) and 0.45 at Site 37 (Dhadnah). Six sites yield values of 0.05 or
Figure 5. AOD comparisons between OMI and AERONET in 2005–2008at each aerosol type category: (a) nonabsorbing and mixture sites (27),(b) dust sites (10), and (c) smoke sties (7).
Journal of Geophysical Research: Atmospheres 10.1002/2013JD020188
AHN ET AL. ©2014. The Authors. 2465

better whereas y intercept values largerthan 0.15 are reported at 10 sites. At theremaining 28 sites, values between 0.06and 0.14 were obtained. Large y interceptvalues are associated with inaccuratecharacterization of surface albedo. Thecoarse spatial resolution of the climatologyof surface albedo (1° × 1°) used inOMAERUV may not adequately resolvesmaller scale spatial variability of the sur-face reflective properties in arid regions(Sites 36, 37, and 38) or at typical urbansettings such as Mexico City and Cairo(Sites 14 and 24). At coastal sites where theactual surface is a mixture of land andocean (Sites 13, 25, and 27), the resolutionof the surface albedo database may notadequately resolve the surface type at thespatial resolution of the observation.
At 28 out of the 44 locations, the percent ofretrievals within the expected uncertainty (Q) is 60% or better. Large OMI AOD values beyond the upper limitof +30% uncertainty can be associated with cloud contamination, particularly when the actual AOD is smallerthan about 0.3, as shown in Figures 4a, 4b, 4c, 4e, 4h, and 4i, whereas OMI AOD values below the lower limit of�30% uncertainty can be associated with sampling differences, lack of spatial homogeneity of the aerosolload over the large OMI footprint, or inadequacy of the chosen aerosol model. Best statistics (ρ> 0.75 andregression line slope between 0.73 and 1.0 and y intercepts lower than 0.17) were obtained for 33% of thesites (top seven listings at 380 nm and eight listings at 440 nm in Table 2). Five of these locations (Sites 20, 23,26, 28, and 29) are located north of 15°N in northern Africa, where the predominant aerosol type is desertdust. The good level of agreement at these desert sites is expected since subpixel cloud contamination,which is the main source of uncertainty of the OMI aerosol products, is expected to be low over arid regions.Also within the top 33%, there are five stations where carbonaceous particles constitute the main contribu-tors to the observed aerosol load (Sites 15, 30, 31,32, and 35) as well as Sites 8, 9,10, and 11, where the aerosoltype is dominated by the presence of urban/industrial aerosols. A more detailed discussion of the validationresults of the nonabsorbing aerosol type is presented in section 3.3.
Figure 4 depicts scatterplots of AERONET(x axis) and OMAERUV (y axis)-measuredAOD at a subset of 12 of the 44 stationsused in this validation analysis. Theobtained linear fit is shown as the thicksolid line, and the dashed lines indicatethe expected uncertainty envelope of±30% or 0.1 AOD. The dotted line denotesthe 1-to-1 line.
Figure 4 (first row) shows comparisons atMaryland Science Center (NE, USA),Barcelona (Europe), and Skukuza (southernAfrica). At these sites, nonabsorbing aero-sols are present most of the year. Subpixelcloud contamination is clearly observableat AOD values of 0.3 and lower. Atlarger AOD values, however, the effectof subpixel cloud contamination does
Figure 6. Same as the comparison of AOD for individual sites inFigure 4, but for all 44 sites from both OMI and AERONET at 440 nmover 4 years (2005–2008). The color bar represents the number of pairsfor each bin with the interval of 0.02 AOD where the minimum numberof pairs (1.0) is shown in gray color. The maximum number of pairs be-tween 50 and 110 is shown in pink.
Figure 7. OMI (388 nm) and AERONET (380 nm) AOD comparisons atthe five selected sites over 4 years (2005–2008). These sites shown asdifferent symbols represent typical nonabsorbing scattering aerosols.
Journal of Geophysical Research: Atmospheres 10.1002/2013JD020188
AHN ET AL. ©2014. The Authors. 2466

not appear to be large. Figure 4 (second row) (Tamanrasset, in the Saharan Desert, Dakar, Northwest Africa,and Hamin, Arabian Peninsula) shows comparisons at dust-dominated sites typical of arid and semiaridenvironments. For this aerosol type, subpixel cloud contamination is very low, and the satellite observationsare generally in good agreement with the ground-based measurements. Figure 4 (third row) depicts theOMAERUV-AERONET comparisons at IER, Cinzana (Sahel, North Africa), Mukdahan (Southeast Asia), and AltaFloresta (Amazonia, South America), representatives of regions where carbonaceous aerosols contributesignificantly to the aerosol burden during the corresponding biomass burning season.
Figure 4 (fourth row) (Blida, North Africa; Agoufou, Sahel; and Kanpur, northern India) shows comparisons at siteswhere mixtures of dust and smoke or/and urban pollutants are likely to take place depending on the season. Thelargest variability in terms of the root-mean-square error (RMSE) (e.g., Kanpur 0.25) is generally observed at thesesites. Smoke, dust, and nonabsorbing aerosols are present at different times of the year at Kanpur. The largestoptical depth values over Alta Floresta are associated with biomass burning aerosols during the three-monthlong(August to October) biomass burning season, but a small amount of nonabsorbing aerosols are present all yearlong. A similar situation can be observed at the Dhadnah station (ID=37).
Forty four sites are grouped into three predominant aerosol-type categories (i.e., 27 nonabsorbing andmixture sites, 10 dust sites, and 7 smoke sites) to make scatterplots of statistics in Figure 5. Best statistics(ρ=0.81, RMSE=0.14, and Q=68) is obtained from the nonabsorbing and mixture group (Figure 5a) for whichthe possible sources of uncertainty are the cloud contamination and inadequate surface albedo for low AODvalues below 0.3. Most of the large variability for large AOD values is very likely due to including the mixture sites
(Sites 15, 29, 34, and 39) having dust orsmoke-type aerosols for a certain time periodas described in section 2.4. Other aerosolgroups (i.e., dust and smoke) need an addi-tional assumption of the aerosol layer heightin the retrieval which may produce furtherincreased variability (RMSE=0.20 for dustand RMSE=0.19 for smoke).
Figure 6 depicts a global density scatterplotof the OMI-AERONET aerosol optical depthcomparison. The plot was produced by bin-ning the data in 0.02 intervals for all the 44sites. The results of the analysis using theglobal statistical sample of 10,134 pairs aregenerally consistent with the best resultsfrom the individual sites in Table 2. Theglobal sample yields a satisfactory level of
Figure 8. Monthly based time series AOD plot at the GSFC site over 4 years.
Figure 9. AOD comparisons between the OMI (440 nm) and theAERONET (440 nm) at the six dust-dominated sites in 2007.
Journal of Geophysical Research: Atmospheres 10.1002/2013JD020188
AHN ET AL. ©2014. The Authors. 2467
agreement between OMI and AERONET(ρ=0.81, RMSE=0.16, and Q=65%), indi-cating possible issues of the surface albedoand cloud contamination in the ranges oflow AOD values. Nevertheless, the majorityof low OMI AOD data shown as pink colorsfalls over the dotted 1-to-1 line within theuncertainty envelope of 0.1 AOD. Therefore,cloud contamination may play a more pri-mary role in degrading the statistics thanthe surface albedo.
3.3. Boundary Layer Aerosols
The validation analysis in the previoussection focused mainly on the retrieval ofcarbonaceous and desert dust aerosolplumes that can extend horizontally overthousands of kilometers. Because of thenature of the physical processes driving
the emission and atmospheric injection of desert dust (lofting power of soil particles by the wind) and car-bonaceous aerosols (strong convection), large amounts of these aerosols downwind from their source re-gions are often found above the boundary layer. On the other hand, the atmospheric aerosol loading ofurban/industrial origin is generally smaller (lower optical depth) than those of smoke and desert dust layers.These optically thinner aerosol plumes are generally contained in the boundary layer, and their horizontalscale is many times smaller than the typical size of carbonaceous and desert dust aerosol clouds. RetrievingAOD of small horizontal-scale plumes using large footprint satellite observations such as OMI is a particularlychallenging task as the effect of subpixel cloud contamination can significantly reduce the retrieval yield andproduce an overestimate of the aerosol load [Remer et al., 2012]. For cloud-free conditions, optical depthunderestimation may take place when the horizontal scale of the aerosol plume is significantly smaller thanthe satellite footprint. Under those conditions, the aerosol signal is smeared over the large pixel area yieldinga lower optical depth than would be measured at the ground or by a finer resolution satellite-borne sensor.
A comparison of OMAERUV retrieved to AERONET-measured AOD at a subset of sites in Table 1 is depicted inFigure 7. At these five sites in the continental United States (GSFC, Sustainable Environment Research Center(SERC), Wallops, Bondville, and University of California Santa Barbara (UCSB)), the aerosol loading is typicallyassociated with background urban/industrial particles near the surface. The validation analysis of the com-bined data set yields a correlation coefficient of 0.76, a slope of 0.71, and 0.07 as y intercept. The effect of
subpixel cloud contamination is clearlyobservable as the cluster of retrievedvalues associated with AERONET measure-ments of AOD 0.3 and lower. At larger AODvalues, the incidence of overestimates(most likely due to subpixel cloud effects)goes down rapidly. The average frequencyof retrieval days per year over these fivesites is 15% (from Table 2), which repre-sents less than half the OMAERUV retrievalfrequency over desert areas.
The representativeness of OMAERUVtemporal averages of AOD based oncloud-contamination-induced reducedsampling can be evaluated by comparingthe monthly average satellite
Figure 10. Same as Figure 9 but for MODIS DB (440 nm) versusAERONET (440 nm) in 2007. The MODIS DB AOD at 440 nm was line-arly interpolated with 412 and 470nm AOD values of the QA flag 3(=very good confidence).
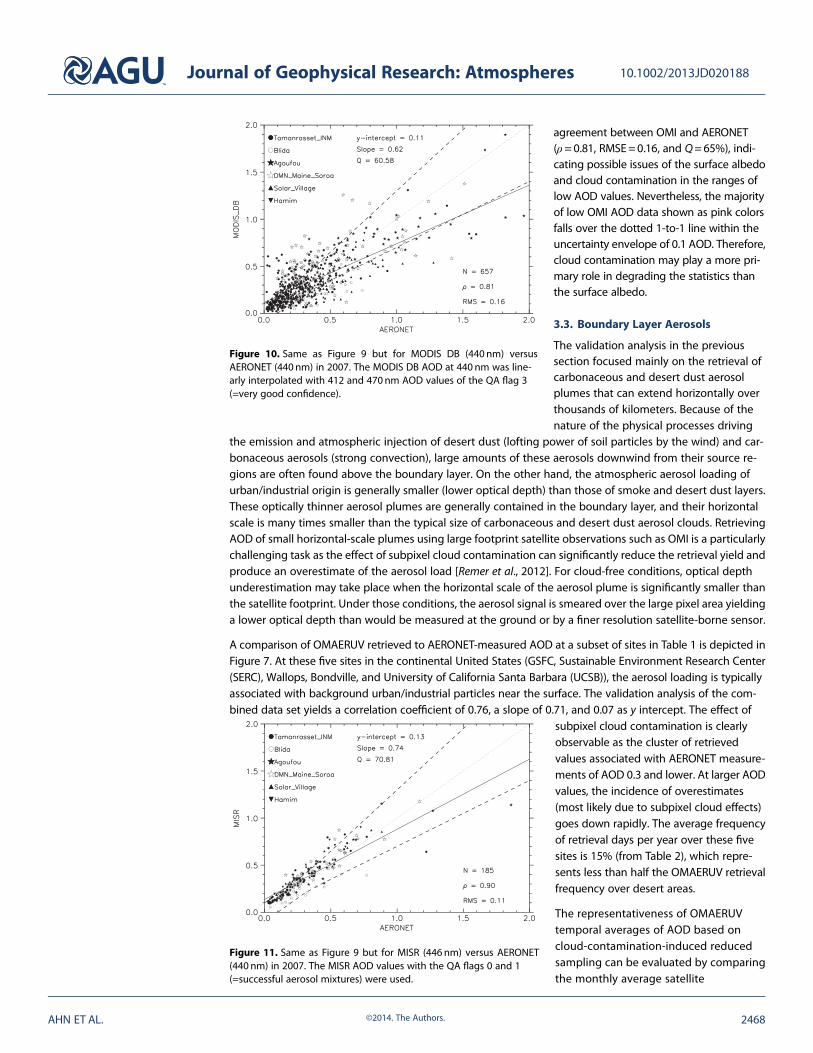
Figure 11. Same as Figure 9 but for MISR (446 nm) versus AERONET(440 nm) in 2007. The MISR AOD values with the QA flags 0 and 1(=successful aerosol mixtures) were used.
Journal of Geophysical Research: Atmospheres 10.1002/2013JD020188
AHN ET AL. ©2014. The Authors. 2468

measurement to AERONET monthly AODvalues at the satellite overpass time.Figure 8 (top) showing such a comparisonat the GSFC site for the 4 year period in thisanalysis indicates a close agreement be-tween the two data sets. Figure 8 (bottom)depicts the number of days per monthavailable for calculating the monthly aver-age. Overall, the OMAERUV long-term recordclosely tracks the AERONET time series. Thepreceding analysis clearly shows the sensi-tivity of near-UV observations to the totalaerosol column down to the surface. Thecomparison after 2008 (not shown) showsthe clear effect of the row anomaly issue asthe satellite sampling is significantly reduced.
4. Comparison to Other Satellite Data Sets
In this section, an evaluation of OMAERUV AOD product is carried out by comparison to similar satellite datasets. The direct intercomparison of satellite AOD products is generally a complicated problem due to severalreasons including temporal collocation of the data sets, reporting wavelength, and specific algorithmic issuessuch as cloud masking and aerosol model representation. These issues make it very difficult to understandthe reasons for the observed differences in a direct sensor-to-sensor comparison. In this analysis, we havecarried out an indirect evaluation of OMAERUV’s AOD retrieval capability over bright surfaces with respect tothe retrieval results of other algorithms using observations of sensors with similar capability such as MISR[Kahn et al., 2009], MODIS Deep Blue algorithm [Hsu et al., 2004], and KNMI’s OMAERO algorithm [Torres et al.,2007]. The retrieval results by the four algorithms during the same period and at the same locations areindependently compared to AERONETAOD measurements. Comparisons are carried out for year 2007 at sixAERONET sites in Table 1 (ID = 20, 26, 29, 31, 36, and 38), four of which are in northern Africa, one in theUnited Arab Emirates (Hamim), and one in Saudi Arabia (Solar Village).
Figures 9 to 12 show comparisons of AERONET observations to satellite retrievals of AOD derived by theOMAERUV, MODIS DB, MISR, and OMAERO algorithms, respectively, at the six selected sites. All observa-tions available during 2007 were included in the analysis, and the spatial-temporal collocation with the
Figure 12. Same as Figure 9 but for OMAERO (442nm) versusAERONET (440nm) in 2007. Note that QA flags are not available fromthe OMI-KNMI algorithm.
Table 3. Summary Statistics of AOD Comparisons Among Instruments Against AERONET in 2007a
Site Tamanrassett Blida Agoufou
Data Set OMN MDB MSR OMK OMN MDB MSR OMK OMN MDB MSR OMK
N 177 191 42 60 86 51 20 11 141 97 35 24ρ 0.90 0.73 0.89 0.79 0.77 0.76 0.86 0.82 0.94 0.87 0.94 0.79Slope 0.77 0.61 0.78 1.09 0.53 0.49 0.66 0.94 0.81 0.56 0.64 1.30y intercept 0.08 0.09 0.11 0.07 0.06 0.02 0.03 �0.05 0.11 0.22 0.15 �0.25RMSE 0.08 0.14 0.10 0.32 0.10 0.07 0.07 0.10 0.16 0.18 0.12 0.39
Site DMN Maine Soroa Solar Village Hamin
Data Set OMN MDB MSR OMK OMN MDB MSR OMK OMN MDB MSR OMK
N 122 77 33 59 204 220 41 82 53 21 14 9ρ 0.79 0.70 0.93 0.61 0.62 0.74 0.95 0.51 0.59 0.80 0.95 0.89Slope 0.89 0.57 0.91 0.72 0.73 0.48 0.92 0.68 0.59 0.82 1.07 0.75y intercept 0.10 0.27 0.10 0.04 0.34 0.13 0.11 0.04 0.21 0.04 0.10 �0.02RMSE 0.16 0.22 0.08 0.25 0.17 0.10 0.05 0.21 0.16 0.11 0.06 0.07
aListed parameters are the total number of pairs (N), linear fit statistics (i.e., ρ, slope, y intercept, and RMSE) for eachAOD satellite data sets (OMN: OMAERUV, MDB: MODIS DB, MSR: MISR, and OMK: OMAERO) at six AERONET sites.
Journal of Geophysical Research: Atmospheres 10.1002/2013JD020188
AHN ET AL. ©2014. The Authors. 2469

ground-based observations was doneusing the same procedure outlined insection 2.4. A summary of the resultingstatistics is shown in Table 3.
TheOMAERUV results in Figure 9 and Table 3are consistent with the analysis in section 3.As a consequence of the reduced number ofpoints, however, the reported statistics areslightly different. At the Solar Village site, aclear bias between the OMAERUV and theobserved ground-based observations arelikely associated with inadequate represen-tation of surface reflective properties. Thelarge y intercept (0.34) seems to indicate alarge underestimation in the assumed sur-face albedo. Most of the overestimated AODvalues in Figure 9 correspond to the mea-surements at this site.
Figure 10 and Table 3 show MODIS DB-AERONETAOD comparisons. In general, OMAERUV retrievals correlatebetter than MODIS DB with AERONET measurements except at the Solar Village and Hamin sites. At these twosites, MODIS DB also reports lower y intercept values than OMAERUV. MODIS DB slopes at the Agoufou, and DMNMaine Soroa locations (0.56 and 0.57) are significantly lower than those yielded by OMAERUV (0.81 and 0.89).
The MISR-AERONET comparison in Figure 11 and Table 3 shows overall good agreement with the ground-based observations. Issues associated with overestimates at low AOD values and underestimates at high AODvalues have been documented [Kahn et al., 2010]. The MISR-AERONET correlation coefficients are slightlybetter than those of the OMAERUV-AERONET analysis except at the Solar Village and Hamim sites whereOMAERUV coefficients are significantly lower. The MISR and OMAERUV reported slopes are comparable atfive sites out of six sites. At the Hamim station, the MISR slope is very close to unity as compared to the OMIslope value of 0.72. The MISR and OMAERUV y intercepts are comparable at all sites but Solar Village.
Scatterplots of the AERONET-OMAERO comparisons at six locations are shown in Figure 12, and the statistics ofthe analysis are listed in Table 3. Unlike the other three products in the analysis, the OMAERO aerosol productdoes not provide a qualifier of the accuracy of the retrievals that could be used to reject unreliable retrievals dueto subpixel cloud contamination or other error sources. The combined number of OMAERO-AERONET pairs at
the six sites (245) is only about 30% of theOMAERUV-AERONET pairs (783). This is verysurprising since both algorithms areapplied to the same OMI observations, andthe effects of subpixel cloud contaminationare expected to be very small over the aridenvironment characteristic of theseAERONET sites. The OMAERO reports cor-relation coefficients similar to OMAERUV atfour of the sites. The much larger OMAERORMSE values than those obtained by thecomparisons with the other three sensorspoint to systematic retrieval errors possiblyassociated with aerosol-type identification.The need to simultaneously account foraerosol plume height, aerosol type, andoptical depth effects on the measuredreflectances leads to large variability in theretrieved AOD.
Figure 13. Same as Figure 9 but for MODIS DB (440nm) versusOMAERUV (440nm) in 2007. Coincident AOD pairs between MODIS DBand OMI were based on the same days (N) with respect to AERONETAODin Figures 9 and 10.
Figure 14. Same as Figure 9 but for OMAERO (442nm) versus OMAERUV(440nm) in 2007. Coincident AOD pairs between KNMI and OMAERUVwere based on the same days (N) with respect to AERONET AOD inFigures 9 and 12.
Journal of Geophysical Research: Atmospheres 10.1002/2013JD020188
AHN ET AL. ©2014. The Authors. 2470

Since the OMAERO and MODIS DB retrievals are also obtained from A-train sensors, it is actually possible togenerate scatterplots of space and time-collocated measurements of these products and the OMAERUV.Because of the significant time difference in observation time (about 3 h), a direct MISR-OMAERUV compar-ison has not been attempted.
The MODIS DB-OMAERUV comparison is presented in Figure 13. Although this analysis was made assumingno time difference between the daily OMI and MODIS observations, the actual overpass time differencebetween the Aqua and Aura satellites is about 8min. The intercomparison yields a 0.83 correlation coefficient, a0.07 y intercept, and a 0.70 slope. Because of the previously discussed OMAERUV bias at the Solar Villagesite, observations at this AERONET station are not included in Figure 13.
The comparison of OMAERUV and OMAERO AOD retrievals is shown in Figure 14. Because these two productsare developed from observations by the same sensor, exact spatial and temporal collocation is automaticallyachieved. The comparison was done using retrievals by the two algorithms on the pixels deemed reliable byOMAERUV quality flagging because OMAERO does not provide retrieval quality information. A large degreeof scatter is apparent, and the resulting correlation coefficient is 0.57 and the y intercept and slope of theregression fit are�0.02 and 0.80, respectively. The large observed discrepancy can only be explained in termsof algorithmic differences since issues associated with subpixel cloud contamination and pixel size arecommon to both products. The OMAERUVAOD retrievals show comparable levels of agreement with ground-based observations as those resulting from the validation analysis of MODIS DB and MISR measurementsespecially over desert and biomass burning dominant regions.
5. Summary and Conclusions
Aerosol optical depth data reprocessed with the OMI UV aerosol algorithm (version 1.4.2) have been assessedby comparing to AERONET direct Sun measurements. A comparison over 8 years (2005–2012) at fiveAERONET locations shows no sign of degradation in OMI’s radiometric calibration in the near UV. This is anencouraging finding given the uncertainty associated with the effect of the row anomaly issue that has, since2007, reduced by half the sensor’s viewing capability. The lack of any identifiable trend in the measured recordindicates that the exclusion procedure accurately removed the affected data.
A rigorous AOD validation analysis over 4 years (2005–2008) was carried out. The OMAERUV and AERONETAODobservations were compared at 44 globally distributed sites representative of the most commonly observedaerosol types. A detailed statistical analysis of the validation analysis is summarized in Table 2. In general, thealgorithm performance is best over sites situated not too far from the source areas of desert and carbonaceousaerosols. These large-scale aerosol events generally take place primarily under cloud-free conditions that facil-itate the retrieval. On the other hand, small-scale wind-blown aerosol plumes are commonly found in the vi-cinity of clouds over island sites and coastal areas. Under these dynamic meteorological conditions, aerosolsand clouds can be highly variable within the large OMI footprint. As a consequence, the conditions for suc-cessful retrievals are scarce, and therefore, both retrieval yield and quality are diminished. The overall perfor-mance of the retrieval algorithm over the totality of the sites yields an RMSE of 0.16 and a correlation coefficientof 0.81. The percent of OMAERUV AOD retrievals within the expected uncertainty range is 65%.
The validation analysis presented here also shows that near-UV measurements can be successfully used notonly for retrieving the AOD of lofted layers of carbonaceous and desert dust particles but also for retrievingthe AOD of boundary layer aerosols above vegetated land. The OMI-AERONETAOD comparison for boundarylayer aerosols shows that the near-UV observations are sensitive to aerosol presence all the way down to thebottom of the atmospheric column.
The accuracy of OMI AOD retrieval was further evaluated relative to those of similar satellite products bysimultaneously comparing OMAERUV, MODIS DB, MISR, and OMAERO retrievals to AERONET observationsin 2007 at a subset of stations in northern Africa characterized by bright surfaces and minimum subpixelcloud contamination. The results confirmed that for cloud-free conditions over arid and semiarid environ-ments, OMAERUV accuracy is comparable to those from theMODIS DB andMISR algorithms that make use offine resolution observations.
The AOD validation analysis presented here, in conjunction with the forthcoming paper on SSA evaluation(Jethva et al., Global assessment of OMI aerosol single-scattering albedo in relation to ground-based
Journal of Geophysical Research: Atmospheres 10.1002/2013JD020188
AHN ET AL. ©2014. The Authors. 2471

AERONET inversion, submitted to Journal of Geophysical Research, 2014), constitutes the most comprehensiveassessment to date of the aerosol products generated by the OMI OMAERUV algorithm. In spite of the in-herent retrieval difficulties associated with the coarse spatial resolution of the measurements, the OMAERUVdata set containing aerosol optical depth and single-scattering albedo is an important contribution to theobservational database available for improving our current understanding of the role of the of the globalaerosol loading in the energy balance of the earth-atmosphere system. The OMAERUV provides a comple-mentary record on aerosol optical depth over land areas, especially over arid and semiarid regions.
This analysis confirms the large potential of using near-UV observations as a powerful remote sensing toolfor AOD retrieval over land. Its main advantage is the low-UV surface albedo that allows aerosol detectionwithout requiring multiple-angle viewing or additional spectral measurements for accurate characterizationof surface effects. The addition of near-UV channels in future high-spatial-resolution aerosol sensing missionsis therefore strongly recommended.
ReferencesAhn, C., O. Torres, and P. K. Bhartia (2008), Comparison of OMI UV Aerosol Products with Aqua-MODIS and MISR observations in 2006,
J. Geophys. Res., 113, D16S27, doi:10.1029/2007JD008832.Al-Saadi, J., et al. (2005), Improving national air quality forecasts with satellite aerosol observations, Bull. Am. Meteorol. Soc., 86(9),
1249–1261.Christopher, S. A., and J. Wang (2004), Intercomparison between multi-angle imaging spectroradiometer (MISR) and sunphotometer aerosol
optical thickness in dust source regions over China: Implications for satellite aerosol retrievals and radiative forcing calculations, Tellus,56B, 451–456.
Chu, D. A., Y. J. Kaufman, C. Ichoku, L. A. Lemer, D. Tanré, and B. N. Holben (2002), Validation of MODIS aerosol optical depth retrieval overland, Geophys. Res. Lett., 29(12), 8007, doi:10.1029/2001GL013205.
Deuzé, J. L., et al. (2001), Remote sensing of aerosols over land surfaces from POLDER-ADEOS-1 polarized measurements, J. Geophys. Res.,106, 4913–4926.
Diner, D. J., J. V. Martonchik, R. A. Kahn, B. Pinty, N. Gobron, D. L. Nelson, and B. N. Holben (2005), Using angular and spectral shape similarityconstraints to improve MISR aerosol and surface retrievals over land, Remote Sens. Environ., 94, 155–171.
Dobber, M., et al. (2008), Validation of Ozone Monitoring Instrument level-1b data products, J. Geophys. Res., 113, D15S06, doi:10.1029/2007JD008665.
Holben, B. N., et al. (1998), AERONET—A federated instrument network and data archive for aerosol characterization, Remote Sens. Environ., 66, 1–16.Hsu, N. C., S. C. Tsay, M. D. King, and J. R. Herman (2004), Aerosol properties over bright-reflecting source regions, IEEE Trans. Geosci. Remote
Sens., 42, 557–569.Jethva, H., and O. Torres (2011), Satellite-based evidence of wavelength-dependent aerosol absorption in biomass burning smoke inferred
from Ozone Monitoring Instrument, Atmos. Chem. Phys., 11, 10,541–10,551.Kahn, R. A., et al. (2009), MISR aerosol product attributes and statistical comparisons with MODIS, IEEE Trans. Geosci. Remote Sens, 47(12, Part 2),
4095–4114.Kahn, R., B. J. Gaitley, M. J. Garay, D. J. Diner, T. F. Eck, A. Smirnov, and B. N. Holben (2010), Multiangle Imaging SpectroRadiometer
global aerosol product assessment by comparison with the Aerosol Robotic Network, J. Geophys. Res., 115, D23209, doi:10.1029/2010JD014601.
Kaufman, Y. J., D. Tanre, L. A. Lemer, E. F. Vermote, A. Chu, and B. N. Holben (1997), Operational remote sensing of tropospheric aerosol overland from EOS moderate resolution imaging spectrometer, J. Geophys. Res., 102, 17,051–17,067.
King, M. D., Y. J. Kaufman, D. Tanre, and T. Nakajima (1999), Remote sensing of tropospheric aerosols from space: Past, present and future,Bull. Am. Meteorol. Soc., 80, 2229–2259.
Kinne, S., et al. (2006), An AeroCom initial assessment - Optical properties in aerosol component modules of global models, Atmos. Chem.Phys., 6, 1815–1834.
Leitão, J., A. Richter, M. Vrekoussis, A. Kokhanovsky, Q. J. Zhang, M. Beekmann, and J. P. Burrows (2010), On the improvement of NO2 satelliteretrievals – Aerosol impact on the airmass factors, Atmos. Meas. Tech., 3, 475–493.
Levelt, P. F., E. Hilsenrath, G. W. Leppelmeier, G. H. J. van den Ooord, P. K. Bhartia, J. Taminnen, J. F. de Haan, and J. P. Veefkind (2006),Science objectives of the Ozone Monitoring Instrument, IEEE Trans. Geosci. Remote Sens., Special Issue of the EOS-Aura mission, 44(5),1093–1101.
Levy, R. C., L. A. Remer, R. G. Kleidman, S. Mattoo, C. Ichoku, R. Kahn, and T. F. Eck (2010), Global evaluation of the Collection 5 MODIS dark-target aerosol products over land, Atmos. Chem. Phys., 10, 10,399–10,420, doi:10.5194/acp-10-10399-2010.
Martonchik, J. V., D. J. Diner, R. Kahn, M. M. Verstraete, B. Pinty, H. R. Gordon, and T. P. Ackerman (1998), Techniques for the retrieval of aerosolproperties over land and ocean using multiangle imaging, IEEE Trans. Geosci. Remote Sens., 36, 1212–1227.
Remer, L. A., S. Mattoo, R. C. Levy, A. Heidinger, R. B. Pierce, andM. Chin (2012), Retrieving aerosol in a cloudy environment: aerosol availabilityas a function of spatial and temporal resolution, Atmos. Meas. Tech. Discuss., 5, 627–662.
Ridley, D. A., C. L. Heald, and B. Ford (2012), North African dust export and deposition: A satellite and model perspective, J. Geophys. Res., 117,D02202, doi:10.1029/2011JD016794.
Schoeberl, M. R., et al. (2006), Overview of the EOS Aura Mission, IEEE Trans. Geosci. Remote Sens., 44(5), 1066–1074.Stephens, G. L., et al. (2002), The Cloudsat mission and the A-train – A new dimension of space-based observations of clouds and precipi-
tation, Bull. Am. Meteorol. Soc., 83(12), 1771–1790.Torres, O., P. K. Bhartia, J. R. Herman, and Z. Ahmad (1998), Derivation of aerosol properties from satellite measurements of backscattered
ultraviolet radiation: Theoretical Basis, J. Geophys. Res., 103, 17,099–17,110.Torres, O., P. K. Bhartia, J. R. Herman, A. Syniuk, P. Ginoux, and B. N. Holben (2002a), A long-term record of aerosol optical depth from TOMS
observations and comparison to AERONET measurements, J. Atmos. Sci., 59, 398–413.
AcknowledgmentsWe thank the NASA data centers listedin section 2 for providing AOD data fromOMI, MODIS, and MISR sensors. We alsothank the AERONET principal investiga-tors for their efforts in establishing andmaintaining the sites that make it possi-ble to evaluate satellite AOD values inthis intercomparison study. Usefulcomments and suggestions fromLorraine Remer and the two anonymousreviewers to improve the quality of thispaper are also acknowledged. This workwas performed under contract with NASA.
Journal of Geophysical Research: Atmospheres 10.1002/2013JD020188
AHN ET AL. ©2014. The Authors. 2472

Torres, O., R. Decae, J. P. Veefkind, and G. de Leeuw (2002b), OMI aerosol retrieval algorithm, in OMI Algorithm Theoretical Basis Document:Clouds, Aerosols, and Surface UV Irradiance, vol. 3, version 2, OMIATBD-03, edited by P. Stammes, pp. 47–71, NASA Goddard Space FlightCent., Greenbelt, Md. [Available at http://eospso.gsfc.nasa.gov/eos_homepage/for_scientists/atbd/docs/OMI/ATBD-OMI-03.pdf.]
Torres, O., A. Tanskanen, B. Veihelmann, C. Ahn, R. Braak, P. K. Bhartia, P. Veefkind, and P. Levelt (2007), Aerosols and surface UV productsfrom Ozone Monitoring Instrument observations: An overview, J. Geophys. Res., 112, D24S47, doi:10.1029/2007JD008809.
Torres, O., C. Ahn, and Z. Chen (2013), Improvements to the OMI near UV Aerosol Algorithm using A-train CALIOP and AIRS observations,Atmos. Meas. Tech., 6, 5621–5652, doi:10.5194/amtd-6-5621-2013.
van Donkelaar, A., R. V. Martin, M. Brauer, R. Kahn, R. Levy, C. Verduzco, and P. Villeneuve (2010), Global estimates of average ground-level fineparticulate matter concentrations from satellite-based aerosol optical depth, Environ. Health Perspect., 118, 847–855.
Wang, J., and S. A. Christopher (2003), Intercomparison between satellite-derived aerosol optical thickness and PM2.5 mass: Implication forair quality studies, Geophys. Res. Lett., 30(21), 2095, doi:10.1029/2003GL018174.
Winker, D. M., et al. (2006), The CALIPSO mission and initial results from CALIOP, Proc. SPIE, 6409, 640,902, doi:10.1117/12.698003.Xu, X., J. Wang, D. Henze, W. Qu, and M. Kopacz (2013), Constraints on aerosol sources using GEOS-Chem adjoint and MODIS radiances, and
evaluation with Multi-sensor (OMI, MISR) data, J. Geophys. Res. Atmos., 118, 6396–6413, doi:10.1002/jgrd.50515.Zhang, J., and S. Christopher (2003), Longwave radiative forcing of Saharan dust aerosols estimated from MODIS, MISR, and CERES obser-
vations on Terra, Geophys. Res. Lett., 30(23), 2188, doi:10.1029/2003GL018479.Zhang, J., J. S. Reid, D. Westphal, N. Baker, and E. J. Hyer (2008), A system for operational aerosol optical depth data assimilation over global
oceans, J. Geophys. Res., 113, D10208, doi:10.1029/2007JD009065.
Journal of Geophysical Research: Atmospheres 10.1002/2013JD020188
AHN ET AL. ©2014. The Authors. 2473