Embed Size (px)
Citation preview
PASCNPhilippineAPECStudy CenterNetwork
PASCN Discussion Paper No. 2003-03
Assessment of Physical Resource Capability inPhilippine Agriculture
Luis Rey Velasco and Liborio Cabanilla
The PASCN Discussion Paper Series constitutes studies that are preliminary andsubject to further revisions and review. They are being circulated in a limitednumber of copies only for purposes of soliciting comments and suggestions forfurther refinements.
The views and opinions expressed are those of the author(s) and do not neces-sarily reflect those of the Network.
Not for quotation without permission from the author(s).
PASCNP H I L I P P I N E A P E C S T U D Y C E N T E R N E T W O R K
PASCN Discussion Paper No. 2003-03
Assessment of Physical Resource Capability in Philippine Agriculture
Dr. Luis Rey Velasco and Dr. Liborio Cabanilla
University of the Philippines
January 2003
The PASCN Discussion Paper Series constitutes studies that are preliminary and subject to further revisions and review. They are being circulated in a limited number of copies only for purposes of soliciting comments and suggestions for further refinements. The views and opinions expressed are those of the author(s) and do not necessarily reflect those of the Network. Not for quotation without permission from the author(s) and the Network.
For comments, suggestions or furt her inquiries, please contact:
The PASCN Secretariat Philippine Institute for Development Studies NEDA sa Makati Building, 106 Amorsolo Street Legaspi Village, Makati City, Philippines Tel. Nos. 893-9588 and 892-5817
Abstract
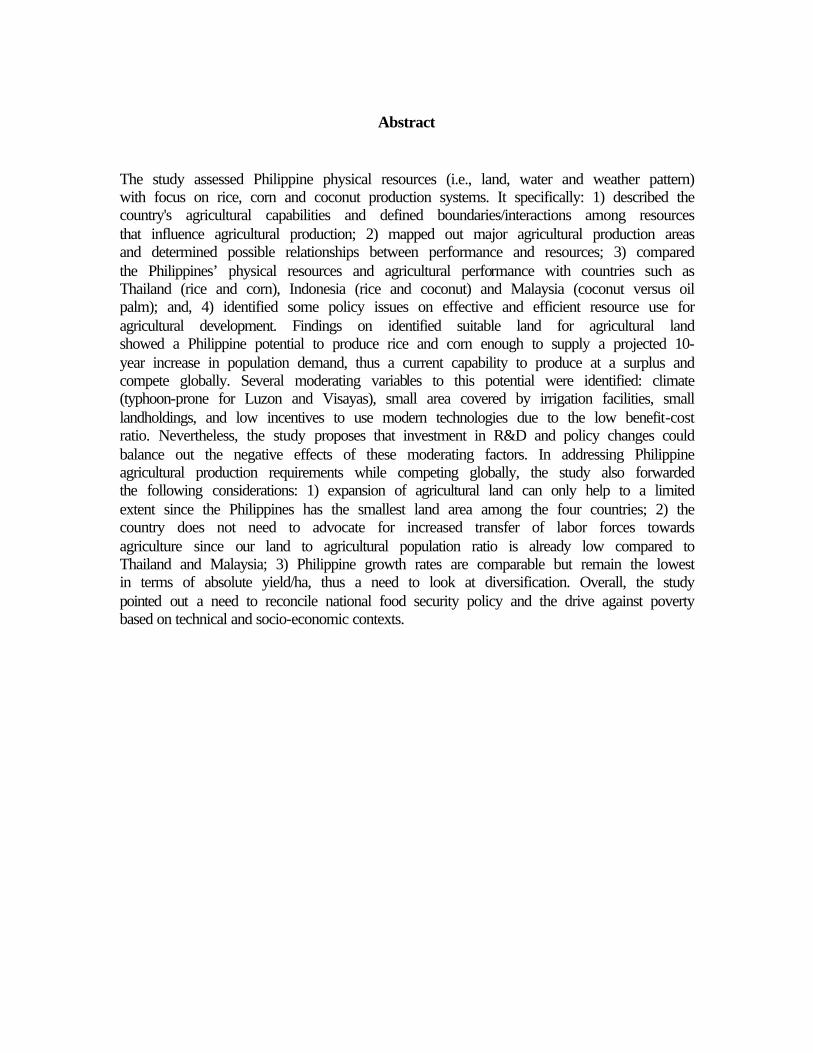
The study assessed Philippine physical resources (i.e., land, water and weather pattern) with focus on rice, corn and coconut production systems. It specifically: 1) described the country's agricultural capabilities and defined boundaries/interactions among resources that influence agricultural production; 2) mapped out major agricultural production areas and determined possible relationships between performance and resources; 3) compared the Philippines’ physical resources and agricultural performance with countries such as Thailand (rice and corn), Indonesia (rice and coconut) and Malaysia (coconut versus oil palm); and, 4) identified some policy issues on effective and efficient resource use for agricultural development. Findings on identified suitable land for agricultural land showed a Philippine potential to produce rice and corn enough to supply a projected 10-year increase in population demand, thus a current capability to produce at a surplus and compete globally. Several moderating variables to this potential were identified: climate (typhoon-prone for Luzon and Visayas), small area covered by irrigation facilities, small landholdings, and low incentives to use modern technologies due to the low benefit-cost ratio. Nevertheless, the study proposes that investment in R&D and policy changes could balance out the negative effects of these moderating factors. In addressing Philippine agricultural production requirements while competing globally, the study also forwarded the following considerations: 1) expansion of agricultural land can only help to a limited extent since the Philippines has the smallest land area among the four countries; 2) the country does not need to advocate for increased transfer of labor forces towards agriculture since our land to agricultural population ratio is already low compared to Thailand and Malaysia; 3) Philippine growth rates are comparable but remain the lowest in terms of absolute yield/ha, thus a need to look at diversification. Overall, the study pointed out a need to reconcile national food security policy and the drive against poverty based on technical and socio-economic contexts.
Executive Summary
The study assessed the physical resources (i.e., land, water and weather pattern) of
the Philippines, with focus on rice, corn and coconut production systems as compared to other agricultural countries in Asia. It specifically: 1) described the country's agricultural capabilities and defined boundaries/interactions among resources that influence agricultural production; 2) mapped out the major agricultural production areas and determined the possible relationships between performance and resources; 3) compared the Philippines’ physical resources and agricultural performance with countries such as Thailand (rice and corn), Indonesia (rice and coconut) and Malaysia (coconut versus oil palm); and, 4) identified some policy issues regarding the effective and efficient use of resources for agricultural development.
To accomplish the above objectives, the study presented and analyzed data on
Philippine agricultural resources, focusing on the three main crops produced by the country --- rice, corn and coconut. The study framework defined agricultural performance as productivity level against the desired national production requirements. This meant effective performance or the ability of the country, based on historical data vis-à-vis its potential (research-determined) to supply production requirements. Efficient performance, on the other hand, was viewed as how well the physical resources are managed so that its utilization would result to maximum productivity without undue consequences to the sustainability of the physical resources. Operationally, the indicator used in this study was actual productivity per unit area against potential productivity per unit area.
For global competitiveness, the study focused on the country's three closest
competitors in agricultural products --- Thailand, Malaysia and Indonesia. In terms of sheer land mass, Indonesia is by far the largest followed by Thailand and Malaysia. The Philippines, in this regard, is smallest. The same trend goes for the land area devoted to agriculture except for Malaysia which has the smallest agricultural land area. Despite this, Malaysia has the largest per capita land as indicated by the ratio of agricultural land to agricultural population. Trailing behind are Thailand, Philippines and Indonesia, respectively.
Trade patterns in terms of major agricultural imports/exports indicate that the
Philippines is the only net importer among these countries in terms of overall agricultural imports versus exports in 1998. Malaysia and Thailand exported rice from 1988 to 1998 while Indonesia started exporting (in minor quantities) rice in 1996. The Philippines, however, has been a consistent net importer of rice in the same period. As to why this is so, the study pointed out the fact that their physical resources, in terms of rice area, are 3-4 times larger compared to that of the Philippines.
With the abovementioned general agricultural performance, can the Philippines
really compete? Do we have the resources to do so?
The assessment showed a Philippine potential, particularly in terms of currently used land area, to produce rice and corn that is enough to supply increasing population demands for the next ten years. The study thus forwarded that if current suitable land areas can support rice and corn demands for a projected population increase, then there is also a current potential to produce at a surplus and compete in the global market for both products. However, there are several moderating variables that limit the use of available agricultural resources and affect the country's actual production outputs, namely: climate (typhoon-prone for Luzon and Visayas), small area covered by irrigation facilities, small landholdings, and low incentives to use modern technologies due to the low benefit-cost ratio. Nevertheless, the study proposes that investment in R&D and policy changes could balance out the negative effects of these moderating factors, specifically: a) R&D on typhoon-tolerant varieties; b) expansion of irrigation facilities; c) reducing cost of inputs through policies; etc.
In addressing agricultural production requirements while competing with other
Asian agricultural producers, major differences in terms of respective characteristics of the agricultural sector must be considered:
• Among the four countries, the Philippines is the smallest followed by Malaysia. This
implies that the country's approach to compete production-wise through the expansion agricultural areas can only help to a limited extent since Thailand, Indonesia and Malaysia have greater potentials for expansion.
• In terms of the ratio of land to agricultural population, the country's closest
"competition" is Indonesia. Both Thailand and Malaysia's increasing man-land ratios for the same period may be attributed to the negative change in agricultural population. This indicates that the country does not really need to advocate for the increased transfer of labor forces towards agriculture (ex. "Back-to-the-Province" projects for urban areas) but instead must diversify into other entrepreneurial activities.
• Our agricultural land is predominantly planted to rice, corn and coconut. In terms of rice, our growth rates are comparable to those of our Asian neighbors. While the growth of our corn yield level is also comparable to Thailand and Indonesia, ours remain the lowest in terms of absolute yield/ha. On the other hand, the Philippines reported the highest growth rate of coconut production area. The latter however was explained by the other countries' apparent interest in oil palm production, where the Philippines registered the lowest production area growth rate. All of the above provide the rationale for shifting towards the production of other crops instead of continuously seeking for the expansion of rice, corn or coconut production areas.
It must also be noted that while the study found that there is not much room for expansion of agricultural land, the identified suitable land areas for agricultural production in the Philippines are more than enough to produce the country's food requirements. Thus, food security is not really an issue. However, the country does suffer
from lower yield levels due to limitations imposed by weather conditions and inadequate irrigation systems.
The study also pointed out that in all approaches to agricultural development, support services play an important role. These support services (i.e., a more efficient marketing system which would bring down costs of distributing products) must be put in place in order to fully realize gains in agricultural resource utilization. This is highlighted by the cost of distribution of corn in the Philippines. In Thailand the cost is only US$ 15/mt, while in the Philippines it is US$62/mt. While our country’s relatively smaller landholdings contribute to the disparity in marketing and distribution costs, other factors include inefficiencies of marketing processes. Thus, there is an urgent need to transform our transportation and marketing system into an efficient and globally competitive system. Likewise, the study forwarded that there is little incentive for farmers to grow food crops because of the low return of investments. This can be attributed to small landholdings that result to very low net incomes from rice, corn or coconut. As net incomes from these crops are rarely enough for decent lifestyles, encouraging farmers to plant these crops would be tantamount to asking them to remain poor. Thus, while food security approaches may prescribe increased production of these crops, such may not be compatible with development goals of increasing farmers' incomes. Related this is the fact that Filipino farmers were found to derive substantial incomes from non-farm activities. Thus, it becomes doubly hard to encourage them to invest on necessary inputs (i.e. fertilizers) for increased agricultural production when they are able to obtain higher absolute incomes from non-farm opportunities. Any development initiative/policy must therefore be made within the context of these socio-economic concerns.
Diversification, which may include shifting production to high value crops, was raised as an option that could increase farm-level incomes. Other options could include shifting land use away from agriculture to agri-based enterprises. Whatever the case, the study noted a great need to reconcile national food security policy with the country’s policies on poverty eradication.
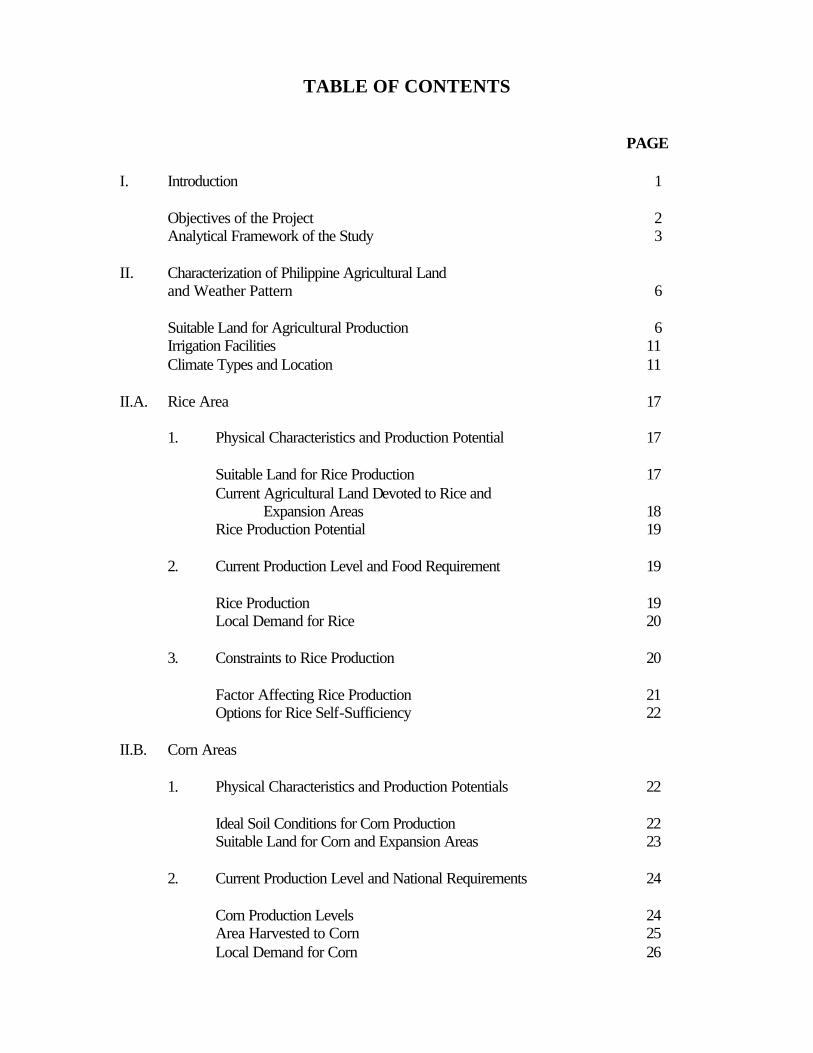
TABLE OF CONTENTS
PAGE
I. Introduction 1 Objectives of the Project 2 Analytical Framework of the Study 3 II. Characterization of Philippine Agricultural Land
and Weather Pattern 6
Suitable Land for Agricultural Production 6 Irrigation Facilities 11 Climate Types and Location 11 II.A. Rice Area 17 1. Physical Characteristics and Production Potential 17 Suitable Land for Rice Production 17 Current Agricultural Land Devoted to Rice and Expansion Areas 18 Rice Production Potential 19 2. Current Production Level and Food Requirement 19 Rice Production 19 Local Demand for Rice 20 3. Constraints to Rice Production 20 Factor Affecting Rice Production 21 Options for Rice Self-Sufficiency 22 II.B. Corn Areas 1. Physical Characteristics and Production Potentials 22 Ideal Soil Conditions for Corn Production 22 Suitable Land for Corn and Expansion Areas 23 2. Current Production Level and National Requirements 24 Corn Production Levels 24 Area Harvested to Corn 25 Local Demand for Corn 26
3. Constraints to Corn Production 27 Climate 28 Low Fertilizer Application Rates 28 Low Farmer Income from Corn 29 II.C. Coconut Areas 30 1. Physical Characteristics 30 Ideal Conditions for Coconut Production 30 Land Areas Suitable for Coconut Production 30 2. Current Production Level 33 3. Production Constraints 34 III. Comparative Analysis of Philippines with Selected
Asian Countries 35 Land Areas and Land Use Across Countries 35 Agricultural Land and Population 36 Water Resource Across Countries 37 Weather/Climate Across Countries 37
III.A. Rice Area (vis-à-vis Thailand and Indonesia) 38 Characteristics of Area Harvested to Rice 38 Rice Production Levels 39 Rice Yield Levels 40 III.B. Corn Area (vis-à-vis Thailand) 40 Area Harvested and Production Performance in Corn 40 Competitiveness in Corn Production 41 III.C. Coconut Area (vis-à-vis Malaysia’s Oil Palm) 43 Coconut/Oil Palm Production and Expansion Areas 43 Coconut/Palm Oil Industries 44 IV. General Discussion 44 V. References 49
LIST OF FIGURES
PAGE
1 Land Use and Rainfall Patterns of the Philippines (SOURCE: PCARRD, 1977)
7
2a General Soil Fertility in the Philippines (PCARRD, 1999) 8 2b General Soil Fertility in the Philippines (PCARRD, 1999) 9 2c General Soil Fertility in the Philippines (PCARRD, 1999) 10 3 Major river basins in the Philippines (PCARRD, 1991) 12 4 Frequency of tropical cyclone passage over each
Geographical zone in the Philippine (Gonzales, 1994) 13
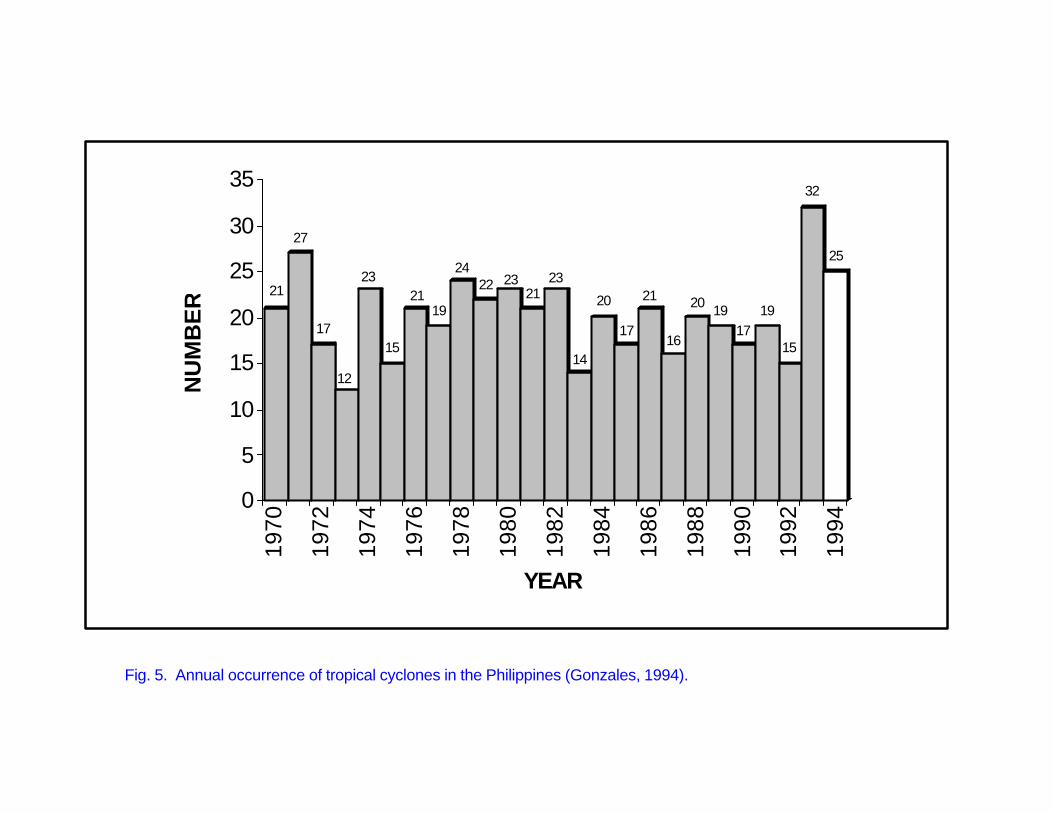
5 Annual occurrence of tropical cyclones in the Philippines (Gonzales, 1994)
14
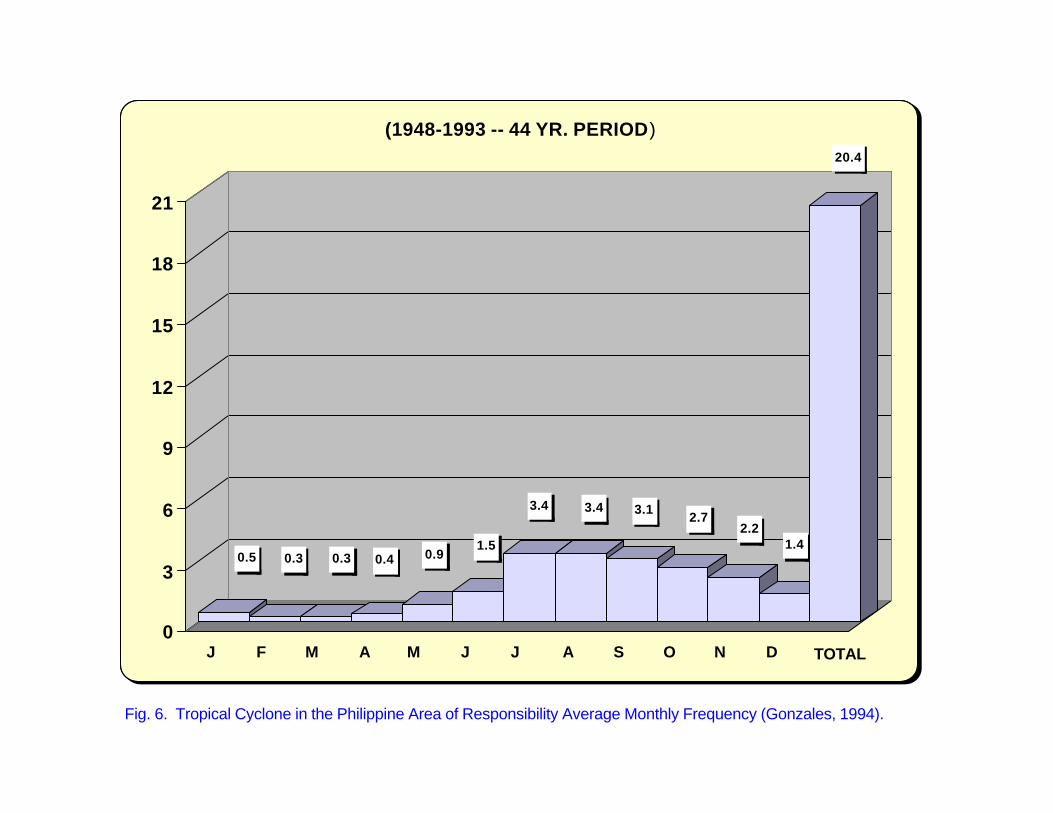
6 Tropical cyclone in the Philippine area of responsibility Average monthly frequency (Gonzales, 1994)
15
7a Average monthly paths of tropical cyclones entering the Philippine area of responsibility (PAR)-1st Quarter (Valenzuela, 1989 as cited by Gonzales, 1994)
16
7b Average monthly paths of tropical cyclones entering the Philippine area of responsibility (PAR)-2st Quarter (Valenzuela, 1989 as cited by Gonzales, 1994)
16
7c Average monthly paths of tropical cyclones entering the Philippine area of responsibility (PAR)-3st Quarter (Valenzuela, 1989 as cited by Gonzales, 1994)
16
7d Average monthly paths of tropical cyclones entering the Philippine area of responsibility (PAR)-4st Quarter (Valenzuela, 1989 as cited by Gonzales, 1994)
16
8 Irrigation Service Area, 1997 18 9 Monthly Harvested Area, 1997 19 10 Rice Yield Levels 20 11 Average Fertilization in Rice 21 12 National Corn Utilization, 1998 22 13 National corn production statistics 24 14a Corn production (%) by month in Luzon 1998 26 14b Corn production (5) by month in Visayas 1998 26 14c Corn production (5) by month in Mindanao 27 15 Yield of yellow corn, 1994-98 28 16 Fertilizer application rate in yellow corn, 1997 28 17 Regional land distribution suitable for coconut 30 18 Land suitability for coconut 31 19 Distribution of coconut area 33 20 Coconut area 33 21 Number of Bearing trees 33 22 Coconut production 33 23 Nut production per tree 33 24a Northwest pacific tropical cyclones 38 24b Worldwide tropical cyclones 38
LIST OF TABLES
PAGE
1 General land use in the Philippines, 1990 (de Jesus, 2001) 6 2 Extent of irrigated lands in the Philippines, 1990,
(de Jesus, 2001) 11
3 Soil suitability for wetland rice production of major river basins in the Philippines (Fernandez, 1999)
17
4 Traditional rice areas in the Philippines (Fernandez, 1998) 18 5 Provinces with highly suitable soil series for corn production and
its equivalent areas (Orno-Coladilla and Rocamora, 2001) 23
6 Total area (ha) of highly and moderately suitable soil series by region for corn production (orno-Coladilla and Rocamora, 2001)
24
7 Corn production by region, 1998 (source: BAS, 2000) 25 8 Yield of white and yellow corn in different regions of the
Philippines, 1998 27
9 Net benefit of corn production at different market areas in different regions of the Philippines, 1998
29
10 Highly and moderately suitable potential areas for coconut production in the Philippines
32
11 Top coconut producing regions in the Philippines, 1999 (UCAP, 2000)
34
12 Land use across selected countries, 1998 (FAO, 2000) 36 13 Ration of land to agricultural population across selected
countries, 1989 and 1998 (FAO, 2000) 36
14 Average annual growth rate of net irrigated areas across selected countries (FAO, 2000)
37
15 Area harvested to rice across countries, 1989 to 1999 (FAO, 2000)
39
16 Growth of rice production across countries, 2989 to 1999 (FAO, 2000)
39
17 Rice yields across countries, 1989 to 1999 (FAO, 2000) 40 18 Area harvested, production and yield of corn, 1989 and 1999
(FAO, 2000) 41
19 Updated average production costs and returns of yellow corn, Philippines, 1991-1997 (BAS, 2000)
41
20 Comparison of average production and marketing and distribution costs of corn (US$/mt) for Argentina, Thailand and the Philippines, wet season cropping, 1997-1998 (BAS, 2000)
42
21 Comparison of average production and marketing and distribution costs of corn (US$/mt) for Argentina, Thailand and the Philippines, cry season cropping, 1997-1998 (BAS, 2000)
43
22 Growth of coconut production (000’ tons) across countries 1989 to 1999 (FAO, 2000)
43
23 Growth of oil palm production (000’ tons) across countries 1989 to 1999 (FAO, 2000)
44
24 Summary of comparisons across countries 45
Assessment of Physical Resource Capability in Philippine Agriculture*
Luis Rey I. Velasco Dean
College of Agriculture, UPLB
and
Liborio S. Cabanilla Professor
College of Economics & Management, UPLB I. Introduction
The implementation of trade liberalization policies among national economies, including the Philippines, should be viewed as a necessity rather than a result of political agreements. Trade must be looked upon as a window of opportunity rather than as a threat to development. Global trends show that inward-looking countries have stagnated while outward-looking states prospered. It must be pointed out, however, that to take full advantage of the opportunities in a globally oriented economy, appropriate adjustments must be undertaken in the domestic scene. Often, the full benefits of trade are not realized due to the defects in the domestic system.
A basic philosophy towards a liberalized economy, especially in agriculture, would be to rationalize the use of natural resources. It is important to understand and determine how natural resources (i.e., land and water) should be used to promote food security, poverty alleviation, global competitiveness and health of the environment for sustained development.
In terms of food security, there is a need to look at whether or not our agricultural physical resources can support our current population's demand for agricultural products. Can it support the future demands of an ever-increasing populace despite the fact that agriculture's main resource (i.e. land) is relatively fixed? Does the current agricultural resource utilization support the country's bid to increase rural incomes and alleviate poverty? Given these resources, can the Philippines compete with other countries in terms of agricultural production levels? Will it enable the agriculture sector to supply products at competitive prices?
* a research project funded by the Philippine APEC Study Center Network (PASCN)
2
For global competitiveness, it is important to note that our three closest competitors in agricultural products are Thailand, Malaysia and Indonesia. In terms of sheer land mass, Indonesia is by far the largest followed by Thailand and Malaysia. The Philippines, in this regard, is smallest. The same trend goes for the land area devoted to agriculture except for Malaysia which has the smallest agricultural land area. Despite this, Malaysia has the largest per capita land as indicated by the ratio of agricultural land to agricultural population. Trailing behind are Thailand, Philippines and Indonesia, respectively.
Trade patterns in terms of major agricultural imports/exports indicate that the
Philippines is the only net importer among these countries in terms of overall agricultural imports versus exports in 1998. Malaysia and Thailand exported rice from 1988 to 1998 while Indonesia started exporting (in minor quantities) rice in 1996. The Philippines, however, has been a consistent net importer of rice in the same period. In this instance, it is quite valid to question why our Asian neighbors are able to export rice when their technologies and experts have often been (and continue to be) trained in the Philippines, particularly at the University of the Philippines Los Baños. The obvious answer lies in the fact that their physical resources, in terms of rice area, are 3-4 times larger compared to that of the Philippines.
With the abovementioned general agricultural performance, can the Philippines
really compete? Do we have the resources to do so? These are issues that have to be answered if the country is to chart its course
towards sustainable agricultural development. Whatever the case, there is a pressing need to identify what interventions are needed to ensure that the above issues are addressed positively. Given the country's physical resource capabilities, what then are the requirements (e.g. human/expertise, infrastructure, policies, etc.) that would enable the country to provide current and future agricultural demands of the population as well as ensure global competitiveness of the agriculture sector? Objectives of the Project
The general objective of this study was to assess the physical resources (i.e., land, water and weather pattern) of the Philippines as compared to other agricultural countries in Asia. Of particular interest are the rice, corn and coconut production systems.
The specific objectives were as follows:
1. Describe the physical characteristics of the country in terms of agricultural capabilities and define the boundaries and interactions among resources that influence agricultural production.
3
2. Map out the major agricultural production areas and determine the possible relationships between performance and resources.
3. Compare the Philippines’ physical resources and agricultural performance with
countries such as Thailand (rice and corn), Indonesia (rice and coconut) and Malaysia (coconut versus oil palm).
4. Identify some policy issues regarding the effective and efficient use of these
resources for agricultural development.
5. Prepare an abridged version of the research report that may be used specifically for advocacy work related to more efficient allocation of agricultural resources.
Analytical Framework of the Study
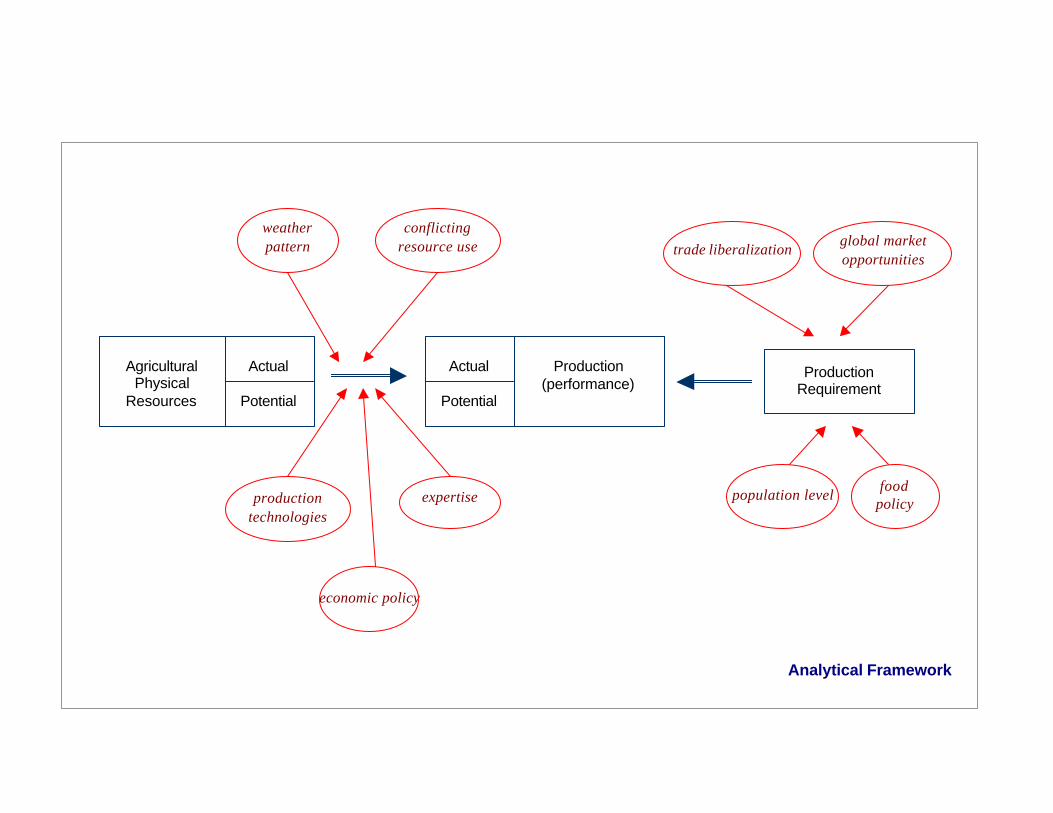
Illustrated below is the analytical framework of the study to determine the relationship between agricultural physical resources and performance. This is also the framework followed to compare agricultural physical resources and performance of selected countries in Southeast Asia.
Agricultural performance in this study refers to productivity level against the
desired national production requirements. In a sense this can mean effective performance or the ability of the country, based on historical data vis-à-vis its potential (research-determined) to supply production requirements. Production requirements are thereby influenced by increasing population levels, global market demands as opportunities for market participation and local/global policies.
Efficient performance, on the other hand, refers to the how well the physical
resources are managed so that its utilization would result to maximum productivity without undue consequences to the sustainability of the physical resources. Optimum physical resource use is likewise influenced by other factors --- weather pattern, conflicts in resource use, production technologies, agricultural human resource/expertise and sector-specific economic policies.
Operationally, the indicator used in this study is actual productivity per unit area
against potential productivity per unit area. The latter is based on field trials managed by researchers.
Agricultural physical resources (i.e., land area, land suitability and available water
for irrigation) are finite resources that determine the potential productivity level of a country. There are moderating variables that tend to contribute to either increased or decreased use of these resources, and to the level of agricultural productivity. An important moderating variable is weather pattern. It may either have an increasing or decreasing effect on productivity depending on the weather element and on the crop. For
4
example, occurrence of rainfall may contribute to increased productivity for a particular crop. However, if rainfall will occur continuously for a prolonged period, coinciding with the critical stage (e.g., fruiting) of the crop, the effect will be a decrease in productivity. In a similar vein, typhoons with strong winds would most likely decrease productivity for most crops. Recently, there have been significant changes in global weather patterns. Thus, indicative changes in agricultural productivity can be expected.
The use of production technologies (e.g., fertilizer, high yielding modern
varieties) tends to increase productivity. Likewise, expertise can contribute to increased productivity and counter the possible negative influence of weather. Another moderating variable is the conflicting use of physical resources for agriculture and non-agriculture activities such as loss of our prime agriculture areas to urbanization. The economic policy environment is also another moderating variable. By design, policy should contribute to higher productivity.
For the purposes of this study, attention was focused on the following moderating
variables: weather pattern and use of production technologies. Limited reference was also made regarding some economic policies that may have affected productivity.
weather pattern
Agricultural
Physical Resources
Actual
Potential
Production
(performance)
Actual
Potential
Production Requirement
conflicting resource use
production technologies
expertise
economic policy
population level
food policy
trade liberalizationglobal market opportunities
Analytical Framework
6
II. Characterization of Philippine Agricultural Land and Weather Pattern
The Philippines is said to be an agricultural country with bountiful natural endowments and an ideal tropical climate for agriculture. However, this is only one side of the story. While the country has much physical resources to boast of, global perspectives on agricultural profiles of other countries may indicate that there is much to be desired. Of particular note are neighboring countries (with their respective resource and production performance profiles) that the Philippines compete with in terms of global market participation. Also, while internal analyses of physical resource may provide an overview on the country's capacity to address food security, there is a need to look at how the Philippines fares with respect to global competitiveness. Part III of the paper details a comparative of analysis of Philippine physical resources and production performance with selected Asian countries --- Thailand, Indonesia and Malaysia.
This portion of the paper thus details the country’s agricultural physical resources,
providing us data on whether or not these resources can support current and future requirements of the populace.
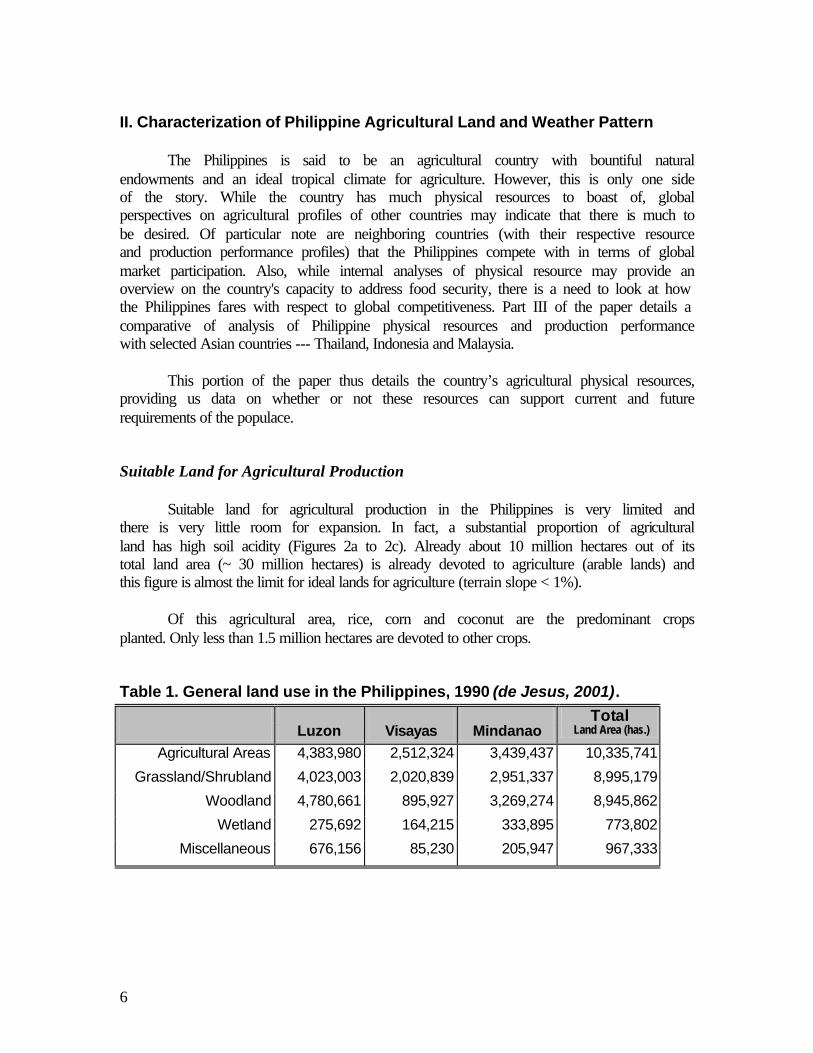
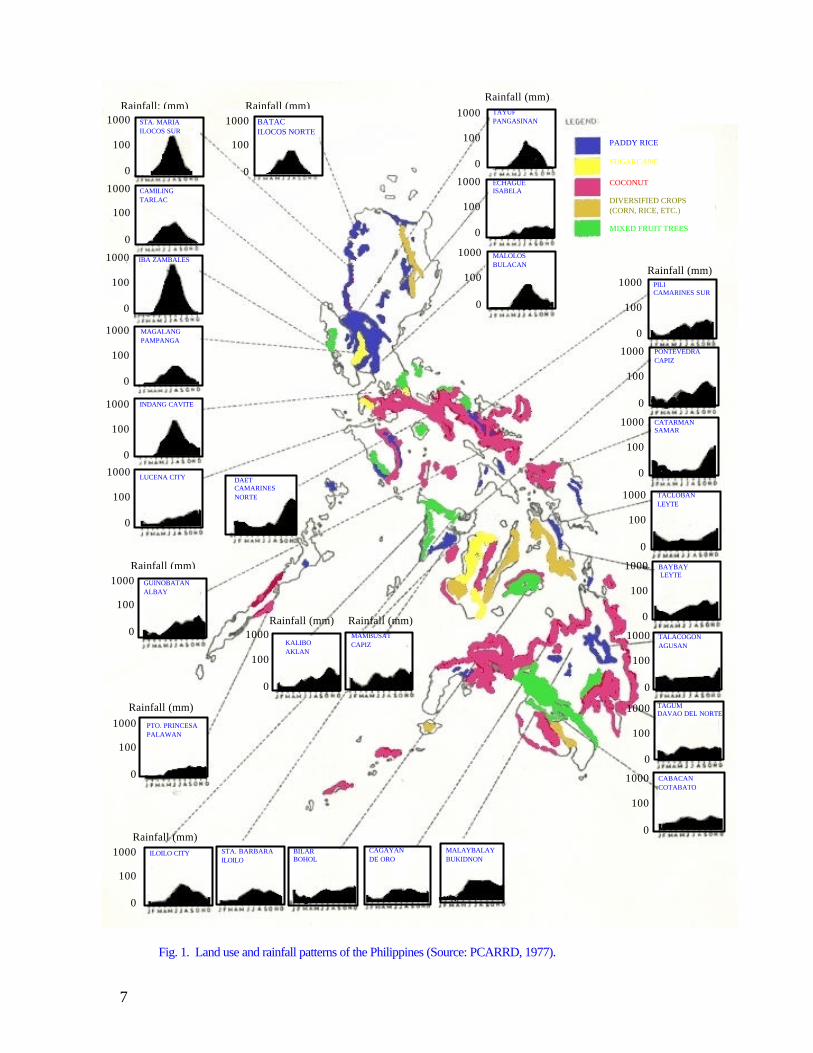
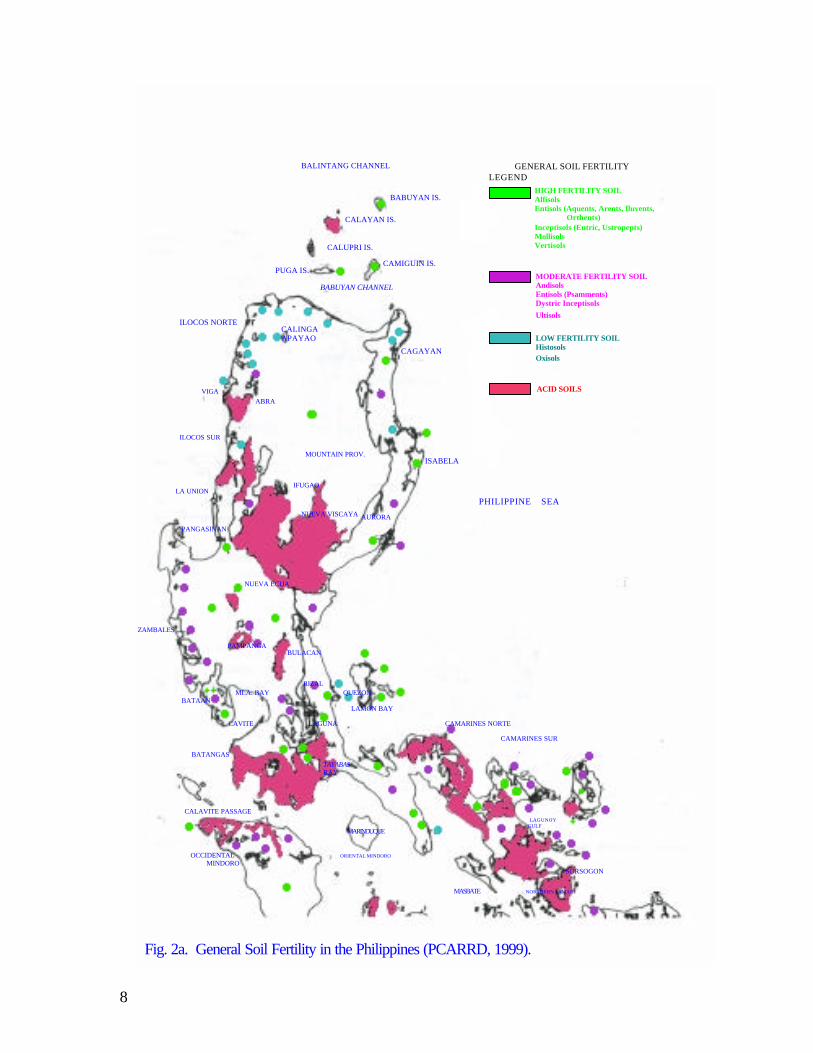
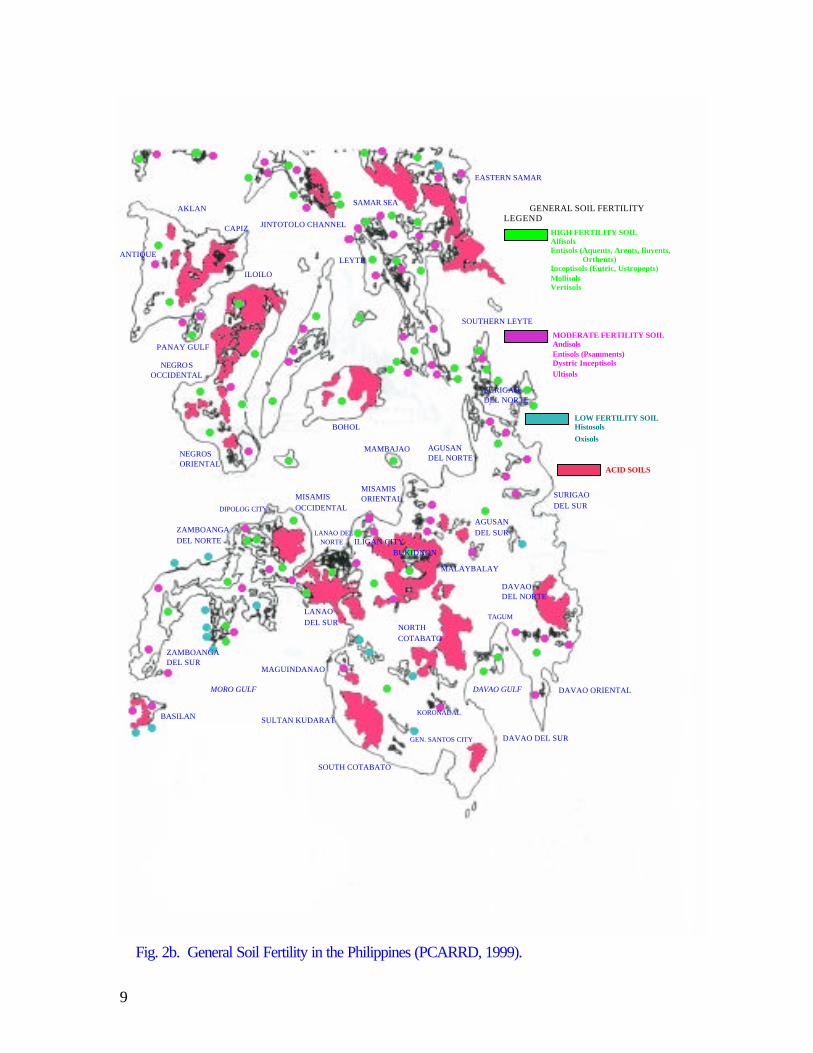
Suitable Land for Agricultural Production
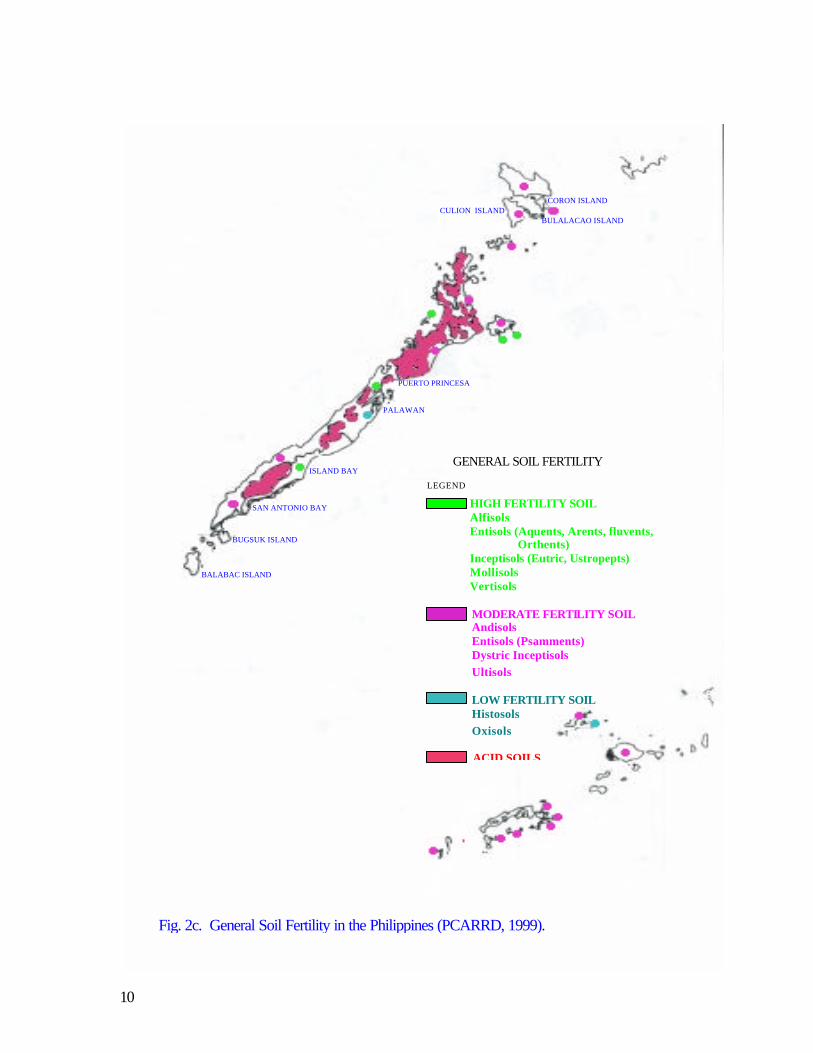
Suitable land for agricultural production in the Philippines is very limited and there is very little room for expansion. In fact, a substantial proportion of agricultural land has high soil acidity (Figures 2a to 2c). Already about 10 million hectares out of its total land area (~ 30 million hectares) is already devoted to agriculture (arable lands) and this figure is almost the limit for ideal lands for agriculture (terrain slope < 1%).
Of this agricultural area, rice, corn and coconut are the predominant crops
planted. Only less than 1.5 million hectares are devoted to other crops. Table 1. General land use in the Philippines, 1990 (de Jesus, 2001). Total Luzon Visayas Mindanao Land Area (has.)
Agricultural Areas 4,383,980 2,512,324 3,439,437 10,335,741 Grassland/Shrubland 4,023,003 2,020,839 2,951,337 8,995,179
Woodland 4,780,661 895,927 3,269,274 8,945,862 Wetland 275,692 164,215 333,895 773,802
Miscellaneous 676,156 85,230 205,947 967,333
7
1000 100 0
Rainfall: (mm)
IBA ZAMBALES
MAGALANG PAMPANGA
INDANG CAVITE
LUCENA CITY DAET CAMARINES NORTE
Rainfall (mm)
BATAC ILOCOS NORTE
Rainfall (mm) TAYUF PANGASINAN
ECHAGUE ISABELA
MALOLOS BULACAN
Rainfall (mm) PILI CAMARINES SUR
PONTEVEDRA CAPIZ
CATARMAN SAMAR
TACLOBAN LEYTE
BAYBAY LEYTE
TALACOGON AGUSAN
Rainfall (mm)
GUINOBATAN ALBAY
Rainfall (mm) Rainfall (mm)
KALIBO AKLAN
MAMBUSAT CAPIZ
Rainfall (mm)
PTO. PRINCESA PALAWAN
TAGUM DAVAO DEL NORTE
CABACAN COTABATO
Rainfall (mm) ILOILO CITY STA. BARBARA
ILOILO BILAR BOHOL
CAGAYAN DE ORO
MALAYBALAY BUKIDNON
STA. MARIA ILOCOS SUR
CAMILING TARLAC
Fig. 1. Land use and rainfall patterns of the Philippines (Source: PCARRD, 1977).
1000 100 0
1000 100 0
1000 100 0
1000 100 0
1000 100 0
1000 100 0
1000 100 0
1000 100 0
1000 100 0
1000 100 0
1000 100 0
1000 100 0
1000 100 0
1000 100 0
1000 100 0
1000 100 0
1000 100 0
1000 100 0
1000 100 0
1000 100 0
1000 100 0
PADDY RICE SUGARCANE COCONUT DIVERSIFIED CROPS (CORN, RICE, ETC.)
MIXED FRUIT TREES
8
BALINTANG CHANNEL
CALINGA
APAYAO ABRA MOUNTAIN PROV. IFUGAO AURORA
VIGA ILOCOS SUR LA UNION NUEVA VISCAYA PANGASINAN
NUEVA ECIJA
ZAMBALES PAMPANGA BULACAN RIZAL
MLA. BAY QUEZON BATAAN
LAMON BAY CAVITE LAGUNA CAMARINES NORTE CAMARINES SUR BATANGAS
TAYABAS BAY
CALAVITE PASSAGE LAGUNOY GULF MARINDUQUE
OCCIDENTAL ORIENTAL MINDORO MINDORO SORSOGON
MASBATE NORTHERN SAMAR
BABUYAN IS.
CALAYAN IS.
PUGA IS. CAMIGUIN IS.
BABUYAN CHANNEL
ILOCOS NORTE
CAGAYAN
ISABELA
CALUPRI IS.
GENERAL SOIL FERTILITY LEGEND HIGH FERTILITY SOIL
Alfisols Entisols (Aquents, Arents, fluvents, Orthents) Inceptisols (Eutric, Ustropepts) Mollisols Vertisols
MODERATE FERTILITY SOIL Andisols Entisols (Psamments) Dystric Inceptisols
Ultisols
LOW FERTILITY SOIL Histosols Oxisols
ACID SOILS
PHILIPPINE SEA
Fig. 2a. General Soil Fertility in the Philippines (PCARRD, 1999).
9
EASTERN SAMAR
SAMAR SEA AKLAN
JINTOTOLO CHANNEL CAPIZ
ANTIQUE LEYTE
ILOILO
SOUTHERN LEYTE
PANAY GULF
NEGROS OCCIDENTAL
SURIGAO DEL NORTE
BOHOL
MAMBAJAO
AGUSAN DEL NORTE NEGROS
ORIENTAL
SURIGAO DEL SUR
MISAMIS ORIENTAL MISAMIS
OCCIDENTAL
LANAO DEL NORTE
DIPOLOG CITY
ZAMBOANGA DEL NORTE ILIGAN CITY
BUKIDNON
MALAYBALAY
AGUSAN DEL SUR
DAVAO DEL NORTE
LANAO DEL SUR
ZAMBOANGA DEL SUR
BASILAN SULTAN KUDARAT
MORO GULF
MAGUINDANAO
SOUTH COTABATO
GEN. SANTOS CITY
KORONADAL
DAVAO DEL SUR
DAVAO GULF DAVAO ORIENTAL
NORTH COTABATO
TAGUM
GENERAL SOIL FERTILITY LEGEND
HIGH FERTILITY SOIL Alfisols Entisols (Aquents, Arents, fluvents, Orthents) Inceptisols (Eutric, Ustropepts) Mollisols Vertisols
MODERATE FERTILITY SOIL Andisols Entisols (Psamments) Dystric Inceptisols Ultisols
LOW FERTILITY SOIL Histosols
Oxisols
ACID SOILS
Fig. 2b. General Soil Fertility in the Philippines (PCARRD, 1999).
10
CULION ISLAND CORON ISLAND
BULALACAO ISLAND
PALAWAN
PUERTO PRINCESA
BUGSUK ISLAND
SAN ANTONIO BAY
GENERAL SOIL FERTILITY LEGEND
HIGH FERTILITY SOIL Alfisols Entisols (Aquents, Arents, fluvents, Orthents) Inceptisols (Eutric, Ustropepts) Mollisols Vertisols
MODERATE FERTILITY SOIL Andisols Entisols (Psamments) Dystric Inceptisols Ultisols
LOW FERTILITY SOIL Histosols Oxisols
ACID SOILS
BALABAC ISLAND
ISLAND BAY
Fig. 2c. General Soil Fertility in the Philippines (PCARRD, 1999).
11
Irrigation Facilities
Despite having a large potentially irrigable area (3 million hectares), the total agricultural area covered by irrigation has not increased since the 1970s. The reported agricultural land covered by irrigation facilities owned by the government in 1990 was reported at 1.5 million hectares.
However, in terms of overall effectiveness of service, probably only 0.6 million
hectares of agricultural land can be considered as having good and reliable irrigation all year round. Most of the areas covered with good irrigation facilities are also in Luzon. Only 0.3 million hectares are irrigated land in Mindanao, which is the most ideal region for agriculture in the Philippines.
Table 2. Extent of Irrigated Lands in the Philippines, 1990 (de Jesus, 2001). Presently Irrigated Present Potential Government Private Riceland Irrigable Area Assisted Philippines 2,895,923 3,068,739 1,414,248 1,107,308
Luzon 2,049,560 1,897,195 994,961 1,107,308 Visayas 541,915 350,381 184,168 no data
Mindanao 304,448 821,163 235,119 no data
This problem in irrigation is compounded the country's highly variable weather
pattern and climate.
Climate Types and Location
The Philippines has four climate types. Type I is characterized by having two pronounced seasons --- dry season from November to April and wet season for the rest of the year. Luzon, Negros, Mindoro and Palawan are of this type. Type II climate has no dry season with a pronounced rainy period during November to January. With Type III, the seasons are not very pronounced. The dry months last only from one to three months. On the other hand, Type IV has an even distribution of rainfall all year round.
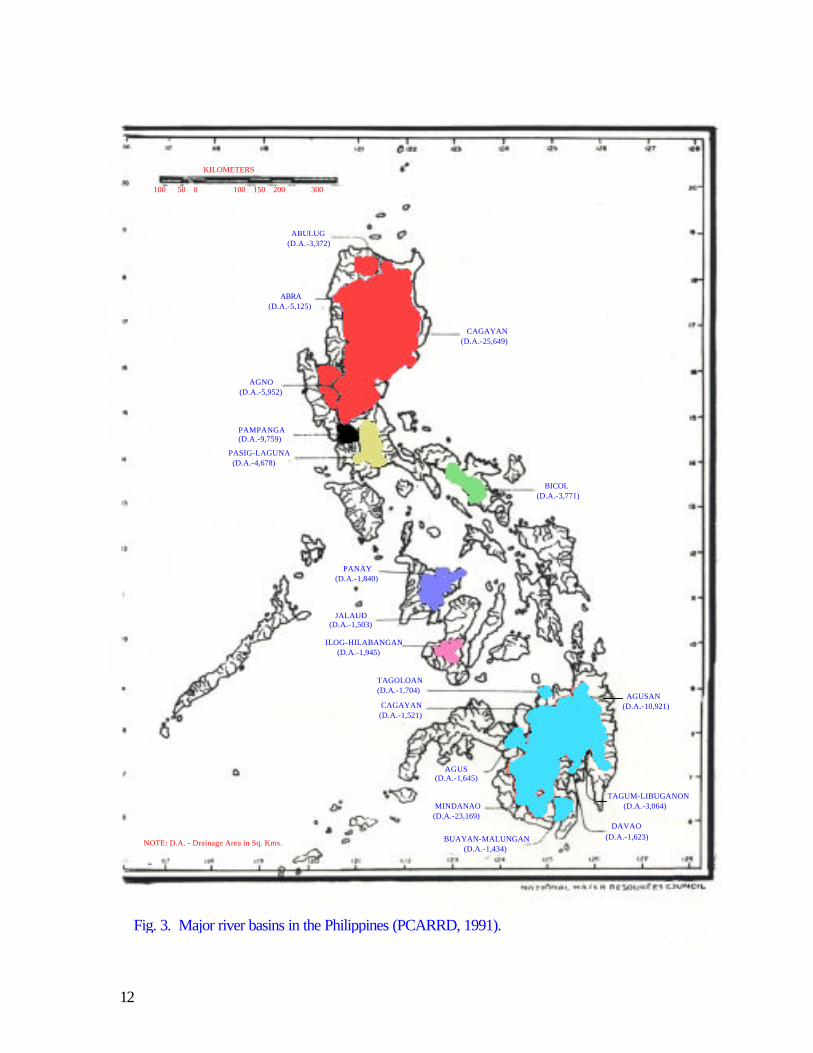
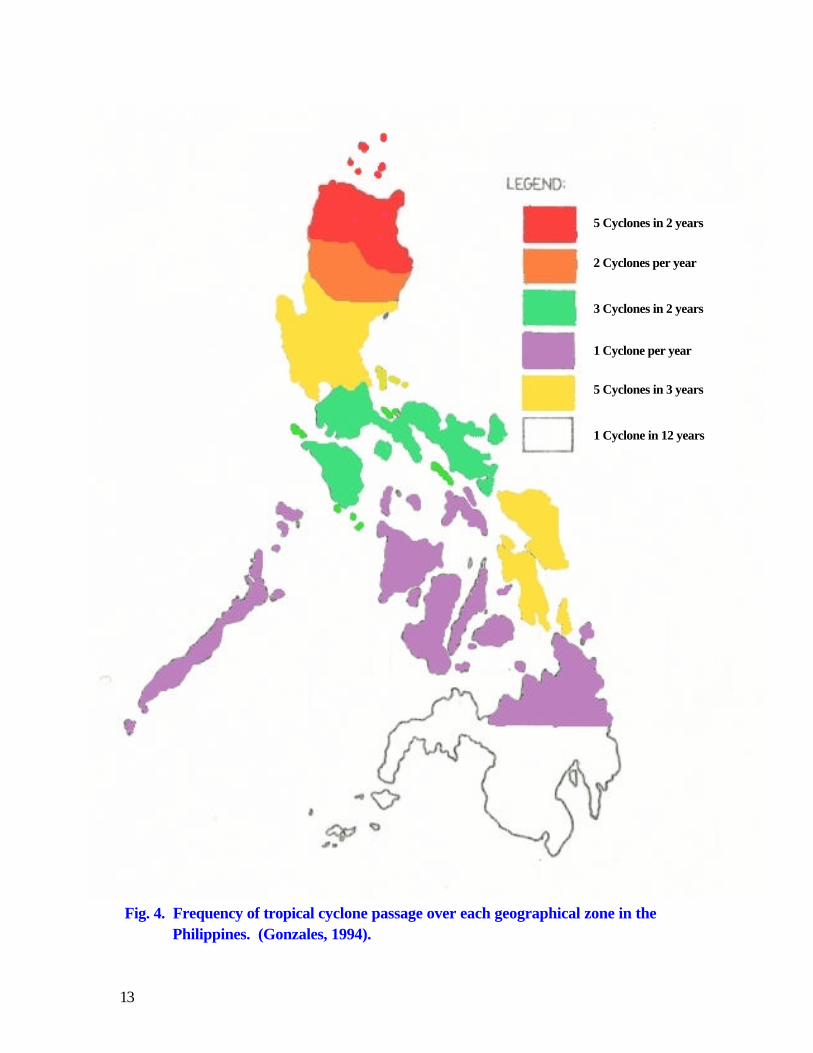
Our country is visited by an average of 19 typhoons every year during the wet
months. Crop performance in general is very low during the wet season because more often than not the crop is affected by the strong winds and water logging brought about by the successive typhoons. In some areas, however, the problem is prolonged dry months which restricts cropping only during the wet months. The only region in the Philippines that may be considered safe from typhoons and/or prolonged drought is Mindanao. Mindanao and Palawan have a Type IV climate, characterized by even rainfall distribution all year round and both are rarely visited by typhoons. But a different problem, one could say man-made constraints, is present in most municipalities of Mindanao.
12
ABULUG (D.A.-3,372)
ABRA (D.A.-5,125)
CAGAYAN (D.A.-25,649)
AGNO (D.A.-5,952)
PAMPANGA (D.A.-9,759)
PASIG-LAGUNA (D.A.-4,678)
BICOL (D.A.-3,771)
PANAY (D.A.-1,840)
JALAUD (D.A.-1,503) ILOG-HILABANGAN (D.A.-1,945)
TAGOLOAN (D.A.-1,704)
CAGAYAN (D.A.-1,521)
AGUSAN (D.A.-10,921)
AGUS (D.A.-1,645) MINDANAO (D.A.-23,169)
TAGUM-LIBUGANON (D.A.-3,064)
DAVAO (D.A.-1,623) BUAYAN-MALUNGAN
(D.A.-1,434) NOTE: D.A. - Drainage Area in Sq. Kms.
100 50 0 100 150 200 300
KILOMETERS
Fig. 3. Major river basins in the Philippines (PCARRD, 1991).
13
5 Cyclones in 2 years
2 Cyclones per year 3 Cyclones in 2 years
1 Cyclone per year
5 Cyclones in 3 years 1 Cyclone in 12 years
Fig. 4. Frequency of tropical cyclone passage over each geographical zone in the Philippines. (Gonzales, 1994).
21
27
17
12
23
15
2119
2422 23
2123
14
20
17
21
16
20 1917
19
15
32
25
0
5
10
15
20
25
30
35N
UM
BE
R
1970
1972
1974
1976
1978
1980
1982
1984
1986
1988
1990
1992
1994
YEAR
Annual occurrence of tropical cyclones in the Philippines Fig. 5. Annual occurrence of tropical cyclones in the Philippines (Gonzales, 1994).
0.5 0.3 0.3 0.4 0.91.5
3.4 3.4 3.12.7
2.21.4
20.4
0
3
6
9
12
15
18
21
J F M A M J J A S O N D AVE
(1948-1993 -- 44 YR. PERIOD)
TOTAL
Fig. 6. Tropical Cyclone in the Philippine Area of Responsibility Average Monthly Frequency (Gonzales, 1994).
16
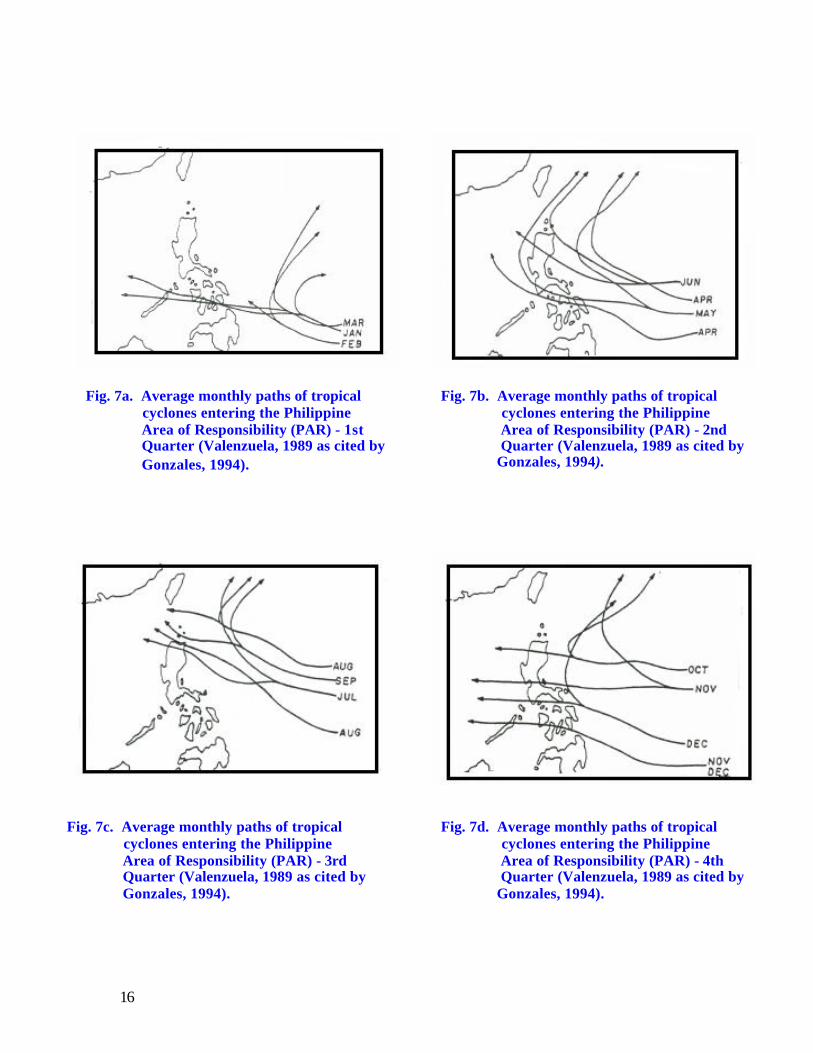
Fig. 7a. Average monthly paths of tropical cyclones entering the Philippine Area of Responsibility (PAR) - 1st Quarter (Valenzuela, 1989 as cited by Gonzales, 1994).
Fig. 7b. Average monthly paths of tropical cyclones entering the Philippine Area of Responsibility (PAR) - 2nd Quarter (Valenzuela, 1989 as cited by Gonzales, 1994).
Fig. 7c. Average monthly paths of tropical cyclones entering the Philippine Area of Responsibility (PAR) - 3rd Quarter (Valenzuela, 1989 as cited by Gonzales, 1994).
Fig. 7d. Average monthly paths of tropical cyclones entering the Philippine Area of Responsibility (PAR) - 4th Quarter (Valenzuela, 1989 as cited by Gonzales, 1994).
17
II.A. Rice Area II.A.1 Physical Characteristics and Production Potential Suitable Land for Rice Production
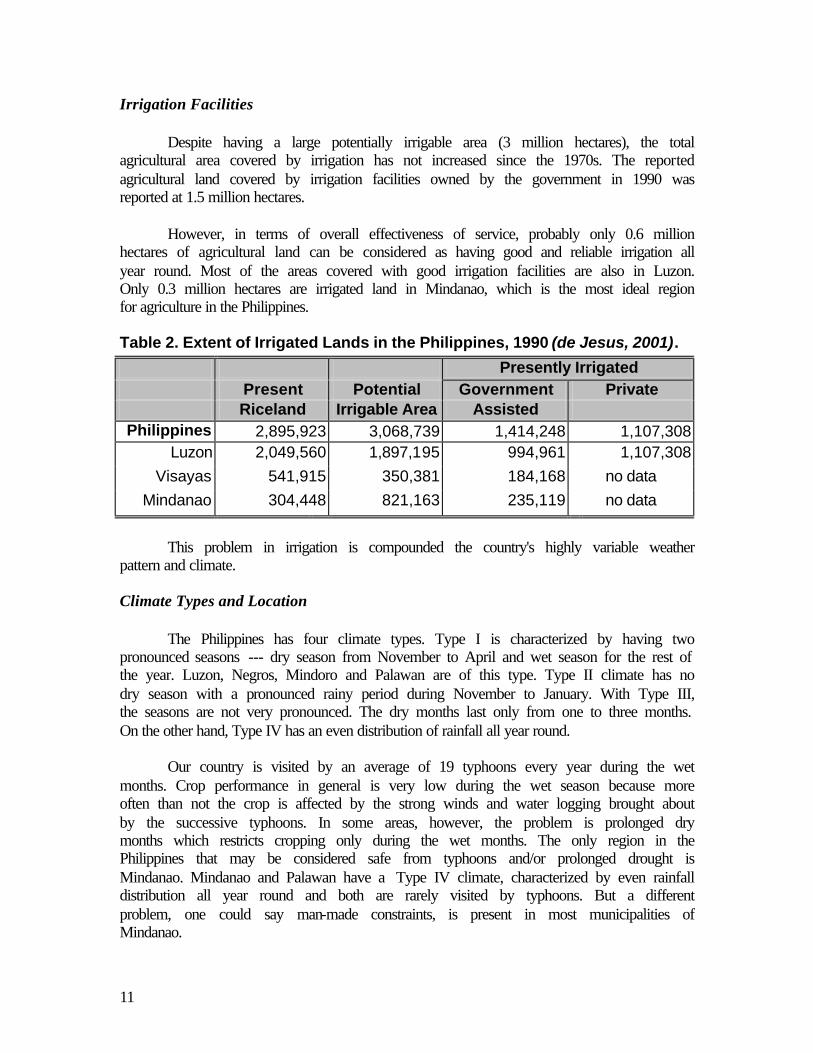
Wetland rice generally grows well in clayey and less permeable soil with a slope of less than one (<1) percent to maintain a flooded condition in the paddy. The ideal areas for wetland rice culture would be depositional landforms and associated landforms that are drainage areas of river basins (or watersheds). In the Philippines, there are 421 principal river basins, of which 20 are major, each with a minimum drainage area of 1,400 km2. Of these major river basins, 7 are in Luzon, 3 in Visayas and 10 are in Mindanao (PCARRD, 1991).
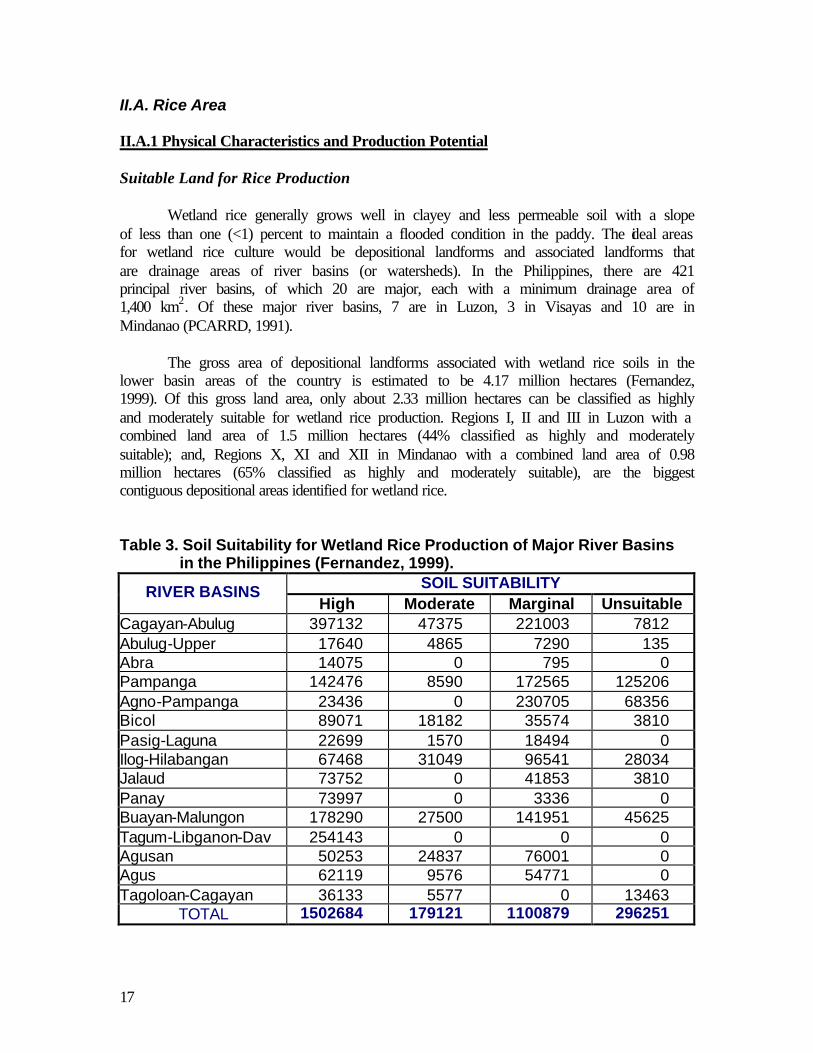
The gross area of depositional landforms associated with wetland rice soils in the
lower basin areas of the country is estimated to be 4.17 million hectares (Fernandez, 1999). Of this gross land area, only about 2.33 million hectares can be classified as highly and moderately suitable for wetland rice production. Regions I, II and III in Luzon with a combined land area of 1.5 million hectares (44% classified as highly and moderately suitable); and, Regions X, XI and XII in Mindanao with a combined land area of 0.98 million hectares (65% classified as highly and moderately suitable), are the biggest contiguous depositional areas identified for wetland rice.
Table 3. Soil Suitability for Wetland Rice Production of Major River Basins in the Philippines (Fernandez, 1999).
SOIL SUITABILITY RIVER BASINS High Moderate Marginal Unsuitable
Cagayan-Abulug 397132 47375 221003 7812 Abulug-Upper 17640 4865 7290 135 Abra 14075 0 795 0 Pampanga 142476 8590 172565 125206 Agno-Pampanga 23436 0 230705 68356 Bicol 89071 18182 35574 3810 Pasig-Laguna 22699 1570 18494 0 Ilog-Hilabangan 67468 31049 96541 28034 Jalaud 73752 0 41853 3810 Panay 73997 0 3336 0 Buayan-Malungon 178290 27500 141951 45625 Tagum-Libganon-Dav 254143 0 0 0 Agusan 50253 24837 76001 0 Agus 62119 9576 54771 0 Tagoloan-Cagayan 36133 5577 0 13463
TOTAL 1502684 179121 1100879 296251
18
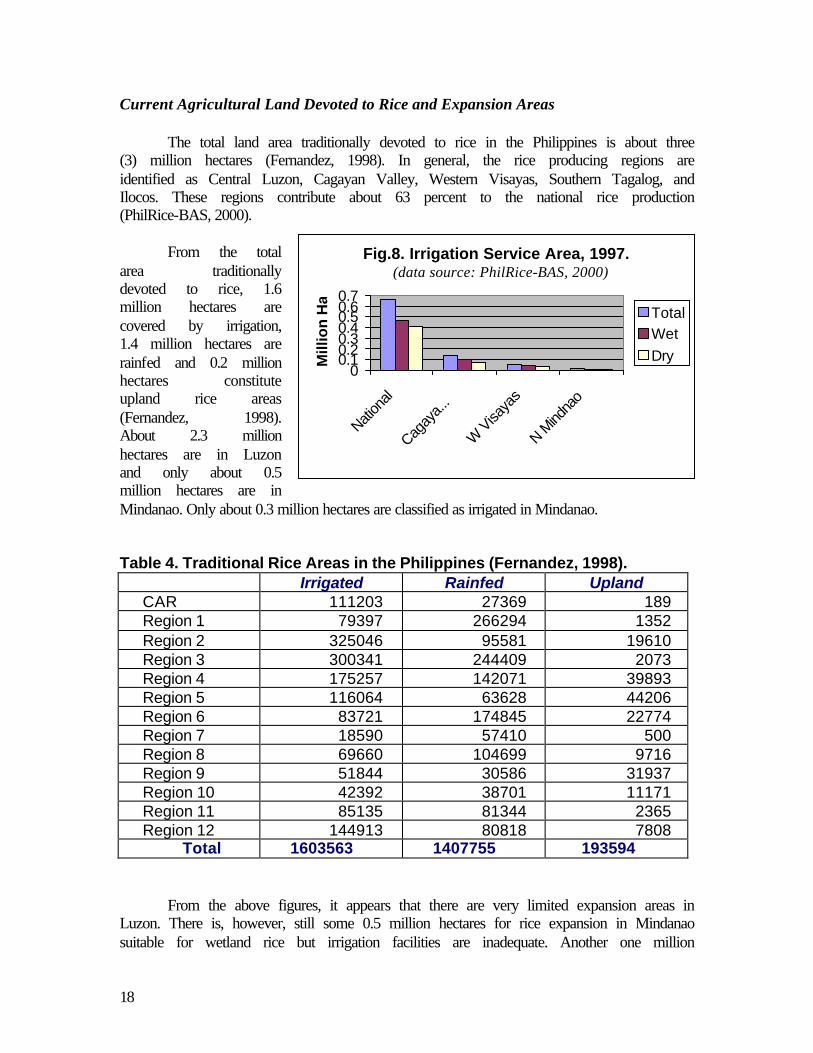
Fig.8. Irrigation Service Area, 1997.
00.10.20.30.40.50.60.7
Nation
al
Cagay
a...
W Visa
yas
N Mind
nao
Mill
ion
Ha
TotalWet Dry
Current Agricultural Land Devoted to Rice and Expansion Areas
The total land area traditionally devoted to rice in the Philippines is about three (3) million hectares (Fernandez, 1998). In general, the rice producing regions are identified as Central Luzon, Cagayan Valley, Western Visayas, Southern Tagalog, and Ilocos. These regions contribute about 63 percent to the national rice production (PhilRice-BAS, 2000).
From the total
area traditionally devoted to rice, 1.6 million hectares are covered by irrigation, 1.4 million hectares are rainfed and 0.2 million hectares constitute upland rice areas (Fernandez, 1998). About 2.3 million hectares are in Luzon and only about 0.5 million hectares are in Mindanao. Only about 0.3 million hectares are classified as irrigated in Mindanao.
Table 4. Traditional Rice Areas in the Philippines (Fernandez, 1998). Irrigated Rainfed Upland CAR 111203 27369 189 Region 1 79397 266294 1352 Region 2 325046 95581 19610 Region 3 300341 244409 2073 Region 4 175257 142071 39893 Region 5 116064 63628 44206 Region 6 83721 174845 22774 Region 7 18590 57410 500 Region 8 69660 104699 9716 Region 9 51844 30586 31937 Region 10 42392 38701 11171 Region 11 85135 81344 2365 Region 12 144913 80818 7808
Total 1603563 1407755 193594 From the above figures, it appears that there are very limited expansion areas in
Luzon. There is, however, still some 0.5 million hectares for rice expansion in Mindanao suitable for wetland rice but irrigation facilities are inadequate. Another one million
(data source: PhilRice-BAS, 2000)
19
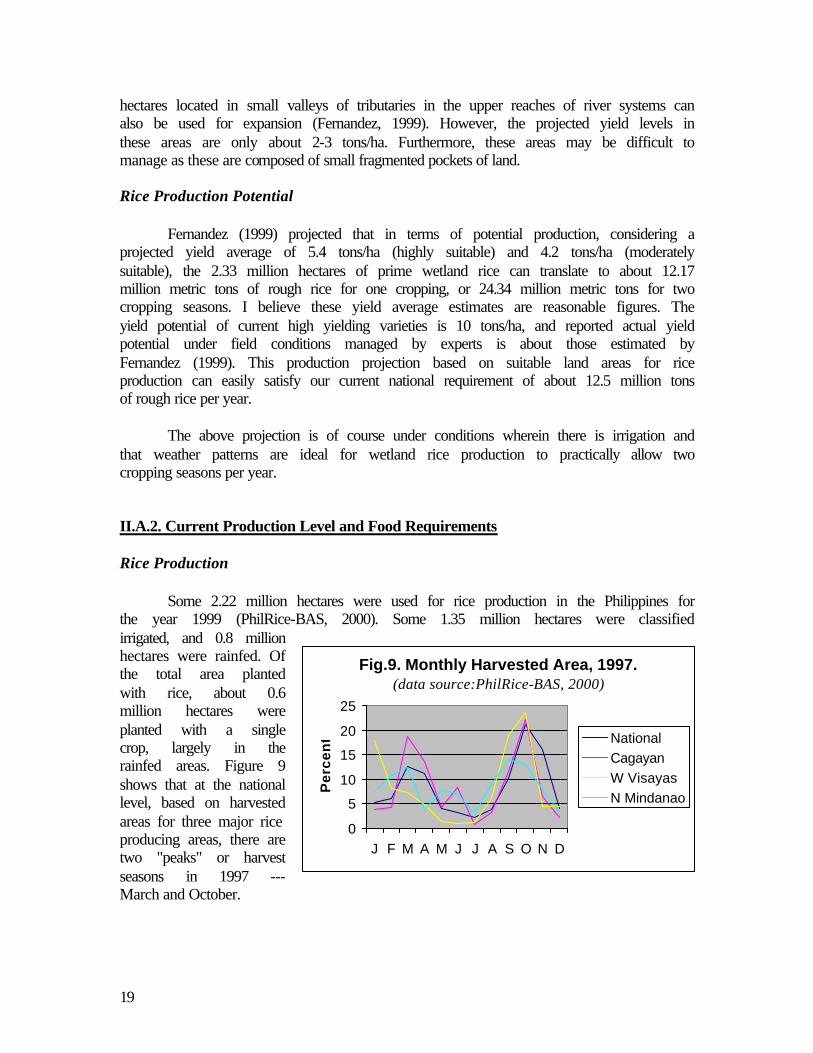
Fig.9. Monthly Harvested Area, 1997.
0
5
10
15
20
25
J F M A M J J A S O N D
Pe
rce
nt National
CagayanW VisayasN Mindanao
hectares located in small valleys of tributaries in the upper reaches of river systems can also be used for expansion (Fernandez, 1999). However, the projected yield levels in these areas are only about 2-3 tons/ha. Furthermore, these areas may be difficult to manage as these are composed of small fragmented pockets of land. Rice Production Potential
Fernandez (1999) projected that in terms of potential production, considering a projected yield average of 5.4 tons/ha (highly suitable) and 4.2 tons/ha (moderately suitable), the 2.33 million hectares of prime wetland rice can translate to about 12.17 million metric tons of rough rice for one cropping, or 24.34 million metric tons for two cropping seasons. I believe these yield average estimates are reasonable figures. The yield potential of current high yielding varieties is 10 tons/ha, and reported actual yield potential under field conditions managed by experts is about those estimated by Fernandez (1999). This production projection based on suitable land areas for rice production can easily satisfy our current national requirement of about 12.5 million tons of rough rice per year.
The above projection is of course under conditions wherein there is irrigation and
that weather patterns are ideal for wetland rice production to practically allow two cropping seasons per year.
II.A.2. Current Production Level and Food Requirements Rice Production
Some 2.22 million hectares were used for rice production in the Philippines for the year 1999 (PhilRice-BAS, 2000). Some 1.35 million hectares were classified irrigated, and 0.8 million hectares were rainfed. Of the total area planted with rice, about 0.6 million hectares were planted with a single crop, largely in the rainfed areas. Figure 9 shows that at the national level, based on harvested areas for three major rice producing areas, there are two "peaks" or harvest seasons in 1997 --- March and October.
(data source:PhilRice-BAS, 2000)
20
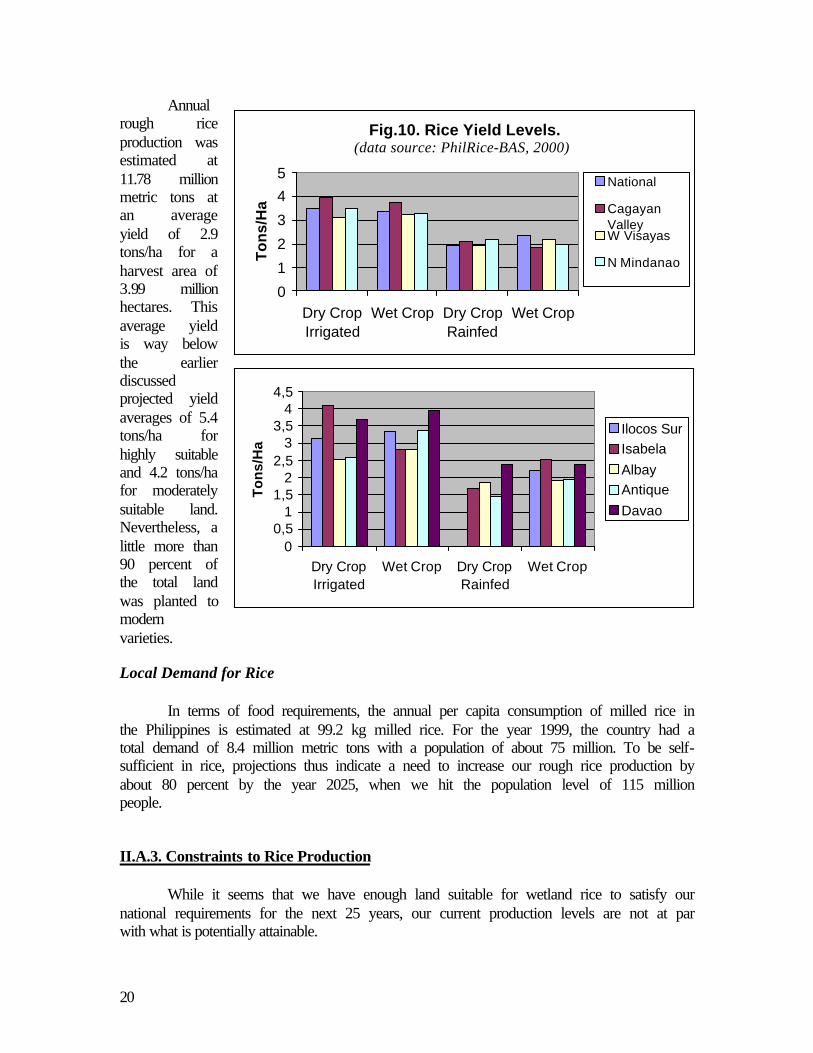
Annual rough rice production was estimated at 11.78 million metric tons at an average yield of 2.9 tons/ha for a harvest area of 3.99 million hectares. This average yield is way below the earlier discussed projected yield averages of 5.4 tons/ha for highly suitable and 4.2 tons/ha for moderately suitable land. Nevertheless, a little more than 90 percent of the total land was planted to modern varieties. Local Demand for Rice
In terms of food requirements, the annual per capita consumption of milled rice in the Philippines is estimated at 99.2 kg milled rice. For the year 1999, the country had a total demand of 8.4 million metric tons with a population of about 75 million. To be self-sufficient in rice, projections thus indicate a need to increase our rough rice production by about 80 percent by the year 2025, when we hit the population level of 115 million people.
II.A.3. Constraints to Rice Production
While it seems that we have enough land suitable for wetland rice to satisfy our
national requirements for the next 25 years, our current production levels are not at par with what is potentially attainable.
Fig.10. Rice Yield Levels.
012345
Dry CropIrrigated
Wet Crop Dry CropRainfed
Wet Crop
To
ns/
Ha
National
CagayanValleyW Visayas
N Mindanao
00,5
11,5
22,5
33,5
44,5
Dry CropIrrigated
Wet Crop Dry CropRainfed
Wet Crop
To
ns/
Ha
Ilocos SurIsabelaAlbayAntiqueDavao
(data source: PhilRice-BAS, 2000)
21
Factors Affecting Rice Production Three interrelated factors appear to seriously affect our rice production levels.
These are: (1) inadequate irrigation services, (2) the high incidence of typhoons, and (3) lack of incentive for rice farmers to implement modern farm management.
To obtain a good yield, rice requires continuous water and full sunlight from
seedling to grain filling growth stages. Rice grows well in slightly water-submerged conditions. Towards the harvest stage when most of the panicles had fully filled, heavy and continuous rainfall can seriously reduce harvest. Of the rice land in the Philippines, only about 0.6 million hectares have reliable irrigation services. The rest of the rice lands are dependent on rain.
Availability of water, which can be controlled, has a pronounced effect on yield.
Consistently, higher average yields are obtained in irrigated fields than rainfed fields regardless of cropping season. On the average, yield levels are 3-4 tons/ha in irrigated while in rainfed fields yields are only 2-3 tons/ha and lower during the dry cropping season. In some provinces, like Ilocos Sur, wetland rice is restricted to the wet season because of drought during the dry season. Typhoons with strong winds, particularly during the harvest stage of rice, and the continuous overcast cloudy conditions can significantly affect yields.
It is a wonder why farmers still plant rice! It is also a wonder why their yields are
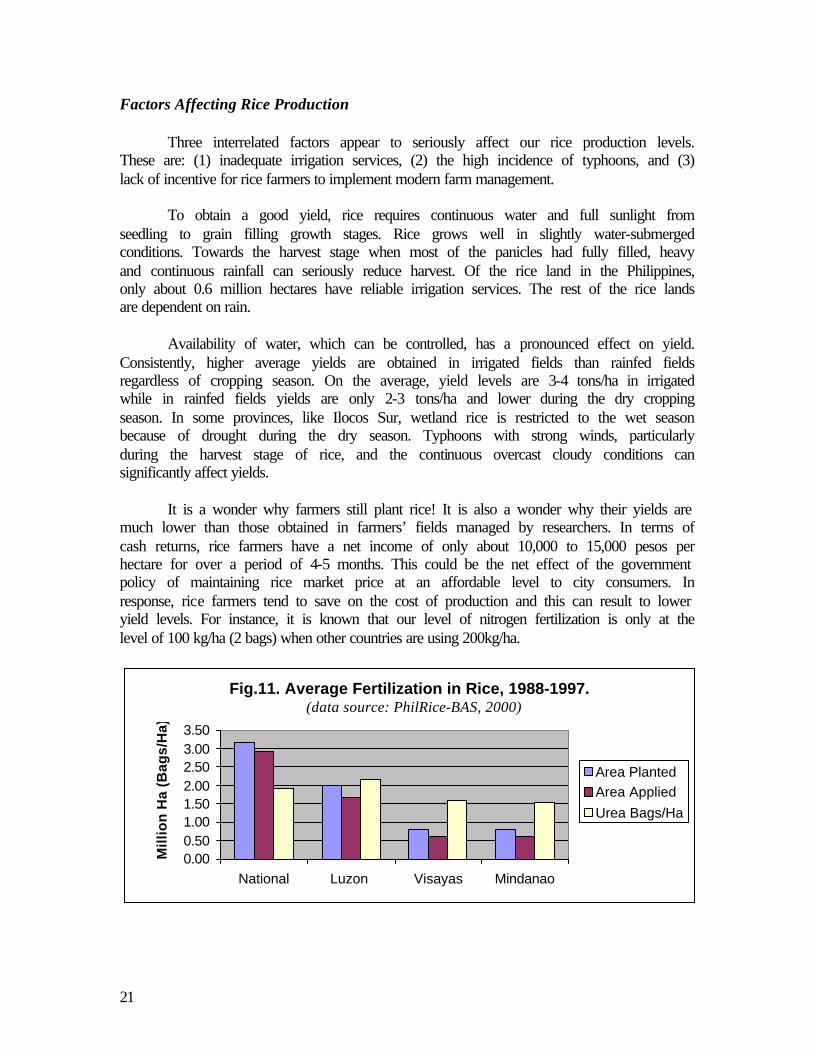
much lower than those obtained in farmers’ fields managed by researchers. In terms of cash returns, rice farmers have a net income of only about 10,000 to 15,000 pesos per hectare for over a period of 4-5 months. This could be the net effect of the government policy of maintaining rice market price at an affordable level to city consumers. In response, rice farmers tend to save on the cost of production and this can result to lower yield levels. For instance, it is known that our level of nitrogen fertilization is only at the level of 100 kg/ha (2 bags) when other countries are using 200kg/ha.
Fig.11. Average Fertilization in Rice, 1988-1997.
0.000.501.001.502.002.503.003.50
National Luzon Visayas Mindanao
Mill
ion
Ha
(Bag
s/H
a)
Area PlantedArea AppliedUrea Bags/Ha
(data source: PhilRice-BAS, 2000)
22
Options for Rice Self-Sufficiency
For the Philippines to be self-sufficient in rice, there are two options available ---to expand rice areas and/or to improve yield per unit area. Both options require a need to improve irrigation facilities nationwide. Apparently, the country’s major river basins can provide the necessary irrigation to supply some 2 million hectares of rice fields for two (2) cropping seasons.
At our current level of yield in irrigated fields of 3 tons/ha, we would need to
have at least 2 million hectares of irrigated rice area which should be planted to two crops/year. This is nearing the total land area identified in the country as highly and moderately suitable for wetland rice production. The area requirement can be reduced if yields can be improved by proper farm management like urea fertilization in terms of amount and timing of application (and, also use of good seed materials). Meeting the rice requirement in the next several years, however, presents the bigger challenge as the population increases with almost insignificant available areas for rice expansion. The only viable option would thus be to increase rice yield per unit area.
II.B. Corn Areas
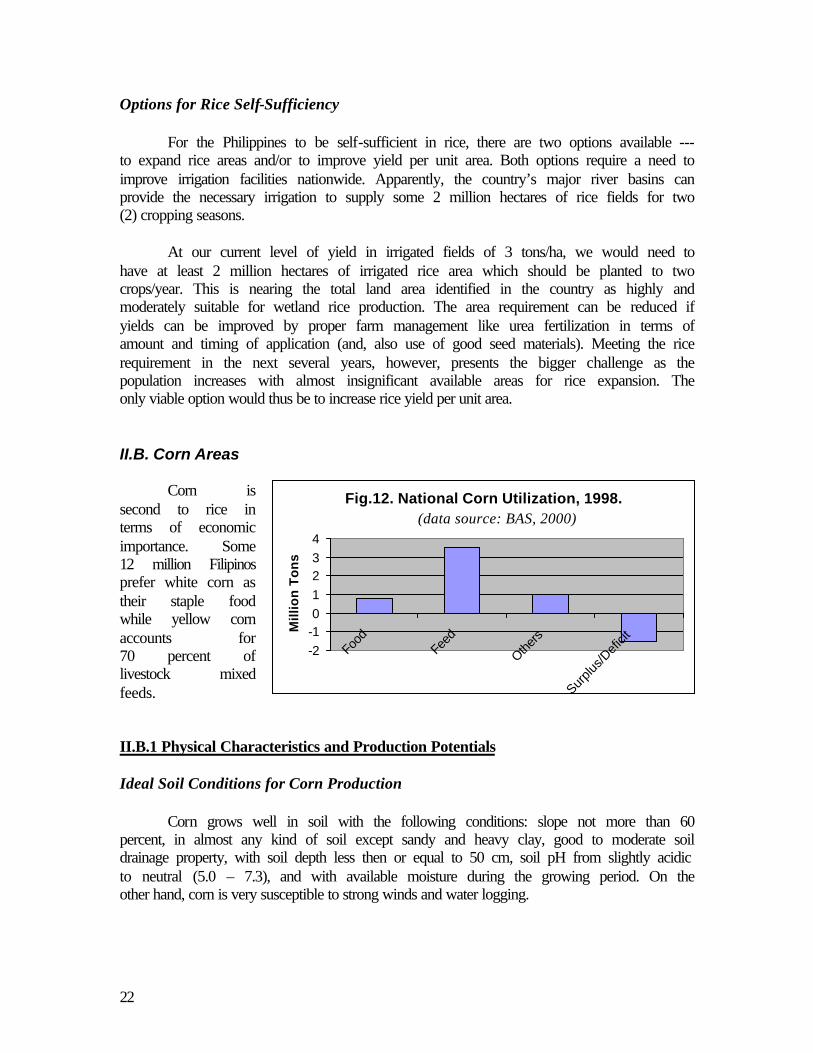
Corn is second to rice in terms of economic importance. Some 12 million Filipinos prefer white corn as their staple food while yellow corn accounts for 70 percent of livestock mixed feeds.
II.B.1 Physical Characteristics and Production Potentials Ideal Soil Conditions for Corn Production Corn grows well in soil with the following conditions: slope not more than 60 percent, in almost any kind of soil except sandy and heavy clay, good to moderate soil drainage property, with soil depth less then or equal to 50 cm, soil pH from slightly acidic to neutral (5.0 – 7.3), and with available moisture during the growing period. On the other hand, corn is very susceptible to strong winds and water logging.
Fig.12. National Corn Utilization, 1998.
-2-101234
Food
Feed
Others
Surplus
/Defi
cit
Mill
ion
To
ns
(data source: BAS, 2000)
23
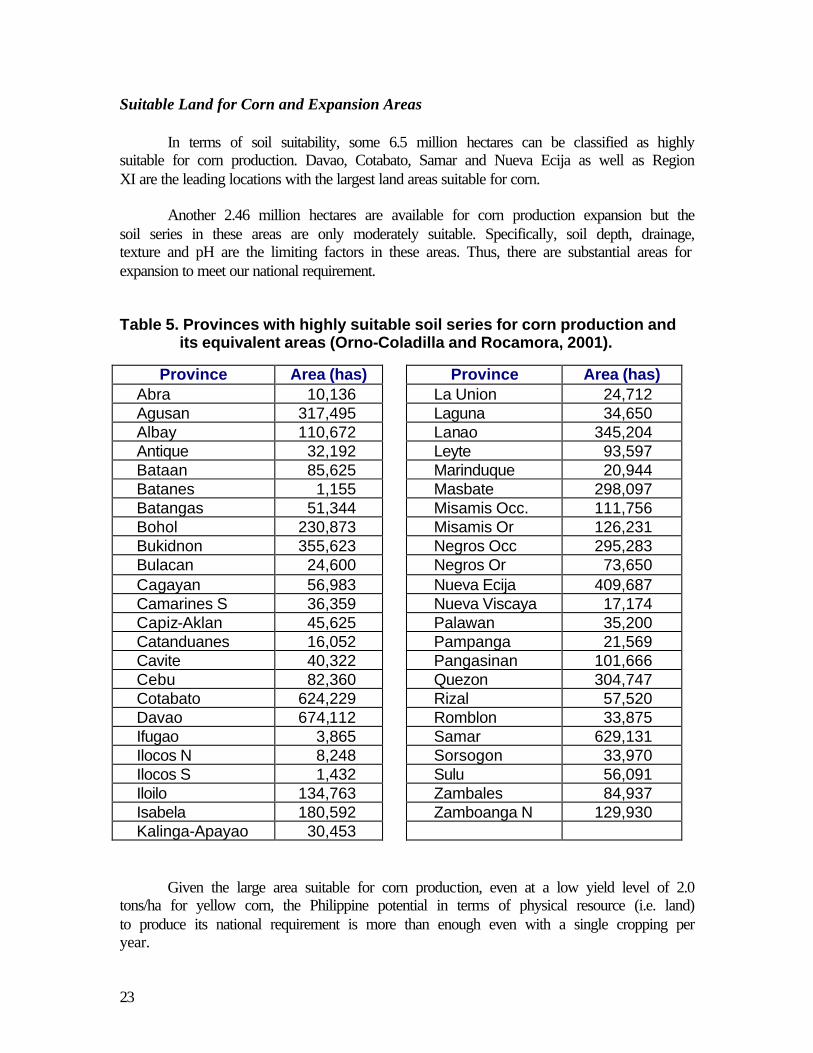
Suitable Land for Corn and Expansion Areas
In terms of soil suitability, some 6.5 million hectares can be classified as highly suitable for corn production. Davao, Cotabato, Samar and Nueva Ecija as well as Region XI are the leading locations with the largest land areas suitable for corn.
Another 2.46 million hectares are available for corn production expansion but the
soil series in these areas are only moderately suitable. Specifically, soil depth, drainage, texture and pH are the limiting factors in these areas. Thus, there are substantial areas for expansion to meet our national requirement.
Table 5. Provinces with highly suitable soil series for corn production and its equivalent areas (Orno-Coladilla and Rocamora, 2001).
Province Area (has) Province Area (has) Abra 10,136 La Union 24,712 Agusan 317,495 Laguna 34,650 Albay 110,672 Lanao 345,204 Antique 32,192 Leyte 93,597 Bataan 85,625 Marinduque 20,944 Batanes 1,155 Masbate 298,097 Batangas 51,344 Misamis Occ. 111,756 Bohol 230,873 Misamis Or 126,231 Bukidnon 355,623 Negros Occ 295,283 Bulacan 24,600 Negros Or 73,650 Cagayan 56,983 Nueva Ecija 409,687 Camarines S 36,359 Nueva Viscaya 17,174 Capiz-Aklan 45,625 Palawan 35,200 Catanduanes 16,052 Pampanga 21,569 Cavite 40,322 Pangasinan 101,666 Cebu 82,360 Quezon 304,747 Cotabato 624,229 Rizal 57,520 Davao 674,112 Romblon 33,875 Ifugao 3,865 Samar 629,131 Ilocos N 8,248 Sorsogon 33,970 Ilocos S 1,432 Sulu 56,091 Iloilo 134,763 Zambales 84,937 Isabela 180,592 Zamboanga N 129,930 Kalinga-Apayao 30,453
Given the large area suitable for corn production, even at a low yield level of 2.0
tons/ha for yellow corn, the Philippine potential in terms of physical resource (i.e. land) to produce its national requirement is more than enough even with a single cropping per year.
24
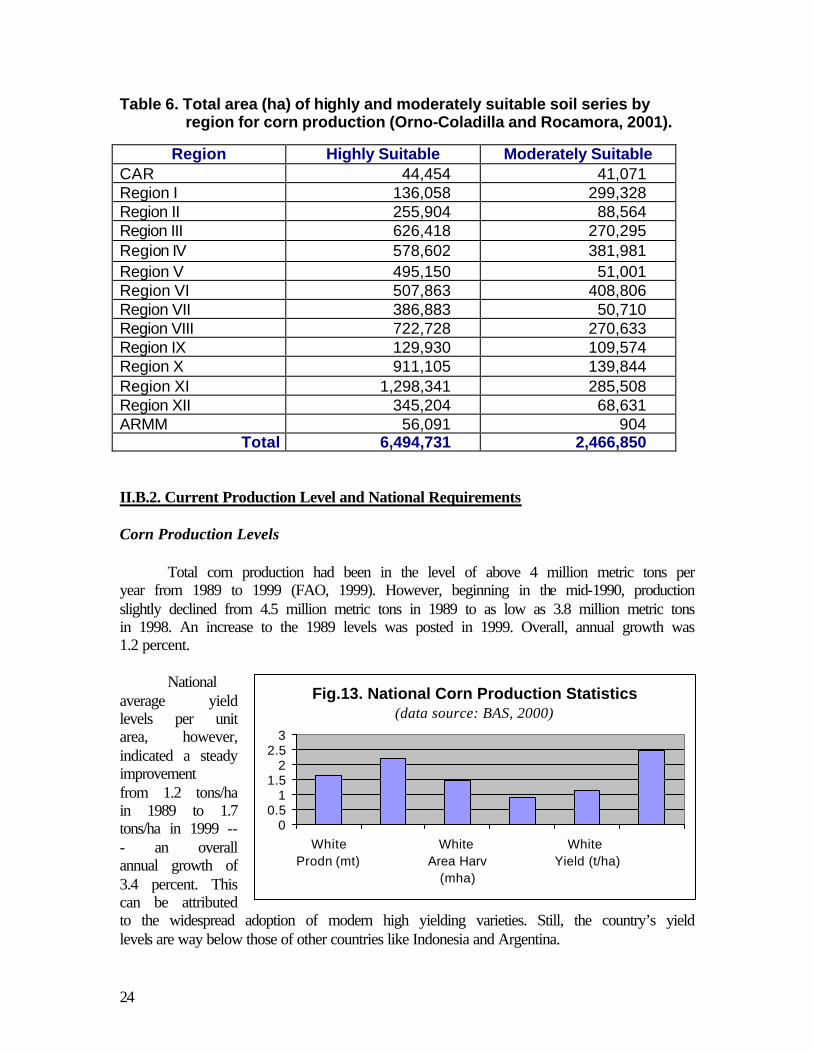
Table 6. Total area (ha) of highly and moderately suitable soil series by region for corn production (Orno-Coladilla and Rocamora, 2001).
Region Highly Suitable Moderately Suitable CAR 44,454 41,071 Region I 136,058 299,328 Region II 255,904 88,564 Region III 626,418 270,295 Region IV 578,602 381,981 Region V 495,150 51,001 Region VI 507,863 408,806 Region VII 386,883 50,710 Region VIII 722,728 270,633 Region IX 129,930 109,574 Region X 911,105 139,844 Region XI 1,298,341 285,508 Region XII 345,204 68,631 ARMM 56,091 904
Total 6,494,731 2,466,850 II.B.2. Current Production Level and National Requirements Corn Production Levels Total corn production had been in the level of above 4 million metric tons per year from 1989 to 1999 (FAO, 1999). However, beginning in the mid-1990, production slightly declined from 4.5 million metric tons in 1989 to as low as 3.8 million metric tons in 1998. An increase to the 1989 levels was posted in 1999. Overall, annual growth was 1.2 percent.
National average yield levels per unit area, however, indicated a steady improvement from 1.2 tons/ha in 1989 to 1.7 tons/ha in 1999 --- an overall annual growth of 3.4 percent. This can be attributed to the widespread adoption of modern high yielding varieties. Still, the country’s yield levels are way below those of other countries like Indonesia and Argentina.
Fig.13. National Corn Production Statistics
00.5
11.5
22.5
3
WhiteProdn (mt)
White Area Harv
(mha)
White Yield (t/ha)
(data source: BAS, 2000)
25
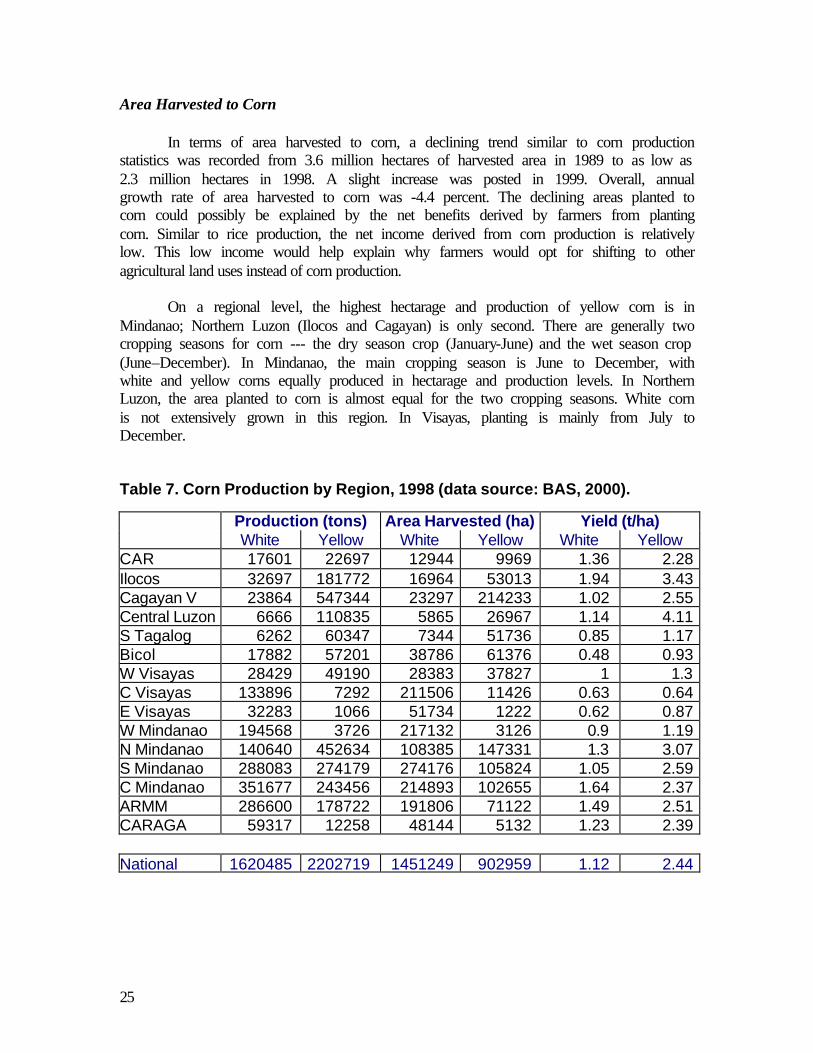
Area Harvested to Corn
In terms of area harvested to corn, a declining trend similar to corn production statistics was recorded from 3.6 million hectares of harvested area in 1989 to as low as 2.3 million hectares in 1998. A slight increase was posted in 1999. Overall, annual growth rate of area harvested to corn was -4.4 percent. The declining areas planted to corn could possibly be explained by the net benefits derived by farmers from planting corn. Similar to rice production, the net income derived from corn production is relatively low. This low income would help explain why farmers would opt for shifting to other agricultural land uses instead of corn production.
On a regional level, the highest hectarage and production of yellow corn is in Mindanao; Northern Luzon (Ilocos and Cagayan) is only second. There are generally two cropping seasons for corn --- the dry season crop (January-June) and the wet season crop (June–December). In Mindanao, the main cropping season is June to December, with white and yellow corns equally produced in hectarage and production levels. In Northern Luzon, the area planted to corn is almost equal for the two cropping seasons. White corn is not extensively grown in this region. In Visayas, planting is mainly from July to December. Table 7. Corn Production by Region, 1998 (data source: BAS, 2000).
Production (tons) Area Harvested (ha) Yield (t/ha) White Yellow White Yellow White Yellow
CAR 17601 22697 12944 9969 1.36 2.28 Ilocos 32697 181772 16964 53013 1.94 3.43 Cagayan V 23864 547344 23297 214233 1.02 2.55 Central Luzon 6666 110835 5865 26967 1.14 4.11 S Tagalog 6262 60347 7344 51736 0.85 1.17 Bicol 17882 57201 38786 61376 0.48 0.93 W Visayas 28429 49190 28383 37827 1 1.3 C Visayas 133896 7292 211506 11426 0.63 0.64 E Visayas 32283 1066 51734 1222 0.62 0.87 W Mindanao 194568 3726 217132 3126 0.9 1.19 N Mindanao 140640 452634 108385 147331 1.3 3.07 S Mindanao 288083 274179 274176 105824 1.05 2.59 C Mindanao 351677 243456 214893 102655 1.64 2.37 ARMM 286600 178722 191806 71122 1.49 2.51 CARAGA 59317 12258 48144 5132 1.23 2.39 National 1620485 2202719 1451249 902959 1.12 2.44
26
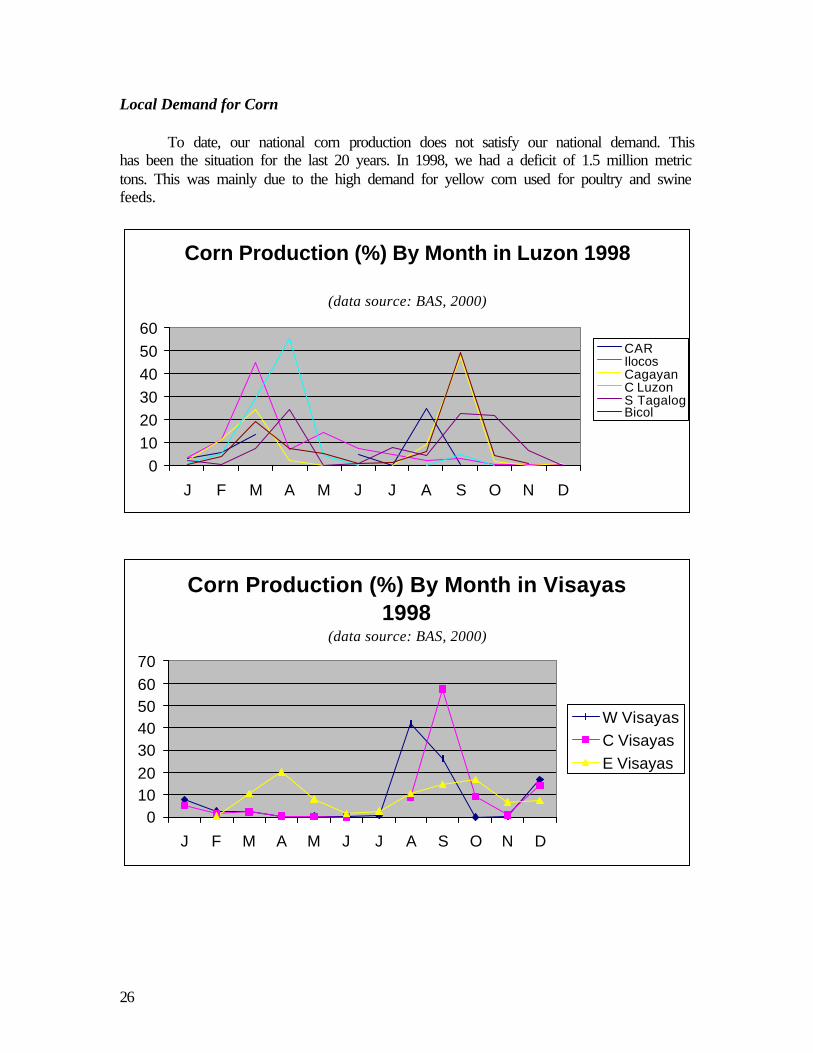
Local Demand for Corn
To date, our national corn production does not satisfy our national demand. This has been the situation for the last 20 years. In 1998, we had a deficit of 1.5 million metric tons. This was mainly due to the high demand for yellow corn used for poultry and swine feeds.
Corn Production (%) By Month in Luzon 1998
0102030405060
J F M A M J J A S O N D
CARIlocosCagayanC LuzonS TagalogBicol
Corn Production (%) By Month in Visayas 1998
010203040506070
J F M A M J J A S O N D
W VisayasC VisayasE Visayas
(data source: BAS, 2000)
(data source: BAS, 2000)
27
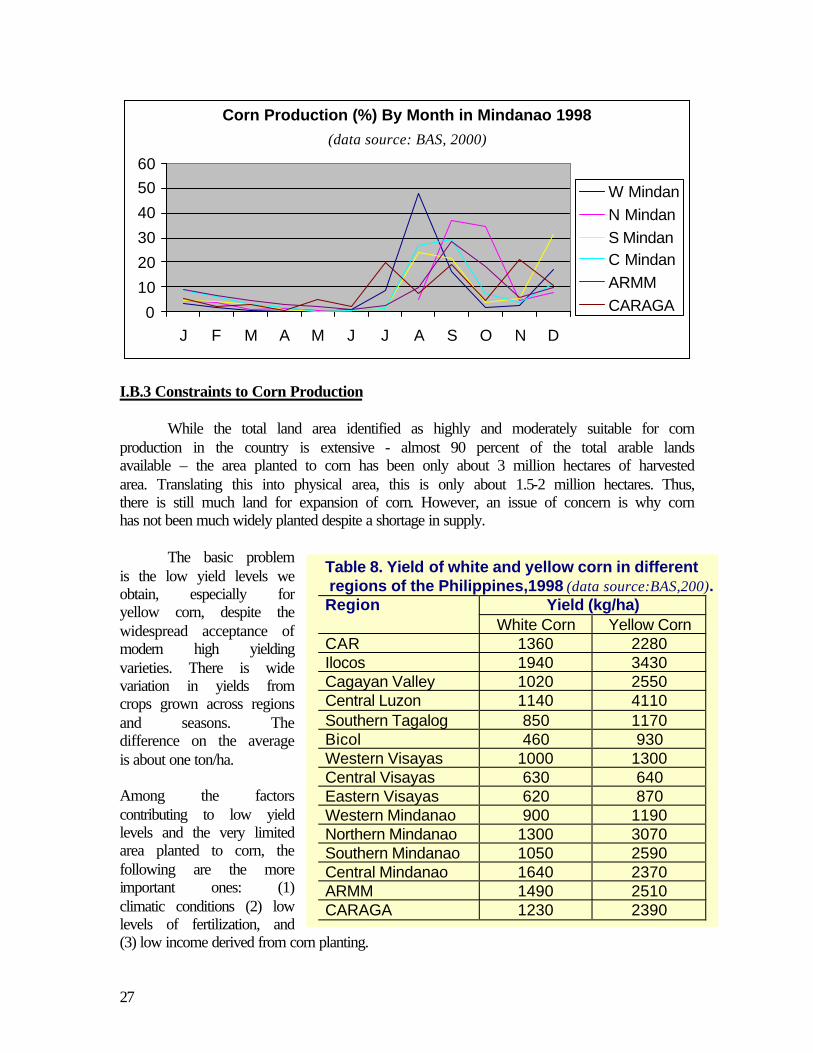
Corn Production (%) By Month in Mindanao 1998
0102030405060
J F M A M J J A S O N D
W MindanN MindanS MindanC MindanARMMCARAGA
I.B.3 Constraints to Corn Production
While the total land area identified as highly and moderately suitable for corn production in the country is extensive - almost 90 percent of the total arable lands available – the area planted to corn has been only about 3 million hectares of harvested area. Translating this into physical area, this is only about 1.5-2 million hectares. Thus, there is still much land for expansion of corn. However, an issue of concern is why corn has not been much widely planted despite a shortage in supply.
The basic problem
is the low yield levels we obtain, especially for yellow corn, despite the widespread acceptance of modern high yielding varieties. There is wide variation in yields from crops grown across regions and seasons. The difference on the average is about one ton/ha.
Among the factors contributing to low yield levels and the very limited area planted to corn, the following are the more important ones: (1) climatic conditions (2) low levels of fertilization, and (3) low income derived from corn planting.
Table 8. Yield of white and yellow corn in different regions of the Philippines,1998 (data source:BAS,200).
Yield (kg/ha) Region White Corn Yellow Corn
CAR 1360 2280 Ilocos 1940 3430 Cagayan Valley 1020 2550 Central Luzon 1140 4110 Southern Tagalog 850 1170 Bicol 460 930 Western Visayas 1000 1300 Central Visayas 630 640 Eastern Visayas 620 870 Western Mindanao 900 1190 Northern Mindanao 1300 3070 Southern Mindanao 1050 2590 Central Mindanao 1640 2370 ARMM 1490 2510 CARAGA 1230 2390
(data source: BAS, 2000)
28
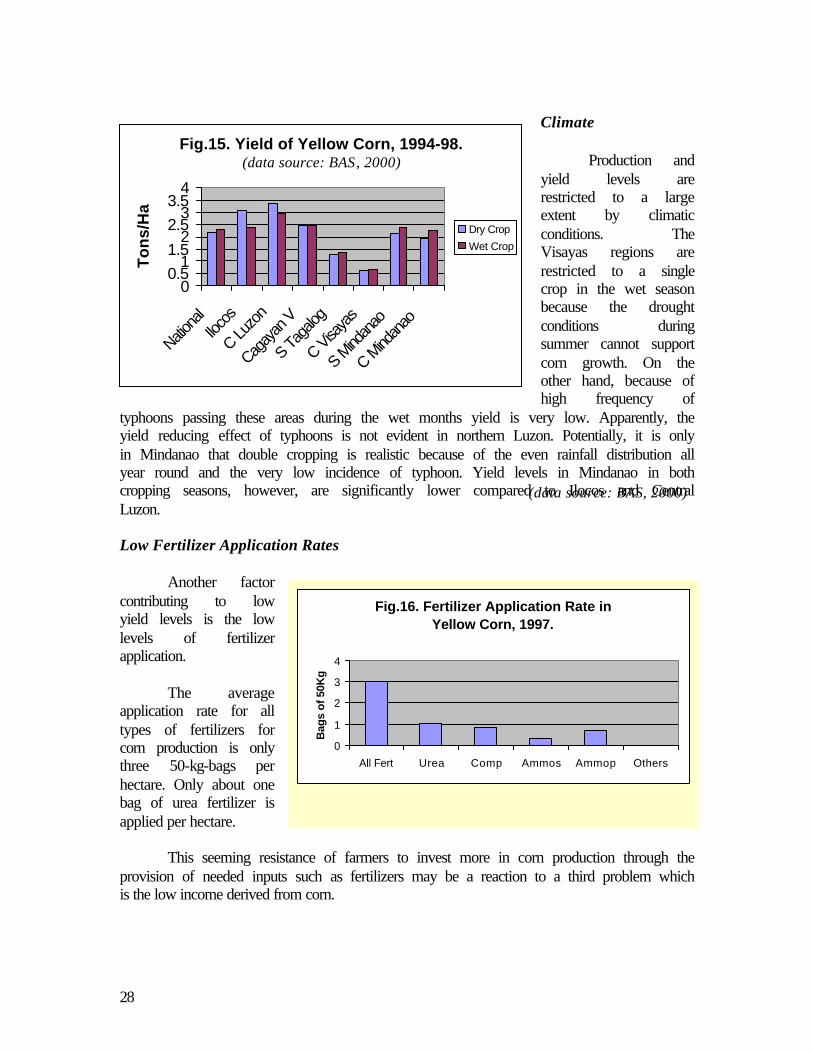
Climate
Production and
yield levels are restricted to a large extent by climatic conditions. The Visayas regions are restricted to a single crop in the wet season because the drought conditions during summer cannot support corn growth. On the other hand, because of high frequency of
typhoons passing these areas during the wet months yield is very low. Apparently, the yield reducing effect of typhoons is not evident in northern Luzon. Potentially, it is only in Mindanao that double cropping is realistic because of the even rainfall distribution all year round and the very low incidence of typhoon. Yield levels in Mindanao in both cropping seasons, however, are significantly lower compared to Ilocos and Central Luzon. Low Fertilizer Application Rates Another factor contributing to low yield levels is the low levels of fertilizer application.
The average application rate for all types of fertilizers for corn production is only three 50-kg-bags per hectare. Only about one bag of urea fertilizer is applied per hectare. This seeming resistance of farmers to invest more in corn production through the provision of needed inputs such as fertilizers may be a reaction to a third problem which is the low income derived from corn.
Fig.15. Yield of Yellow Corn, 1994-98.
00.5
11.5
22.5
33.5
4
Nationa
lIloc
os
C Luzo
n
Cagaya
n V
S Taga
log
C Visayas
S Mind
anao
C Mind
anao
To
ns/
Ha
Dry Crop Wet Crop
Fig.16. Fertilizer Application Rate in Yellow Corn, 1997.
0
1
2
3
4
All Fert Urea Comp Ammos Ammop Others
Bag
s o
f 50
Kg
(data source: BAS, 2000)
(data source: BAS, 2000)
29
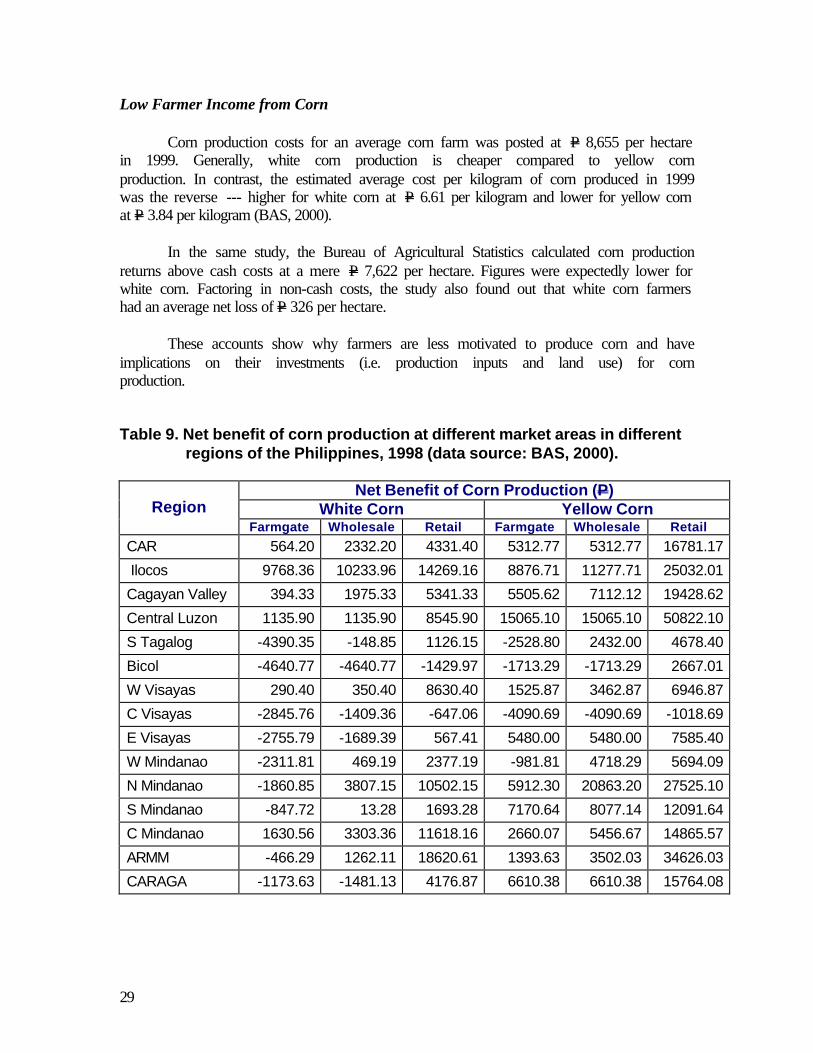
Low Farmer Income from Corn
Corn production costs for an average corn farm was posted at P 8,655 per hectare in 1999. Generally, white corn production is cheaper compared to yellow corn production. In contrast, the estimated average cost per kilogram of corn produced in 1999 was the reverse --- higher for white corn at P 6.61 per kilogram and lower for yellow corn at P 3.84 per kilogram (BAS, 2000). In the same study, the Bureau of Agricultural Statistics calculated corn production returns above cash costs at a mere P 7,622 per hectare. Figures were expectedly lower for white corn. Factoring in non-cash costs, the study also found out that white corn farmers had an average net loss of P 326 per hectare. These accounts show why farmers are less motivated to produce corn and have implications on their investments (i.e. production inputs and land use) for corn production. Table 9. Net benefit of corn production at different market areas in different
regions of the Philippines, 1998 (data source: BAS, 2000).
Net Benefit of Corn Production (P) White Corn Yellow Corn Region
Farmgate Wholesale Retail Farmgate Wholesale Retail
CAR 564.20 2332.20 4331.40 5312.77 5312.77 16781.17 Ilocos 9768.36 10233.96 14269.16 8876.71 11277.71 25032.01 Cagayan Valley 394.33 1975.33 5341.33 5505.62 7112.12 19428.62 Central Luzon 1135.90 1135.90 8545.90 15065.10 15065.10 50822.10 S Tagalog -4390.35 -148.85 1126.15 -2528.80 2432.00 4678.40 Bicol -4640.77 -4640.77 -1429.97 -1713.29 -1713.29 2667.01 W Visayas 290.40 350.40 8630.40 1525.87 3462.87 6946.87 C Visayas -2845.76 -1409.36 -647.06 -4090.69 -4090.69 -1018.69 E Visayas -2755.79 -1689.39 567.41 5480.00 5480.00 7585.40 W Mindanao -2311.81 469.19 2377.19 -981.81 4718.29 5694.09 N Mindanao -1860.85 3807.15 10502.15 5912.30 20863.20 27525.10 S Mindanao -847.72 13.28 1693.28 7170.64 8077.14 12091.64 C Mindanao 1630.56 3303.36 11618.16 2660.07 5456.67 14865.57 ARMM -466.29 1262.11 18620.61 1393.63 3502.03 34626.03 CARAGA -1173.63 -1481.13 4176.87 6610.38 6610.38 15764.08
30
II.C. Coconut Areas
Coconut is produced mainly for its versatile oil (lauric acid oil). Coco shell charcoal and copra meal are also some of the more important materials extracted from coconut. Coco coir and coco water are also promising products. In 1997 the total value of exports from coconut products (copra, oil, desiccated coconut, and copra meal) amounted to US$ 811.14 million. II.C.1 Physical Characteristics Ideal Conditions for Coconut Production
Coconut grows well between latitudes 200N and 20VS at altitudes of 600 meters or below. The optimum temperature range for coconut growing is from 24 to 29 0C with a relative humidity requirement of 80 to 90%, and an annually distributed rainfall requirement of 1500 to 2300 mm. High production can also be expected: in soil with pH of 6-7 (neutral); in soil that is rich in organic matter and is fertile; and in deep (minimum of 75 cm), well drained, light- to medium-textured (sand-clay) soil with a high water holding capacity (at least 30% clay content).
However, most inland and coastal soils planted to coconut are severely deficient
in sodium and chloride as well as inadequate in potassium, phosphorous, boron and sulfur.
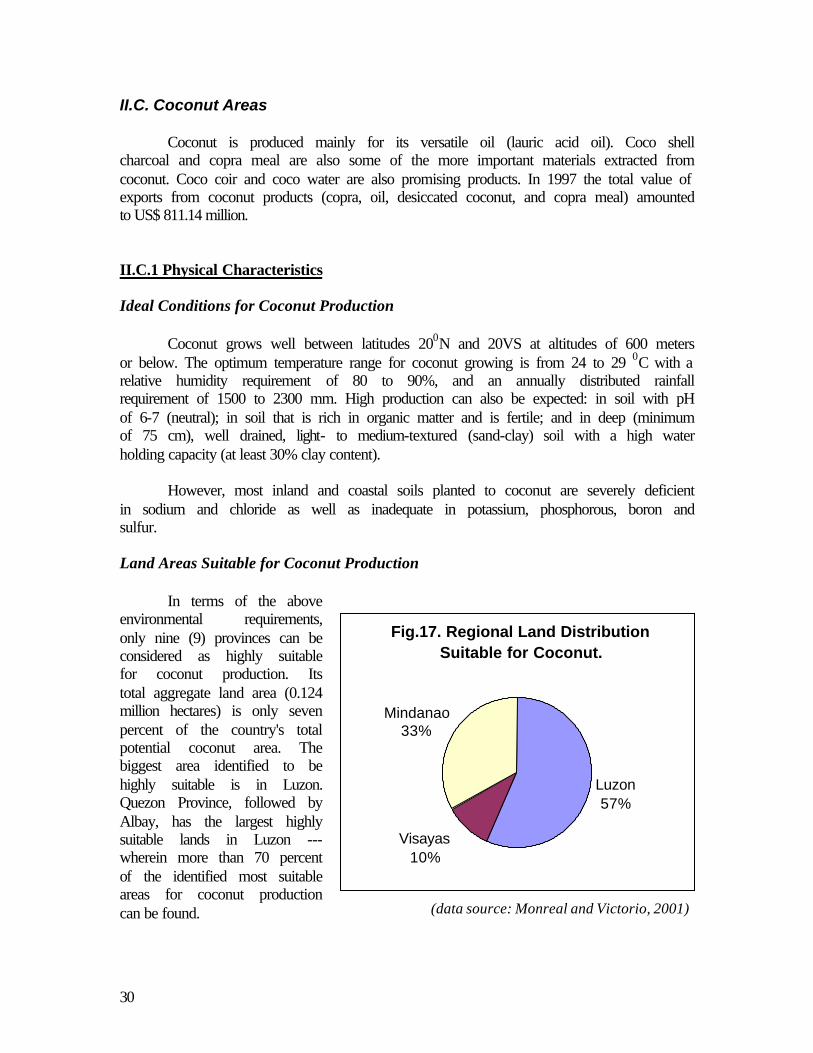
Land Areas Suitable for Coconut Production
In terms of the above environmental requirements, only nine (9) provinces can be considered as highly suitable for coconut production. Its total aggregate land area (0.124 million hectares) is only seven percent of the country's total potential coconut area. The biggest area identified to be highly suitable is in Luzon. Quezon Province, followed by Albay, has the largest highly suitable lands in Luzon --- wherein more than 70 percent of the identified most suitable areas for coconut production can be found.
Fig.17. Regional Land Distribution Suitable for Coconut.
Mindanao33%
Visayas10%
Luzon57%
(data source: Monreal and Victorio, 2001)
31
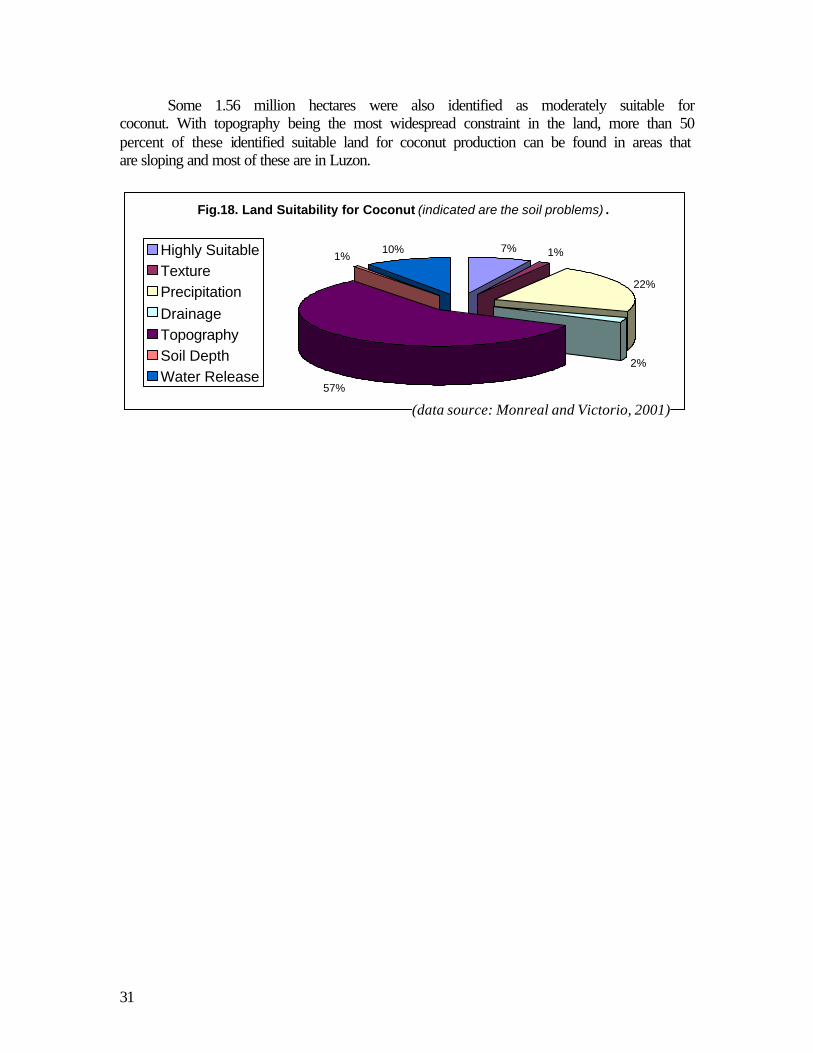
Some 1.56 million hectares were also identified as moderately suitable for coconut. With topography being the most widespread constraint in the land, more than 50 percent of these identified suitable land for coconut production can be found in areas that are sloping and most of these are in Luzon.
Fig.18. Land Suitability for Coconut (indicated are the soil problems) .
7% 1%
22%
2%
57%
1% 10%Highly SuitableTexturePrecipitationDrainageTopographySoil DepthWater Release
(data source: Monreal and Victorio, 2001)
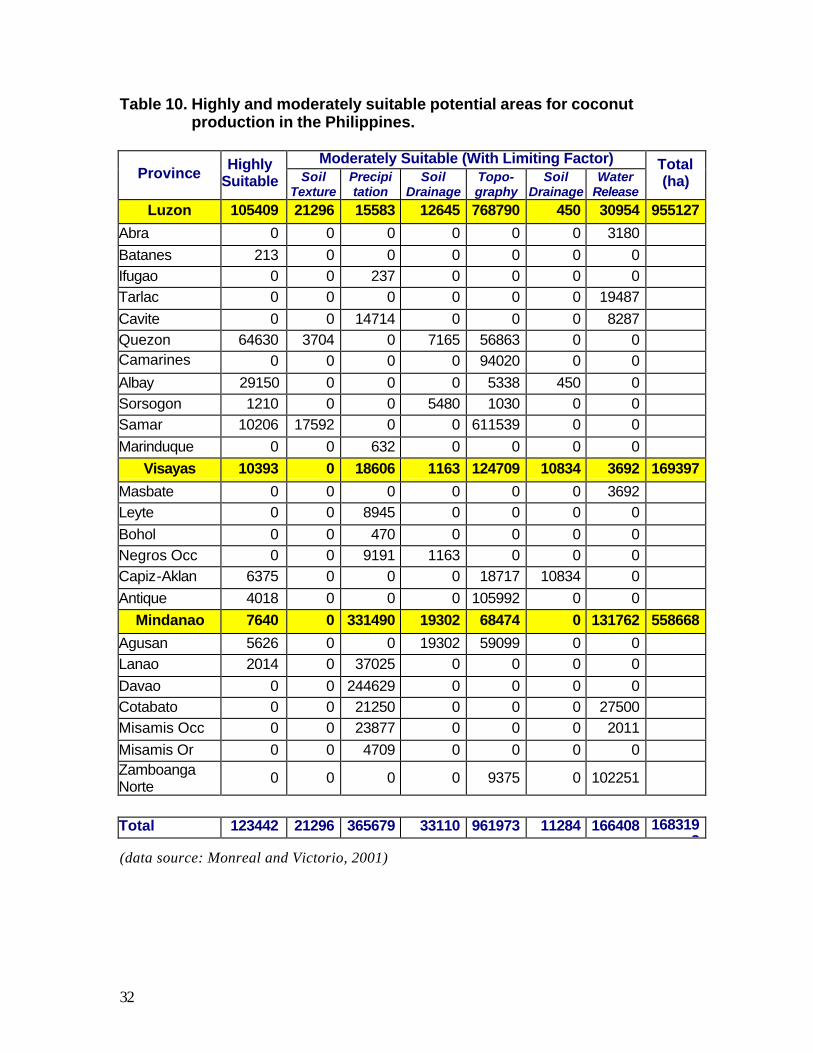
32
Table 10. Highly and moderately suitable potential areas for coconut production in the Philippines.
Moderately Suitable (With Limiting Factor)
Province Highly
Suitable Soil Texture
Precipi tation
Soil Drainage
Topo- graphy
Soil Drainage
Water Release
Total (ha)
Luzon 105409 21296 15583 12645 768790 450 30954 955127
Abra 0 0 0 0 0 0 3180 Batanes 213 0 0 0 0 0 0 Ifugao 0 0 237 0 0 0 0 Tarlac 0 0 0 0 0 0 19487 Cavite 0 0 14714 0 0 0 8287 Quezon 64630 3704 0 7165 56863 0 0 Camarines Norte
0 0 0 0 94020 0 0 Albay 29150 0 0 0 5338 450 0 Sorsogon 1210 0 0 5480 1030 0 0 Samar 10206 17592 0 0 611539 0 0 Marinduque 0 0 632 0 0 0 0
Visayas 10393 0 18606 1163 124709 10834 3692 169397
Masbate 0 0 0 0 0 0 3692 Leyte 0 0 8945 0 0 0 0 Bohol 0 0 470 0 0 0 0 Negros Occ 0 0 9191 1163 0 0 0 Capiz-Aklan 6375 0 0 0 18717 10834 0 Antique 4018 0 0 0 105992 0 0
Mindanao 7640 0 331490 19302 68474 0 131762 558668
Agusan 5626 0 0 19302 59099 0 0 Lanao 2014 0 37025 0 0 0 0 Davao 0 0 244629 0 0 0 0 Cotabato 0 0 21250 0 0 0 27500 Misamis Occ 0 0 23877 0 0 0 2011 Misamis Or 0 0 4709 0 0 0 0 Zamboanga Norte 0 0 0 0 9375 0 102251
Total 123442 21296 365679 33110 961973 11284 166408 168319
2 (data source: Monreal and Victorio, 2001)
33
Fig.20. Coconut Area.
2.93
3.13.23.33.4
1990 1991 1992 1993 1994 1995 1996 1997
Mill
ion
Ha
Fi.21. Number of Bearing Trees.
0.26
0.27
0.28
0.290.3
1990 1991 1992 1993 1994 1995 1996 1997
Mill
ion
Fig.22. Coconut Production.
10,5
11
11,5
12
12,5
1990 1991 1992 1993 1994 1995 1996 1997
Bill
ion
Nu
ts
Fig.23. Nut Production Per Tree.
36
38
40
42
44
1990 1991 1992 1993 1994 1995 1996 1997
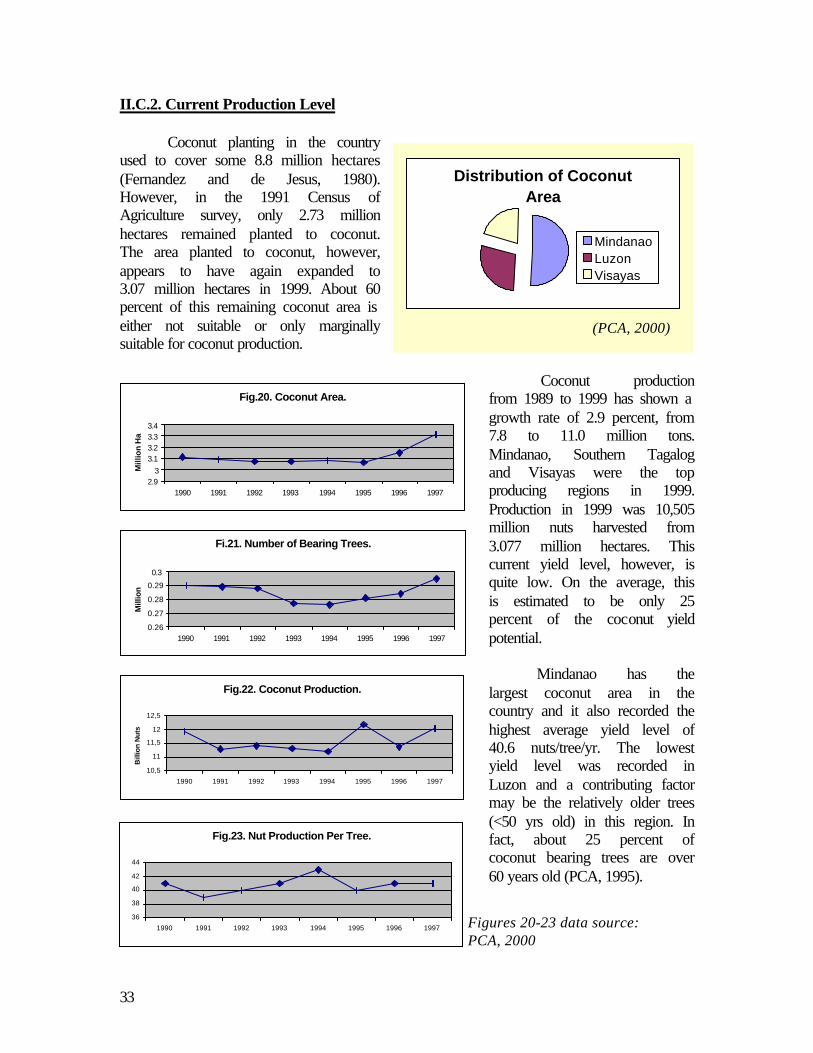
II.C.2. Current Production Level Coconut planting in the country
used to cover some 8.8 million hectares (Fernandez and de Jesus, 1980). However, in the 1991 Census of Agriculture survey, only 2.73 million hectares remained planted to coconut. The area planted to coconut, however, appears to have again expanded to 3.07 million hectares in 1999. About 60 percent of this remaining coconut area is either not suitable or only marginally suitable for coconut production.
Coconut production
from 1989 to 1999 has shown a growth rate of 2.9 percent, from 7.8 to 11.0 million tons. Mindanao, Southern Tagalog and Visayas were the top producing regions in 1999. Production in 1999 was 10,505 million nuts harvested from 3.077 million hectares. This current yield level, however, is quite low. On the average, this is estimated to be only 25 percent of the coconut yield potential.
Mindanao has the
largest coconut area in the country and it also recorded the highest average yield level of 40.6 nuts/tree/yr. The lowest yield level was recorded in Luzon and a contributing factor may be the relatively older trees (<50 yrs old) in this region. In fact, about 25 percent of coconut bearing trees are over 60 years old (PCA, 1995).
Distribution of Coconut Area
MindanaoLuzonVisayas
(PCA, 2000)
Figures 20-23 data source: PCA, 2000
34
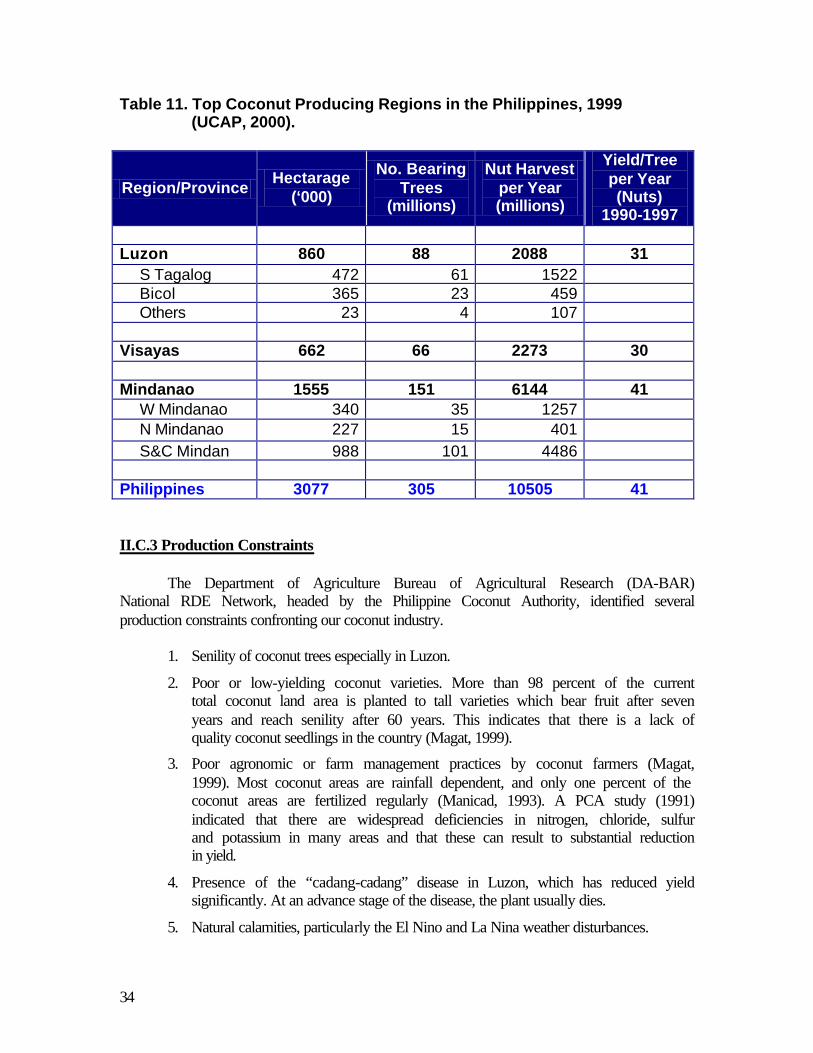
Table 11. Top Coconut Producing Regions in the Philippines, 1999 (UCAP, 2000).
Region/Province Hectarage
(‘000)
No. Bearing Trees
(millions)
Nut Harvest per Year (millions)
Yield/Tree per Year (Nuts)
1990-1997 Luzon 860 88 2088 31 S Tagalog 472 61 1522 Bicol 365 23 459 Others 23 4 107 Visayas 662 66 2273 30 Mindanao 1555 151 6144 41 W Mindanao 340 35 1257 N Mindanao 227 15 401 S&C Mindan 988 101 4486 Philippines 3077 305 10505 41
II.C.3 Production Constraints The Department of Agriculture Bureau of Agricultural Research (DA-BAR)
National RDE Network, headed by the Philippine Coconut Authority, identified several production constraints confronting our coconut industry.
1. Senility of coconut trees especially in Luzon.
2. Poor or low-yielding coconut varieties. More than 98 percent of the current total coconut land area is planted to tall varieties which bear fruit after seven years and reach senility after 60 years. This indicates that there is a lack of quality coconut seedlings in the country (Magat, 1999).
3. Poor agronomic or farm management practices by coconut farmers (Magat, 1999). Most coconut areas are rainfall dependent, and only one percent of the coconut areas are fertilized regularly (Manicad, 1993). A PCA study (1991) indicated that there are widespread deficiencies in nitrogen, chloride, sulfur and potassium in many areas and that these can result to substantial reduction in yield.
4. Presence of the “cadang-cadang” disease in Luzon, which has reduced yield significantly. At an advance stage of the disease, the plant usually dies.
5. Natural calamities, particularly the El Nino and La Nina weather disturbances.
35
Important factors contributing to very low and declining yield levels are aging trees, poor fertilization and weather. Only the southern and western Mindanao areas are showing good yield levels at 41 nuts/year versus an average of 31 nuts/year in Luzon and Visayas.
Perhaps the most important factor affecting production levels at the farm level is
the low income from coconut. Why should farmers fertilize and practice good farm management when they do not make much money from it? Why should farmers replace their old tall coconut varieties with high-yielding hybrid varieties when they earn so little from coconut?
Still, coconut is an important renewable resource of the country that should not
simply be ignored. Perhaps coconut areas should be given importance in terms of benefits from its role in preventing soil erosion and its impact to the environment. A large percentage of coconut is planted in sloping areas. Perhaps we should also look at coconut as a “tree of life”. It is a resource from where we can derive other raw materials (e.g. coco-water, coco-coir, coco-charcoal, etc.). III. Comparative Analysis of Philippines with Selected Asian Countries Of particular interest in this study are the countries Thailand, Indonesia and Malaysia because they are the Philippines’ adjacent agricultural neighbors. These countries are thus most likely our main competitors. Compared with the above countries, the Philippines is less endowed with physical land areas. In terms of availability of water for agricultural purposes, the area covered by irrigation in the Philippines is a far third. This is not to mention that more frequent natural calamities, especially typhoons, visit the Philippines. These should be major indicators for considering Philippine approaches to global competitiveness. Land Areas and Land Use Across Countries
The Philippines and Malaysia have the smallest total land area --- 29.8M and 32.8M hectares, respectively. Indonesia has a land area six times that of the Philippines, while Thailand is almost twice as big as the Philippines. This is also the trend in terms of land area devoted to agriculture.
Indonesia has the largest area devoted to agriculture and this is three times bigger
than that of the Philippines. Thailand has a total agricultural area twice that of the Philippines, and Malaysia has the smallest land area for agriculture.
In terms of percentage of agricultural land used for crop production, the
Philippines ranked second to Thailand. However, in absolute hectarage values, Thailand had the largest, followed by Indonesia while the Philippines still ranked third.
36
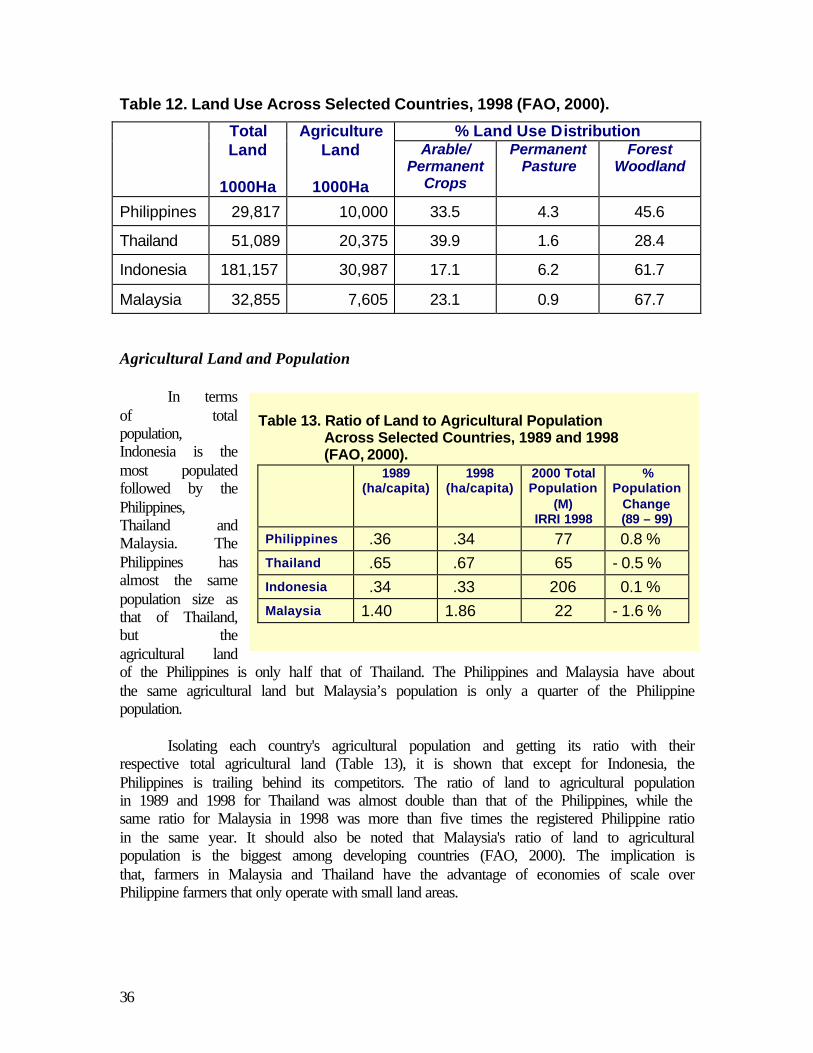
Table 12. Land Use Across Selected Countries, 1998 (FAO, 2000).
% Land Use Distribution Total Land
1000Ha
Agriculture Land
1000Ha
Arable/ Permanent
Crops
Permanent Pasture
Forest Woodland
Philippines 29,817 10,000 33.5 4.3 45.6
Thailand 51,089 20,375 39.9 1.6 28.4
Indonesia 181,157 30,987 17.1 6.2 61.7
Malaysia 32,855 7,605 23.1 0.9 67.7 Agricultural Land and Population
In terms of total population, Indonesia is the most populated followed by the Philippines, Thailand and Malaysia. The Philippines has almost the same population size as that of Thailand, but the agricultural land of the Philippines is only half that of Thailand. The Philippines and Malaysia have about the same agricultural land but Malaysia’s population is only a quarter of the Philippine population. Isolating each country's agricultural population and getting its ratio with their respective total agricultural land (Table 13), it is shown that except for Indonesia, the Philippines is trailing behind its competitors. The ratio of land to agricultural population in 1989 and 1998 for Thailand was almost double than that of the Philippines, while the same ratio for Malaysia in 1998 was more than five times the registered Philippine ratio in the same year. It should also be noted that Malaysia's ratio of land to agricultural population is the biggest among developing countries (FAO, 2000). The implication is that, farmers in Malaysia and Thailand have the advantage of economies of scale over Philippine farmers that only operate with small land areas.
Table 13. Ratio of Land to Agricultural Population
Across Selected Countries, 1989 and 1998 (FAO, 2000).
1989 (ha/capita)
1998 (ha/capita)
2000 Total Population
(M) IRRI 1998
% Population
Change (89 – 99)
Philippines .36 .34 77 0.8 % Thailand .65 .67 65 - 0.5 % Indonesia .34 .33 206 0.1 % Malaysia 1.40 1.86 22 - 1.6 %
37
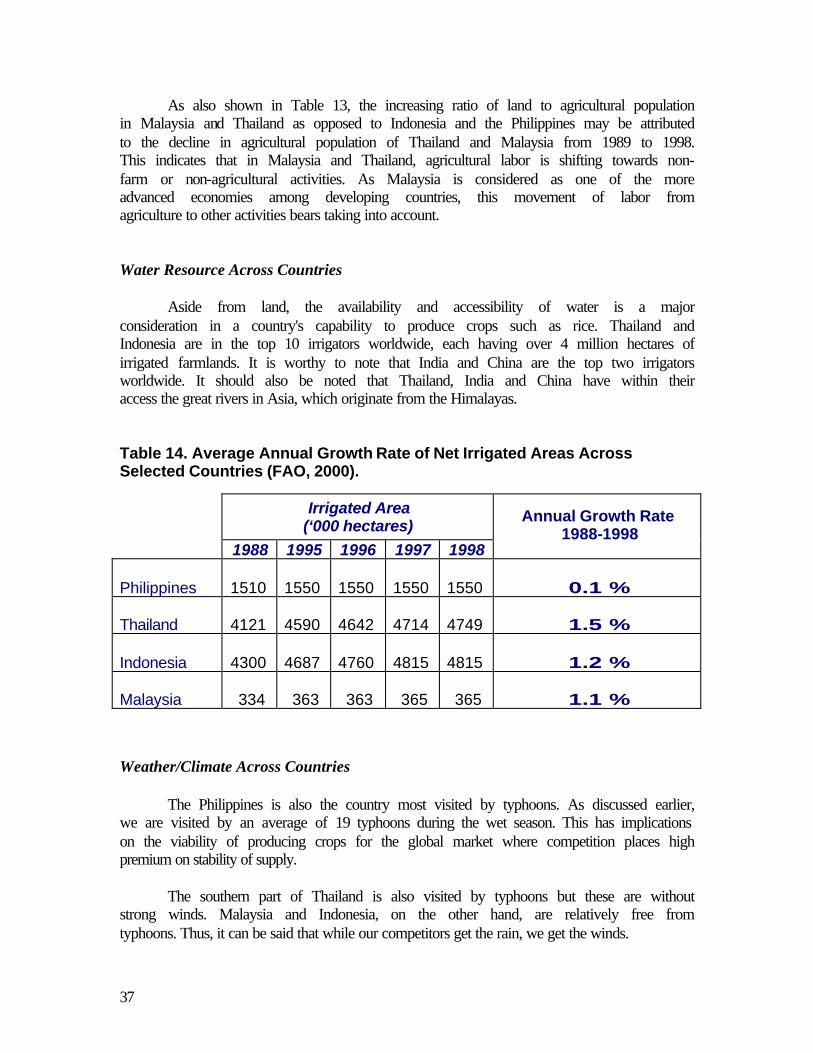
As also shown in Table 13, the increasing ratio of land to agricultural population in Malaysia and Thailand as opposed to Indonesia and the Philippines may be attributed to the decline in agricultural population of Thailand and Malaysia from 1989 to 1998. This indicates that in Malaysia and Thailand, agricultural labor is shifting towards non-farm or non-agricultural activities. As Malaysia is considered as one of the more advanced economies among developing countries, this movement of labor from agriculture to other activities bears taking into account. Water Resource Across Countries Aside from land, the availability and accessibility of water is a major consideration in a country's capability to produce crops such as rice. Thailand and Indonesia are in the top 10 irrigators worldwide, each having over 4 million hectares of irrigated farmlands. It is worthy to note that India and China are the top two irrigators worldwide. It should also be noted that Thailand, India and China have within their access the great rivers in Asia, which originate from the Himalayas. Table 14. Average Annual Growth Rate of Net Irrigated Areas Across Selected Countries (FAO, 2000).
Irrigated Area (‘000 hectares)
1988 1995 1996 1997 1998
Annual Growth Rate 1988-1998
Philippines
1510
1550
1550
1550
1550
0.1 %
Thailand
4121
4590
4642
4714
4749
1.5 %
Indonesia
4300
4687
4760
4815
4815
1.2 %
Malaysia
334
363
363
365
365
1.1 %
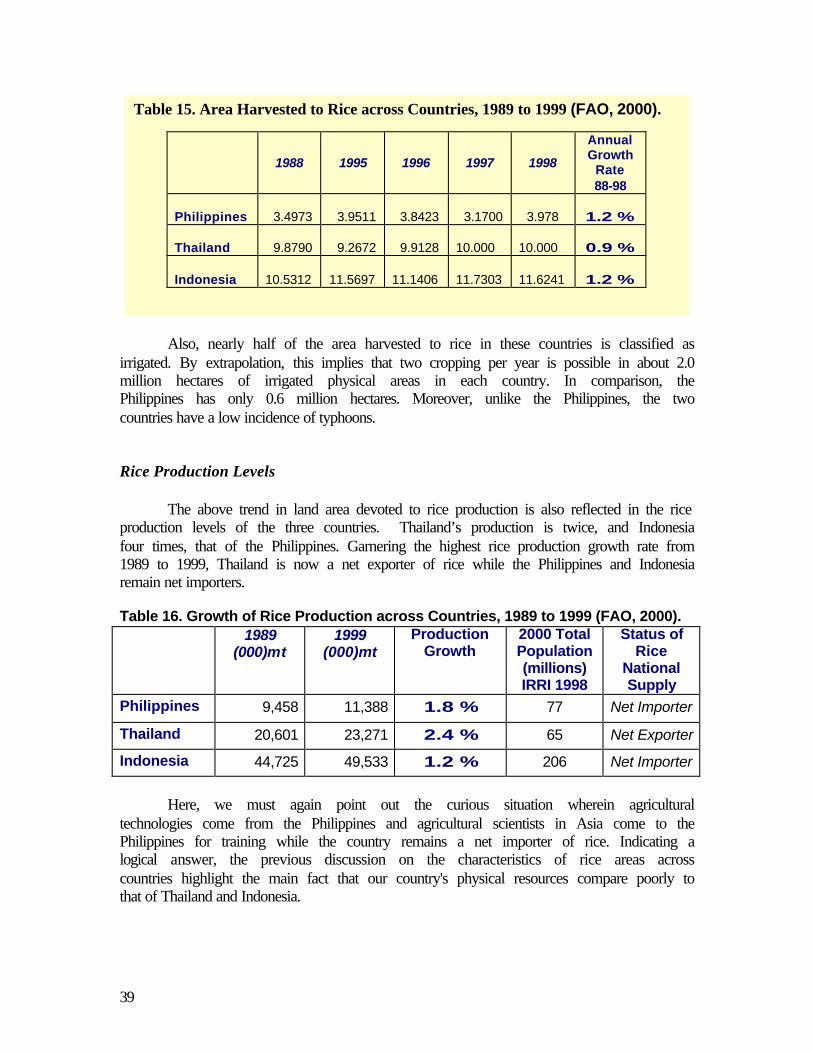
Weather/Climate Across Countries The Philippines is also the country most visited by typhoons. As discussed earlier, we are visited by an average of 19 typhoons during the wet season. This has implications on the viability of producing crops for the global market where competition places high premium on stability of supply.
The southern part of Thailand is also visited by typhoons but these are without strong winds. Malaysia and Indonesia, on the other hand, are relatively free from typhoons. Thus, it can be said that while our competitors get the rain, we get the winds.
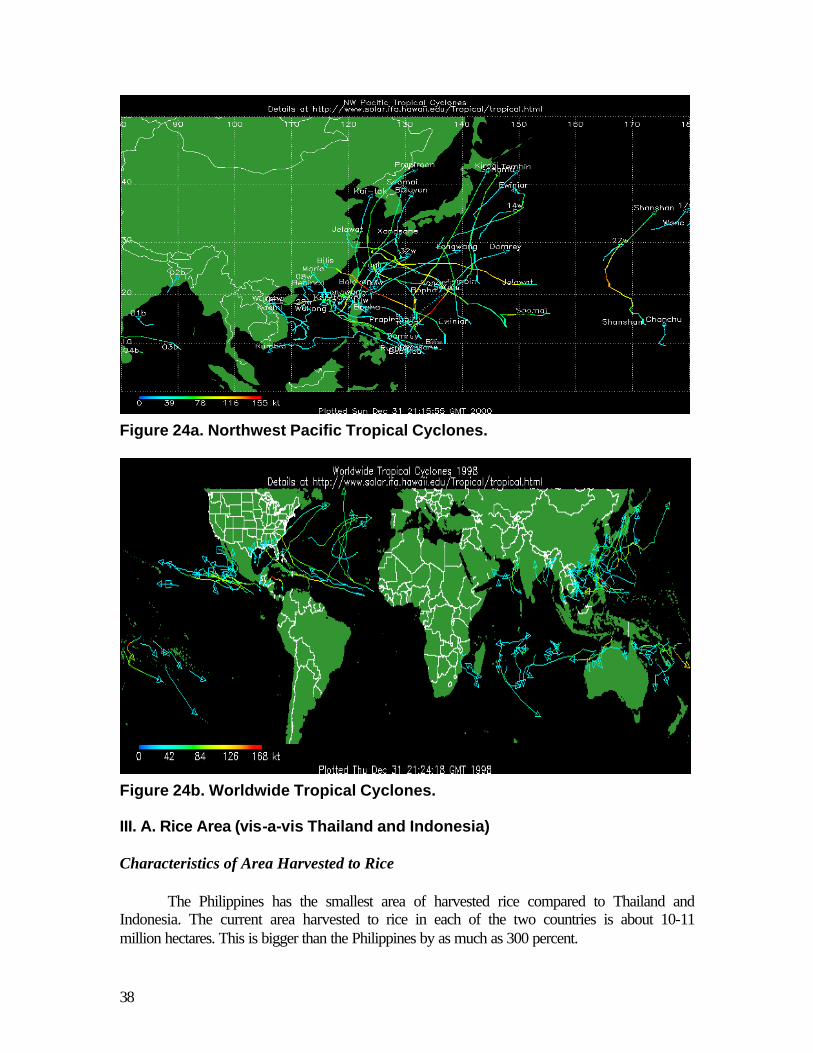
38
Figure 24a. Northwest Pacific Tropical Cyclones.
Figure 24b. Worldwide Tropical Cyclones. III. A. Rice Area (vis-a-vis Thailand and Indonesia) Characteristics of Area Harvested to Rice The Philippines has the smallest area of harvested rice compared to Thailand and Indonesia. The current area harvested to rice in each of the two countries is about 10-11 million hectares. This is bigger than the Philippines by as much as 300 percent.
39
Table 15. Area Harvested to Rice across Countries, 1989 to 1999 (FAO, 2000).
1988 1995 1996 1997 1998
Annual Growth
Rate 88-98
Philippines
3.4973
3.9511
3.8423
3.1700
3.978
1.2 %
Thailand
9.8790
9.2672
9.9128
10.000
10.000
0.9 %
Indonesia
10.5312
11.5697
11.1406
11.7303
11.6241
1.2 %
Also, nearly half of the area harvested to rice in these countries is classified as
irrigated. By extrapolation, this implies that two cropping per year is possible in about 2.0 million hectares of irrigated physical areas in each country. In comparison, the Philippines has only 0.6 million hectares. Moreover, unlike the Philippines, the two countries have a low incidence of typhoons. Rice Production Levels
The above trend in land area devoted to rice production is also reflected in the rice production levels of the three countries. Thailand’s production is twice, and Indonesia four times, that of the Philippines. Garnering the highest rice production growth rate from 1989 to 1999, Thailand is now a net exporter of rice while the Philippines and Indonesia remain net importers.
Table 16. Growth of Rice Production across Countries, 1989 to 1999 (FAO, 2000). 1989
(000)mt 1999
(000)mt Production
Growth 2000 Total Population (millions) IRRI 1998
Status of Rice
National Supply
Philippines 9,458 11,388 1.8 % 77 Net Importer
Thailand 20,601 23,271 2.4 % 65 Net Exporter
Indonesia 44,725 49,533 1.2 % 206 Net Importer
Here, we must again point out the curious situation wherein agricultural technologies come from the Philippines and agricultural scientists in Asia come to the Philippines for training while the country remains a net importer of rice. Indicating a logical answer, the previous discussion on the characteristics of rice areas across countries highlight the main fact that our country's physical resources compare poorly to that of Thailand and Indonesia.
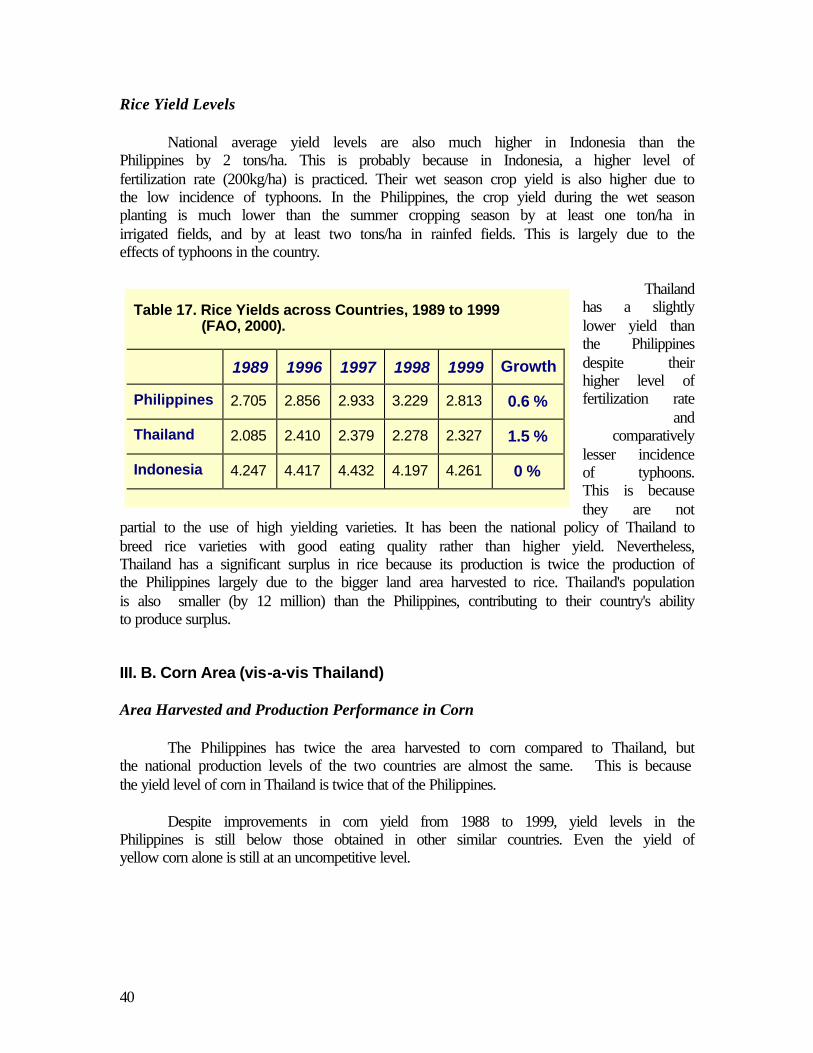
40
Table 17. Rice Yields across Countries, 1989 to 1999 (FAO, 2000).
1989 1996 1997 1998 1999 Growth
Philippines 2.705 2.856 2.933 3.229 2.813 0.6 %
Thailand 2.085 2.410 2.379 2.278 2.327 1.5 %
Indonesia 4.247 4.417 4.432 4.197 4.261 0 %
Rice Yield Levels
National average yield levels are also much higher in Indonesia than the Philippines by 2 tons/ha. This is probably because in Indonesia, a higher level of fertilization rate (200kg/ha) is practiced. Their wet season crop yield is also higher due to the low incidence of typhoons. In the Philippines, the crop yield during the wet season planting is much lower than the summer cropping season by at least one ton/ha in irrigated fields, and by at least two tons/ha in rainfed fields. This is largely due to the effects of typhoons in the country.
Thailand
has a slightly lower yield than the Philippines despite their higher level of fertilization rate
and comparatively
lesser incidence of typhoons. This is because they are not
partial to the use of high yielding varieties. It has been the national policy of Thailand to breed rice varieties with good eating quality rather than higher yield. Nevertheless, Thailand has a significant surplus in rice because its production is twice the production of the Philippines largely due to the bigger land area harvested to rice. Thailand's population is also smaller (by 12 million) than the Philippines, contributing to their country's ability to produce surplus. III. B. Corn Area (vis-a-vis Thailand) Area Harvested and Production Performance in Corn The Philippines has twice the area harvested to corn compared to Thailand, but the national production levels of the two countries are almost the same. This is because the yield level of corn in Thailand is twice that of the Philippines.
Despite improvements in corn yield from 1988 to 1999, yield levels in the Philippines is still below those obtained in other similar countries. Even the yield of yellow corn alone is still at an uncompetitive level.
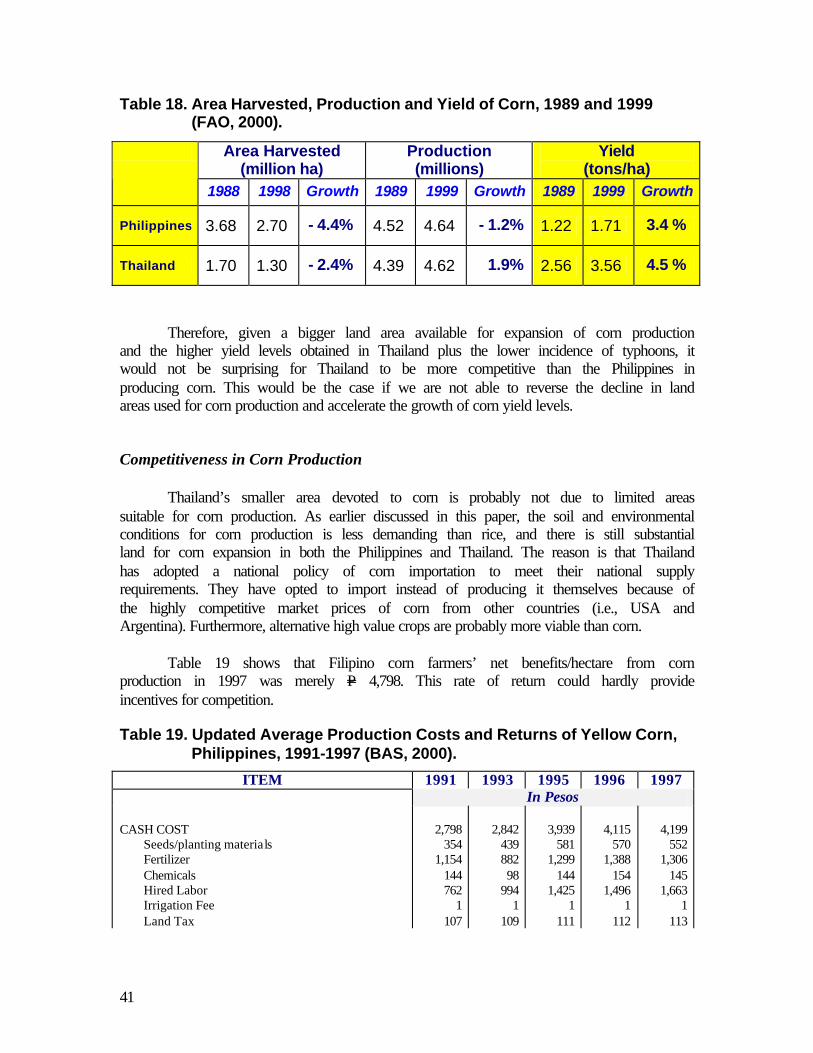
41
Table 18. Area Harvested, Production and Yield of Corn, 1989 and 1999 (FAO, 2000).
Area Harvested (million ha)
Production (millions)
Yield (tons/ha)
1988 1998 Growth 1989 1999 Growth 1989 1999 Growth
Philippines 3.68 2.70 - 4.4% 4.52 4.64 - 1.2% 1.22 1.71 3.4 %
Thailand 1.70 1.30 - 2.4% 4.39 4.62 1.9% 2.56 3.56 4.5 %
Therefore, given a bigger land area available for expansion of corn production and the higher yield levels obtained in Thailand plus the lower incidence of typhoons, it would not be surprising for Thailand to be more competitive than the Philippines in producing corn. This would be the case if we are not able to reverse the decline in land areas used for corn production and accelerate the growth of corn yield levels. Competitiveness in Corn Production
Thailand’s smaller area devoted to corn is probably not due to limited areas suitable for corn production. As earlier discussed in this paper, the soil and environmental conditions for corn production is less demanding than rice, and there is still substantial land for corn expansion in both the Philippines and Thailand. The reason is that Thailand has adopted a national policy of corn importation to meet their national supply requirements. They have opted to import instead of producing it themselves because of the highly competitive market prices of corn from other countries (i.e., USA and Argentina). Furthermore, alternative high value crops are probably more viable than corn.
Table 19 shows that Filipino corn farmers’ net benefits/hectare from corn
production in 1997 was merely P 4,798. This rate of return could hardly provide incentives for competition.
Table 19. Updated Average Production Costs and Returns of Yellow Corn,
Philippines, 1991-1997 (BAS, 2000).
ITEM 1991 1993 1995 1996 1997 In Pesos
CASH COST Seeds/planting materials Fertilizer Chemicals Hired Labor Irrigation Fee Land Tax
2,798
354 1,154
144 762
1 107
2,842
439 882 98
994 1
109
3,939
581 1,299
144 1,425
1 111
4,115
570 1,388
154 1,496
1 112
4,199
552 1,306
145 1,663
1 113
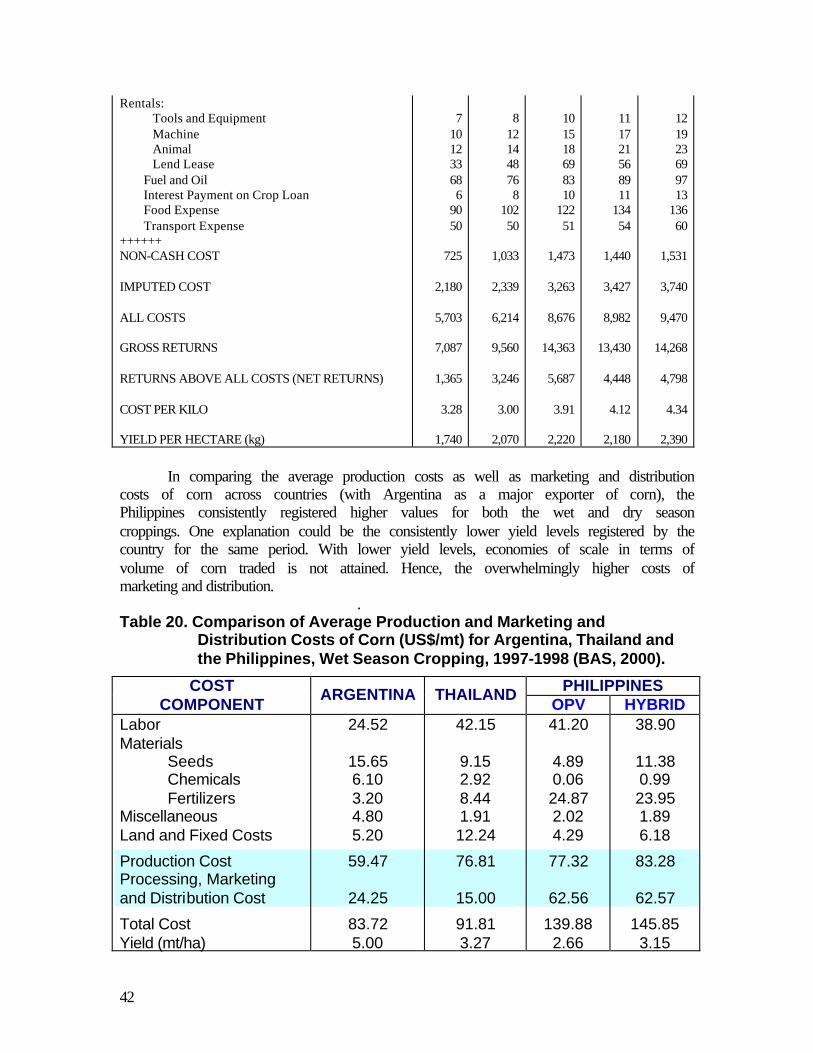
42
Rentals: Tools and Equipment Machine Animal Lend Lease Fuel and Oil Interest Payment on Crop Loan Food Expense Transport Expense ++++++ NON-CASH COST IMPUTED COST ALL COSTS GROSS RETURNS RETURNS ABOVE ALL COSTS (NET RETURNS) COST PER KILO YIELD PER HECTARE (kg)
7
10 12 33 68 6
90 50
725
2,180
5,703
7,087
1,365
3.28
1,740
8
12 14 48 76 8
102 50
1,033
2,339
6,214
9,560
3,246
3.00
2,070
10 15 18 69 83 10
122 51
1,473
3,263
8,676
14,363
5,687
3.91
2,220
11 17 21 56 89 11
134 54
1,440
3,427
8,982
13,430
4,448
4.12
2,180
12 19 23 69 97 13
136 60
1,531
3,740
9,470
14,268
4,798
4.34
2,390
In comparing the average production costs as well as marketing and distribution costs of corn across countries (with Argentina as a major exporter of corn), the Philippines consistently registered higher values for both the wet and dry season croppings. One explanation could be the consistently lower yield levels registered by the country for the same period. With lower yield levels, economies of scale in terms of volume of corn traded is not attained. Hence, the overwhelmingly higher costs of marketing and distribution.
. Table 20. Comparison of Average Production and Marketing and
Distribution Costs of Corn (US$/mt) for Argentina, Thailand and the Philippines, Wet Season Cropping, 1997-1998 (BAS, 2000).
COST PHILIPPINES COMPONENT
ARGENTINA THAILAND OPV HYBRID
Labor Materials Seeds Chemicals Fertilizers Miscellaneous Land and Fixed Costs Production Cost Processing, Marketing and Distribution Cost Total Cost Yield (mt/ha)
24.52
15.65 6.10 3.20 4.80 5.20 59.47
24.25 83.72 5.00
42.15
9.15 2.92 8.44 1.91 12.24 76.81
15.00 91.81 3.27
41.20
4.89 0.06 24.87 2.02 4.29 77.32
62.56
139.88 2.66
38.90
11.38 0.99 23.95 1.89 6.18 83.28
62.57
145.85 3.15
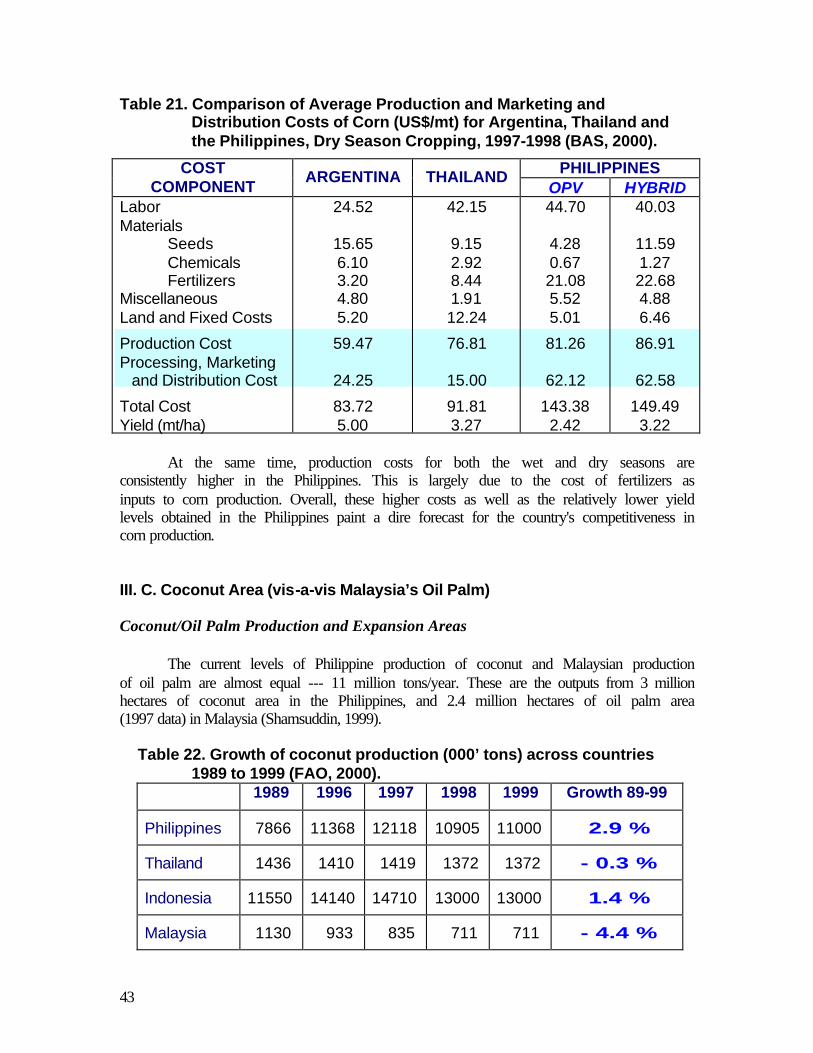
43
Table 21. Comparison of Average Production and Marketing and Distribution Costs of Corn (US$/mt) for Argentina, Thailand and the Philippines, Dry Season Cropping, 1997-1998 (BAS, 2000).
PHILIPPINES COST COMPONENT
ARGENTINA THAILAND OPV HYBRID
Labor Materials Seeds Chemicals Fertilizers Miscellaneous Land and Fixed Costs Production Cost Processing, Marketing
and Distribution Cost Total Cost Yield (mt/ha)
24.52
15.65 6.10 3.20 4.80 5.20 59.47
24.25 83.72 5.00
42.15
9.15 2.92 8.44 1.91 12.24 76.81
15.00 91.81 3.27
44.70
4.28 0.67 21.08 5.52 5.01 81.26
62.12
143.38 2.42
40.03
11.59 1.27 22.68 4.88 6.46 86.91
62.58
149.49 3.22
At the same time, production costs for both the wet and dry seasons are
consistently higher in the Philippines. This is largely due to the cost of fertilizers as inputs to corn production. Overall, these higher costs as well as the relatively lower yield levels obtained in the Philippines paint a dire forecast for the country's competitiveness in corn production. III. C. Coconut Area (vis-a-vis Malaysia’s Oil Palm) Coconut/Oil Palm Production and Expansion Areas The current levels of Philippine production of coconut and Malaysian production of oil palm are almost equal --- 11 million tons/year. These are the outputs from 3 million hectares of coconut area in the Philippines, and 2.4 million hectares of oil palm area (1997 data) in Malaysia (Shamsuddin, 1999).
Table 22. Growth of coconut production (000’ tons) across countries 1989 to 1999 (FAO, 2000).
1989 1996 1997 1998 1999 Growth 89-99
Philippines 7866 11368 12118 10905 11000 2.9 %
Thailand 1436 1410 1419 1372 1372 - 0.3 %
Indonesia 11550 14140 14710 13000 13000 1.4 %
Malaysia 1130 933 835 711 711 - 4.4 %
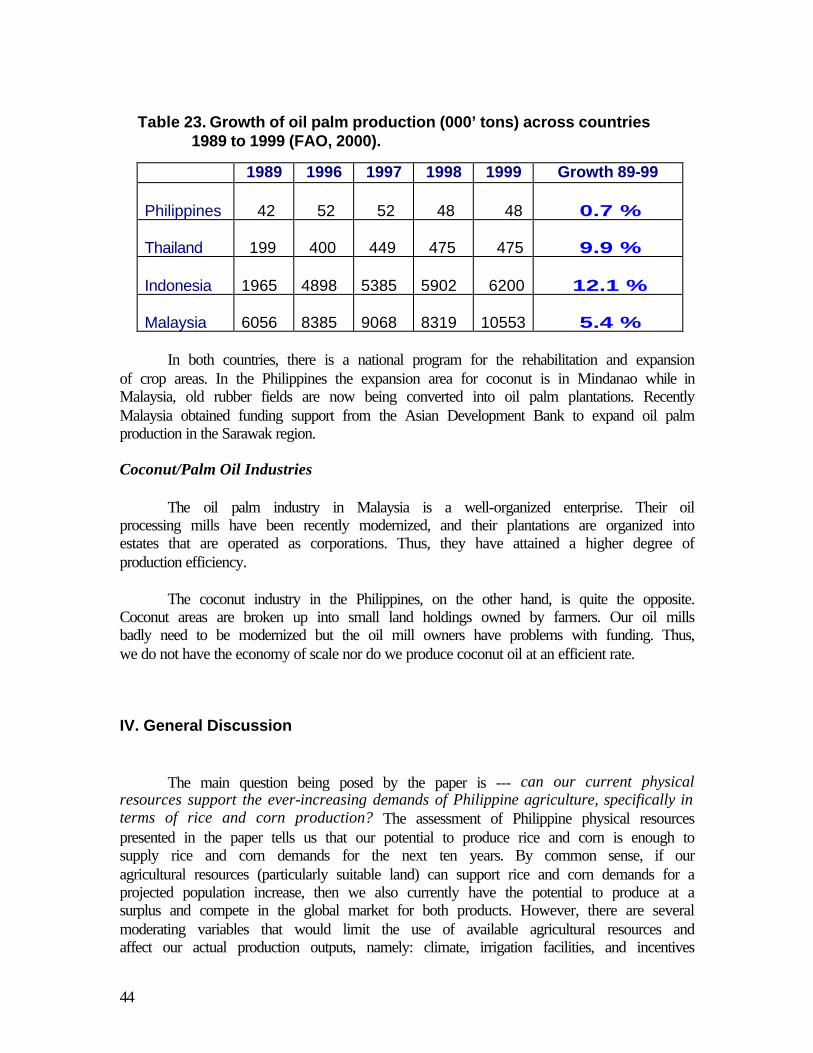
44
Table 23. Growth of oil palm production (000’ tons) across countries
1989 to 1999 (FAO, 2000).
1989 1996 1997 1998 1999 Growth 89-99 Philippines
42
52
52
48
48
0.7 %
Thailand
199
400
449
475
475
9.9 %
Indonesia
1965
4898
5385
5902
6200
12.1 %
Malaysia
6056
8385
9068
8319
10553
5.4 %
In both countries, there is a national program for the rehabilitation and expansion
of crop areas. In the Philippines the expansion area for coconut is in Mindanao while in Malaysia, old rubber fields are now being converted into oil palm plantations. Recently Malaysia obtained funding support from the Asian Development Bank to expand oil palm production in the Sarawak region. Coconut/Palm Oil Industries The oil palm industry in Malaysia is a well-organized enterprise. Their oil processing mills have been recently modernized, and their plantations are organized into estates that are operated as corporations. Thus, they have attained a higher degree of production efficiency.
The coconut industry in the Philippines, on the other hand, is quite the opposite. Coconut areas are broken up into small land holdings owned by farmers. Our oil mills badly need to be modernized but the oil mill owners have problems with funding. Thus, we do not have the economy of scale nor do we produce coconut oil at an efficient rate. IV. General Discussion
The main question being posed by the paper is --- can our current physical resources support the ever-increasing demands of Philippine agriculture, specifically in terms of rice and corn production? The assessment of Philippine physical resources presented in the paper tells us that our potential to produce rice and corn is enough to supply rice and corn demands for the next ten years. By common sense, if our agricultural resources (particularly suitable land) can support rice and corn demands for a projected population increase, then we also currently have the potential to produce at a surplus and compete in the global market for both products. However, there are several moderating variables that would limit the use of available agricultural resources and affect our actual production outputs, namely: climate, irrigation facilities, and incentives
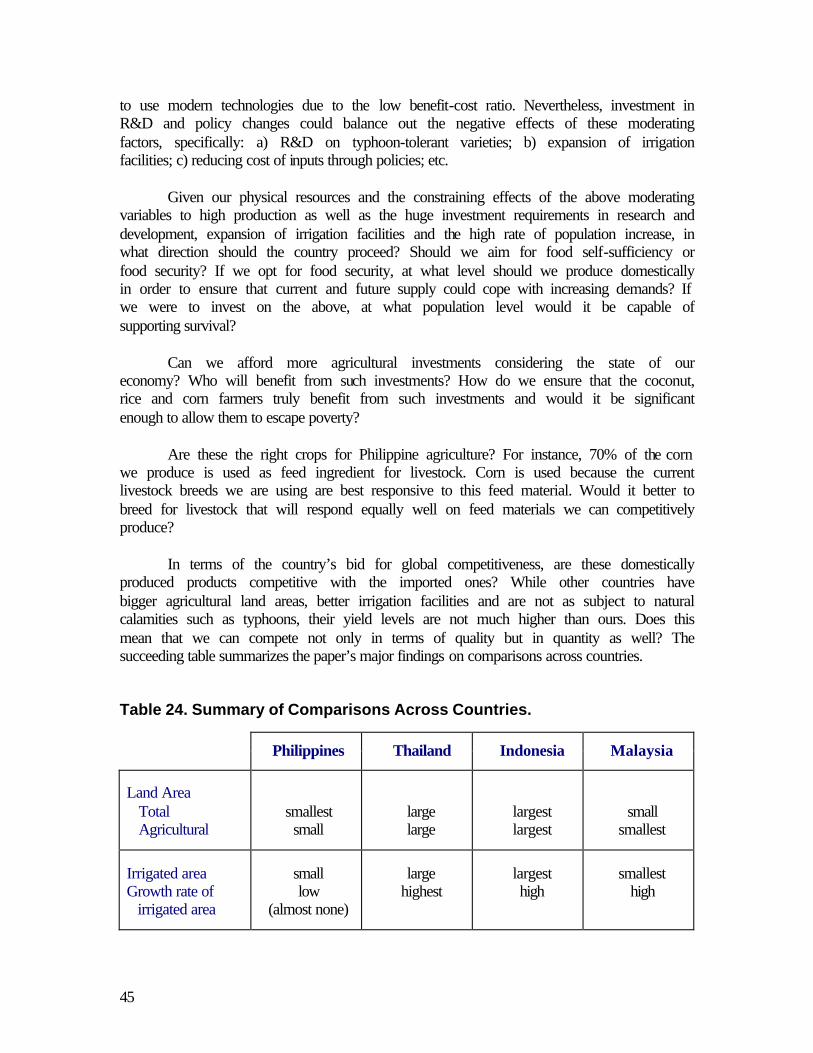
45
to use modern technologies due to the low benefit-cost ratio. Nevertheless, investment in R&D and policy changes could balance out the negative effects of these moderating factors, specifically: a) R&D on typhoon-tolerant varieties; b) expansion of irrigation facilities; c) reducing cost of inputs through policies; etc.
Given our physical resources and the constraining effects of the above moderating variables to high production as well as the huge investment requirements in research and development, expansion of irrigation facilities and the high rate of population increase, in what direction should the country proceed? Should we aim for food self-sufficiency or food security? If we opt for food security, at what level should we produce domestically in order to ensure that current and future supply could cope with increasing demands? If we were to invest on the above, at what population level would it be capable of supporting survival?
Can we afford more agricultural investments considering the state of our
economy? Who will benefit from such investments? How do we ensure that the coconut, rice and corn farmers truly benefit from such investments and would it be significant enough to allow them to escape poverty?
Are these the right crops for Philippine agriculture? For instance, 70% of the corn
we produce is used as feed ingredient for livestock. Corn is used because the current livestock breeds we are using are best responsive to this feed material. Would it better to breed for livestock that will respond equally well on feed materials we can competitively produce?
In terms of the country’s bid for global competitiveness, are these domestically
produced products competitive with the imported ones? While other countries have bigger agricultural land areas, better irrigation facilities and are not as subject to natural calamities such as typhoons, their yield levels are not much higher than ours. Does this mean that we can compete not only in terms of quality but in quantity as well? The succeeding table summarizes the paper’s major findings on comparisons across countries.
Table 24. Summary of Comparisons Across Countries.
Philippines Thailand Indonesia Malaysia
Land Area Total Agricultural
smallest small
large large
largest largest
small smallest
Irrigated area Growth rate of
irrigated area
small low
(almost none)
large highest
largest high
smallest high
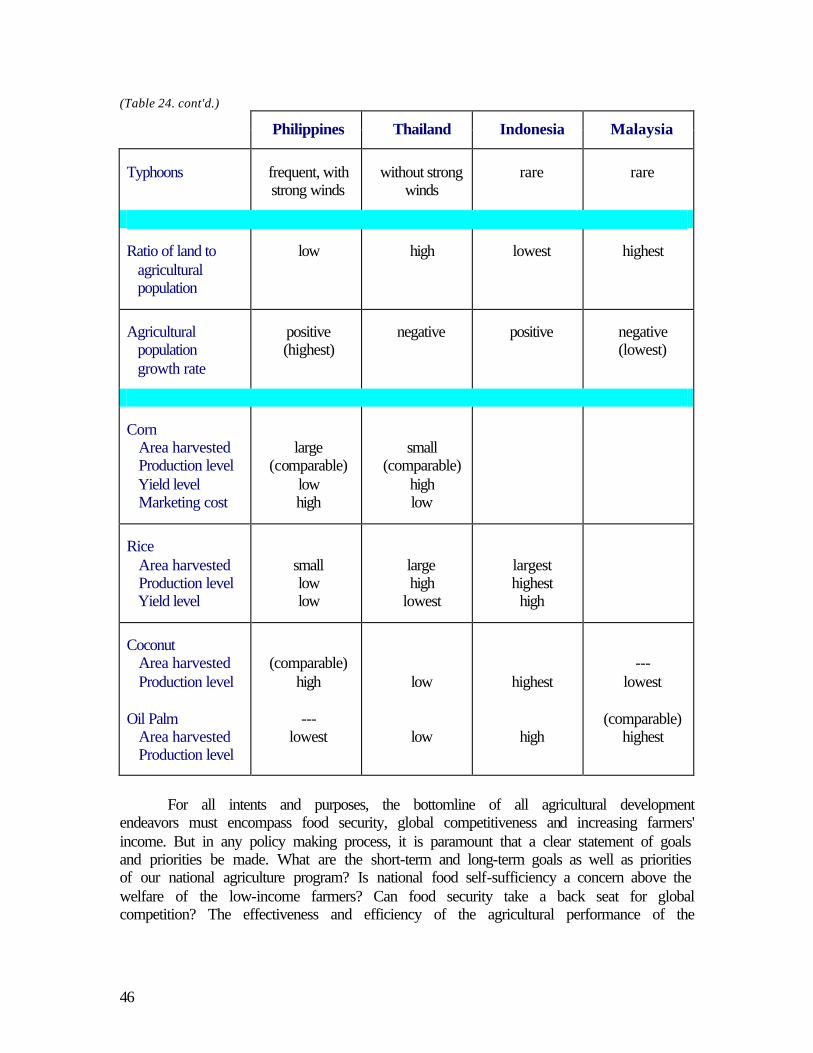
46
(Table 24. cont'd.)
Philippines Thailand Indonesia Malaysia
Typhoons
frequent, with strong winds
without strong winds
rare
rare
Ratio of land to agricultural population
low
high
lowest
highest
Agricultural population growth rate
positive (highest)
negative
positive
negative (lowest)
Corn Area harvested Production level Yield level Marketing cost
large
(comparable) low high
small
(comparable) high low
Rice Area harvested Production level Yield level
small low low
large high
lowest
largest highest high
Coconut Area harvested Production level Oil Palm Area harvested Production level
(comparable)
high
--- lowest
low
low
highest
high
---
lowest
(comparable) highest
For all intents and purposes, the bottomline of all agricultural development
endeavors must encompass food security, global competitiveness and increasing farmers' income. But in any policy making process, it is paramount that a clear statement of goals and priorities be made. What are the short-term and long-term goals as well as priorities of our national agriculture program? Is national food self-sufficiency a concern above the welfare of the low-income farmers? Can food security take a back seat for global competition? The effectiveness and efficiency of the agricultural performance of the
47
country given its physical resources thus have to be measured against these goals and priorities.
In approaching the above concerns, several points must be considered: First, in addressing our agricultural production requirements while competing
with our Asian neighbors (i.e. Thailand, Indonesia and Malaysia), major differences in terms of characteristics of the agricultural sector must be considered:
• Among the four countries, the Philippines is the smallest followed by Malaysia. In
terms of agricultural land, Malaysia registered the least area devoted to agriculture from 1989 to 1998, followed by the Philippines. However, the fact that Malaysia is bigger may explain its greater rate of agricultural land expansion compared to the Philippines. This implies that our approach to compete production-wise through the expansion agricultural areas can only help to a limited extent since Thailand, Indonesia and Malaysia have greater potentials for expansion.
• In terms of the ratio of land to agricultural population, our closest "competition" is
Indonesia, which registered the lowest ratios for 1989 and 1998. Both Thailand and Malaysia registered increasing ratios for the same period which may be attributed to the negative change in agricultural population within the ten-year period. This indicates that the country does not really need to advocate for the increased transfer of labor forces towards agriculture (ex. "Back-to-the-Province" projects for urban areas) but instead must diversify into other entrepreneurial activities.
• Our agricultural land is predominantly planted to rice, corn and coconut. In terms
of rice, our growth rates are comparable to those of our Asian neighbors. While the growth of our corn yield level is also comparable to Thailand and Indonesia, ours remain the lowest in terms of absolute yield/ha. On the other hand, the Philippines reported the highest growth rate of coconut production area. The latter however can be explained by the other countries' apparent interest in oil palm production, where the Philippines registered the lowest production area growth rate. All of the above provide the rationale for shifting towards the production of other crops instead of continuously seeking for the expansion of rice, corn or coconut production areas.
Second, it must be noted that the identified suitable land areas for agricultural production are more than enough to produce the country's food requirements. Thus, food security is not really an issue when we talk about available land. However, we do suffer from lower yield levels due to limitations imposed by weather conditions and inadequate irrigation systems. For example, it is generally the case that we are only able to profit from a single cropping per year since the second cropping is usually severely affected by typhoons or drought.
48
Third, there is little incentive for farmers to grow food crops because of the low return of investments. This can be attributed to small landholdings that result to very low net incomes from rice, corn or coconut. As net incomes from these crops are rarely enough for decent lifestyles, encouraging farmers to plant these crops would be tantamount to asking them to remain poor. Thus, while food security approaches may prescribe increased production of these crops, such may not be compatible with development goals of increasing farmers' incomes. Related to the last is the fact that farmers in the Philippines were found to derive substantial incomes from non-farm activities. Thus, it becomes doubly hard to encourage them to invest on necessary inputs (i.e. fertilizers) for increased agricultural production when they are able to obtain higher absolute incomes from non-farm opportunities. Any development initiative/policy must therefore be made within the context of these socio-economic concerns.
With these realities --- small landholdings, low return on investment, limitations imposed by weather patterns and inadequate irrigation facilities --- one option that could be employed for the rational use of agricultural resources is the diversification of cropping systems (Lozada et al., 1999). Diversification may include high value crops which could increase farm-level incomes. Other options could include shifting land use away from agriculture. Whatever the case, there is a great need to reconcile national food security policy with the country’s policies on poverty eradication.
Lastly, in all approaches to agricultural development, support services play an
important role. These support services (i.e., a more efficient marketing system which would bring down costs of distributing products) must be put in place in order to fully realize gains in agricultural resource utilization. This is highlighted by the cost of distribution of corn in the Philippines. In Thailand the cost is only US$ 15/mt, while in the Philippines it is US$62/mt. While the country’s relatively smaller landholdings contribute to the disparity in marketing and distribution costs, other factors include inefficiencies of marketing processes. Thus, there is an urgent need to transform our transportation and marketing system into an efficient and globally competitive system.
49
V. References Badayos, R.B. 1998. Multiple Cropping Potential of Major Lowland Rice Soils in
the Philippines. SEARCA Professorial Lecture, Department of Soil Science, UPLB-CA. Balce, R.G.; R.I. Villones and D.P. delos Angeles. 1994. An overview of flood
hazards in the Philippines. Proc. Nat. Conf. Natural Disaster Mitigation, 19-21 Oct 1994, Phil. Inst. Volcan. & Seism., DOST. 19-30 pp.
BAS, 1998. Selected Statistics on Agriculture. Department of Agriculture,
Diliman, Quezon City, Metro Manila. 29 p. BAS, 1999. Agricultural Foreign Trade Development, Annual Report.
Department of Agriculture, Diliman, Quezon City, Metro Manila. 136 p. BAS, 2000. Updated Production Costs and Returns for Selected Agricultural
Commodities. Part 1: Palay and Corn, 1997-1999. Department of Agriculture, Diliman, Quezon City, Metro Manila. 100 p.
BAS, 2000. Corn Statistics Handbook, 1980-1998. Department of Agriculture,
Diliman, Quezon City, Metro Manila.101 p. Bureau of Soils and Water Management, 1994. Soil Science and Agricultural
Technology in the Philippines. Seminar Proc., June 21, 1994, Department of Agriculture, Diliman, Quezon City, Metro Manila. 95 p.
Chapman, G.P. and K. M. Baker. 1992. The Changing Geography of Asia.
Biddles Ltd, Guilford and King’s Lynn, Great Britain. 265 p. Corpuz, O.D. 1997. Food Security and Rice: A Historical Background; A Road
to the Future. Public Policy (to be verified). Department of Soil Science, UPLBCA. 1989. Crop Suitability Evaluation for
Areas Currently Under Coconut in the Philippines. Final Report. College, Laguna. 13 p. FAO, 2000. Selected indicators of food and agriculture development in Asia-
Pacific, 1989-99. 206 p. Fernandez, N.C. and J.I. Clar de Jesus. 1980. Philippine Soils: Their Distribution,
General Land Use and Parent Materials. NFAC/UPLB-CA Country Action Program, College, Laguna.
Fernandez, N.C. 1998. Soil technology challenges in increasing rice production in
the Philippines. PSSST An. Symp. Proc. June 1998, BSWM-DA.
50
Fernandez, N.C. 1999. Wetland rice production potentials of selected Philippine river basin areas: A production planning framework. United Coconut Planters Bank Professorial Lecture, Department of Soils Science, UPLBCA.
Gonzales, B.E. 1994. Tropical Cyclones and Storm Surges. Proceedings National
Conference on Natural Disaster Mitigation, 19-21 Oct 1994, Philippine Institute of Volcanology & Seismology, DOST, pp. 11-18.
IRRI, 1998. IRRI Rice Facts. Los Banos, College, Laguna, Philippines. Lozada, E.P.; L.R.I. Velasco and E.A. Aguilar. 1999. Agricultural research needs
for the Philippines for the 21st century. Proc. Japan-Southeast Asian Agric. Res. Coop.: Past Accomplishments Future Needs, Kasertsart Univ., Bangkok, Thailand, 18-23 Nov. 1999.
Magat, S.S. 1999. Coconut-based farming systems: Technology Notes for
Practitioners. Diliman, Quezon City, Metro Manila: Philippine Coconut Authority, Department of Agriculture – ARDB. 97 p.
Monreal, M.E., Jr. and E.E. Victorio. 2001. Potential of coconut in the
Philippines. Paper submitted to Dr. Clar De Jesus in partial fulfillment of the course SOILS 260, Land Use and Environment, 2nd Sem. 2000-2001, UPLB.
Orno-Coladilla, J.L. and P.M. Rocamora. 2001. Land use evaluation of corn
production areas in the Philippines. Paper submitted to Dr. Clar De Jesus in partial fulfillment of the course SOILS 260, Land Use and Environment, 2nd Sem. 2000-2001, UPLB.
Philippine Coconut Authority. 2000. The Philippine National Program on
Coconut Research and Development, Department of Agriculture, Diliman, Quezon City, 44 p.
PCARRD, 1977. The Philippine Recommends for Rice. PCARRD, 1982. The Philippine Recommends for Irrigation Water Management.
Vol. 1 – Lowland Rice Conditions. Technical Bulletin Series No. 34. 119 p. PCARRD, 1983. The Philippine Recommends for Irrigation Water Management.
Vol. 2 – Upland Crops Conditions. Technical Bulletin Series No. 50. 87 p. PCARRD, 1991. The Philippine Recommends for Watershed Management.
Philippine Recommends Series No. 72. 88 p. PCARRD, 1999. The Philippine Recommends for Soil Fertility Management.
Philippine Recommends Series No. 36-C. 201 p.
51
PhilRice-BAS, 2000. Rice Statistics Handbook 1970-1997. Department of Agriculture, Diliman, Quezon City, Metro Manila, Philippines. 668 p.
Punongbayan, R.S. 1994. Natural hazards in the Philippines. Proceedings
National Conference on Natural Disaster Mitigation, 19-21 Oct 1994, Philippine Institute of Volcanology & Seismology, DOST. 1-10 pp.
Rondal, J.D. 1991. Productivity evaluation of Philippine soil resources for
lowlands rice. Unpublished PhD dissertation. UPLB. Shamsuddin, Z.H. 1999. Agricultural research needs for Malaysia for the 21st
century. Proc. Japan-Southeast Asian Agric. Res. Coop.: Past Accomplishments Future Needs, Kasertsart Univ., Bangkok, Thailand, 18-23 Nov. 1999.
United Coconut Association of the Philippines, Inc. 2000. Coconut Industry Kit,
Series of 1999. 2nd Floor, PCRDF Bldg., Pearl Drive cor. Lourdes St., Pasig City, Metro Manila, 49 p. Other sources:
http://www.solon.ifa.hawaii.edu http://www.ADB.org personal communication with Dr. J.I. Clar de Jesus, UPLBCA. 2001.